CEECAP report 4 section 1 POLAND
CEECAP report 4 section 1 POLAND
CEECAP report 4 section 1 POLAND

Create successful ePaper yourself
Turn your PDF publications into a flip-book with our unique Google optimized e-Paper software.
- CEEC AGRI POLICY -<br />
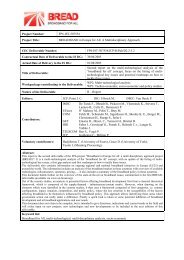
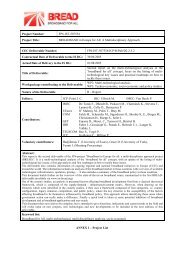
Project no.<br />
513705<br />
Project Acronym<br />
CEEC AGRI POLICY<br />
Project title<br />
Agro economic policy analysis of the new member states,<br />
the candidate states and the countries of the western Balkan<br />
Instrument Specific Support Action<br />
Thematic Priority Scientific Support to Policies<br />
D12-4 Fourth 6-monthly <strong>report</strong><br />
SITUATION AND PESPECTIVE FOR THE MEAT SECTOR<br />
IN <strong>POLAND</strong><br />
Start date of project: 01.05.2005 Duration: 24 Months<br />
Revision Final<br />
Project co-funded by the European Commission within the Sixth Framework Programme (2002-2006)<br />
Dissemination Level<br />
PU Public X<br />
PP Restricted to other programme participants (including the Commission<br />
RE Restricted to a group specified by the consortium (including the Commission<br />
CO<br />
Confidential, only for members of the consortium (including the Commission<br />
Services)<br />
Page 1 / 15
- CEEC AGRI POLICY -<br />
Acknowledgement<br />
This <strong>report</strong> forms part of the deliverables from a project called "CEEC AGRI POLICY" which<br />
has been awarded financial support by the European Commission under the 6th Framework<br />
Programme.<br />
The project aims to establish a network of experts involved in agricultural policy analysis and<br />
rural development in the New Member States, in the Acceding Candidate Countries and in the<br />
countries of the Western Balkans. More detailed information on the project can be found at<br />
www.agripolicy.net.<br />
Page 2 / 15
- CEEC AGRI POLICY -<br />
CONTENT<br />
1 Introduction to the meat sector ..................................................................................................... 4<br />
2 Structure of the sector and recent evolutions................................................................................ 5<br />
3 Policy and standards ..................................................................................................................... 8<br />
4 Market trends and perspective for meat consumption................................................................ 10<br />
5 Recent evolutions and perspectives for the trade....................................................................... 11<br />
6 Expert views on the successes and challenges of the sector....................................................... 14<br />
7 Conclusion.................................................................................................................................. 15<br />
Page 3 / 15
1 Introduction to the meat sector<br />
- CEEC AGRI POLICY -<br />
Between 2002 and 2005, the share of animal production in total agricultural output in<br />
Poland grew from 46% to 51%. In 2005, meat purchases accounted for 28.6% of the total<br />
expenditure on food products, up by 3.1 percentage points compared with 2003. Meat production<br />
per capita was approximately 90 kg and as a result of increased output of poultrymeat and<br />
pigmeat it went up by some 17 kg over ten years. The structure of meat production (per capita)<br />
was dominated by pork with some 64% share, followed by poultrymeat – some 22%, whereas the<br />
share of beef was about 9% and that of other types of meat – approximately 5%.<br />
Poland is characterised by surplus production of meat. The higher growth rate of meat<br />
production relative to consumption resulted in a rise in the self-sufficiency ratio from 104% in<br />
2000-2001 to 106% – 108% in 2002-2005. In terms of volume, the surplus in foreign trade in<br />
meat went up from 143,000 tonnes in 2002 to 368,000 tonnes in 2005.<br />
Poland’s accession to the EU stimulated concentration of meat production and<br />
processing. The number of farms engaged in pig farming declined from 760,500 in 2002 to<br />
701,600 in 2005 (down 58,900), whereas the number of agricultural holdings involved in cattle<br />
farming dropped by 151,700, from 935,200 to 783,500, including a fall from 875,400 to 730,300<br />
(down 145,100) in the case of dairy farms. In 2005, the proportion of farms engaged in pig<br />
farming was 25% of the total number of agricultural holdings, down 1% compared with 2002.<br />
At the same time, farms rearing cattle accounted for some 28%, down by some 5 % relative to<br />
2002.<br />
In the 1990s, the red meat processing sector included a large number of small<br />
slaughterhouses and local processing plants. Just before Poland’s accession to the EU there had<br />
been an increase in the number of medium-sized and large meat processing plants with more than<br />
50 employees – from 354 in 2002 to 830 in 2004, but then the trend changed and the numbers<br />
fell to 814 in 2005. In 1998, the Veterinary Inspection Service classified 1,260 meat processing<br />
plants as industrial enterprises, of which large companies with more than 249 employees<br />
accounted for 39% and medium-sized firms employing 50-249 persons for 34%. A great number<br />
of small businesses with 9 employees or less continue to operate in the meat processing sector.<br />
The concentration in the meat processing industry was stimulated by an increase in<br />
investment, from PLN 488 million in 2000 to PLN 1,551 million in 2004, and in the poultry<br />
industry – from PLN 78 million to PLN 253 million. In 2005, investment fell by 38% in the meat<br />
processing industry and by 16% in the poultry industry. In terms of the total investment in the<br />
food industry the proportion going to the meat industry rose from 11% to 23% and that of the<br />
poultry industry went up from 2% to 4%. The investment results were as follows:<br />
• The contribution of medium-sized and large companies to total sales of the food industry<br />
increased from some 20% in 2002 to circa 25% in 2005;<br />
• The share in sales of exports by the meat processing industry went up from approximately<br />
15% in 2003 to some 19% in 2005.<br />
These Investments were financed by SAPARD funds. The highest number of applications<br />
were submitted by specialist dairy cattle and specialist pig farms, whereas holdings engaged in<br />
beef cattle farming were the least interested. The SAPARD fund supported investment projects<br />
aimed at adapting agricultural holdings and meat processing plants to EU sanitary and veterinary<br />
standards, and at quality improvement and reduced environmental pollution. In future years, the<br />
main sources of financing for meat production and processing will be the EU structural funds and<br />
direct payments. The national budget continues to subsidise interest on investment credits in<br />
Page 4 / 15
- CEEC AGRI POLICY -<br />
agriculture and the agri-food industry, guarantees for investment credits, subsidies for farms<br />
engaged in organic production and subsidies on fuel oil.<br />
2 Structure of the sector and recent evolutions<br />
Prior to Poland’s accession to the EU, the state intervention regime only covered pigmeat<br />
producers. Agriculture’s share of national budget expenditure dropped below the level of its<br />
contribution to gross domestic product, i.e. 2.6% – 2.7%. Since May 2004, animal production in<br />
Poland has been subject to CAP regulations which require:<br />
• The discontinuation of intervention buying-in of pork.<br />
• The application of milk quotas granted to Poland.<br />
• Compliance with EU standards on the part of farms and meat processing plants.<br />
At the same time, Polish farmers were provided income support in the form of direct<br />
payments. In Poland the negotiated limits for direct payments for cattle and sheep are included in<br />
supplementary area payments, partly financed from the national budget and partly from the<br />
structural funds. They are paid per ha. of pasture. Until 2007, such payments were also available<br />
to farmers who owned no cattle or sheep but held grassland and pasture. Therefore, the animal<br />
production sector was much more affected by the “opening” of EU-25 outlets resulting in<br />
fluctuations in prices for cereals and animals for slaughter in the domestic market, as well as by<br />
adjustment measures taken before EU accession.<br />
Pigmeat<br />
In Poland the number of pigs was gradually declining – from 21.9 million in 1991 to 20.4<br />
million in 1995 and 18.7 million in 2005. At the same time slaughterings were increasing. By<br />
1995 they had risen by 1.8% compared to 1991, with further growth rates of 2.7% and 10.3% in<br />
2000 and 2005 respectively. The production of pigs for slaughter became more intensive.<br />
Livestock throughput rose from 102% in 1991 to 132-136% in 2004-2005. Meat yield per animal<br />
dropped from 88 kg in 2000 to 86 kg in 2005, because of lower slaughter weights, but it was then<br />
roughly the same as the average productivity of pigs in the EU-25.<br />
In terms of herd size, the share of those with 1-9 animals decreased from some 13.7% in<br />
1996 to 7.4% in 2005. However, relatively more pigs were farmed in herds of 50 to 499 animals<br />
as the share went up from 28% in 1995 to 61.6% in 2005. At the same time, herds of 500 or more<br />
animals accounted for 18.3%, roughly the same share as in 1995, and farms with such large herds<br />
numbered approximately 0.3% of the total agricultural holdings engaged in pig farming. The<br />
average herd size increased from 16.2 animals in 1996 to 24.6 animals in 2002 and 26.6 animals<br />
in 2005.<br />
As regards the supply of live pigs/pigs for slaughter, the share from farms with mediumsized<br />
and large herds is currently circa 80%. At the same time, approximately 13-14% of the<br />
output of pigs for slaughter in Poland is intended for on-farm consumption.<br />
After May 2004, pork production was significantly affected by the discontinuation of<br />
state intervention in this market and the adjustment of intervention buying-in of cereals to EU<br />
regulations. There was a fall in farmgate prices of pigs from PLN 4.21 per kg live weight in 2004<br />
to PLN 3.54 in 2005 and PLN 3.03 in 2006 (down 39% over three years). At the same time,<br />
prices for cereals fell relative to pig prices and pork production increased from 1,979,000 tonnes<br />
in 2004 to 2,163,000 tonnes in 2006.<br />
Page 5 / 15
Beef<br />
- CEEC AGRI POLICY -<br />
In 1991-2004, the number of bovine animals in Poland fell from 8.8 million to 5.3<br />
million, including a reduction in cow numbers from 4.6 million to 2.8 million. During the first<br />
year of Poland’s EU membership the downward trend was halted following a rise in the farmgate<br />
prices for cattle for slaughter. In 2005, the number of bovine animals was 5,483,000, up by<br />
130,000 on the 2004 figure. Cattle farming is usually aimed at dual-purpose production, which is<br />
reflected in the high proportion of cows in the total number of bovine animals, i.e. some 52%.<br />
Despite the fall in the number of agricultural holdings engaged in the rearing of cows, they are<br />
still found on some 93% of cattle farms. Between 2000 and 2005, cattle productivity (meat yield<br />
per animal) increased from 148 kg to 160 kg, still some 108 kg lower than the average in the EU-<br />
25.<br />
The proportion of cattle in herds with 1 to 9 animals went down from 60% in 1995 to<br />
52.3% in 2000 and 31.5% in 2005. At the same time, more cattle were farmed in herds of 20 to<br />
49 animals. Their share in cattle farming grew from 11.2 % in 1995 to 18% in 2002 and 32.8% in<br />
2005. Herds of 100 or more animals accounted for some 4% of the total number of bovine<br />
animals. As a consequence of the faster decline in the number of bovine animals than that of<br />
cattle farms, the average herd size went down from 19.2 animals in 1995 to 14.5 animals in 2005.<br />
The beef sector is characterised by a very strong link between export prices in EU-25 markets<br />
and cattle prices in Poland. Due to very low beef consumption in Poland, the domestic market<br />
has a marginal effect on the sector. Since Poland’s accession to the EU prices for live bovine<br />
animals have been gradually rising – from PLN 3.3 per kg live weight in 2004 to PLN 4.09 in<br />
2006 (24% over three years). Beef has become relatively more expensive and is no longer the<br />
cheapest type of meat.<br />
Meat processing industry<br />
The growing number of medium-sized and large meat processing plants and greater<br />
concentration of production have resulted in faster commercialisation of slaughter and meat<br />
processing.<br />
• Commercial slaughter of pigs increased from 975,600 tonnes in 2002 to 1,205,000 tonnes<br />
in 2005 and 1,430,000 tonnes in 2006 (estimate).<br />
• Commercial slaughter of cattle and calves went up from 135,400 tonnes in 2002 to<br />
175,200 tonnes in 2005 and 190,000 tonnes in 2006 (estimate). The share of commercial<br />
slaughter in the total slaughter of pigs and cattle rose from 40.6% to 55.2% as there are<br />
still a great number of small slaughterhouses.<br />
• As a result of growing demand, commercial production of smoked and cured meat<br />
increased, on average, from about 809,000 tonnes in 2002-2003 to 845,300 tonnes in<br />
2004-2006, whereas commercial output of other meat products went up from 110,000<br />
tonnes to 138,000 tonnes respectively.<br />
• Vertical integration is found mostly among the large meat processing plants wishing to<br />
build their supply base through contracts. Three capital groups account for some. 25% of<br />
the Polish meat processing market, namely Animex, Sokolów and the Duda concern,<br />
which has no foreign equity. Animex owns Poland’s strongest trademarks, i.e. Morlin and<br />
Krakus. The largest shareholder of Animex is Smithfield, whereas Danish Crown holds a<br />
stake in Sokolów. Both companies have developed their own distribution networks in<br />
other countries.<br />
Page 6 / 15
Poultrymeat sector<br />
- CEEC AGRI POLICY -<br />
In 2005-2006, the output of poultrymeat was 1,050,000 tonnes, nearly double the 2000<br />
figure. Chicken and turkey meats accounted for some 71-74% and 23-24% respectively. The<br />
share of goose and duck meat declined from approx. 4% to some 2%. Chicken meat production is<br />
mostly commercial accounting for circa 90% of the total output of chicken meat, whereas<br />
subsistence and semi-subsistence production represented some 10%, primarily intended for onfarm<br />
consumption (Table 1).<br />
Table 1. Production of live poultry/poultry for slaughter in Poland (thousand tonnes)<br />
Specification 2000 2003 2004 2005 2006*<br />
Commercial production: 1,030 1,123 1,203 1,310 1,440<br />
- chickens 735 835 890 970 1050<br />
- turkeys 247 255 278 303 350<br />
- ducks 7 5 5 5 6<br />
- geese 31 22 22 23 24<br />
- selected hens 10 6 8 9 10<br />
Subsistence and semisubsistence<br />
production<br />
104 105 105 140 100<br />
Total 1,134 1,228 1,308 1,450 1,540<br />
* Forecast by IERiGZ-PIB, September 2006<br />
Source: IERiGZ-PIB, KRD-IG.<br />
Poultry farming is concentrated on specialised holdings. Flocks of 10,000 livestock units<br />
contribute more than 90% of total poultry production. Therefore, the share of the total slaughter<br />
of poultry from commercial flocks was already high and further increased from 91% to 93.5%<br />
between 2001 and 2005.<br />
The poultrymeat sector is characterised by a high degree of vertical integration and the<br />
concentration of production. There were 546 plants processing poultrymeat, including 18 large<br />
companies with 250 or more employees, 63 medium-sized firms employing 50-249 persons, 170<br />
small businesses with 9-49 employees and the remaining 195 entities were micro-enterprises<br />
employing 9 or less persons. The largest companies accounted for more than 60% of the sales of<br />
the poultrymeat sector. The sector leaders include Indykpol, Exdrób, Rozdrób, Drobimex and<br />
Drosed.<br />
Page 7 / 15
3 Policy and standards<br />
- CEEC AGRI POLICY -<br />
Poland’s entry into the EU involved adjustments in animal production, aimed at ensuring<br />
food safety throughout the meat production chain plus the institution of adequate administrative<br />
structures.<br />
Animal identification<br />
The Animal Registration and Identification System in Poland is operated by the following<br />
institutions:<br />
1. Veterinary Inspection Service – responsible for the supervision of local units of the<br />
animal identification and registration system.<br />
2. Authorised employees of the Agency for Restructuring and Modernisation of Agriculture<br />
(ARiMR) and the General Veterinary Inspectorate (GIW) register and identify animals on<br />
farms. They are authorised by the district veterinary surgeon or the director of the<br />
regional unit of ARiMR.<br />
3. Certified suppliers of eartags conclude contracts with ARiMR and are obliged to deliver<br />
eartags according to approved specifications and delivery dates.<br />
4. Incineration and animal waste processing plants which are obliged to <strong>report</strong> the<br />
destruction of carcasses and return animal passports to the district ARiMR office within<br />
seven days.<br />
By-products of the slaughter of live bovine animals and sheep are classified as specified<br />
risk materials (SRM). The obligation to destroy carcasses as well as to register and identify<br />
animals stimulated the development of commercial slaughtering facilities.<br />
EUROPE<br />
In Poland the farmgate prices for animals for slaughter had been decoupled from quality<br />
for many years. Meat processing plants paid suppliers of pigs and beef cattle for live weight. In<br />
the pork sector, the EUROP classification system for slaughtered animals was first introduced in<br />
Poland in 1993 and resulted in improved carcass quality, including consideration of lean meat<br />
content. In 1993, the share of class E fattening pigs was 1.5%, whereas class O and P fatteners<br />
accounted for about 70%. In 2004, the share of class S and E fattening pigs reached 31.3%, but<br />
class O and P fatteners were down to 10.4%. There was a rise in lean meat content of slaughtered<br />
fattening pigs – from 43% in 1993 to 50.3% in 2000 and 55% in 2005.<br />
As regards the beef sector, the EUROP classification system for slaughtered animals was<br />
first introduced in the second half of the 1990s, on the basis of the Polish Norm PN-A-82001/A2.<br />
However, low beef prices in the domestic market, a fall in consumption and tariff quotas for beef<br />
exports to the EU discouraged the widespread use of this classification. The Community<br />
classification of carcasses of bovine animals is currently applicable, but price differentiation<br />
between specific quality classes is insufficient. As regards the commercial slaughter of bovine<br />
animals the share of cows was some 39% in 2005 and it increased to 42% in 2006. Among the<br />
cows slaughtered, class O accounted for some 54%, whereas class P animals amounted to<br />
approximately 32%. As for young bulls slaughtered, the share in classes E and U was 3.2%, class<br />
R animals accounted for 28.2% and the proportion in class O was 62.6%.<br />
Page 8 / 15
Licensing<br />
- CEEC AGRI POLICY -<br />
In Poland, as in other EU Member States, foreign trade with third countries is subject to<br />
licensing. The institution responsible for issuing import and export licences in Poland is the<br />
Agricultural Market Agency (Agencja Rynku Rolnego), which informs the European Commission<br />
of the amount of meat for which subsidies are requested. Licensing requires efficient information<br />
flow between ARR and customs offices and the veterinary inspections service. Due to the<br />
declining share of third countries in import and export trade, licensing plays a minor role.<br />
Hygiene and traceability<br />
The investment boom in the meat processing industry resulted in a rapid increase in the<br />
number of plants authorised to export to other EU Member States. From January 2004 to<br />
February 2006, the number of such companies went up:<br />
• In red meat processing industry – from 111 to 856,<br />
• In the poultrymeat sector – from 40 to 218.<br />
The Act relating to the quality of agri-food products laid down specific rules on product<br />
labelling and the powers of government administration relating to the registration of products for<br />
which a certification mark was being sought, as well as quality control.<br />
Poland adopted the EU legislation concerning the list of specified risk materials. They<br />
must be incinerated and a separate category of animal waste processing plants engaged in the<br />
incineration of SRM was established within the recycling industry.<br />
In the interest of protecting public health the, compulsory quality management systems – GHP,<br />
GMP, HACCP and voluntary norms ISO 9000:1994 and ISO 9000:2000 were adopted. The<br />
obligation to implement and apply GHP and GMP was introduced on the 20 th July 2000 and<br />
since 1st May 2004 the implementation and application of the HACCP system has been<br />
obligatory in all plants (previously only in large ones). Regulation (EC) No 853/2004 laying<br />
down specific hygiene rules for food of animal origin has been in force since 1st January 2006.<br />
The meat processing industry, was characterised by a high degree of implementation of the<br />
GMP, GHP and HACCP systems even prior to accession, as indeed were the fish and dairy<br />
industries.<br />
Page 9 / 15
- CEEC AGRI POLICY -<br />
4 Market trends and perspective for meat consumption<br />
Meat consumption in Poland is approximately 75 kg per capita, i.e. some 22 kg lower than the<br />
EU-15 average. A particularly significant gap exists in beef consumption which stands at some<br />
one-fifth of the EU-15 level; pigmeat consumption is also lower (by about 2 kg). By contrast,<br />
poultry consumption exceeded the EU-15 average by 1-2 kg over the last two years. Between<br />
1990 and 2006 poultry consumption grew from 7.6 to 24.5 kg per capita, while beef consumption<br />
dropped from 16.4 to 4 kg per capita. Pigmeat consumption ranged between some 37 and 42 kg<br />
per capita. Fluctuations in consumption were largely affected by the cyclical nature of pigmeat<br />
production (Table 2).<br />
Table 2. Meat consumption in Poland in 1990-2006 (kg per capita)<br />
Specification 1990 1995 2000 2006<br />
Meat, total 68.6 63.4 65.4 75.0<br />
of which: pigmeat 37.6 39.1 38.7 41.5<br />
beef 16.4 8.7 7.0 4.0<br />
poultry 7.6 10.2 14.5 24.0<br />
other 7.0 5.4 5.2 5.5<br />
Source: GUS data.<br />
As a result of reduced beef consumption and increased poultry consumption, the share of<br />
pork in meat consumption fell from 59-62% in the 1990s to, 54-56% in 2000-2005. The share of<br />
poultrymeat rose from 11-16% to 22-23% over the same period. Beef accounted for 5% of meat<br />
consumption and its share went down by 19 percentage points over 15 years.<br />
In the first year of Poland’s membership in the EU, rising meat prices accompanied by a<br />
cyclical decline in pigmeat production resulted in a fall in its consumption (from 72.1 kg in 2003<br />
to 71.8 kg in 2004). Meat prices increased relative to prices for substitute products: cheese, eggs<br />
and fish. Price relationships between specific types of meat changed as well. There was an<br />
increase in price competitiveness of poultry relative to red meat. During the two years following<br />
Poland’s accession to the EU, changed regulations in the pigmeat market pushed down prices and<br />
stimulated consumption. At the same time, beef remained more expensive than pork and poultry,<br />
which resulted in reduced consumption. In 2005-2006 meat consumption increased by some 4 kg<br />
per capita.<br />
However, overall the structure of meat consumption has remained virtually unchanged. In<br />
2000-2005, as in the 1990s, raw meat accounted for 56%-57% of meat consumption and<br />
processed meat products for 40-41%, including a very slow increase in the share of processed<br />
poultrymeat.<br />
Page 10 / 15
- CEEC AGRI POLICY -<br />
5 Recent evolutions and perspectives for the trade<br />
Between 2002 and 2006 export sales of beef, pigmeat and poultrymeat went up from €400<br />
million to €1.5 billion. The commodity mix of exports changed. There was an increase in the<br />
share of pigmeat from 25% in 2002 to 34% in 2006, while those of beef and poultry declined<br />
from 41% to 38% and from 33% to 27% respectively. During that period, the value of imports of<br />
the above-mentioned types of meat rose from approx. €124 million to some €433 million,<br />
primarily due to increased purchases of pigmeat. In 2006, foreign trade in beef, pigmeat and<br />
poultry generated a surplus of €1.1 billion, i.e. triple the 2002 figure.<br />
Since Poland’s accession to the European Union EU, Member States have played an<br />
increasingly important role in foreign trade in beef, and pig and poultry meats. In 2006, their<br />
share in Poland’s exports of beef, poultry and pigmeat were approximately 97%, 92% and 66%<br />
respectively, and it reached some 93% for exports of live bovine animals and calves. As regards<br />
imports of poultrymeat and pigmeat, the UE-25 share was some 99%.<br />
Table 3. Exports and imports of beef, pigmeat, poultrymeat, cattle and calves<br />
in 2002-2006 (€ million)<br />
Specification 2002 2003 2004 2005 2006 E<br />
Exports<br />
Beef 87.5 63.5 122.0 260.8 360.0<br />
of which: EU-25 34.5 31.9 106.4 235.5 350.0<br />
Live bovine animals and calves 99.1 95.8 146.6 194.0 211.0<br />
of which: EU-25 59.0 68.0 120.8 167.3 196.0<br />
Pigmeat 38.5 160.2 168.6 246.3 338.0<br />
of which: EU-25 9.0 31.9 71.0 146.7 223.0<br />
Poultrymeat 124.8 213.4 244.2 344.8 391.0<br />
Imports<br />
of which: EU-25 108.4 192.2 214.9 311.4 362.0<br />
Pigmeat 39.5 160.2 168.6 246.3 309.9<br />
of which: EU-25 5.9 31.9 71.0 145.8 290.0<br />
Poultrymeat 20.7 43.3 65.8 58.9 51.2<br />
of which: EU-25 18.3 0.0 52.4 54.2 45.5<br />
E = estimate<br />
Source: Own calculations based on CIHZ and MF data, Analizy Rynkowe: Handel zagraniczny<br />
produktami rolno-spozywczymi, no. 24/2006.<br />
The commodity composition of exports changed markedly. There was an increased share<br />
in the form of beef products, a rise in the share of quality chicken and turkey meat in deliveries<br />
of poultrymeat, and a significant decline in the share of frozen pig half-carcases in pigmeat sold<br />
abroad. The share of exports in pigmeat products went up from some 4% in 2002 to<br />
approximately 16% in 2006. Similarly, the figures for poultry products went from some 7% to<br />
Page 11 / 15
- CEEC AGRI POLICY -<br />
about 20%, and for beef from 39 % to 60%. Frozen beef from stocks was exported in 2002, and<br />
in 2003 after the exhaustion of fresh supplies. Export sales accounted for 30% of the domestic<br />
output of beef.<br />
Trade in beef<br />
Reduced beef consumption facilitated the growth in the share of production going into exports.<br />
Due to low domestic demand, interest in beef imports was marginal. The value of imports of<br />
bovine products rose from €1.4 million in 2002 to €21.6 million in 2006, which was largely the<br />
result of purchases of breeding cattle, whereas the value of exports went up from €172 million to<br />
€600 million, of which deliveries to the EU-25 increased from €93.5 million to €546 million. The<br />
increase in the surplus in trade in beef indicated above (€170.6 million to €578 million) was more<br />
than those applying to trade in pigmeat and poultry. Exports of beef jumped from 44,300 tonnes<br />
in 2003 to 153,000 tonnes in 2006, including an increase in deliveries to the EU-25 from 20,900<br />
to 145,000 tonnes. Exports of cattle and calves rose from 560,000 livestock units in 2003 to<br />
918,000 in 2004, but then they fell to 727,800 as herds were re-built at home. It may have<br />
reached 755,000 livestock units in 2006. Export sales of cattle and calves to the EU-25 then<br />
ranged from 397,500 to 803,100 livestock units. Between 2003 and 2006, the share of live<br />
animals in exports of bovine products declined from some 57% to approx. 37%, whilst the share<br />
of beef rose.<br />
Trade in pork<br />
There was a rise in exports of pigmeat which was excluded from subsidies from May<br />
2004. Between 2004 and 2006 these exports went up from 146,600 to 215,000 tonnes. In 2006,<br />
they were some 15,000 tonnes higher compared to 2003 when pigmeat from the stocks of the<br />
Agricultural Market Agency was exported, primarily to CIS countries, at very low prices.<br />
Following Poland’s accession to the European Union, CIS countries became less<br />
important as outlets for Polish pork, being replaced by the new EU Member States. Export sales<br />
of pigmeat to the EU-10 increased from 16,500 tonnes in 2003 to some 80,000 tonnes in 2006,<br />
while deliveries to the EU-15 went up from 10,700 tonnes to approx. 60,000 tonnes. Changes in<br />
the geographical structure of the EU had an effect on export prices. The export price for pigmeat<br />
rose from €0.80 per kg in 2003 to €1.54 per kg in 2006. Along with higher prices, this led to the<br />
increase in revenues from pigmeat exports from €160.2 million to some €338 million (Table 3).<br />
Between 2003 and 2006, exports of processed pork, in terms of weight, went up from<br />
about 22,000 to some 45,000 tonnes, of which deliveries to the EU-25 rose from approximately<br />
7,000 to some 28,000 tonnes. In 2006, exports of pigmeat products amounted to some €116<br />
million, of which deliveries to the EU-25 were approximately €84 million, i.e. four times as high<br />
as in 2003. Exports of sausages to EU Member States went up from 1,200 tonnes in 2003 to<br />
16,600 tonnes in 2006, whereas deliveries of preserved pigmeat increased from 500 to 8,400<br />
tonnes. The EU share in such exports was circa 83%.<br />
Meat accounted for 91%-92% of imports of pig products. After Poland’s accession to the<br />
EU, there was a rise in purchases. In 2002-2003, imports of pigmeat reached an annual average<br />
of 45,500 tonnes. Between 2004 and 2006 they grew from 99,100 to some 155,000 tonnes. In<br />
2006, major suppliers included Denmark (46%), Germany (23%) and the Netherlands (5%).<br />
Page 12 / 15
Trade in poultrymeat<br />
- CEEC AGRI POLICY -<br />
Between 2003 and 2006, exports of poultrymeat went up from 100,700 to some 190,000<br />
tonnes, with deliveries to the EU-25 increasing from 65,500 to some 152,000 tonnes. In 2006,<br />
revenues from export sales of poultrymeat amounted to about €391 million, an increase of some<br />
80% compared with 2003. The value of poultry exports to the EU-25 nearly doubled. Between<br />
2003 and 2006, poultrymeat accounted for 40 – 68% of the value of imports of poultry products.<br />
Poland imported poultrymeat for processing from the EU at import prices which ranged from<br />
€0.77 to €0.85 per kg. Imports of poultry from the EU-25 largely comprised of purchases of live<br />
birds. Between 2003 and 2006, their value rose from €17 million to around €44 million.<br />
Page 13 / 15
- CEEC AGRI POLICY -<br />
6 Expert views on the successes and challenges of the sector<br />
Poland’s accession to the European Union contributed to very favourable and rapid changes in<br />
meat production and processing. Those include the following:<br />
• Faster changes in the structure of entities operating in the meat processing industry;<br />
greater concentration of slaughterhouses and meat production holdings; the formation of<br />
new structures of commercial production in compliance with world standards, which<br />
would have been impossible without EU financial resources,<br />
• Opportunities to engage in trade with other EU Member States, resulting in a major<br />
increase in exports of animal products. It was particularly significant for meat processing<br />
plants in the first years of Poland’s membership when the domestic market suffered a fall<br />
in demand for meat. In 2005-2006, the import ban imposed by Russia on Polish meat<br />
would have been a demand and supply disaster without the opportunity to switch to EU<br />
outlets.<br />
• Linking the price to the quality of animals for slaughter,<br />
• Eligibility for export subsidies for deliveries to third countries, only available to Polish<br />
traders after EU accession.<br />
The barriers to efficient functioning of organisational structures and the full use of the<br />
production capacity of the meat processing industry are as follows:<br />
• Poland experienced much faster concentration of meat processing than of meat<br />
production. As a consequence, there are problems with regular deliveries of quality raw<br />
material for the processors.<br />
• Slow changes in concentration of farm production present a major barrier to the<br />
development of vertical integration in the meat production sector. In the producer –<br />
processor relationship, the meat processing industry has much greater bargaining power.<br />
Among the producers of animals for slaughter, the formation of r groups has been very<br />
slow. Most contracts are in favour of meat processing plants and contain no price<br />
guarantees for producers. This results in continuing significant fluctuations in supplies of<br />
animals for slaughter.<br />
• A large number of small firms engaged in slaughter and meat processing are unable to<br />
comply with sanitary and commercial standards or to operate the carcass classification<br />
scheme due to the high costs of implementation. Although small slaughterhouses are not<br />
obliged to apply the EUROP classification, their operations impede the improvement of<br />
meat quality. This is particularly evident in the beef sector.<br />
Page 14 / 15
7 Conclusion<br />
- CEEC AGRI POLICY -<br />
During the next few years, trade in meat will continue to be dominated by EU Member<br />
States. This should sustain favourable trading conditions due to a gradual reduction in export<br />
subsidies for meat and processed meat products, non-tariff barriers being introduced by many<br />
countries, including Russia, as well as significant differences within the EU-25 in selfsufficiency<br />
in terms of meat production and consumption. Further expansion of Polish exports of<br />
animals for slaughter as well as of meat and meat products to the EU-25 countries will largely<br />
depend on structural changes among agricultural holdings and the development of vertical<br />
integration in the meat processing industry. Only then will it be possible to maintain the quality<br />
of meat supplied to the industry and ensure that the products on offer meet the requirements of<br />
foreign customers. At the same time, the meat processing industry needs to invest in the<br />
promotion of Polish meat and in quality trademarks so that it becomes readily identifiable in<br />
foreign markets.<br />
Over the next few years meat consumption should show a slight upward trend, primarily<br />
due to increased consumption of beef and poultrymeat. However, growth in the consumption of<br />
beef will be inhibited by the low level of incomes of Poland’s population. At the same time, there<br />
is on-going segmentation of the domestic market. But an increase in demand by middle and<br />
wealthy social classes will only be realised if quality products are offered. This suggests that<br />
changes in the structure of meat consumption will be limited.<br />
At present, it is difficult to forecast the scale of change in meat production in future years<br />
or to assess the competitiveness of Polish products compared to those offered by other EU-25<br />
countries. The direct payment scheme functioning in the EU-25 will have a major differential<br />
effect on the incomes of the various types of agricultural holdings. Direct payments are made by<br />
Member States under the SPS scheme, the SPS with cattle and sheep premiums and under the<br />
SAPS scheme, including its various options.<br />
Page 15 / 15