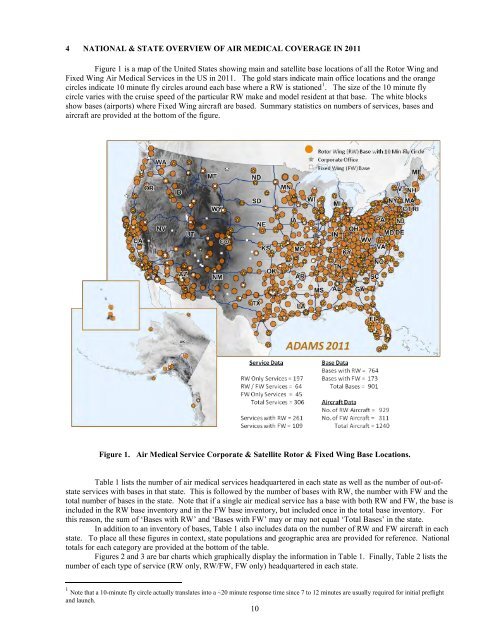
4 NATIONAL & STATE OVERVIEW OF AIR MEDICAL COVERAGE IN 2011 Figure 1 is a map <strong>of</strong> the United States showing main <strong>and</strong> satellite base locations <strong>of</strong> all the Rotor Wing <strong>and</strong> Fixed Wing <strong>Air</strong> <strong>Medical</strong> <strong>Services</strong> in the US in 2011. The gold stars indicate main <strong>of</strong>fice locations <strong>and</strong> the orange circles indicate 10 minute fly circles around each base where a RW is stationed 1 . The size <strong>of</strong> the 10 minute fly circle varies with the cruise speed <strong>of</strong> the particular RW make <strong>and</strong> model resident at that base. The white blocks show bases (airports) where Fixed Wing aircraft are based. Summary statistics on numbers <strong>of</strong> services, bases <strong>and</strong> aircraft are provided at the bottom <strong>of</strong> the figure. Figure 1. <strong>Air</strong> <strong>Medical</strong> Service Corporate & Satellite Rotor & Fixed Wing Base Locations. Table 1 lists the number <strong>of</strong> air medical services headquartered in each state as well as the number <strong>of</strong> out-<strong>of</strong>state services with bases in that state. This is followed by the number <strong>of</strong> bases with RW, the number with FW <strong>and</strong> the total number <strong>of</strong> bases in the state. Note that if a single air medical service has a base with both RW <strong>and</strong> FW, the base is included in the RW base inventory <strong>and</strong> in the FW base inventory, but included once in the total base inventory. For this reason, the sum <strong>of</strong> ‘Bases with RW’ <strong>and</strong> ‘Bases with FW’ may or may not equal ‘Total Bases’ in the state. In addition to an inventory <strong>of</strong> bases, Table 1 also includes data on the number <strong>of</strong> RW <strong>and</strong> FW aircraft in each state. To place all these figures in context, state populations <strong>and</strong> geographic area are provided for reference. National totals for each category are provided at the bottom <strong>of</strong> the table. Figures 2 <strong>and</strong> 3 are bar charts which graphically display the information in Table 1. Finally, Table 2 lists the number <strong>of</strong> each type <strong>of</strong> service (RW only, RW/FW, FW only) headquartered in each state. 1 Note that a 10-minute fly circle actually translates into a ~20 minute response time since 7 to 12 minutes are usually required for initial preflight <strong>and</strong> launch. 10
Table 1. 2011 State Summary <strong>of</strong> <strong>Air</strong> <strong>Medical</strong> RW & FW <strong>Services</strong>, Bases & <strong>Air</strong>craft Currently in <strong>ADAMS</strong>. State <strong>Services</strong> Headqrtd in State Out <strong>of</strong> State <strong>Services</strong> w/Bases in State Bases with RW Bases with FW Total Bases (a) 11 RW <strong>Air</strong>craft (b)(c) FW <strong>Air</strong>craft (b)(c) Total <strong>Air</strong>craft (b) State Population (Y2000) Total State Area (Sq Mi) (d) Alabama 4 2 14 2 16 16 3 19 4,779,736 52,423 Alaska 13 1 10 21 27 34 36 70 710,231 656,425 Arizona 9 3 51 15 62 59 20 79 6,392,017 114,006 Arkansas 4 2 13 2 15 13 7 20 2,915,918 53,182 California 32 2 65 13 74 101 23 124 37,253,956 163,707 Colorado 6 2 17 6 22 15 13 28 5,029,196 104,100 Connecticut 1 0 2 0 2 2 0 2 3,574,097 5,544 D.C. 2 1 2 0 2 4 0 4 601,723 68 Delaware 2 0 4 0 4 6 0 6 897,934 2,489 Florida 29 1 35 8 43 44 27 71 18,801,310 65,758 Georgia 8 3 23 4 27 26 19 45 9,687,653 59,441 Hawaii 3 1 3 7 10 3 8 11 1,360,301 10,932 Idaho 2 1 9 4 11 10 4 14 1,567,582 83,574 Illinois 11 4 19 3 22 24 6 30 12,830,632 57,918 Indiana 6 2 18 2 20 19 2 21 6,483,802 36,420 Iowa 6 4 11 2 13 11 4 15 3,046,355 56,276 Kansas 4 0 9 7 15 12 8 20 2,853,118 82,282 Kentucky 2 3 27 1 27 28 1 29 4,339,367 40,411 Louisiana 3 1 10 1 10 14 5 19 4,533,372 51,843 Maine 1 0 3 0 3 2 0 2 1,328,361 35,387 Maryl<strong>and</strong> 2 3 13 1 13 18 2 20 5,773,552 12,407 Massachusetts 2 0 3 1 3 4 1 5 6,547,629 10,555 Michigan 7 2 11 4 14 12 15 27 9,883,640 96,810 Minnesota 3 1 11 3 13 18 4 22 5,303,925 86,943 Mississippi 3 3 10 0 10 10 0 10 2,967,297 48,434 Missouri 8 3 31 3 33 31 3 34 5,988,927 69,709 Montana 7 0 5 5 10 5 7 12 989,415 147,046 Nebraska 3 2 6 1 7 6 1 7 1,826,341 77,358 Nevada 3 2 6 6 12 7 9 16 2,700,551 110,567 New Hampshire 1 0 2 0 2 3 0 3 1,316,470 9,351 New Jersey 4 1 7 0 7 10 0 10 8,791,894 8,722 New Mexico 4 4 11 7 16 11 13 24 2,059,179 121,593 New York 11 0 20 2 20 33 3 36 19,378,102 54,475 North Carolina 10 0 17 2 18 21 4 25 9,535,483 53,821 North Dakota 3 0 4 1 5 4 1 5 672,591 70,704 Ohio 9 3 36 1 37 40 2 42 11,536,504 44,828 Oklahoma 3 2 19 2 21 19 6 25 3,751,351 69,903 Oregon 5 1 7 6 12 7 11 18 3,831,074 98,386 Pennsylvania 10 0 39 0 39 48 0 48 12,702,379 46,058 Rhode Isl<strong>and</strong> 0 0 0 0 0 0 0 0 1,052,567 1,545 South Carolina 6 2 9 2 11 10 3 13 4,625,364 32,007 South Dakota 4 0 4 3 6 4 4 8 814,180 77,121 Tennessee 5 1 25 1 26 28 1 29 6,346,105 42,146 Texas 22 3 68 13 78 72 19 91 25,145,561 268,601 Utah 3 1 9 3 12 10 4 14 2,763,885 84,904 Vermont 0 0 0 0 0 0 0 0 625,741 9,615 Virginia 8 1 16 0 16 20 0 20 8,001,024 42,769 Washington 2 1 8 4 9 10 8 18 6,724,540 71,303 West Virginia 1 1 10 0 10 11 0 11 1,852,994 24,231 Wisconsin 8 2 11 2 13 13 2 15 5,686,986 65,503 Wyoming 1 1 1 2 3 1 2 3 563,626 97,818 Totals 306 73 764 173 901 929 311 1240 308,745,538 3,787,419 a) If a single air medical service has a base with both RW <strong>and</strong> FW, the base is included in RW base inventory <strong>and</strong> in FW base inventory but included once in Total Bases. Therefore, sum <strong>of</strong> ‘Bases with RW’ <strong>and</strong> ‘Bases with FW’ may or may not equal ‘Total Bases’ in State. b) State RW/ FW totals for Alaska <strong>and</strong> North Carolina include aircraft from selected military units which are routinely used in civilian rescue. Alaska: 17 RW & 8 FW from <strong>Air</strong> National Guard <strong>and</strong> Coast Guard; North Carolina: 3 RW from Marine Corps <strong>Air</strong> Station. c) Throughout fleet, 50 RW <strong>and</strong> 5 FW are listed as SPARES. d) State total area (l<strong>and</strong> & water) from http://www.netstate.com which references World Almanac <strong>of</strong> the USA by A.Carpenter <strong>and</strong> C.Provorse, 1996.