Atlas and Database of Air Medical Services (ADAMS) - Helicopter ...
Atlas and Database of Air Medical Services (ADAMS) - Helicopter ...
Atlas and Database of Air Medical Services (ADAMS) - Helicopter ...

You also want an ePaper? Increase the reach of your titles
YUMPU automatically turns print PDFs into web optimized ePapers that Google loves.
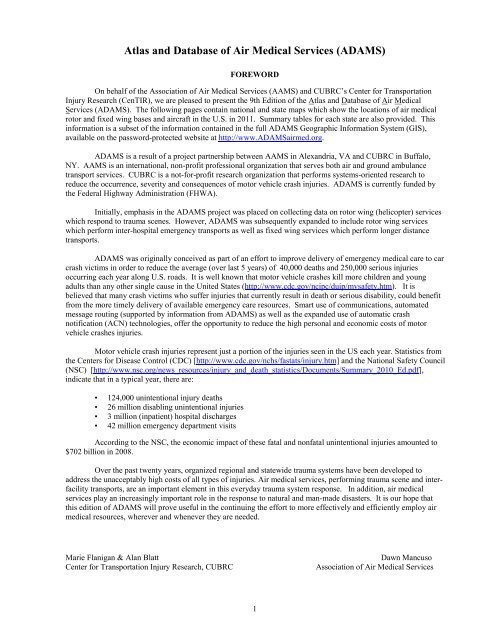
<strong>Atlas</strong> <strong>and</strong> <strong>Database</strong> <strong>of</strong> <strong>Air</strong> <strong>Medical</strong> <strong>Services</strong> (<strong>ADAMS</strong>)<br />
FOREWORD<br />
On behalf <strong>of</strong> the Association <strong>of</strong> <strong>Air</strong> <strong>Medical</strong> <strong>Services</strong> (AAMS) <strong>and</strong> CUBRC’s Center for Transportation<br />
Injury Research (CenTIR), we are pleased to present the 9th Edition <strong>of</strong> the <strong>Atlas</strong> <strong>and</strong> <strong>Database</strong> <strong>of</strong> <strong>Air</strong> <strong>Medical</strong><br />
<strong>Services</strong> (<strong>ADAMS</strong>). The following pages contain national <strong>and</strong> state maps which show the locations <strong>of</strong> air medical<br />
rotor <strong>and</strong> fixed wing bases <strong>and</strong> aircraft in the U.S. in 2011. Summary tables for each state are also provided. This<br />
information is a subset <strong>of</strong> the information contained in the full <strong>ADAMS</strong> Geographic Information System (GIS),<br />
available on the password-protected website at http://www.<strong>ADAMS</strong>airmed.org.<br />
<strong>ADAMS</strong> is a result <strong>of</strong> a project partnership between AAMS in Alex<strong>and</strong>ria, VA <strong>and</strong> CUBRC in Buffalo,<br />
NY. AAMS is an international, non-pr<strong>of</strong>it pr<strong>of</strong>essional organization that serves both air <strong>and</strong> ground ambulance<br />
transport services. CUBRC is a not-for-pr<strong>of</strong>it research organization that performs systems-oriented research to<br />
reduce the occurrence, severity <strong>and</strong> consequences <strong>of</strong> motor vehicle crash injuries. <strong>ADAMS</strong> is currently funded by<br />
the Federal Highway Administration (FHWA).<br />
Initially, emphasis in the <strong>ADAMS</strong> project was placed on collecting data on rotor wing (helicopter) services<br />
which respond to trauma scenes. However, <strong>ADAMS</strong> was subsequently exp<strong>and</strong>ed to include rotor wing services<br />
which perform inter-hospital emergency transports as well as fixed wing services which perform longer distance<br />
transports.<br />
<strong>ADAMS</strong> was originally conceived as part <strong>of</strong> an effort to improve delivery <strong>of</strong> emergency medical care to car<br />
crash victims in order to reduce the average (over last 5 years) <strong>of</strong> 40,000 deaths <strong>and</strong> 250,000 serious injuries<br />
occurring each year along U.S. roads. It is well known that motor vehicle crashes kill more children <strong>and</strong> young<br />
adults than any other single cause in the United States (http://www.cdc.gov/ncipc/duip/mvsafety.htm). It is<br />
believed that many crash victims who suffer injuries that currently result in death or serious disability, could benefit<br />
from the more timely delivery <strong>of</strong> available emergency care resources. Smart use <strong>of</strong> communications, automated<br />
message routing (supported by information from <strong>ADAMS</strong>) as well as the exp<strong>and</strong>ed use <strong>of</strong> automatic crash<br />
notification (ACN) technologies, <strong>of</strong>fer the opportunity to reduce the high personal <strong>and</strong> economic costs <strong>of</strong> motor<br />
vehicle crashes injuries.<br />
Motor vehicle crash injuries represent just a portion <strong>of</strong> the injuries seen in the US each year. Statistics from<br />
the Centers for Disease Control (CDC) [http://www.cdc.gov/nchs/fastats/injury.htm] <strong>and</strong> the National Safety Council<br />
(NSC) [http://www.nsc.org/news_resources/injury_<strong>and</strong>_death_statistics/Documents/Summary_2010_Ed.pdf],<br />
indicate that in a typical year, there are:<br />
• 124,000 unintentional injury deaths<br />
• 26 million disabling unintentional injuries<br />
• 3 million (inpatient) hospital discharges<br />
• 42 million emergency department visits<br />
According to the NSC, the economic impact <strong>of</strong> these fatal <strong>and</strong> nonfatal unintentional injuries amounted to<br />
$702 billion in 2008.<br />
Over the past twenty years, organized regional <strong>and</strong> statewide trauma systems have been developed to<br />
address the unacceptably high costs <strong>of</strong> all types <strong>of</strong> injuries. <strong>Air</strong> medical services, performing trauma scene <strong>and</strong> interfacility<br />
transports, are an important element in this everyday trauma system response. In addition, air medical<br />
services play an increasingly important role in the response to natural <strong>and</strong> man-made disasters. It is our hope that<br />
this edition <strong>of</strong> <strong>ADAMS</strong> will prove useful in the continuing the effort to more effectively <strong>and</strong> efficiently employ air<br />
medical resources, wherever <strong>and</strong> whenever they are needed.<br />
Marie Flanigan & Alan Blatt Dawn Mancuso<br />
Center for Transportation Injury Research, CUBRC Association <strong>of</strong> <strong>Air</strong> <strong>Medical</strong> <strong>Services</strong><br />
1
This page intentionally left blank<br />
2
PREFACE<br />
<strong>Air</strong> medical rotor wing services are <strong>of</strong>ten called to the scene <strong>of</strong> serious motor vehicle crashes. Such crashes<br />
are the cause <strong>of</strong> about 40,000 deaths, 500,000 hospitalizations <strong>and</strong> more than 250,000 serious injuries per year in<br />
this country. With the growing availability <strong>of</strong> automatic crash notification (ACN) technology, there may soon be<br />
new opportunities to reduce crash-related deaths <strong>and</strong> injuries, especially in rural areas. To maximize the benefits <strong>of</strong><br />
this technology however, ACN crash alert messages must be automatically routed to the appropriate 911 center<br />
within minutes <strong>of</strong> a crash. Although actual dispatch decisions would still remain local, providing an additional alert<br />
to both the air medical service <strong>and</strong> receiving hospital in the crash vicinity, could enable preparations at these<br />
locations to begin earlier <strong>and</strong> could well shorten the timeline for getting crash victims to definitive care.<br />
Implementation <strong>of</strong> this automatic ACN message routing to air medical services requires a national geographic<br />
database containing the exact locations <strong>of</strong> all air medical Rotor Wing bases which support scene response <strong>and</strong><br />
emergency inter-hospital transport. In anticipation <strong>of</strong> this need, USDOT has supported the development <strong>of</strong> <strong>ADAMS</strong><br />
to provide this critical element in the public safety / emergency message <strong>and</strong> data routing infrastructure.<br />
3
This page intentionally left blank<br />
4
ACKNOWLEDGEMENTS<br />
This <strong>Atlas</strong> could not have been compiled without the support <strong>of</strong> Dr. Kunik Lee from FHWA, the<br />
knowledgeable assistance <strong>of</strong> Dawn Mancuso <strong>and</strong> her staff at AAMS <strong>and</strong> the interest <strong>and</strong> cooperation <strong>of</strong> the air<br />
medical services whose many members provided inputs. We further thank the Federal Highway Administration<br />
(FHWA) for its generous financial support.<br />
Special acknowledgement this year goes to the <strong>ADAMS</strong> technical team, in particular Maile Miller, Kevin<br />
Majka, Rachel Case <strong>and</strong> Nicole Ganger from CUBRC, <strong>and</strong> Dale Wiles from General Dynamics Advanced<br />
Information Systems. From a historical perspective, we also acknowledge Mr. Louis V. Lombardo (National<br />
Highway Traffic Safety Administration (NHTSA, retired) who provided the original vision for this project.<br />
This work was conducted at CUBRC in Buffalo, NY as part <strong>of</strong> the Center for Transportation Injury<br />
Research (CenTIR) Project <strong>and</strong> is based upon work supported by the FHWA under Cooperative Agreement No.<br />
DTFH61-07-H-00023 from FHWA to CUBRC. Any opinions, findings <strong>and</strong> conclusions or recommendations<br />
expressed in this report are those <strong>of</strong> the authors <strong>and</strong> do not necessarily reflect the view <strong>of</strong> the Federal Highway<br />
Administration.<br />
Marie C. Flanigan, PhD Alan J. Blatt, MS<br />
Principal Investigator Director<br />
Center for Transportation Injury Research Center for Transportation Injury Research<br />
CUBRC CUBRC<br />
userreg@adamsairmed.org 4455 Genesee St., Buffalo, NY 14225<br />
http://www.<strong>ADAMS</strong>airmed.org http://www.cubrc.org<br />
5
This page intentionally left blank<br />
6
TABLE OF CONTENTS<br />
FOREWORD .................................................................................................................................................................... 1<br />
PREFACE ......................................................................................................................................................................... 3<br />
ACKNOWLEDGEMENTS .............................................................................................................................................. 5<br />
1 INTRODUCTION ................................................................................................................................................... 9<br />
2 DATA PROCESSING ............................................................................................................................................. 9<br />
3 ORGANIZATION OF ATLAS ............................................................................................................................... 9<br />
4 NATIONAL & STATE OVERVIEW OF AIR MEDICAL COVERAGE IN 2011 ............................................. 10<br />
4.1 Service Provider ID .......................................................................................................................................... 15<br />
4.2 Pediatric <strong>Air</strong> <strong>Medical</strong> Transport <strong>Services</strong> ......................................................................................................... 15<br />
4.3 Comparison with Previous Year ....................................................................................................................... 16<br />
5 AIR MEDICAL ROTOR WING COVERAGE OF U.S. ROADWAY SYSTEM & POPULATION ................ 17<br />
5.1 Highway Coverage ........................................................................................................................................... 17<br />
5.2 Population Coverage ......................................................................................................................................... 18<br />
6 DESCRIPTION OF STATE MAPS & TABLES ................................................................................................ 19<br />
6.1 State Maps ...................................................................................................................................................... 19<br />
6.2 State Data Tables .............................................................................................................................................. 19<br />
7 ATLAS OF STATES 2011.................................................................................................................................... 21<br />
Alabama ………………………………………………………………………………........ 22<br />
Alaska ………………………………………………………………………………........ 24<br />
Arizona ………………………………………………………………………………........ 26<br />
Arkansas ………………………………………………………………………………........ 30<br />
California ………………………………………………………………………………........ 32<br />
Colorado ………………………………………………………………………………........ 36<br />
Connecticut ………………………………………………………………………………........ 38<br />
Delaware ………………………………………………………………………………........ 40<br />
District <strong>of</strong> Columbia ………………………………………………………………………………........ 42<br />
Florida ………………………………………………………………………………........ 44<br />
Georgia ………………………………………………………………………………........ 48<br />
Hawaii ………………………………………………………………………………........ 50<br />
Idaho ………………………………………………………………………………........ 52<br />
Illinois ………………………………………………………………………………........ 54<br />
Indiana ………………………………………………………………………………........ 56<br />
Iowa ………………………………………………………………………………........ 58<br />
Kansas ………………………………………………………………………………........ 60<br />
Kentucky ………………………………………………………………………………........ 62<br />
Louisiana ………………………………………………………………………………........ 64<br />
Maine ………………………………………………………………………………....... 66<br />
Maryl<strong>and</strong> ………………………………………………………………………………........ 68<br />
Massachusetts ………………………………………………………………………………........ 70<br />
Michigan ………………………………………………………………………………........ 72<br />
Minnesota ………………………………………………………………………………........ 74<br />
Mississippi ………………………………………………………………………………........ 76<br />
Missouri ………………………………………………………………………………........ 78<br />
Montana ………………………………………………………………………………........ 80<br />
Nebraska ………………………………………………………………………………........ 82<br />
7
Nevada ………………………………………………………………………………........ 84<br />
New Hampshire ………………………………………………………………………………........ 86<br />
New Jersey ………………………………………………………………………………........ 88<br />
New Mexico ………………………………………………………………………………........ 90<br />
New York ………………………………………………………………………………........ 92<br />
North Carolina ………………………………………………………………………………........ 94<br />
North Dakota ………………………………………………………………………………........ 96<br />
Ohio ………………………………………………………………………………........ 98<br />
Oklahoma ………………………………………………………………………………........ 100<br />
Oregon ………………………………………………………………………………........ 102<br />
Pennsylvania ………………………………………………………………………………........ 104<br />
Rhode Isl<strong>and</strong> ………………………………………………………………………………........ 108<br />
South Carolina ………………………………………………………………………………........ 110<br />
South Dakota ………………………………………………………………………………........ 112<br />
Tennessee ………………………………………………………………………………........ 114<br />
Texas ………………………………………………………………………………........ 116<br />
Utah ………………………………………………………………………………........ 120<br />
Vermont ………………………………………………………………………………........ 122<br />
Virginia ………………………………………………………………………………........ 124<br />
Washington ………………………………………………………………………………........ 126<br />
West Virginia ………………………………………………………………………………........ 128<br />
Wisconsin ………………………………………………………………………………........ 130<br />
Wyoming ………………………………………………………………………………........ 132<br />
APPENDIX<br />
A. Summary <strong>of</strong> State Traffic Fatalities <strong>and</strong> Fatality Rates<br />
B. Alphabetical List <strong>of</strong> <strong>Air</strong> <strong>Medical</strong> Service Providers with Service Provider ID # <strong>and</strong> Corporate Location<br />
8
1 INTRODUCTION<br />
<strong>ADAMS</strong><br />
The “<strong>Atlas</strong> <strong>and</strong> <strong>Database</strong> <strong>of</strong> <strong>Air</strong> <strong>Medical</strong> <strong>Services</strong>” (<strong>ADAMS</strong>), is a compilation <strong>of</strong> information on air<br />
medical services in the United States who respond to the scene <strong>of</strong> a trauma or medical emergency, or who provide<br />
emergency (or scheduled) inter-hospital transport. <strong>ADAMS</strong> currently contains detailed descriptive <strong>and</strong> geographic<br />
information on air medical rotor wing (RW) <strong>and</strong> fixed wing (FW) services, including information on their corporate<br />
<strong>of</strong>fice, airport <strong>and</strong> helipad bases, communication center, rotor wing <strong>and</strong> fixed wing aircraft <strong>and</strong> the major hospitals<br />
<strong>and</strong> trauma centers which receive their emergency transports. It is believed that more than 95% <strong>of</strong> RW services <strong>and</strong><br />
90% <strong>of</strong> FW services are included in <strong>ADAMS</strong>. The <strong>ADAMS</strong> database includes all types <strong>of</strong> air medical organizations<br />
including for-pr<strong>of</strong>it <strong>and</strong> not-for pr<strong>of</strong>it, dual-use public service (police/fire), as well as several military units who<br />
routinely provide transport for civilian victims in remote areas or during poor weather conditions.<br />
<strong>ADAMS</strong> is more than a st<strong>and</strong>ard tabulation <strong>of</strong> air medical services. First, <strong>ADAMS</strong> includes both corporate<br />
<strong>and</strong> satellite base locations for each service as well as the FAA registration numbers (N#) for all RW <strong>and</strong> FW<br />
aircraft utilized for trauma scene response <strong>and</strong> inter-hospital transport. Second, <strong>ADAMS</strong> is structured as a<br />
relational database, an important distinction since it allows data to be accessed, extracted or reassembled in many<br />
different ways without having to reorganize the original database tables. Third, the relational database has been<br />
imported into a Geographic Information System (GIS), a s<strong>of</strong>tware program which enables the user to view the<br />
database in a map context <strong>and</strong> link various mapped objects with text information.<br />
<strong>ADAMS</strong> is currently implemented in a web-based GIS. Password-protected portions <strong>of</strong> the <strong>ADAMS</strong><br />
website (containing descriptive data <strong>and</strong> interactive maps) are made available to registered air medical service<br />
providers, regular AAMS members, Automatic Crash Notification (ACN) technology developers, disaster response<br />
<strong>and</strong> homel<strong>and</strong> security groups, emergency medical <strong>and</strong> trauma system researchers, flight safety personnel <strong>and</strong><br />
researchers, <strong>and</strong> various public health <strong>and</strong> safety agencies. In addition, the <strong>ADAMS</strong> website contains data collection<br />
web forms which enable registered air medical services (with appropriate password) to edit or add data for their own<br />
service at any time. Modifications made on these webforms are regularly incorporated into the GIS.<br />
This document is the 9th edition <strong>of</strong> the publicly available <strong>Atlas</strong> which contains national <strong>and</strong> state maps<br />
showing air medical rotor <strong>and</strong> fixed wing base locations along with summary tables for each state. This document<br />
is available on the public portion <strong>of</strong> the <strong>ADAMS</strong> website located at http://www.<strong>ADAMS</strong>airmed.org.<br />
2 DATA PROCESSING<br />
<strong>ADAMS</strong> data was collected using web forms customized for each <strong>Air</strong> <strong>Medical</strong> Service. The data were<br />
subsequently imported into Micros<strong>of</strong>t ACCESS (relational database s<strong>of</strong>tware) <strong>and</strong> then into the ESRI ARCView 8.3<br />
GIS program. Street locations were geo-coded using the ArcView s<strong>of</strong>tware coupled with the Arc GIS StreetMap<br />
USA (2003) streets database. This geo-coding process essentially converts a street address to a latitude/longitude<br />
<strong>and</strong> assigns an identifier to both a map feature <strong>and</strong> to a data record. The elevation data used to produce<br />
topographical maps came from ESRI Data & Maps (2003). Finally, all maps were projected using the North<br />
American Equidistant Conic Projection.<br />
The maps shown here were created on a PC desk-top computer running Windows XP. The web-based<br />
GIS contains a subset <strong>of</strong> the full <strong>ADAMS</strong> database <strong>and</strong> was created using ESRI ArcGIS Server (Version 9.3).<br />
3 ORGANIZATION OF ATLAS<br />
Section 4 provides a national map illustrating air medical rotor wing service coverage <strong>and</strong> fixed wing base<br />
locations throughout the United States. In addition, a summary table <strong>and</strong> several bar charts provide detail on the<br />
number <strong>of</strong> services in each state as well as the number <strong>of</strong> RW <strong>and</strong> FW bases <strong>and</strong> aircraft in each state. Also in Section<br />
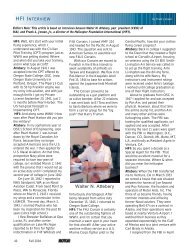
4 is a brief discussion <strong>of</strong> pediatric transport services. At the end <strong>of</strong> the section, two maps which highlight the changes<br />
in the number <strong>of</strong> RW bases <strong>and</strong> RW aircraft (since last year) are presented.<br />
One <strong>of</strong> the objectives for developing <strong>ADAMS</strong> is to help improve emergency medical response to car crash<br />
scenes, given that such crashes are the leading cause <strong>of</strong> trauma in this country. Toward that end, Section 5 provides<br />
two national maps showing current coverage <strong>of</strong> major roadways <strong>and</strong> current coverage <strong>of</strong> the US population by air<br />
medical RW services. Section 6 provides a description <strong>of</strong> the individual state maps <strong>and</strong> state data tables which make<br />
up the major portion <strong>of</strong> the <strong>Atlas</strong>. The actual maps <strong>and</strong> tables showing RW <strong>and</strong> FW base locations are provided in<br />
Section 7. Finally, Appendix A provides statistics on the number <strong>of</strong> fatalities from car crashes during the last several<br />
years. An alphabetical listing <strong>of</strong> all air medical services currently included in <strong>ADAMS</strong> is provided in Appendix B.<br />
9
4 NATIONAL & STATE OVERVIEW OF AIR MEDICAL COVERAGE IN 2011<br />
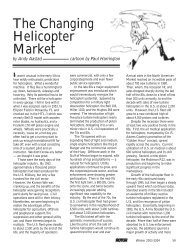
Figure 1 is a map <strong>of</strong> the United States showing main <strong>and</strong> satellite base locations <strong>of</strong> all the Rotor Wing <strong>and</strong><br />
Fixed Wing <strong>Air</strong> <strong>Medical</strong> <strong>Services</strong> in the US in 2011. The gold stars indicate main <strong>of</strong>fice locations <strong>and</strong> the orange<br />
circles indicate 10 minute fly circles around each base where a RW is stationed 1 . The size <strong>of</strong> the 10 minute fly<br />
circle varies with the cruise speed <strong>of</strong> the particular RW make <strong>and</strong> model resident at that base. The white blocks<br />
show bases (airports) where Fixed Wing aircraft are based. Summary statistics on numbers <strong>of</strong> services, bases <strong>and</strong><br />
aircraft are provided at the bottom <strong>of</strong> the figure.<br />
Figure 1. <strong>Air</strong> <strong>Medical</strong> Service Corporate & Satellite Rotor & Fixed Wing Base Locations.<br />
Table 1 lists the number <strong>of</strong> air medical services headquartered in each state as well as the number <strong>of</strong> out-<strong>of</strong>state<br />
services with bases in that state. This is followed by the number <strong>of</strong> bases with RW, the number with FW <strong>and</strong> the<br />
total number <strong>of</strong> bases in the state. Note that if a single air medical service has a base with both RW <strong>and</strong> FW, the base is<br />
included in the RW base inventory <strong>and</strong> in the FW base inventory, but included once in the total base inventory. For<br />
this reason, the sum <strong>of</strong> ‘Bases with RW’ <strong>and</strong> ‘Bases with FW’ may or may not equal ‘Total Bases’ in the state.<br />
In addition to an inventory <strong>of</strong> bases, Table 1 also includes data on the number <strong>of</strong> RW <strong>and</strong> FW aircraft in each<br />
state. To place all these figures in context, state populations <strong>and</strong> geographic area are provided for reference. National<br />
totals for each category are provided at the bottom <strong>of</strong> the table.<br />
Figures 2 <strong>and</strong> 3 are bar charts which graphically display the information in Table 1. Finally, Table 2 lists the<br />
number <strong>of</strong> each type <strong>of</strong> service (RW only, RW/FW, FW only) headquartered in each state.<br />
1 Note that a 10-minute fly circle actually translates into a ~20 minute response time since 7 to 12 minutes are usually required for initial preflight<br />
<strong>and</strong> launch.<br />
10
Table 1. 2011 State Summary <strong>of</strong> <strong>Air</strong> <strong>Medical</strong> RW & FW <strong>Services</strong>, Bases & <strong>Air</strong>craft Currently in <strong>ADAMS</strong>.<br />
State<br />
<strong>Services</strong><br />
Headqrtd<br />
in State<br />
Out <strong>of</strong><br />
State<br />
<strong>Services</strong><br />
w/Bases<br />
in State<br />
Bases<br />
with<br />
RW<br />
Bases<br />
with<br />
FW<br />
Total<br />
Bases<br />
(a)<br />
11<br />
RW<br />
<strong>Air</strong>craft<br />
(b)(c)<br />
FW<br />
<strong>Air</strong>craft<br />
(b)(c)<br />
Total<br />
<strong>Air</strong>craft<br />
(b)<br />
State<br />
Population<br />
(Y2000)<br />
Total<br />
State<br />
Area<br />
(Sq Mi)<br />
(d)<br />
Alabama 4 2 14 2 16 16 3 19 4,779,736 52,423<br />
Alaska 13 1 10 21 27 34 36 70 710,231 656,425<br />
Arizona 9 3 51 15 62 59 20 79 6,392,017 114,006<br />
Arkansas 4 2 13 2 15 13 7 20 2,915,918 53,182<br />
California 32 2 65 13 74 101 23 124 37,253,956 163,707<br />
Colorado 6 2 17 6 22 15 13 28 5,029,196 104,100<br />
Connecticut 1 0 2 0 2 2 0 2 3,574,097 5,544<br />
D.C. 2 1 2 0 2 4 0 4 601,723 68<br />
Delaware 2 0 4 0 4 6 0 6 897,934 2,489<br />
Florida 29 1 35 8 43 44 27 71 18,801,310 65,758<br />
Georgia 8 3 23 4 27 26 19 45 9,687,653 59,441<br />
Hawaii 3 1 3 7 10 3 8 11 1,360,301 10,932<br />
Idaho 2 1 9 4 11 10 4 14 1,567,582 83,574<br />
Illinois 11 4 19 3 22 24 6 30 12,830,632 57,918<br />
Indiana 6 2 18 2 20 19 2 21 6,483,802 36,420<br />
Iowa 6 4 11 2 13 11 4 15 3,046,355 56,276<br />
Kansas 4 0 9 7 15 12 8 20 2,853,118 82,282<br />
Kentucky 2 3 27 1 27 28 1 29 4,339,367 40,411<br />
Louisiana 3 1 10 1 10 14 5 19 4,533,372 51,843<br />
Maine 1 0 3 0 3 2 0 2 1,328,361 35,387<br />
Maryl<strong>and</strong> 2 3 13 1 13 18 2 20 5,773,552 12,407<br />
Massachusetts 2 0 3 1 3 4 1 5 6,547,629 10,555<br />
Michigan 7 2 11 4 14 12 15 27 9,883,640 96,810<br />
Minnesota 3 1 11 3 13 18 4 22 5,303,925 86,943<br />
Mississippi 3 3 10 0 10 10 0 10 2,967,297 48,434<br />
Missouri 8 3 31 3 33 31 3 34 5,988,927 69,709<br />
Montana 7 0 5 5 10 5 7 12 989,415 147,046<br />
Nebraska 3 2 6 1 7 6 1 7 1,826,341 77,358<br />
Nevada 3 2 6 6 12 7 9 16 2,700,551 110,567<br />
New Hampshire 1 0 2 0 2 3 0 3 1,316,470 9,351<br />
New Jersey 4 1 7 0 7 10 0 10 8,791,894 8,722<br />
New Mexico 4 4 11 7 16 11 13 24 2,059,179 121,593<br />
New York 11 0 20 2 20 33 3 36 19,378,102 54,475<br />
North Carolina 10 0 17 2 18 21 4 25 9,535,483 53,821<br />
North Dakota 3 0 4 1 5 4 1 5 672,591 70,704<br />
Ohio 9 3 36 1 37 40 2 42 11,536,504 44,828<br />
Oklahoma 3 2 19 2 21 19 6 25 3,751,351 69,903<br />
Oregon 5 1 7 6 12 7 11 18 3,831,074 98,386<br />
Pennsylvania 10 0 39 0 39 48 0 48 12,702,379 46,058<br />
Rhode Isl<strong>and</strong> 0 0 0 0 0 0 0 0 1,052,567 1,545<br />
South Carolina 6 2 9 2 11 10 3 13 4,625,364 32,007<br />
South Dakota 4 0 4 3 6 4 4 8 814,180 77,121<br />
Tennessee 5 1 25 1 26 28 1 29 6,346,105 42,146<br />
Texas 22 3 68 13 78 72 19 91 25,145,561 268,601<br />
Utah 3 1 9 3 12 10 4 14 2,763,885 84,904<br />
Vermont 0 0 0 0 0 0 0 0 625,741 9,615<br />
Virginia 8 1 16 0 16 20 0 20 8,001,024 42,769<br />
Washington 2 1 8 4 9 10 8 18 6,724,540 71,303<br />
West Virginia 1 1 10 0 10 11 0 11 1,852,994 24,231<br />
Wisconsin 8 2 11 2 13 13 2 15 5,686,986 65,503<br />
Wyoming 1 1 1 2 3 1 2 3 563,626 97,818<br />
Totals 306 73 764 173 901 929 311 1240 308,745,538 3,787,419<br />
a) If a single air medical service has a base with both RW <strong>and</strong> FW, the base is included in RW base inventory <strong>and</strong> in FW base inventory but included once in<br />
Total Bases. Therefore, sum <strong>of</strong> ‘Bases with RW’ <strong>and</strong> ‘Bases with FW’ may or may not equal ‘Total Bases’ in State.<br />
b) State RW/ FW totals for Alaska <strong>and</strong> North Carolina include aircraft from selected military units which are routinely used in civilian rescue. Alaska: 17 RW<br />
& 8 FW from <strong>Air</strong> National Guard <strong>and</strong> Coast Guard; North Carolina: 3 RW from Marine Corps <strong>Air</strong> Station.<br />
c) Throughout fleet, 50 RW <strong>and</strong> 5 FW are listed as SPARES.<br />
d) State total area (l<strong>and</strong> & water) from http://www.netstate.com which references World Almanac <strong>of</strong> the USA by A.Carpenter <strong>and</strong> C.Provorse, 1996.
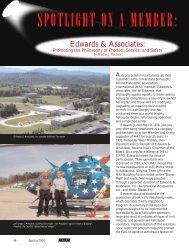
Figure 2. Bar Chart Showing Number <strong>of</strong> Bases with RW <strong>and</strong> Bases with FW by State in 2011.<br />
Figure 3. Bar Chart Showing Number <strong>of</strong> <strong>Air</strong>craft by Type (RW & FW) <strong>and</strong> by State in 2011.<br />
12
Figure 4. Number <strong>of</strong> Rotor Wing Bases <strong>and</strong> Rotor Wing <strong>Air</strong>craft by Year (<strong>ADAMS</strong> 2004-2011)<br />
13
Table 2. Service Types Headquartered in Each State in 2011<br />
RW only RW / FW FW only Total <strong>Services</strong><br />
State<br />
<strong>Services</strong><br />
<strong>Services</strong> <strong>Services</strong> Hdqrt in State<br />
Alabama 2 0 2 4<br />
Alaska 2 6 5 13<br />
Arizona 4 5 0 9<br />
Arkansas 2 0 2 4<br />
California 22 5 5 32<br />
Colorado 2 3 1 6<br />
Connecticut 1 0 0 1<br />
Delaware 2 0 0 2<br />
Dist. <strong>of</strong> Columbia 2 0 0 2<br />
Florida 21 1 7 29<br />
Georgia 4 1 3 8<br />
Hawaii 2 0 1 3<br />
Idaho 0 2 0 2<br />
Illinois 9 0 2 11<br />
Indiana 5 1 0 6<br />
Iowa 6 0 0 6<br />
Kansas 2 2 0 4<br />
Kentucky 1 1 0 2<br />
Louisiana 2 1 0 3<br />
Maine 1 0 0 1<br />
Maryl<strong>and</strong> 1 1 0 2<br />
Massachusetts 1 1 0 2<br />
Michigan 4 2 1 7<br />
Minnesota 1 2 0 3<br />
Mississippi 3 0 0 3<br />
Missouri 5 3 0 8<br />
Montana 2 3 2 7<br />
Nebraska 3 0 0 3<br />
Nevada 1 0 2 3<br />
New Hampshire 1 0 0 1<br />
New Jersey 4 0 0 4<br />
New Mexico 0 2 2 4<br />
New York 9 2 0 11<br />
North Carolina 9 1 0 10<br />
North Dakota 2 1 0 3<br />
Ohio 8 1 0 9<br />
Oklahoma 2 0 1 3<br />
Oregon 0 3 2 5<br />
Pennsylvania 10 0 0 10<br />
Rhode Isl<strong>and</strong> 0 0 0 0<br />
South Carolina 6 0 0 6<br />
South Dakota 1 3 0 4<br />
Tennessee 4 1 0 5<br />
Texas 12 5 5 22<br />
Utah 0 2 1 3<br />
Vermont 0 0 0 0<br />
Virginia 8 0 0 8<br />
Washington 0 2 0 2<br />
West Virginia 1 0 0 1<br />
Wisconsin 7 0 1 8<br />
Wyoming 0 1 0 1<br />
Totals 197 64 45 306<br />
Total <strong>Services</strong> with RW = 261 / Total <strong>Services</strong> with FW = 109<br />
14
4.1 Service Provider ID<br />
Within the database, each service provider in the country is assigned a five character ‘Service Provider ID’<br />
(SPID) which is the ‘home’ state abbreviation (where main <strong>of</strong>fice is located) followed by 3 numeric digits (e.g.,<br />
AL001, NY001, NY002, etc.). This unique SPID is used to label all bases for a given air medical service, whether<br />
these bases be in their home state or another state. (See Appendix B for an alphabetical listing <strong>of</strong> all <strong>Air</strong> <strong>Medical</strong><br />
<strong>Services</strong> in <strong>ADAMS</strong> <strong>and</strong> their assigned SPID numbers.)<br />
4.2 Pediatric <strong>Air</strong> <strong>Medical</strong> Transport <strong>Services</strong><br />
With few exceptions, pediatric transport services perform emergency inter-hospital transports only (i.e., no<br />
scene response.) Since emergency interfacility transports from a local hospital emergency room to a trauma center<br />
are an important part <strong>of</strong> the trauma system response, these services were included in <strong>ADAMS</strong> starting in 2005.<br />
Table 3 lists the pediatric services which have their own in-house, dedicated, air medical RW or FW. There are a<br />
number <strong>of</strong> other pediatric transport services which are basically ground transport services which utilize other local<br />
RW services when they receive a request for air transport. Table 4 lists these pediatric transport services along with<br />
the outside air medical service which they utilize. The blue shaded columns in both tables highlight the air medical<br />
services included in <strong>ADAMS</strong>.<br />
Table 3. Pediatric Transport <strong>Services</strong> with In-House <strong>Air</strong> <strong>Medical</strong> Rotor or Fixed Wing <strong>Air</strong>craft<br />
(Included in <strong>ADAMS</strong>)<br />
<strong>ADAMS</strong> Children’s Transport<br />
Facility City State # # # Emerg Scene<br />
ID#<br />
Service<br />
Bases RW FW Interfacility<br />
AR003 Angel One Transport Arkansas Children’s<br />
Hospital<br />
Little Rock AR 2 2 Yes No<br />
CA005 Children’s Hospital <strong>of</strong> Los Children’s Hospital Van Nuys CA 1 1 Yes No<br />
Angeles Emerg. Transport <strong>of</strong> Los Angeles<br />
CA025 <strong>Air</strong> George Children’s Hospital<br />
<strong>of</strong> Central California<br />
Madera CA 1 1 Yes No<br />
GA004 Children’s Transport <strong>Air</strong> <strong>of</strong> Children’s<br />
Atlanta GA 2 2** Yes Yes<br />
Atlanta<br />
Healthcare <strong>of</strong> Atlanta<br />
FL010 Life Flight (Miami<br />
Miami Children’s Opa Locka FL 1 2 Yes No<br />
Children’s)<br />
Hospital<br />
MO005 Children’s Mercy Critical Children’s Mercy Kansas MO 2 1* 1 Yes No<br />
Care Transport<br />
Hospital<br />
City<br />
OH008 <strong>Air</strong> Bear Akron Children's<br />
Hospital<br />
Akron OH 1 1 Yes No<br />
TX013 Children’s <strong>Medical</strong> Center<br />
Dallas Transport Service<br />
Dallas Love Field Dallas TX 1 1 2** Yes No<br />
TX023 Teddy Bear Transport Cook Children’s<br />
<strong>Medical</strong> Center<br />
Ft. Worth TX 2 1 1 Yes No<br />
** One is a SPARE. Shares RW <strong>and</strong> RW base with Lifeflight Eagle (MO009).<br />
Table 4. Pediatric Transport <strong>Services</strong> Utilizing Another <strong>Air</strong> <strong>Medical</strong> Rotor Wing Service Already in <strong>ADAMS</strong><br />
Children’s Transport Service<br />
(NOT Listed as Service in <strong>ADAMS</strong>)<br />
City State <strong>Air</strong> <strong>Medical</strong> RW Service<br />
Supporting Children’s<br />
Transport *<br />
15<br />
<strong>ADAMS</strong> RW<br />
Service ID<br />
Children’s Hospital Neonatal/Pediatric Transport<br />
Program<br />
Columbus OH Medflight <strong>of</strong> Ohio OH004<br />
Children’s Hospital Transport Program Boston MA Boston Medflight MA001<br />
Children’s <strong>Medical</strong> Center Dayton OH Careflite (Dayton) OH001<br />
Children’s Memorial Transport Team Chicago IL UCAN or Loyola Lifestar IL010, IL008<br />
Driscoll Children’s Hospital Corpus Christi TX Halo Flight TX008<br />
Methodist Children’s Hospital Transport <strong>Services</strong> San Antonio TX San Antonio <strong>Air</strong>life TX015<br />
PANDA Transport / OHSU Transport Portl<strong>and</strong> OR Lifeflight Network OR002<br />
* <strong>Medical</strong> Crew Provided by Children’s Transport Service or Outside <strong>Air</strong> <strong>Medical</strong> Service
4.3 Comparison with Previous Year<br />
Between September 2010 <strong>and</strong> September 2011, the total number <strong>of</strong> air medical services in <strong>ADAMS</strong><br />
decreased by three from 309 to 306. The total number <strong>of</strong> bases with RW increased by 33 (from 731 to 764) while<br />
the number <strong>of</strong> RW aircraft increased by 29 (from 900 to 929). 2 The number <strong>of</strong> bases with FW increased by 8 (from<br />
165 to 173) <strong>and</strong> the number <strong>of</strong> FW aircraft stayed the same (311).<br />
Figure 5 shows the states where the total number <strong>of</strong> RW bases <strong>and</strong>/or RW aircraft changed since last year.<br />
Twenty-two states showed an increase in RW bases <strong>and</strong> twenty-one states showed an increase in RW aircraft<br />
serving the state. Four states showed a decrease in the number <strong>of</strong> RW bases <strong>and</strong> six states showed a decrease in the<br />
number <strong>of</strong> RW aircraft. Currently, 50 (or 5.4%) <strong>of</strong> the 929 RW aircraft in <strong>ADAMS</strong> are specifically labeled as a<br />
‘spare’ or ‘backup’ RW.<br />
Figure 5. Change in Number <strong>of</strong> RW Bases (top) <strong>and</strong> Number <strong>of</strong> RW <strong>Air</strong>craft (bottom) by State since<br />
September <strong>of</strong> Last Year.<br />
2 Included in these RW aircraft totals are RW which are listed as SPARES; these increased from 27 last year, to 47 this year. The number <strong>of</strong><br />
FW listed as SPARES decreased from 5 last year, to 4 this year.<br />
16
5 AIR MEDICAL ROTOR WING COVERAGE OF U.S. ROADWAY SYSTEM & POPULATION<br />
5.1 Highway Coverage<br />
Motor vehicle crashes are the major cause <strong>of</strong> trauma in this country. Each year, an average 40,000 people<br />
die on the nation’s highways <strong>and</strong> over 3 million people are injured. Two million <strong>of</strong> these injuries are disabling <strong>and</strong><br />
250,000 are life-threatening. This translates into an enormous cost, not only personally <strong>and</strong> financially for those<br />
involved, but economically for the entire country as well. Optimizing the placement <strong>of</strong> trauma system resources<br />
(such as air medical services), can help improve emergency medical response to these car crash scenes.<br />
<strong>ADAMS</strong> 2011 data was used to examine current air medical rotor wing coverage <strong>of</strong> the nation’s highway<br />
system. Figure 6 shows interstate highways, principal arterials <strong>and</strong> minor arterials from the FHWA National<br />
Highway Planning Network (NHPN). The NHPN consists <strong>of</strong> over 400,000 miles <strong>of</strong> the nation's highways which are<br />
comprised <strong>of</strong> National Highway System routes, urban principal arterials, rural arterials <strong>and</strong> other smaller roads.<br />
Overlaid on the three major types <strong>of</strong> roadways in Figure 6 are the 10 minute fly circles (showing nominal 20 minute<br />
response areas) derived from the <strong>ADAMS</strong> September 2011 dataset. Calculations indicate that across the 50 states<br />
<strong>and</strong> the District <strong>of</strong> Columbia, 65.6% <strong>of</strong> interstate, 60.2% <strong>of</strong> principal arterial <strong>and</strong> 50.0% <strong>of</strong> minor arterial miles are<br />
now within a nominal 20 minute air medical RW response.<br />
Figure 6. <strong>Air</strong> <strong>Medical</strong> RW Coverage <strong>of</strong> the Nation’s Highway System – Nominal 20 Minute Response.<br />
<strong>ADAMS</strong> data is being used to support research directed at reducing the numbers <strong>of</strong> fatalities <strong>and</strong> serious<br />
injuries on the nation’s highways 3 . To highlight the magnitude <strong>of</strong> the traffic safety problem in the United States,<br />
3<br />
"Assessment <strong>of</strong> <strong>Air</strong> <strong>Medical</strong> Coverage Using the <strong>Atlas</strong> <strong>and</strong> <strong>Database</strong> <strong>of</strong> <strong>Air</strong> <strong>Medical</strong> <strong>Services</strong> <strong>and</strong> Correlations with Reduced Highway Fatality<br />
Rates." Marie Flanigan, Alan Blatt, Louis Lombardo, Dawn Mancuso, Maile Miller, Dale Wiles, Herbert Pirson, Julie Hwang, Jean-Claude Thill,<br />
Kevin Majka. <strong>Air</strong> <strong>Medical</strong> Journal, July-August 2005, p151.<br />
17
Appendix A summarizes the most recent data that is available on state traffic fatalities <strong>and</strong> fatality rates. It is<br />
provided to complement the state air medical service coverage data provided in this <strong>Atlas</strong>.<br />
5.2 Population Coverage<br />
Figure 7 shows a national view <strong>of</strong> population (from the new Y2010 census) <strong>and</strong> 2011 RW base locations.<br />
The RW bases are at the center <strong>of</strong> each <strong>of</strong> the 10 minute fly circles. Population clusters are shown as small dark<br />
gray dots, where each dot represents 10,000 people. Note that the locations <strong>of</strong> these population clusters are<br />
approximate. The position <strong>of</strong> each gray dot is r<strong>and</strong>omized within the zip code area (boundaries not shown) where<br />
the population represented by the dot resides. This r<strong>and</strong>omization technique is used to minimize overlap <strong>of</strong> the dots<br />
in congested areas <strong>and</strong> thereby enhance dot visibility. This type <strong>of</strong> map is called a dot density map. Using this<br />
year’s fly circles, it is estimated that 249.7 million people or 79.9% <strong>of</strong> the U.S. population (Y2010 census) are<br />
within a 10 minute fly circle corresponding to a nominal 20 minute air medical response. An estimated 62.8 million<br />
people reside outside this response area.<br />
Figure 7. Population Dot Density Map with 10 Minute Fly Circles Around RW Base Locations.<br />
18
6 DESCRIPTION OF STATE MAPS & TABLES<br />
This section provides an introduction <strong>and</strong> brief overview <strong>of</strong> the state maps <strong>and</strong> data tables which are<br />
contained in the major part <strong>of</strong> the <strong>Atlas</strong> (Section 7). There are at least two pages for each state - a map page <strong>and</strong> a<br />
table page.<br />
6.1 State Maps<br />
6.1.1 Service Provider / Topographical Map<br />
The top map for each state shows a topographical (elevation) map with 5 additional data layers. These<br />
layers include: 1) the main <strong>of</strong>fice locations for all air medical RW <strong>and</strong> FW services headquartered in that state<br />
(marked with a yellow star <strong>and</strong> service provider name), 2) all RW <strong>and</strong> FW base locations for both in-state <strong>and</strong> out<strong>of</strong>-state<br />
service providers (marked with an orange square), 3) ten minute Rotor Wing fly circles around each RW<br />
base, 4) the interstate highway network, <strong>and</strong> 5) three to five <strong>of</strong> the largest cities in the state. The size <strong>of</strong> the 10<br />
minute fly circle around a RW base is determined by the cruise speed <strong>of</strong> the RW aircraft based there. (Bases with<br />
FW only are shown with the orange square but no fly circle.)<br />
Each RW <strong>and</strong> FW base is labeled with the Service Provider Identifier (SPID) <strong>of</strong> the air medical service<br />
which operates out <strong>of</strong> that base. The first two letters in the SPID indicate whether the base is operated by an in-state<br />
or out-<strong>of</strong>-state service. In congested regions <strong>of</strong> the map, some base labels may not be visible. However, all bases<br />
are listed in the adjacent data table on the next (facing) page.<br />
6.1.2 Hospital / County / Population Map<br />
The bottom map shows county 4 boundaries in the state, 10 minute fly circles around the RW bases <strong>and</strong> the<br />
locations <strong>of</strong> major hospitals (H) which receive air medical scene transports. Note that not all hospitals in the state<br />
are shown, but rather a subset identified by the air medical services as the major destinations for trauma or<br />
emergency medical transports. This map shows RW fly circles only (no FW bases).<br />
The color coding <strong>of</strong> the counties indicates population level (Year 2010 census) with the population color<br />
scale defined as shown in the map legend. The first color category is for populations <strong>of</strong> 50,000 or less, which<br />
indicates a rural county. The same population color scale is used for all states. Note that if a county is completely<br />
covered by a fly circle (which is a transparent gray), the ‘apparent’ population color is lighter than actual.<br />
6.2 State Data Tables<br />
The page opposite the state map page shows four data tables. The top table lists the type <strong>and</strong> number <strong>of</strong> air<br />
medical services headquartered in the state as well as the number <strong>of</strong> out-<strong>of</strong>-state services with RW <strong>and</strong>/or FW bases<br />
in the state. The state area <strong>and</strong> population (Y2010 census) are also provided for reference.<br />
The second table summarizes the total number <strong>of</strong> rotor <strong>and</strong> fixed wing bases <strong>and</strong> aircraft operating in the<br />
state. If a single air medical service has a base with both RW <strong>and</strong> FW aircraft types, the base is included in the RW<br />
base inventory AND in the FW base inventory, but included only once in the total RW & FW base inventory. Thus,<br />
the total bases in the state may (or may not) equal the sum <strong>of</strong> RW bases <strong>and</strong> FW bases.<br />
The third table lists all Rotor Wing <strong>Services</strong> operating in the state along with the names <strong>of</strong> each base in the<br />
state (with city <strong>and</strong> zip code). RW services headquartered in the state (as indicated by the SPID) are listed first,<br />
followed by out-<strong>of</strong>-state services with bases in the state. The number <strong>of</strong> RW aircraft stationed at each base is<br />
provided as well. If the RW service also operates FW, the names <strong>of</strong> FW bases <strong>and</strong> the number <strong>of</strong> FW aircraft at<br />
each base are also listed. An indication <strong>of</strong> whether the base is located at an airport, a hospital or a st<strong>and</strong>-alone<br />
helipad is included. The actual number <strong>of</strong> aircraft at a given base at any given time can <strong>of</strong> course, fluctuate<br />
depending on need, maintenance schedules, etc. For the purposes <strong>of</strong> this inventory, each RW <strong>and</strong> FW aircraft,<br />
identified uniquely by aircraft N# (not shown here), is ‘assigned’ to a specific base.<br />
The fourth table provides a list <strong>of</strong> ‘Fixed Wing Only’ services operating in the state. Again, services<br />
headquartered in the state are listed first. Following the FW service name, the base name, city, zip code <strong>and</strong> number<br />
<strong>of</strong> FW stationed at the base are provided.<br />
The <strong>Atlas</strong> <strong>of</strong> States for <strong>ADAMS</strong> 2011 is presented in the next section.<br />
4<br />
Except in Louisiana <strong>and</strong> Alaska where parishes <strong>and</strong> boroughs respectively are shown.<br />
19
This page intentionally left blank<br />
20
7 ATLAS OF STATES 2011<br />
21