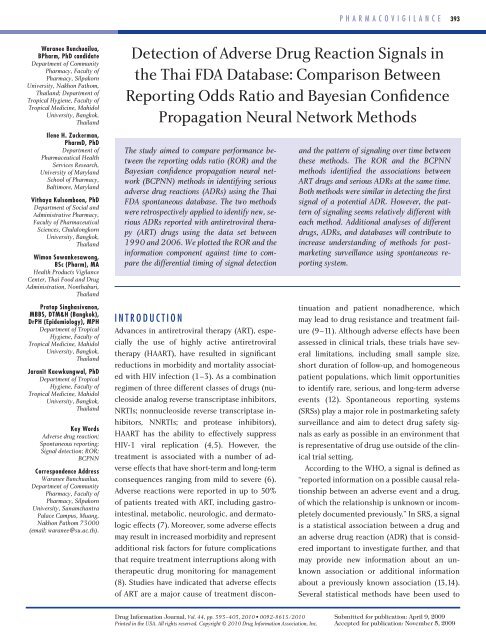
Detection of Adverse Drug Reaction Signals in the Thai FDA Database
Detection of Adverse Drug Reaction Signals in the Thai FDA Database
Detection of Adverse Drug Reaction Signals in the Thai FDA Database

Create successful ePaper yourself
Turn your PDF publications into a flip-book with our unique Google optimized e-Paper software.
Waranee Bunchuailua,<br />
BPharm, PhD candidate<br />
Department <strong>of</strong> Community<br />
Pharmacy, Faculty <strong>of</strong><br />
Pharmacy, Silpakorn<br />
University, Nakhon Pathom,<br />
<strong>Thai</strong>land; Department <strong>of</strong><br />
Tropical Hygiene, Faculty <strong>of</strong><br />
Tropical Medic<strong>in</strong>e, Mahidol<br />
University, Bangkok,<br />
<strong>Thai</strong>land<br />
Ilene H. Zuckerman,<br />
PharmD, PhD<br />
Department <strong>of</strong><br />
Pharmaceutical Health<br />
Services Research,<br />
University <strong>of</strong> Maryland<br />
School <strong>of</strong> Pharmacy,<br />
Baltimore, Maryland<br />
Vithaya Kulsomboon, PhD<br />
Department <strong>of</strong> Social and<br />
Adm<strong>in</strong>istrative Pharmacy,<br />
Faculty <strong>of</strong> Pharmaceutical<br />
Sciences, Chulalongkorn<br />
University, Bangkok,<br />
<strong>Thai</strong>land<br />
Wimon Suwankesawong,<br />
BSc (Pharm), MA<br />
Health Products Vigilance<br />
Center, <strong>Thai</strong> Food and <strong>Drug</strong><br />
Adm<strong>in</strong>istration, Nonthaburi,<br />
<strong>Thai</strong>land<br />
Pratap S<strong>in</strong>ghasivanon,<br />
MBBS, DTM&H (Bangkok),<br />
DrPH (Epidemiology), MPH<br />
Department <strong>of</strong> Tropical<br />
Hygiene, Faculty <strong>of</strong><br />
Tropical Medic<strong>in</strong>e, Mahidol<br />
University, Bangkok,<br />
<strong>Thai</strong>land<br />
Jaranit Kaewkungwal, PhD<br />
Department <strong>of</strong> Tropical<br />
Hygiene, Faculty <strong>of</strong><br />
Tropical Medic<strong>in</strong>e, Mahidol<br />
University, Bangkok,<br />
<strong>Thai</strong>land<br />
Key Words<br />
<strong>Adverse</strong> drug reaction;<br />
Spontaneous report<strong>in</strong>g;<br />
Signal detection; ROR;<br />
BCPNN<br />
Correspondence Address<br />
Waranee Bunchuailua,<br />
Department <strong>of</strong> Community<br />
Pharmacy, Faculty <strong>of</strong><br />
Pharmacy, Silpakorn<br />
University, Sanamchantra<br />
Palace Campus, Muang,<br />
Nakhon Pathom 73000<br />
(email: waranee@su.ac.th).<br />
<strong>Drug</strong> Information Journal, Vol. 44, pp. 393–403, 2010 • 0092-8615/2010<br />
Pr<strong>in</strong>ted <strong>in</strong> <strong>the</strong> USA. All rights reserved. Copyright © 2010 <strong>Drug</strong> Information Association, Inc.<br />
p h a r m a c o v i g i l a n c e 393<br />
<strong>Detection</strong> <strong>of</strong> <strong>Adverse</strong> <strong>Drug</strong> <strong>Reaction</strong> <strong>Signals</strong> <strong>in</strong><br />
<strong>the</strong> <strong>Thai</strong> <strong>FDA</strong> <strong>Database</strong>: Comparison Between<br />
Report<strong>in</strong>g Odds Ratio and Bayesian Confidence<br />
Propagation Neural Network Methods<br />
The study aimed to compare performance between<br />
<strong>the</strong> report<strong>in</strong>g odds ratio (ROR) and <strong>the</strong><br />
Bayesian confidence propagation neural network<br />
(BCPNN) methods <strong>in</strong> identify<strong>in</strong>g serious<br />
adverse drug reactions (ADRs) us<strong>in</strong>g <strong>the</strong> <strong>Thai</strong><br />
<strong>FDA</strong> spontaneous database. The two methods<br />
were retrospectively applied to identify new, serious<br />
ADRs reported with antiretroviral <strong>the</strong>rapy<br />
(ART) drugs us<strong>in</strong>g <strong>the</strong> data set between<br />
1990 and 2006. We plotted <strong>the</strong> ROR and <strong>the</strong><br />
<strong>in</strong>formation component aga<strong>in</strong>st time to compare<br />
<strong>the</strong> differential tim<strong>in</strong>g <strong>of</strong> signal detection<br />
i n T r o D U c T i o n<br />
Advances <strong>in</strong> antiretroviral <strong>the</strong>rapy (ART), especially<br />
<strong>the</strong> use <strong>of</strong> highly active antiretroviral<br />
<strong>the</strong>rapy (HAART), have resulted <strong>in</strong> significant<br />
reductions <strong>in</strong> morbidity and mortality associated<br />
with HIV <strong>in</strong>fection (1–3). As a comb<strong>in</strong>ation<br />
regimen <strong>of</strong> three different classes <strong>of</strong> drugs (nucleoside<br />
analog reverse transcriptase <strong>in</strong>hibitors,<br />
NRTIs; nonnucleoside reverse transcriptase <strong>in</strong>hibitors,<br />
NNRTIs; and protease <strong>in</strong>hibitors),<br />
HAART has <strong>the</strong> ability to effectively suppress<br />
HIV-1 viral replication (4,5). However, <strong>the</strong><br />
treatment is associated with a number <strong>of</strong> adverse<br />
effects that have short-term and long-term<br />
consequences rang<strong>in</strong>g from mild to severe (6).<br />
<strong>Adverse</strong> reactions were reported <strong>in</strong> up to 50%<br />
<strong>of</strong> patients treated with ART, <strong>in</strong>clud<strong>in</strong>g gastro<strong>in</strong>test<strong>in</strong>al,<br />
metabolic, neurologic, and dermatologic<br />
effects (7). Moreover, some adverse effects<br />
may result <strong>in</strong> <strong>in</strong>creased morbidity and represent<br />
additional risk factors for future complications<br />
that require treatment <strong>in</strong>terruptions along with<br />
<strong>the</strong>rapeutic drug monitor<strong>in</strong>g for management<br />
(8). Studies have <strong>in</strong>dicated that adverse effects<br />
<strong>of</strong> ART are a major cause <strong>of</strong> treatment discon-<br />
and <strong>the</strong> pattern <strong>of</strong> signal<strong>in</strong>g over time between<br />
<strong>the</strong>se methods. The ROR and <strong>the</strong> BCPNN<br />
methods identified <strong>the</strong> associations between<br />
ART drugs and serious ADRs at <strong>the</strong> same time.<br />
Both methods were similar <strong>in</strong> detect<strong>in</strong>g <strong>the</strong> first<br />
signal <strong>of</strong> a potential ADR. However, <strong>the</strong> pattern<br />
<strong>of</strong> signal<strong>in</strong>g seems relatively different with<br />
each method. Additional analyses <strong>of</strong> different<br />
drugs, ADRs, and databases will contribute to<br />
<strong>in</strong>crease understand<strong>in</strong>g <strong>of</strong> methods for postmarket<strong>in</strong>g<br />
surveillance us<strong>in</strong>g spontaneous report<strong>in</strong>g<br />
system.<br />
t<strong>in</strong>uation and patient nonadherence, which<br />
may lead to drug resistance and treatment failure<br />
(9–11). Although adverse effects have been<br />
assessed <strong>in</strong> cl<strong>in</strong>ical trials, <strong>the</strong>se trials have several<br />
limitations, <strong>in</strong>clud<strong>in</strong>g small sample size,<br />
short duration <strong>of</strong> follow-up, and homogeneous<br />
patient populations, which limit opportunities<br />
to identify rare, serious, and long-term adverse<br />
events (12). Spontaneous report<strong>in</strong>g systems<br />
(SRSs) play a major role <strong>in</strong> postmarket<strong>in</strong>g safety<br />
surveillance and aim to detect drug safety signals<br />
as early as possible <strong>in</strong> an environment that<br />
is representative <strong>of</strong> drug use outside <strong>of</strong> <strong>the</strong> cl<strong>in</strong>ical<br />
trial sett<strong>in</strong>g.<br />
Accord<strong>in</strong>g to <strong>the</strong> WHO, a signal is def<strong>in</strong>ed as<br />
“reported <strong>in</strong>formation on a possible causal relationship<br />
between an adverse event and a drug,<br />
<strong>of</strong> which <strong>the</strong> relationship is unknown or <strong>in</strong>completely<br />
documented previously.” In SRS, a signal<br />
is a statistical association between a drug and<br />
an adverse drug reaction (ADR) that is considered<br />
important to <strong>in</strong>vestigate fur<strong>the</strong>r, and that<br />
may provide new <strong>in</strong>formation about an unknown<br />
association or additional <strong>in</strong>formation<br />
about a previously known association (13,14).<br />
Several statistical methods have been used to<br />
Submitted for publication: April 9, 2009<br />
Accepted for publication: November 5, 2009
394 p h a r m a c o v i g i l a n c e<br />
Bunchuailua et al.<br />
screen and identify a signal <strong>in</strong> spontaneous report<strong>in</strong>g<br />
databases (15–18). These statistical<br />
methods are based on <strong>the</strong> measures <strong>of</strong> disproportionality<br />
<strong>of</strong> report<strong>in</strong>g, and <strong>the</strong>y detect drug-<br />
ADR pairs that are reported with higher than<br />
expected frequency compared to <strong>the</strong> background<br />
(all ADRs reported with all o<strong>the</strong>r drugs<br />
<strong>in</strong> <strong>the</strong> database). The most commonly used<br />
methods are <strong>the</strong> Bayesian confidence propagation<br />
neural network (BCPNN), which has been<br />
developed and used by <strong>the</strong> Uppsala Monitor<strong>in</strong>g<br />
Center <strong>in</strong> rout<strong>in</strong>e pharmacovigilance with its<br />
WHO database (15) and <strong>the</strong> report<strong>in</strong>g odds ratio<br />
(ROR), which has been applied <strong>in</strong> <strong>the</strong> Ne<strong>the</strong>rlands<br />
Pharmacovigilance Foundation Lareb<br />
(17) and also <strong>in</strong> <strong>Thai</strong>land.<br />
In <strong>Thai</strong>land, SRS has been employed to monitor<br />
<strong>the</strong> safety <strong>of</strong> all pharmaceutical products <strong>in</strong><br />
<strong>the</strong> market s<strong>in</strong>ce 1983. The <strong>Thai</strong> <strong>FDA</strong> utilizes <strong>the</strong><br />
ROR method to screen and detect drug safety<br />
signals from its spontaneous report<strong>in</strong>g database.<br />
Criteria to identify potential signals for<br />
fur<strong>the</strong>r <strong>in</strong>vestigation <strong>in</strong>clude <strong>the</strong> strength <strong>of</strong><br />
<strong>the</strong> statistical association between a drug and<br />
an ADR, consideration <strong>of</strong> <strong>the</strong> seriousness <strong>of</strong> <strong>the</strong><br />
event, <strong>the</strong> quality <strong>of</strong> reports, and public attention.<br />
However, whe<strong>the</strong>r ROR is <strong>the</strong> most suitable<br />
method for signal detection <strong>in</strong> <strong>the</strong> <strong>Thai</strong><br />
<strong>FDA</strong> database is unknown. The objectives <strong>of</strong> this<br />
study were to compare signal detection performance<br />
<strong>of</strong> two signal detection methods: ROR<br />
and BCPNN us<strong>in</strong>g ADR reports <strong>in</strong> <strong>the</strong> <strong>Thai</strong> <strong>FDA</strong><br />
spontaneous report<strong>in</strong>g database and to describe<br />
how <strong>the</strong> two methods can identify ADR<br />
signals associated with ART drugs with respect<br />
to tim<strong>in</strong>g and pattern <strong>of</strong> signal<strong>in</strong>g over time.<br />
m aT e r i a l S a n D m e T h o D S<br />
The <strong>Thai</strong> <strong>FDA</strong> spontaneous report<strong>in</strong>g database,<br />
which consists <strong>of</strong> more than 150,000 ADR reports<br />
and covers <strong>the</strong> period 1990 through<br />
2006, was <strong>in</strong>cluded <strong>in</strong> <strong>the</strong> analysis. These reports<br />
conta<strong>in</strong> patient demographic <strong>in</strong>formation,<br />
ADR data, and medication data. Data concern<strong>in</strong>g<br />
<strong>the</strong> ADRs and <strong>the</strong> drugs are coded<br />
us<strong>in</strong>g <strong>the</strong> WHO-<strong>Adverse</strong> <strong>Reaction</strong> Term<strong>in</strong>ology<br />
(WHO-ART) (19) and <strong>the</strong> Anatomical Therapeutic<br />
Chemical (ATC) classification system (20),<br />
respectively. In <strong>the</strong> ATC classification system,<br />
<strong>the</strong> drugs are divided <strong>in</strong>to different groups accord<strong>in</strong>g<br />
to <strong>the</strong> organ or system on which <strong>the</strong>y<br />
act and <strong>the</strong>ir chemical, pharmacological, and<br />
<strong>the</strong>rapeutic properties. ART drugs used for HIV<br />
<strong>in</strong>fection were selected us<strong>in</strong>g ATC codes beg<strong>in</strong>n<strong>in</strong>g<br />
with J05A. Reported drugs specifically suspected<br />
<strong>of</strong> caus<strong>in</strong>g <strong>the</strong> reported ADR were <strong>in</strong>dicated<br />
as S (suspected) or I (<strong>in</strong>teract<strong>in</strong>g).<br />
Concomitant drugs were coded as O (o<strong>the</strong>r).<br />
We considered <strong>the</strong> ADR when <strong>the</strong> reported<br />
ADR was marked as a Critical Term <strong>in</strong> <strong>the</strong> WHO-<br />
ART dictionary. WHO Critical Term ADRs are<br />
adverse events that suggest a serious disease<br />
state that may be fatal or life-threaten<strong>in</strong>g, or<br />
may result <strong>in</strong> prolonged hospitalization or persistent<br />
disability (21).<br />
RepoRt<strong>in</strong>g odds Ratio<br />
We used <strong>the</strong> report as <strong>the</strong> unit <strong>of</strong> analysis for<br />
calculat<strong>in</strong>g ROR. On <strong>the</strong> basis <strong>of</strong> case/noncase<br />
analysis, ROR is <strong>the</strong> product <strong>of</strong> <strong>the</strong> exposure<br />
odds among <strong>the</strong> reported cases <strong>of</strong> <strong>the</strong> ADR <strong>of</strong><br />
<strong>in</strong>terest with respect to <strong>the</strong> exposure odds<br />
among <strong>the</strong> reported noncases (22). The cases<br />
are <strong>the</strong> reports describ<strong>in</strong>g <strong>the</strong> ADR <strong>of</strong> <strong>in</strong>terest,<br />
and noncases are all <strong>of</strong> <strong>the</strong> o<strong>the</strong>r ADR reports<br />
<strong>in</strong>cluded <strong>in</strong> <strong>the</strong> database. The exposure is def<strong>in</strong>ed<br />
as a report with <strong>the</strong> ART drug <strong>of</strong> <strong>in</strong>terest.<br />
The calculation <strong>of</strong> ROR is based on <strong>the</strong> 2 × 2<br />
table (Figure 1). The ROR for each drug-ADR<br />
pair and its 95% confidence <strong>in</strong>terval were calculated<br />
by:<br />
a/c ad<br />
ROR = =<br />
b/d bc<br />
⎡ln(ROR)<br />
± 1.96<br />
⎣⎢<br />
95%CI = e<br />
+ + +<br />
1 1 1 1<br />
( a b c d )<br />
For this analysis, we used signal detection criteria<br />
<strong>of</strong> <strong>the</strong> <strong>Thai</strong> <strong>FDA</strong> consist<strong>in</strong>g <strong>of</strong> ROR > 1, lower<br />
limit <strong>of</strong> 95% CI > 1, and three or more case<br />
reports to identify a possible signal (23).<br />
Bayesian ConfidenCe pRopagation<br />
neuRal netwoRk<br />
The BCPNN methodology uses neural network<br />
architecture to identify dependencies between<br />
variables with<strong>in</strong> <strong>the</strong> SRS database and measures<br />
⎤<br />
⎦⎥
<strong>Detection</strong> <strong>of</strong> <strong>Adverse</strong> <strong>Drug</strong> <strong>Reaction</strong> <strong>Signals</strong> p h a r m a c o v i g i l a n c e 395<br />
Reports with drug <strong>of</strong> <strong>in</strong>terest (exposed)<br />
Reports without <strong>the</strong> drug <strong>of</strong> <strong>in</strong>terest (unexposed)<br />
how <strong>the</strong> dependencies change with additional<br />
data (15,24). A measure <strong>of</strong> disproportionality<br />
called <strong>the</strong> <strong>in</strong>formation component (IC) is used<br />
to measure <strong>the</strong> strength <strong>of</strong> <strong>the</strong> quantitative dependency<br />
between a drug and an ADR. The IC<br />
value is based on <strong>the</strong> number <strong>of</strong> reports with a<br />
particular drug, <strong>the</strong> number <strong>of</strong> reports with a<br />
particular ADR, <strong>the</strong> number <strong>of</strong> reports with <strong>the</strong><br />
specific drug-ADR pair, and <strong>the</strong> total number <strong>of</strong><br />
reports <strong>in</strong> <strong>the</strong> database. A positive IC value <strong>in</strong>dicates<br />
that a particular drug-ADR pair is reported<br />
<strong>in</strong> <strong>the</strong> database more frequently than statistically<br />
expected from <strong>the</strong> rest <strong>of</strong> <strong>the</strong> reports <strong>in</strong><br />
<strong>the</strong> database, while a negative IC value <strong>in</strong>dicates<br />
that <strong>the</strong> drug-ADR pair is occurr<strong>in</strong>g less<br />
frequently than statistically expected <strong>in</strong> <strong>the</strong> database.<br />
The higher <strong>the</strong> value <strong>of</strong> <strong>the</strong> IC, <strong>the</strong> more<br />
<strong>the</strong> drug-ADR pair stands out from <strong>the</strong> background<br />
(24). New data may cause <strong>the</strong> IC to ei<strong>the</strong>r<br />
<strong>in</strong>crease or decrease. If a positive IC value<br />
<strong>in</strong>creases over time and <strong>the</strong> confidence <strong>in</strong>terval<br />
narrows, this shows a likelihood <strong>of</strong> a positive<br />
quantitative association between a drug and an<br />
ADR. The values for <strong>the</strong> IC and its variance were<br />
calculated accord<strong>in</strong>g to Bate et al. (15). In<br />
Bayesian statistics we use SDs ra<strong>the</strong>r than SEs<br />
s<strong>in</strong>ce we refer to <strong>the</strong> posterior distribution <strong>of</strong><br />
<strong>the</strong> parameter and do not refer to parameter estimates.<br />
As <strong>the</strong> IC is <strong>the</strong> logarithm <strong>of</strong> <strong>the</strong> ratio <strong>of</strong><br />
<strong>the</strong> posterior and prior probabilities, it represents<br />
<strong>the</strong> change <strong>in</strong> probability on addition <strong>of</strong><br />
new data. It allows <strong>the</strong> calculation <strong>of</strong> <strong>the</strong> IC as a<br />
distribution, ra<strong>the</strong>r than just a po<strong>in</strong>t estimate,<br />
based on prior and posterior distributions. We<br />
calculated <strong>the</strong> standard deviation (SD) for <strong>the</strong><br />
IC to assess <strong>the</strong> criterion for possible signal detection.<br />
A possible signal was considered if <strong>the</strong><br />
<strong>Drug</strong> Information Journal<br />
Reports with <strong>the</strong><br />
ADR <strong>of</strong> <strong>in</strong>terest<br />
(cases)<br />
Reports without <strong>the</strong><br />
ADR <strong>of</strong> <strong>in</strong>terest<br />
(noncases)<br />
a b<br />
c d<br />
a = number <strong>of</strong> reports with mention <strong>of</strong> both <strong>the</strong> drug and ADR <strong>of</strong> <strong>in</strong>terest<br />
b = number <strong>of</strong> reports with mention <strong>of</strong> <strong>the</strong> drug <strong>of</strong> <strong>in</strong>terest but not <strong>the</strong> ADR <strong>of</strong> <strong>in</strong>terest<br />
c = number <strong>of</strong> reports with mention <strong>of</strong> <strong>the</strong> ADR <strong>of</strong> <strong>in</strong>terest but not <strong>the</strong> drug <strong>of</strong> <strong>in</strong>terest<br />
d = number <strong>of</strong> reports with mention <strong>of</strong> nei<strong>the</strong>r <strong>the</strong> drug nor ADR <strong>of</strong> <strong>in</strong>terest<br />
difference between IC and 2*SD (IC-2SD) was<br />
greater than zero (15,24).<br />
CompaRative analysis<br />
As we were <strong>in</strong>terested <strong>in</strong> serious ADRs associated<br />
with ARV drugs, we evaluated <strong>the</strong> seriousness<br />
<strong>of</strong> <strong>the</strong> reactions <strong>of</strong> all ADRs reported with<br />
ARV <strong>in</strong> <strong>the</strong> database and considered only serious<br />
reactions. For this analysis, we selected two<br />
serious adverse reaction terms, “lactic acidosis”<br />
and “hepatitis,” for consideration as ADRs <strong>of</strong> <strong>in</strong>terest.<br />
Lactic acidosis was chosen as a case<br />
study ADR that represents a specificity <strong>of</strong> an<br />
ADR associated with an ART drug. For hepatitis,<br />
<strong>the</strong> ADR was chosen as a representative <strong>of</strong> an<br />
ADR that can generally be associated with all<br />
drugs. In addition, <strong>the</strong> related adverse reaction<br />
terms “lactate blood <strong>in</strong>crease” and “hepatitis<br />
toxic” were selected and comb<strong>in</strong>ed with lactic<br />
acidosis and hepatitis, respectively. Associations<br />
between each ART drug and each <strong>of</strong> <strong>the</strong><br />
two ADRs were analyzed us<strong>in</strong>g <strong>the</strong> ROR and<br />
BCPNN methods. ROR with its 95% CI, and IC<br />
with its SD, were computed for ART drugs that<br />
were reported with those ADRs <strong>of</strong> <strong>in</strong>terest at<br />
quarterly (3-month) time <strong>in</strong>tervals. The signal<br />
detection was performed not only on <strong>the</strong> suspected<br />
(S) or <strong>in</strong>teract<strong>in</strong>g (I) drug-ADR pairs but<br />
also on <strong>the</strong> concomitant drug-ADR pairs (coded<br />
as O). S<strong>in</strong>ce reported drugs were assessed as be<strong>in</strong>g<br />
suspected <strong>of</strong> hav<strong>in</strong>g caused <strong>the</strong> reaction, as<br />
<strong>in</strong>teract<strong>in</strong>g drugs, or as concomitant medications<br />
accord<strong>in</strong>g to <strong>the</strong> health pr<strong>of</strong>essionals’<br />
op<strong>in</strong>ion on <strong>the</strong> relationship between <strong>the</strong> drug<br />
and <strong>the</strong> reaction, we decided also to <strong>in</strong>clude<br />
ART drugs that were reported as concomitant<br />
drugs <strong>in</strong> this analysis. Moreover, we separately<br />
F i g U r e 1<br />
The 2 × 2 table for calculation<br />
<strong>of</strong> ROR.
396 p h a r m a c o v i g i l a n c e<br />
Bunchuailua et al.<br />
T a B l e 1<br />
Total Number <strong>of</strong> Reports for Lactic Acidosis<br />
<strong>in</strong> <strong>the</strong> <strong>Database</strong><br />
Lactic Acidosis<br />
Time All Reports <strong>of</strong><br />
(Year/Quarter) Reports Stavud<strong>in</strong>e<br />
2001/4 2 1<br />
2002/1 4 3<br />
2002/2 4 3<br />
2002/3 4 3<br />
2002/4 5 4<br />
2003/1 6 5<br />
2003/2 6 5<br />
2003/3 8 7<br />
2003/4 9 8<br />
2004/1 10 9<br />
2004/2 11 10<br />
2004/3 16 15<br />
2004/4 18 17<br />
2005/1 29 27<br />
2005/2 40 36<br />
2005/3 58 52<br />
2005/4 70 61<br />
2006/1 75 64<br />
2006/2 82 69<br />
2006/3 88 75<br />
2006/4 94 77<br />
analyzed drug-ADR pairs reported with comb<strong>in</strong>ation<br />
drug products (eg, GPO-Vir) for each<br />
s<strong>in</strong>gle drug (ie, stavud<strong>in</strong>e, lamivud<strong>in</strong>e, and nevirap<strong>in</strong>e)<br />
when a reported drug was a comb<strong>in</strong>ation<br />
drug product.<br />
We plotted ROR with its 95% CI, and IC with<br />
its IC ± 2SD, aga<strong>in</strong>st time for each drug-ADR<br />
pair to compare <strong>the</strong> differential tim<strong>in</strong>g <strong>of</strong> signal<br />
identification and <strong>the</strong> change <strong>in</strong> values over<br />
time between <strong>the</strong> two methods.<br />
r e S U lT S<br />
From January 1990 until December 2006, <strong>the</strong><br />
total numbers <strong>of</strong> reports <strong>of</strong> lactic acidosis/lac-<br />
tate blood <strong>in</strong>crease and hepatitis/hepatitis toxic<br />
<strong>in</strong> <strong>the</strong> database were 94 and 953, respectively.<br />
Of <strong>the</strong>se, 81 <strong>of</strong> lactic acidosis/lactate blood <strong>in</strong>crease<br />
and 277 <strong>of</strong> hepatitis/hepatitis toxic were<br />
reported for <strong>the</strong> ART drugs. The total number <strong>of</strong><br />
reports <strong>of</strong> lactic acidosis/lactate blood <strong>in</strong>crease<br />
for all drugs and stavud<strong>in</strong>e <strong>in</strong> each quarter is<br />
presented <strong>in</strong> Table 1. For hepatitis/hepatitis<br />
toxic, <strong>the</strong> total number <strong>of</strong> reports for all drugs<br />
and nevirap<strong>in</strong>e is presented <strong>in</strong> Table 2.<br />
Of <strong>the</strong> reports <strong>of</strong> lactic acidosis/lactate blood<br />
<strong>in</strong>crease, 77 (82%) were reported with stavud<strong>in</strong>e.<br />
The first case <strong>of</strong> lactic acidosis/lactate<br />
blood <strong>in</strong>crease with ART drugs was <strong>in</strong>troduced<br />
<strong>in</strong>to <strong>the</strong> database <strong>in</strong> <strong>the</strong> fourth quarter <strong>of</strong> 2001,<br />
correspond<strong>in</strong>g to a case <strong>of</strong> stavud<strong>in</strong>e. The development<br />
<strong>of</strong> <strong>the</strong> association between stavud<strong>in</strong>e<br />
and lactic acidosis is presented <strong>in</strong> Figures 2 and<br />
3. The first occurrence <strong>of</strong> signal identification<br />
was <strong>in</strong> <strong>the</strong> first quarter <strong>of</strong> 2002, when three cases<br />
<strong>of</strong> <strong>the</strong> association were <strong>in</strong>cluded. At that time<br />
<strong>the</strong> association was identified by both BCPNN<br />
(IC 1.99; IC ± 2SD 0.03 to 3.96) and ROR (ROR<br />
2571.81; 95% CI 264.15 to 25039.84) methods.<br />
For <strong>the</strong> BCPNN method, <strong>the</strong> IC value <strong>in</strong>creased<br />
considerably, and <strong>the</strong> confidence <strong>in</strong>terval decreased<br />
over time (Figure 2). The signal was<br />
clearly established as <strong>in</strong>dicated by stabiliz<strong>in</strong>g IC<br />
values from <strong>the</strong> third quarter <strong>of</strong> 2005, when <strong>the</strong><br />
IC was 4.59 (IC-2SD = 4.04) until 2006. In<br />
contrast to <strong>the</strong> IC value, <strong>the</strong> ROR value <strong>in</strong>creased<br />
from 2001 until <strong>the</strong> first quarter <strong>of</strong><br />
2002 when <strong>the</strong> association met <strong>the</strong> signal detection<br />
criteria and decreased until <strong>the</strong> second<br />
quarter <strong>of</strong> 2003 (Figure 3). The ROR values<br />
fluctuated between 2003 and 2004 and <strong>the</strong>n<br />
decreased cont<strong>in</strong>uously until 2006.<br />
Among reports <strong>of</strong> hepatitis/hepatitis toxic <strong>in</strong><br />
<strong>the</strong> database, 244 (26%) were reported <strong>in</strong> association<br />
with nevirap<strong>in</strong>e. The strength <strong>of</strong> <strong>the</strong> association<br />
over time between nevirap<strong>in</strong>e and<br />
hepatitis is presented <strong>in</strong> Figures 4 and 5. The<br />
first case <strong>of</strong> hepatitis/hepatitis toxic with nevirap<strong>in</strong>e<br />
was <strong>in</strong>troduced <strong>in</strong>to <strong>the</strong> database <strong>in</strong> <strong>the</strong><br />
fourth quarter <strong>of</strong> 2002. In <strong>the</strong> first quarter <strong>of</strong><br />
2003, when <strong>the</strong> IC-2SD values were above zero<br />
and <strong>the</strong> lower limit <strong>of</strong> 95% CI <strong>of</strong> ROR values<br />
were greater than 1, <strong>the</strong> association was identi-
<strong>Detection</strong> <strong>of</strong> <strong>Adverse</strong> <strong>Drug</strong> <strong>Reaction</strong> <strong>Signals</strong> p h a r m a c o v i g i l a n c e 397<br />
fied as a signal by both methods. At that time,<br />
<strong>the</strong> IC value was 2.32 (IC ± 2SD 1.33 to 3.32)<br />
and <strong>the</strong> ROR value was 10.79 (95% CI 5.26 to<br />
22.13) when eight cases <strong>of</strong> <strong>the</strong> association were<br />
<strong>in</strong>cluded. For <strong>the</strong> BCPNN, <strong>the</strong> IC value <strong>in</strong>creased<br />
substantially and its confidence <strong>in</strong>terval<br />
became narrow (Figure 4). The association<br />
was clearly established as <strong>in</strong>dicated by stabiliz<strong>in</strong>g<br />
IC values from <strong>the</strong> third quarter <strong>of</strong> 2004,<br />
when <strong>the</strong> IC was 3.82 (IC ± 2SD 3.44 to 4.19)<br />
until 2006. Similarly, <strong>the</strong> ROR value <strong>in</strong>creased<br />
significantly and <strong>the</strong> 95% CI decreased over<br />
time until <strong>the</strong> third quarter <strong>of</strong> 2004 (Figure 5).<br />
Although <strong>the</strong>re were fluctuat<strong>in</strong>g values <strong>of</strong> ROR<br />
between 2004 and 2005, <strong>the</strong> signal appeared<br />
stable from <strong>the</strong> first quarter <strong>of</strong> 2006.<br />
D i S c U S S i o n<br />
This is <strong>the</strong> first published study <strong>of</strong> signal detection<br />
report<strong>in</strong>g us<strong>in</strong>g <strong>the</strong> <strong>Thai</strong> <strong>FDA</strong> database that<br />
compares two methods <strong>of</strong> signal detection. We<br />
chose lactic acidosis as a representative <strong>of</strong> specific<br />
ADRs and hepatitis as a representative <strong>of</strong><br />
common ADRs for <strong>the</strong> analysis.<br />
Lactic acidosis is a rare but potentially fatal<br />
complication <strong>of</strong> NRTI <strong>the</strong>rapy for HIV <strong>in</strong>fection<br />
(25–29). Although all NRTIs are associated with<br />
lactic acidosis and hyperlactatemia, people tak<strong>in</strong>g<br />
stavud<strong>in</strong>e seem to be at greater risk than<br />
people tak<strong>in</strong>g o<strong>the</strong>r NRTIs (28–30). The proposed<br />
mechanism for lactic acidosis and o<strong>the</strong>r<br />
adverse reactions (eg, myopathy, neuropathy,<br />
pancreatitis, and peripheral lipoatrophy) associated<br />
with NRTIs is suggested to be via <strong>in</strong>hibition<br />
<strong>of</strong> mitochondrial DNA polymerase gamma,<br />
result<strong>in</strong>g <strong>in</strong> impaired syn<strong>the</strong>sis <strong>of</strong> mitochondrial<br />
enzymes that generate ATP by oxidative phosphorylation<br />
(6). Lactic acidosis is a recognized<br />
adverse reaction that has been listed on <strong>the</strong> label<br />
<strong>of</strong> stavud<strong>in</strong>e. However, <strong>the</strong> US <strong>FDA</strong> recently<br />
revised <strong>the</strong> boxed warn<strong>in</strong>g label on stavud<strong>in</strong>e as<br />
a result <strong>of</strong> <strong>the</strong> <strong>in</strong>creas<strong>in</strong>g number <strong>of</strong> fatal lactic<br />
acidosis cases (31).<br />
Hepatotoxicity is a general term for liver damage.<br />
It <strong>in</strong>cludes such conditions as hepatitis,<br />
hepatic necrosis, and hepatic steatosis (32). In<br />
this study, we were <strong>in</strong>terested <strong>in</strong> detect<strong>in</strong>g signal<br />
for hepatitis specifically and not all hepato-<br />
<strong>Drug</strong> Information Journal<br />
Total Number <strong>of</strong> Reports for Hepatitis<br />
<strong>in</strong> <strong>the</strong> <strong>Database</strong><br />
Hepatitis<br />
Time All Reports <strong>of</strong><br />
(Year/Quarter) Reports Nevirap<strong>in</strong>e<br />
2002/4 290 2<br />
2003/1 330 8<br />
2003/2 358 10<br />
2003/3 383 15<br />
2003/4 413 25<br />
2004/1 454 39<br />
2004/2 491 53<br />
2004/3 543 72<br />
2004/4 570 85<br />
2005/1 623 113<br />
2005/2 680 145<br />
2005/3 754 191<br />
2005/4 798 207<br />
2006/1 841 214<br />
2006/2 870 221<br />
2006/3 921 236<br />
2006/4 953 244<br />
toxicity reactions. Hepatotoxicity can occur<br />
with many medications and has been reported<br />
with many antiretroviral drugs used <strong>in</strong> HAART.<br />
Among NNRTIs, nevirap<strong>in</strong>e is <strong>the</strong> drug most<br />
frequently associated with hepatotoxicity. The<br />
occurrence <strong>of</strong> hepatotoxicity was 12.5–17% <strong>in</strong><br />
nevirap<strong>in</strong>e-treated patients (33,34). Moreover,<br />
safety warn<strong>in</strong>g <strong>in</strong>formation about <strong>the</strong> risk <strong>of</strong> severe,<br />
life-threaten<strong>in</strong>g hepatotoxicity, <strong>in</strong>clud<strong>in</strong>g<br />
hepatitis, has been added to <strong>the</strong> product label<strong>in</strong>g<br />
for nevirap<strong>in</strong>e (35). Two mechanisms have<br />
been <strong>in</strong>volved <strong>in</strong> nevirap<strong>in</strong>e-associated hepatitis.<br />
The first mechanism is immune-mediated;<br />
<strong>the</strong> second mechanism (with a delayed onset)<br />
seems to reflect metabolic idiosyncrasy (36,37).<br />
A retrospective analysis <strong>of</strong> spontaneous ADR<br />
reports <strong>in</strong> <strong>the</strong> <strong>Thai</strong> <strong>FDA</strong> database showed <strong>the</strong><br />
statistical associations between stavud<strong>in</strong>e and<br />
T a B l e 2
398 p h a r m a c o v i g i l a n c e<br />
Bunchuailua et al.<br />
F i g U r e 2<br />
The development <strong>of</strong> <strong>the</strong> association<br />
between stavud<strong>in</strong>e<br />
and lactic acidosis<br />
us<strong>in</strong>g <strong>the</strong> BCPNN method<br />
(Po<strong>in</strong>t 1, first time that<br />
<strong>the</strong> IC met <strong>the</strong> signal detection<br />
criteria).<br />
F i g U r e 3<br />
The development <strong>of</strong> <strong>the</strong><br />
association between<br />
stavud<strong>in</strong>e and lactic acidosis<br />
us<strong>in</strong>g <strong>the</strong> ROR method<br />
(Po<strong>in</strong>t 1, first time that<br />
<strong>the</strong> ROR met <strong>the</strong> signal<br />
detection criteria). Some<br />
outliers <strong>of</strong> <strong>the</strong> upper limit<br />
<strong>of</strong> 95% CI were discarded<br />
from <strong>the</strong> graph.<br />
Information Component<br />
Report<strong>in</strong>g Odds Ratio<br />
6<br />
5<br />
4<br />
3<br />
2<br />
1<br />
0<br />
–1<br />
–2<br />
3000<br />
2700<br />
2400<br />
2100<br />
1800<br />
1500<br />
1200<br />
900<br />
600<br />
300<br />
0<br />
1<br />
Stavud<strong>in</strong>e-Lactic Acidosis<br />
1998/2<br />
1998/3<br />
1998/4<br />
1999/4<br />
2000/1<br />
2000/4<br />
2001/1<br />
2001/2<br />
2001/3<br />
2001/4<br />
2002/1<br />
2002/2<br />
2002/3<br />
2002/4<br />
2003/1<br />
2003/2<br />
2003/3<br />
2003/4<br />
2004/1<br />
2004/2<br />
2004/3<br />
2004/4<br />
2005/1<br />
2005/2<br />
2005/3<br />
2005/4<br />
2006/1<br />
2006/2<br />
2006/3<br />
2006/4<br />
lactic acidosis, and nevirap<strong>in</strong>e and hepatitis.<br />
The results support <strong>the</strong> evidence <strong>of</strong> risks <strong>of</strong> lactic<br />
acidosis and hepatitis associated with ART<br />
drugs as <strong>in</strong>dicated previously. A spontaneous<br />
report<strong>in</strong>g system represents an essential and<br />
cost-efficient way <strong>of</strong> detect<strong>in</strong>g signals that may<br />
1<br />
Stavud<strong>in</strong>e-Lactic Acidosis<br />
1998/2<br />
1998/3<br />
1998/4<br />
1999/4<br />
2000/1<br />
2000/4<br />
2001/1<br />
2001/2<br />
2001/3<br />
2001/4<br />
2002/1<br />
2002/2<br />
2002/3<br />
2002/4<br />
2003/1<br />
2003/2<br />
2003/3<br />
2003/4<br />
2004/1<br />
2004/2<br />
2004/3<br />
2004/4<br />
2005/1<br />
2005/2<br />
2005/3<br />
2005/4<br />
2006/1<br />
2006/2<br />
2006/3<br />
2006/4<br />
Time (Year/Quarter)<br />
IC IC-2SD IC+2SD<br />
Time (Year/Quarter)<br />
ROR Lower 95% CI Upper 95% CI<br />
refer to unknown association or additional <strong>in</strong>formation<br />
about a previously known association.<br />
However, it cannot be used to establish a<br />
causal association between a drug and an adverse<br />
event; associations may be present because<br />
<strong>the</strong> reaction is more frequent or more <strong>of</strong>-
<strong>Detection</strong> <strong>of</strong> <strong>Adverse</strong> <strong>Drug</strong> <strong>Reaction</strong> <strong>Signals</strong> p h a r m a c o v i g i l a n c e 399<br />
Information Component<br />
Report<strong>in</strong>g Odds Ratio<br />
5<br />
4<br />
3<br />
2<br />
1<br />
0<br />
–1<br />
–2<br />
30<br />
25<br />
20<br />
15<br />
10<br />
5<br />
0<br />
2000/3<br />
2001/1<br />
2000/3<br />
2001/1<br />
2001/2<br />
2001/3<br />
2001/2<br />
2001/3<br />
2001/4<br />
2002/1<br />
2001/4<br />
2002/1<br />
<strong>Drug</strong> Information Journal<br />
2002/2<br />
2002/3<br />
2002/2<br />
2002/3<br />
1<br />
2002/4<br />
2003/1<br />
1<br />
2002/4<br />
2003/1<br />
ten reported. Once a signal has been identified,<br />
it needs careful review with regard to both scientific<br />
credibility and cl<strong>in</strong>ical relevance followed<br />
by pharmacoepidemiology studies to fur<strong>the</strong>r<br />
evaluate a causal relationship.<br />
Nevirap<strong>in</strong>e-Hepatitis<br />
2003/2<br />
2003/3<br />
2003/4<br />
2004/1<br />
Time (Year/Quarter)<br />
2004/2<br />
2004/3<br />
IC IC-2SD IC+2SD<br />
Nevirap<strong>in</strong>e-Hepatitis<br />
2003/2<br />
2003/3<br />
2003/4<br />
2004/1<br />
Time (Year/Quarter)<br />
2004/2<br />
2004/3<br />
2004/4<br />
2005/1<br />
2004/4<br />
2005/1<br />
ROR Lower 95% CI Upper 95% CI<br />
2005/2<br />
2005/3<br />
2005/2<br />
2005/3<br />
2005/4<br />
2006/1<br />
2005/4<br />
2006/1<br />
2006/2<br />
2006/3<br />
2006/2<br />
2006/3<br />
2006/4<br />
2006/4<br />
Although this study showed that both <strong>the</strong><br />
BCPNN and <strong>the</strong> ROR methods could be used to<br />
detect serious adverse reactions, a generalization<br />
cannot be made from this result. Particularly<br />
with HIV <strong>in</strong>fection, causal associations be-<br />
F i g U r e 4<br />
The development <strong>of</strong> <strong>the</strong><br />
association between nevirap<strong>in</strong>e<br />
and hepatitis us<strong>in</strong>g<br />
<strong>the</strong> BCPNN method<br />
(Po<strong>in</strong>t 1, first time that<br />
<strong>the</strong> IC met <strong>the</strong> signal detection<br />
criteria).<br />
F i g U r e 5<br />
The development <strong>of</strong> <strong>the</strong><br />
association between nevirap<strong>in</strong>e<br />
and hepatitis us<strong>in</strong>g<br />
<strong>the</strong> ROR method (Po<strong>in</strong>t 1,<br />
first time that <strong>the</strong> ROR<br />
met <strong>the</strong> signal detection<br />
criteria).
400 p h a r m a c o v i g i l a n c e<br />
Bunchuailua et al.<br />
tween drugs and adverse events are so <strong>of</strong>ten<br />
complicated by <strong>the</strong> multiplicity <strong>of</strong> treatments<br />
that any drug might be <strong>the</strong> cause <strong>of</strong> toxic effects,<br />
and <strong>the</strong> disease is itself a risk factor for<br />
<strong>the</strong> adverse event <strong>of</strong> <strong>in</strong>terest.<br />
We found that, us<strong>in</strong>g our criteria for signal<br />
detection, BCPNN and ROR detect serious<br />
known ADRs (lactic acidosis and hepatitis) associated<br />
with ART at <strong>the</strong> same time. There are<br />
limited data on <strong>the</strong> differential tim<strong>in</strong>g <strong>of</strong> signal<br />
detection when compar<strong>in</strong>g between simple<br />
(ROR) and Bayesian (BCPNN) methods. However,<br />
results from previous comparative studies<br />
showed that simple method-proportional report<strong>in</strong>g<br />
ratio generates signals <strong>in</strong> advance <strong>of</strong><br />
Bayesian method multi-item gamma Poisson<br />
shr<strong>in</strong>ker by several years (38,39). This might expla<strong>in</strong><br />
<strong>the</strong> variation between signal detection<br />
criteria, especially <strong>the</strong> m<strong>in</strong>imum number <strong>of</strong> case<br />
reports (cell a <strong>in</strong> <strong>the</strong> 2 × 2 table, Figure 1) required<br />
for signal identification. The ROR method<br />
would detect signals for both serious adverse<br />
reactions, at <strong>the</strong> first time <strong>the</strong> drug-ADR pair<br />
was <strong>in</strong>troduced, <strong>in</strong> advance <strong>of</strong> BCPNN, regardless<br />
<strong>of</strong> <strong>the</strong> number <strong>of</strong> case reports (lower limit<br />
95% CI ROR lactic acidosis = 71, a = 1; lower limit<br />
95% CI ROR hepatitis = 1.13, a = 2). This means<br />
that if we reduce <strong>the</strong> m<strong>in</strong>imum number <strong>of</strong> case<br />
reports, <strong>the</strong> ROR will be more sensitive than <strong>the</strong><br />
BCPNN. On <strong>the</strong> o<strong>the</strong>r hand, it may result <strong>in</strong> an<br />
<strong>in</strong>crease <strong>of</strong> false-positive signals.<br />
Regard<strong>in</strong>g pattern <strong>of</strong> signal development,<br />
BCPNN showed an <strong>in</strong>crease <strong>of</strong> <strong>the</strong> IC value over<br />
time for stavud<strong>in</strong>e-lactic acidosis and nevirap<strong>in</strong>e-hepatitis<br />
associations as well. As <strong>the</strong> number<br />
<strong>of</strong> reports <strong>of</strong> drug-ADR pairs <strong>in</strong>creases, and<br />
as <strong>the</strong> number <strong>of</strong> reports <strong>of</strong> <strong>the</strong> drug and <strong>the</strong><br />
ADR <strong>in</strong>creases, so <strong>the</strong> CI estimate <strong>of</strong> <strong>the</strong> IC decreases.<br />
Bate et al. have reported that “<strong>the</strong> confidence<br />
<strong>in</strong>terval estimate <strong>of</strong> an IC becomes narrow<br />
as time passes is <strong>the</strong> property <strong>of</strong> all<br />
drug-ADR time scan s<strong>in</strong>ce <strong>the</strong> estimation is<br />
based on more reports and <strong>the</strong> IC stabilizes.<br />
Therefore, a stabilized positive IC value for<br />
drug-ADR association may imply an ever-<strong>in</strong>creas<strong>in</strong>g<br />
likelihood <strong>of</strong> a true signal as fur<strong>the</strong>r<br />
reports are added to <strong>the</strong> database” (15).<br />
Although both <strong>the</strong> ROR and BCPNN methods<br />
identified <strong>the</strong> <strong>in</strong>itial signals at <strong>the</strong> same quarter,<br />
<strong>the</strong> pattern changes over time seem relatively<br />
different with each method. The BCPNN values<br />
<strong>in</strong>creased over time, with decreas<strong>in</strong>g 95% CI,<br />
for both stavud<strong>in</strong>e-lactic acidosis and nevirap<strong>in</strong>e-hepatitis.<br />
However, <strong>the</strong> ROR value <strong>in</strong>creased<br />
over time for <strong>the</strong> nevirap<strong>in</strong>e-hepatitis association<br />
whereas <strong>the</strong> ROR value for <strong>the</strong> stavud<strong>in</strong>elactic<br />
acidosis association decreased. The decreas<strong>in</strong>g<br />
<strong>of</strong> <strong>the</strong> association over time for <strong>the</strong><br />
ROR method may be due to <strong>the</strong> nature <strong>of</strong> lactic<br />
acidosis, which is rare and more likely specific<br />
to ART. Moreover, when consider<strong>in</strong>g <strong>the</strong> report<strong>in</strong>g<br />
<strong>of</strong> stavud<strong>in</strong>e, which also is reported with<br />
many o<strong>the</strong>r adverse reactions, <strong>the</strong> association<br />
may also be decreased if ano<strong>the</strong>r reaction, specific<br />
to <strong>the</strong> drug, is more frequently reported,<br />
thus dilut<strong>in</strong>g <strong>the</strong>ir association by <strong>in</strong>creas<strong>in</strong>g<br />
<strong>the</strong> presence <strong>of</strong> <strong>the</strong> drug <strong>in</strong> <strong>the</strong> noncase reports.<br />
The calculations <strong>of</strong> ROR and IC <strong>in</strong> this study<br />
were performed without stratification s<strong>in</strong>ce we<br />
avoided <strong>the</strong> presence <strong>of</strong> any very small strata<br />
due to <strong>the</strong> limited size <strong>of</strong> our data set. Although<br />
stratification can be used to reduce confound<strong>in</strong>g,<br />
overstratification might lead to decreased<br />
sensitivity (40,41). However, it is possible to<br />
perform <strong>the</strong> calculation with standard stratification<br />
(patient age, patient sex, and time <strong>of</strong> report<strong>in</strong>g)<br />
for future studies.<br />
S<strong>in</strong>ce <strong>the</strong>re is a lack <strong>of</strong> a gold standard for signal<br />
detection <strong>in</strong> SRS databases, we cannot judge<br />
which disproportionality measure is better (or<br />
worse) than ano<strong>the</strong>r. Each method has advantages<br />
as well as disadvantages. The ROR is a<br />
transparent measure, easy to <strong>in</strong>terpret, and possible<br />
for different adjustments <strong>in</strong> logistic regression<br />
analysis (42). ROR is <strong>in</strong>dependent <strong>of</strong><br />
general underreport<strong>in</strong>g for a specific drug or a<br />
specific ADR (43,44). However, ROR calculation<br />
is impossible when <strong>the</strong> denom<strong>in</strong>ator is zero (eg,<br />
specific ADRs) and results may not be reliable<br />
when small numbers are reported <strong>in</strong> <strong>the</strong> 2 × 2<br />
table (Figure 1) (42). The BCPNN method is always<br />
applicable and large numbers <strong>of</strong> calculations<br />
can be made efficiently (42). This method<br />
has been recognized to reduce <strong>the</strong> fluctuations<br />
<strong>of</strong> disproportionate report<strong>in</strong>g associated with<br />
low report<strong>in</strong>g frequency and can protect aga<strong>in</strong>st
<strong>Detection</strong> <strong>of</strong> <strong>Adverse</strong> <strong>Drug</strong> <strong>Reaction</strong> <strong>Signals</strong> p h a r m a c o v i g i l a n c e 401<br />
generat<strong>in</strong>g multiple false positive signals due to<br />
multiple <strong>in</strong>dependent comparisons (15,43,44).<br />
As our analysis is based on <strong>the</strong> spontaneous<br />
reports, IC and ROR values are subject to <strong>the</strong><br />
biases <strong>of</strong> such report<strong>in</strong>g, <strong>in</strong>clud<strong>in</strong>g confound<strong>in</strong>g<br />
by <strong>in</strong>dication, where <strong>the</strong> disease is itself a<br />
risk factor <strong>of</strong> <strong>the</strong> event <strong>of</strong> <strong>in</strong>terest. Channel<strong>in</strong>g<br />
bias occurs when drug <strong>the</strong>rapies with<strong>in</strong> a similar<br />
<strong>the</strong>rapeutic class are preferentially prescribed<br />
to patients with different levels <strong>of</strong> disease<br />
severity, which may lead <strong>the</strong>m to be<br />
associated with <strong>the</strong> risk <strong>of</strong> <strong>the</strong> event <strong>of</strong> <strong>in</strong>terest.<br />
“Innocent bystander” results from <strong>the</strong> detection<br />
<strong>of</strong> an apparent association <strong>of</strong> a drug with an adverse<br />
event that is <strong>in</strong> fact caused by a frequently<br />
coprescribed <strong>the</strong>rapy (44).<br />
Additionally, a number <strong>of</strong> factors may <strong>in</strong>fluence<br />
<strong>the</strong> report<strong>in</strong>g <strong>of</strong> ADRs, such as background<br />
knowledge <strong>of</strong> adverse reactions and <strong>the</strong><br />
drug, health pr<strong>of</strong>essionals’ attitudes and behavior<br />
regard<strong>in</strong>g report<strong>in</strong>g ADRs, public attention<br />
(eg, media, “dear health care provider” letter),<br />
<strong>the</strong> magnitude <strong>of</strong> drug use, and time <strong>the</strong> drug<br />
has been on <strong>the</strong> market.<br />
c o n c l U S i o n<br />
In conclusion, we have reported ADR signal detection<br />
<strong>in</strong> <strong>the</strong> <strong>Thai</strong> <strong>FDA</strong> database us<strong>in</strong>g two<br />
methods. Although <strong>the</strong> methods were similar <strong>in</strong><br />
detect<strong>in</strong>g <strong>the</strong> first signal <strong>of</strong> a potential ADR, <strong>the</strong><br />
subsequent patterns <strong>of</strong> signal<strong>in</strong>g over time were<br />
different. Additional analyses <strong>of</strong> different drugs,<br />
adverse reactions, and databases will contribute<br />
to <strong>in</strong>creased understand<strong>in</strong>g <strong>of</strong> methods for<br />
postmarket<strong>in</strong>g surveillance us<strong>in</strong>g spontaneous<br />
report<strong>in</strong>g systems.<br />
Acknowledgments—We are grateful to Dr. David Olaleye<br />
(SAS Institute, Inc., Cary, NC) for his help <strong>in</strong> statistical<br />
analysis.<br />
r e F e r e n c e S<br />
1. Palella Jr FJ, Delaney KM, Moorman AC, et al. Decl<strong>in</strong><strong>in</strong>g<br />
morbidity and mortality among patients<br />
with advanced human immunodeficiency virus<br />
<strong>in</strong>fection. N Engl J Med. 1998;338:853–860.<br />
<strong>Drug</strong> Information Journal<br />
2. Crum NF, Riffenburgh RH, Wegner S, et al. Comparisons<br />
<strong>of</strong> causes <strong>of</strong> death and mortality rates<br />
among HIV-<strong>in</strong>fected persons: analysis <strong>of</strong> <strong>the</strong> pre-,<br />
early, and late HAART (highly active antiretroviral<br />
<strong>the</strong>rapy) eras. J Acquir Immune Defic Syndr.<br />
2006;41(2):194–200.<br />
3. Sterne JAC, Hernan MA, Ledergerber B, et al.<br />
Long-term effectiveness <strong>of</strong> potent antiretroviral<br />
<strong>the</strong>rapy <strong>in</strong> prevent<strong>in</strong>g AIDS and death: a prospective<br />
cohort study. Lancet. 2005;366:378–<br />
384.<br />
4. Bartlett JA, Fath MJ, DeMasi R, et al. An updated<br />
systematic overview <strong>of</strong> triple comb<strong>in</strong>ation <strong>the</strong>rapy<br />
<strong>in</strong> antiretroviral-naive HIV-<strong>in</strong>fected adults.<br />
AIDS. 2006;20:2051–2064.<br />
5. Yazdanpanah Y, Sissoko D, Egger M, Mouton Y,<br />
Zwahlen M, Chene G. Cl<strong>in</strong>ical efficacy <strong>of</strong> antiretroviral<br />
comb<strong>in</strong>ation <strong>the</strong>rapy based on protease<br />
<strong>in</strong>hibitors or non-nucleoside analogue reverse<br />
transcriptase <strong>in</strong>hibitors: <strong>in</strong>direct comparison <strong>of</strong><br />
controlled trials. BMJ. 2004;328:249–255.<br />
6. Carr A, Cooper D. <strong>Adverse</strong> effects <strong>of</strong> antiretroviral<br />
<strong>the</strong>rapy. Lancet. 2000;356:1423–1430.<br />
7. Fellay J, Ledergerber B, Bernasconi E, et al. Prevalence<br />
<strong>of</strong> adverse events associated with potent<br />
antiretroviral treatment: Swiss HIV cohort study.<br />
Lancet. 2001;358:1322–1327.<br />
8. Schiller D. Identification, management, and prevention<br />
<strong>of</strong> adverse effects associated with highly<br />
active antiretroviral <strong>the</strong>rapy. Am J Health-Syst<br />
Pharm. 2004;61:2507–2522.<br />
9. Monforte AA, Lepri AC, Rezza G, et al. Insights<br />
<strong>in</strong>to <strong>the</strong> reasons for discont<strong>in</strong>uation <strong>of</strong> <strong>the</strong> first<br />
highly active antiretroviral <strong>the</strong>rapy (HAART) regimen<br />
<strong>in</strong> a cohort <strong>of</strong> antiretroviral naive patients.<br />
AIDS. 2000;14:499–507.<br />
10. Ammassari A, Murri R, Pezzotti P, et al. Self-reported<br />
symptoms and medication side effects <strong>in</strong>fluence<br />
adherence to highly active antiretroviral<br />
<strong>the</strong>rapy <strong>in</strong> persons with HIV <strong>in</strong>fection. J Acquir<br />
Immune Defic Syndr. 2001;28:445–449.<br />
11. Yuan Y, L’Italien G, Mukherjee J, Iloeje U. Determ<strong>in</strong>ants<br />
<strong>of</strong> discont<strong>in</strong>uation <strong>of</strong> <strong>in</strong>itial highly active<br />
antiretroviral <strong>the</strong>rapy regimens <strong>in</strong> a US HIV<strong>in</strong>fected<br />
patient cohort. HIV Med. 2006;7(3):<br />
156–162.<br />
12. Bisson G, Gross R, Miller V, Weller I, Walker A.<br />
Monitor<strong>in</strong>g <strong>of</strong> long-term toxicities <strong>of</strong> HIV treat-
402 p h a r m a c o v i g i l a n c e<br />
Bunchuailua et al.<br />
ments: an <strong>in</strong>ternational perspective. AIDS. 2003;<br />
17:2407–2417.<br />
13. Bate A, L<strong>in</strong>dquist M, Edwards IR, Orre R. A data<br />
m<strong>in</strong><strong>in</strong>g approach for signal detection and analysis.<br />
<strong>Drug</strong> Saf. 2002;25:393–397.<br />
14. Shakir SAW. Thoughts on signal detection <strong>in</strong><br />
pharmacovigilance. <strong>Drug</strong> Saf. 2007;30:603–606.<br />
15. Bate A, L<strong>in</strong>dquist M, Edwards IR, et al. A Bayesian<br />
neural network method for adverse drug reaction<br />
signal generation. Eur J Cl<strong>in</strong> Pharmacol. 1998;<br />
54:315–321.<br />
16. Evans SJW, Waller PC, Davis S. Use <strong>of</strong> proportional<br />
report<strong>in</strong>g ratios (PRRs) for signal generation<br />
from spontaneous adverse drug reaction<br />
reports. Pharmacoepidemiol <strong>Drug</strong> Saf. 2001;10:<br />
483–486.<br />
17. Egberts ACG, Meyboom RHB, van Puijenbroek<br />
EP. Use <strong>of</strong> measures <strong>of</strong> disproportionality <strong>in</strong><br />
pharmacovigilance: three Dutch examples. <strong>Drug</strong><br />
Saf. 2002;25:453–458.<br />
18. Szarfman A, Machado SG, O’Neill RT. Use <strong>of</strong><br />
screen<strong>in</strong>g algorithms and computer systems to<br />
efficiently signal higher-than-expected comb<strong>in</strong>ations<br />
<strong>of</strong> drugs and events <strong>in</strong> <strong>the</strong> US <strong>FDA</strong>’s spontaneous<br />
reports database. <strong>Drug</strong> Saf. 2002;25:381–<br />
392.<br />
19. Edwards IR, Aronson JK. <strong>Adverse</strong> drug reactions:<br />
def<strong>in</strong>itions, diagnosis, and management. Lancet.<br />
2000;356:1255–1259.<br />
20. WHO Collaborat<strong>in</strong>g Center for <strong>Drug</strong> Statistics<br />
Methodology. About <strong>the</strong> ATC/DDD system.<br />
http://www.whocc.no/atcddd/. Accessed October<br />
20, 2008.<br />
21. WHO Collaborat<strong>in</strong>g Center for International<br />
<strong>Drug</strong> Monitor<strong>in</strong>g: The Uppsala Monitor<strong>in</strong>g Center.<br />
Concepts <strong>in</strong> critical terms. http://who-umc<br />
.org/DynPage.aspx?id=22686. Accessed October<br />
20, 2008.<br />
22. van Puijenbroek EP, Diemont WL, van Groo<strong>the</strong>est<br />
K. Application <strong>of</strong> quantitative signal detection<br />
<strong>in</strong> <strong>the</strong> Dutch spontaneous report<strong>in</strong>g system<br />
for adverse drug reactions. <strong>Drug</strong> Saf. 2003;26(5):<br />
293–301.<br />
23. Faculty <strong>of</strong> Pharmaceutical Science, Chulalongkorn<br />
University. Development <strong>of</strong> signal detection<br />
and assessment tool for <strong>the</strong> <strong>Thai</strong> <strong>FDA</strong> spontaneous<br />
report<strong>in</strong>g database. Bangkok; 2005.<br />
24. L<strong>in</strong>dquist M, Stahl M, Bate A, Edwards IR, Mey-<br />
boom RHB. A retrospective evaluation <strong>of</strong> a data<br />
m<strong>in</strong><strong>in</strong>g approach to aid f<strong>in</strong>d<strong>in</strong>g new adverse drug<br />
reaction signals <strong>in</strong> <strong>the</strong> WHO <strong>in</strong>ternational database.<br />
<strong>Drug</strong> Saf. 2000;23:533–542.<br />
25. Lonergan J, Behl<strong>in</strong>g C, Pfander H, Hassane<strong>in</strong> T,<br />
Ma<strong>the</strong>ws W. Hyperlactatemia and hepatic abnormalities<br />
<strong>in</strong> 10 human immunodeficiency virus<strong>in</strong>fected<br />
patients receiv<strong>in</strong>g nucleoside analogue<br />
comb<strong>in</strong>ation regimens. Cl<strong>in</strong> Infect Dis. 2000;<br />
31(1):162–166.<br />
26. John M, Moore CB, James IR, et al. Chronic hyperlactatemia<br />
<strong>in</strong> HIV-<strong>in</strong>fected patients tak<strong>in</strong>g<br />
antiretroviral <strong>the</strong>rapy. AIDS. 2001;15:717–723.<br />
27. Arenas-P<strong>in</strong>to A, Grant A, Edwards S, Weller I. Lactic<br />
acidosis <strong>in</strong> HIV <strong>in</strong>fected patients: a systematic<br />
review <strong>of</strong> published cases. Sex Transm Infect.<br />
2003;79:340–343.<br />
28. Falco V, Rodriguez D, Ribera E, et al. Severe nucleoside-associated<br />
lactic acidosis <strong>in</strong> human immunodeficiency<br />
virus-<strong>in</strong>fected patients: report<br />
<strong>of</strong> 12 cases and review <strong>of</strong> <strong>the</strong> literature. Cl<strong>in</strong> Infect<br />
Dis. 2002;34:838–846.<br />
29. Boubaker K, Flepp M, Sudre P, et al. Hyperlactatemia<br />
and antiretroviral <strong>the</strong>rapy: <strong>the</strong> Swiss HIV<br />
cohort study. Cl<strong>in</strong> Infect Dis. 2001;33:1931–1937.<br />
30. Miller K, Cameron M, Wood L, Dalakas M, Kovacs<br />
J. Lactic acidosis and hepatic steatosis associated<br />
with use <strong>of</strong> stavud<strong>in</strong>e: report <strong>of</strong> four cases. Ann<br />
Intern Med. 2000;133:192–196.<br />
31. Medwatch: <strong>the</strong> <strong>FDA</strong> safety <strong>in</strong>formation and adverse<br />
drug event report<strong>in</strong>g program. Safety-related<br />
drug label<strong>in</strong>g change summaries approved by<br />
<strong>FDA</strong> Center for <strong>Drug</strong> Evaluation and Research.<br />
http://www.fda.gov/medwatch/SAFETY/2002/<br />
feb02.htm#zerit. Accessed October 22, 2008.<br />
32. AIDSInfo website. http://www.aids<strong>in</strong>fo.nih.gov/<br />
HealthTopics/HealthTopicDetails.aspx?expand<br />
able=3&HealthTopicID=75&ClassID=53. Accessed<br />
October 28, 2006.<br />
33. Mart<strong>in</strong>ez E, Blanco JL, Arnaiz JA, et al. Hepatotoxicity<br />
<strong>in</strong> HIV-1-<strong>in</strong>fected patients receiv<strong>in</strong>g nevirap<strong>in</strong>e-conta<strong>in</strong><strong>in</strong>g<br />
antiretroviral <strong>the</strong>rapy. AIDS.<br />
2000;15:1261–1268.<br />
34. Sanne I, Mommeja-Mar<strong>in</strong> H, H<strong>in</strong>kle J, et al. Severe<br />
hepatotoxicity associated with nevirap<strong>in</strong>e<br />
use <strong>in</strong> HIV-<strong>in</strong>fected subjects. J Infect Dis.<br />
2005;191:825–829.<br />
35. Medwatch: <strong>the</strong> <strong>FDA</strong> safety <strong>in</strong>formation and ad-
<strong>Detection</strong> <strong>of</strong> <strong>Adverse</strong> <strong>Drug</strong> <strong>Reaction</strong> <strong>Signals</strong> p h a r m a c o v i g i l a n c e 403<br />
verse drug event report<strong>in</strong>g program. Safety-relat-<br />
ed drug label<strong>in</strong>g change summaries approved by<br />
<strong>FDA</strong> Center for <strong>Drug</strong> Evaluation and Research.<br />
http://www.fda.gov/medwatch/safety/2000/<br />
nov00.htm#viramune. Accessed October 22,<br />
2008.<br />
36. de Requena DG, Núnez M, Jiménez-Nácher I, Soriano<br />
V. Liver toxicity caused by nevirap<strong>in</strong>e. AIDS.<br />
2002;16(2):290–291.<br />
37. Spengler U, Lichterfeld M, Rockstroh JK. Antiretroviral<br />
drug toxicity—a challenge for <strong>the</strong> hepatologist?<br />
J Hepatol. 2002;36(2):283–294.<br />
38. Hauben M, Reich L. Safety related drug-labell<strong>in</strong>g<br />
changes: f<strong>in</strong>d<strong>in</strong>gs from two data m<strong>in</strong><strong>in</strong>g algorithms.<br />
<strong>Drug</strong> Saf. 2004;27:735–744.<br />
39. Hauben M, Reich L. <strong>Drug</strong>-<strong>in</strong>duced pancreatitis:<br />
lessons <strong>in</strong> data m<strong>in</strong><strong>in</strong>g. Br J Cl<strong>in</strong> Pharmacol. 2004;<br />
58:560–562.<br />
The authors report no relevant relationships to disclose.<br />
<strong>Drug</strong> Information Journal<br />
40. Hopstadius J, Noren GN, Bate A, Edwards IR. Impact<br />
<strong>of</strong> stratification on adverse drug reaction<br />
surveillance. <strong>Drug</strong> Saf. 2008;31:1035–1048.<br />
41. Evans SJW. Stratification for spontaneous report<br />
databases. <strong>Drug</strong> Saf. 2008;31:1049–1052.<br />
42. van Puijenbroek EP, Bate A, Leufkens HGM,<br />
L<strong>in</strong>dquist M, Orre R, Egberts ACG. A comparison<br />
<strong>of</strong> measures <strong>of</strong> disproportionality for signal detection<br />
<strong>in</strong> spontaneous report<strong>in</strong>g systems for adverse<br />
drug reactions. Pharmacoepidemiol <strong>Drug</strong> Saf.<br />
2002;11(1): 3–10.<br />
43. Hauben M, Patadia V, Gerrits C, Walsh L, Reich L.<br />
Data m<strong>in</strong><strong>in</strong>g <strong>in</strong> pharmacovigilance: <strong>the</strong> need for<br />
a balanced perspective. <strong>Drug</strong> Saf. 2005;28:835–<br />
842.<br />
44. Almen<strong>of</strong>f J, Tonn<strong>in</strong>g JM, Gould AL, et al. Perspectives<br />
on <strong>the</strong> use <strong>of</strong> data m<strong>in</strong><strong>in</strong>g <strong>in</strong> pharmacovigilance.<br />
<strong>Drug</strong> Saf. 2005;28:981–1007.