Filing at a Glance General Information - Delaware Insurance ...
Filing at a Glance General Information - Delaware Insurance ...
Filing at a Glance General Information - Delaware Insurance ...

You also want an ePaper? Increase the reach of your titles
YUMPU automatically turns print PDFs into web optimized ePapers that Google loves.
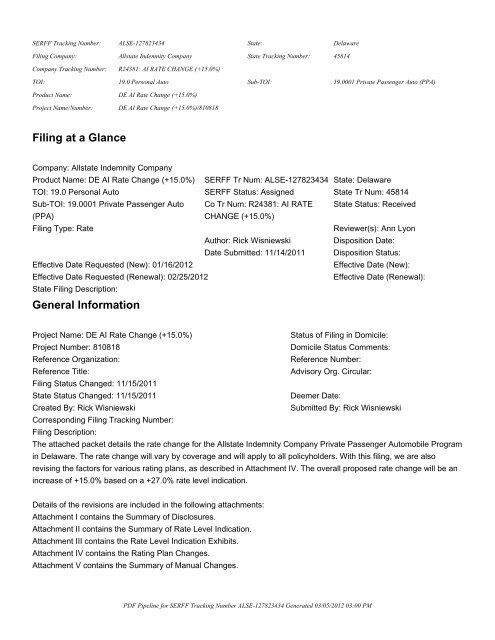
SERFF Tracking Number: ALSE-127823434 St<strong>at</strong>e: <strong>Delaware</strong><br />
<strong>Filing</strong> Company: Allst<strong>at</strong>e Indemnity Company St<strong>at</strong>e Tracking Number: 45814<br />
Company Tracking Number: R24381: AI RATE CHANGE (+15.0%)<br />
TOI: 19.0 Personal Auto Sub-TOI: 19.0001 Priv<strong>at</strong>e Passenger Auto (PPA)<br />
Product Name: DE AI R<strong>at</strong>e Change (+15.0%)<br />
Project Name/Number: DE AI R<strong>at</strong>e Change (+15.0%)/810818<br />
<strong>Filing</strong> <strong>at</strong> a <strong>Glance</strong><br />
Company: Allst<strong>at</strong>e Indemnity Company<br />
Product Name: DE AI R<strong>at</strong>e Change (+15.0%) SERFF Tr Num: ALSE-127823434 St<strong>at</strong>e: <strong>Delaware</strong><br />
TOI: 19.0 Personal Auto SERFF St<strong>at</strong>us: Assigned St<strong>at</strong>e Tr Num: 45814<br />
Sub-TOI: 19.0001 Priv<strong>at</strong>e Passenger Auto<br />
(PPA)<br />
Co Tr Num: R24381: AI RATE<br />
CHANGE (+15.0%)<br />
PDF Pipeline for SERFF Tracking Number ALSE-127823434 Gener<strong>at</strong>ed 03/05/2012 03:00 PM<br />
St<strong>at</strong>e St<strong>at</strong>us: Received<br />
<strong>Filing</strong> Type: R<strong>at</strong>e Reviewer(s): Ann Lyon<br />
Author: Rick Wisniewski Disposition D<strong>at</strong>e:<br />
D<strong>at</strong>e Submitted: 11/14/2011 Disposition St<strong>at</strong>us:<br />
Effective D<strong>at</strong>e Requested (New): 01/16/2012 Effective D<strong>at</strong>e (New):<br />
Effective D<strong>at</strong>e Requested (Renewal): 02/25/2012 Effective D<strong>at</strong>e (Renewal):<br />
St<strong>at</strong>e <strong>Filing</strong> Description:<br />
<strong>General</strong> Inform<strong>at</strong>ion<br />
Project Name: DE AI R<strong>at</strong>e Change (+15.0%) St<strong>at</strong>us of <strong>Filing</strong> in Domicile:<br />
Project Number: 810818 Domicile St<strong>at</strong>us Comments:<br />
Reference Organiz<strong>at</strong>ion: Reference Number:<br />
Reference Title: Advisory Org. Circular:<br />
<strong>Filing</strong> St<strong>at</strong>us Changed: 11/15/2011<br />
St<strong>at</strong>e St<strong>at</strong>us Changed: 11/15/2011 Deemer D<strong>at</strong>e:<br />
Cre<strong>at</strong>ed By: Rick Wisniewski Submitted By: Rick Wisniewski<br />
Corresponding <strong>Filing</strong> Tracking Number:<br />
<strong>Filing</strong> Description:<br />
The <strong>at</strong>tached packet details the r<strong>at</strong>e change for the Allst<strong>at</strong>e Indemnity Company Priv<strong>at</strong>e Passenger Automobile Program<br />
in <strong>Delaware</strong>. The r<strong>at</strong>e change will vary by coverage and will apply to all policyholders. With this filing, we are also<br />
revising the factors for various r<strong>at</strong>ing plans, as described in Attachment IV. The overall proposed r<strong>at</strong>e change will be an<br />
increase of +15.0% based on a +27.0% r<strong>at</strong>e level indic<strong>at</strong>ion.<br />
Details of the revisions are included in the following <strong>at</strong>tachments:<br />
Attachment I contains the Summary of Disclosures.<br />
Attachment II contains the Summary of R<strong>at</strong>e Level Indic<strong>at</strong>ion.<br />
Attachment III contains the R<strong>at</strong>e Level Indic<strong>at</strong>ion Exhibits.<br />
Attachment IV contains the R<strong>at</strong>ing Plan Changes.<br />
Attachment V contains the Summary of Manual Changes.
SERFF Tracking Number: ALSE-127823434 St<strong>at</strong>e: <strong>Delaware</strong><br />
<strong>Filing</strong> Company: Allst<strong>at</strong>e Indemnity Company St<strong>at</strong>e Tracking Number: 45814<br />
Company Tracking Number: R24381: AI RATE CHANGE (+15.0%)<br />
TOI: 19.0 Personal Auto Sub-TOI: 19.0001 Priv<strong>at</strong>e Passenger Auto (PPA)<br />
Product Name: DE AI R<strong>at</strong>e Change (+15.0%)<br />
Project Name/Number: DE AI R<strong>at</strong>e Change (+15.0%)/810818<br />
Company and Contact<br />
<strong>Filing</strong> Contact Inform<strong>at</strong>ion<br />
Rick Wisniewski, Associ<strong>at</strong>e St<strong>at</strong>e <strong>Filing</strong>s<br />
Director<br />
rwisn@allst<strong>at</strong>e.com<br />
2775 Sanders Road 847-402-0723 [Phone] 20723 [Ext]<br />
Suite A2-W 847-402-9757 [FAX]<br />
Northbrook, IL 60062<br />
<strong>Filing</strong> Company Inform<strong>at</strong>ion<br />
Allst<strong>at</strong>e Indemnity Company CoCode: 19240 St<strong>at</strong>e of Domicile: Illinois<br />
2775 Sanders Rd. Group Code: 8 Company Type: Property and<br />
Casualty<br />
Suite A2-W Group Name: Allst<strong>at</strong>e St<strong>at</strong>e ID Number:<br />
Northbrook, IL 60062 FEIN Number: 36-6115679<br />
(847) 402-5000 ext. [Phone]<br />
---------<br />
<strong>Filing</strong> Fees<br />
Fee Required? Yes<br />
Fee Amount: $50.00<br />
Retali<strong>at</strong>ory? No<br />
Fee Explan<strong>at</strong>ion:<br />
Per Company: Yes<br />
COMPANY AMOUNT DATE PROCESSED TRANSACTION #<br />
Allst<strong>at</strong>e Indemnity Company $50.00 11/14/2011 53726505<br />
PDF Pipeline for SERFF Tracking Number ALSE-127823434 Gener<strong>at</strong>ed 03/05/2012 03:00 PM
SERFF Tracking Number: ALSE-127823434 St<strong>at</strong>e: <strong>Delaware</strong><br />
<strong>Filing</strong> Company: Allst<strong>at</strong>e Indemnity Company St<strong>at</strong>e Tracking Number: 45814<br />
Company Tracking Number: R24381: AI RATE CHANGE (+15.0%)<br />
TOI: 19.0 Personal Auto Sub-TOI: 19.0001 Priv<strong>at</strong>e Passenger Auto (PPA)<br />
Product Name: DE AI R<strong>at</strong>e Change (+15.0%)<br />
Project Name/Number: DE AI R<strong>at</strong>e Change (+15.0%)/810818<br />
R<strong>at</strong>e Inform<strong>at</strong>ion<br />
R<strong>at</strong>e d<strong>at</strong>a applies to filing.<br />
<strong>Filing</strong> Method: File & use<br />
R<strong>at</strong>e Change Type: Increase<br />
Overall Percentage of Last R<strong>at</strong>e Revision: -13.100%<br />
Effective D<strong>at</strong>e of Last R<strong>at</strong>e Revision: 07/21/2008<br />
<strong>Filing</strong> Method of Last <strong>Filing</strong>: File & use<br />
Company R<strong>at</strong>e Inform<strong>at</strong>ion<br />
Company Name: Overall %<br />
Allst<strong>at</strong>e Indemnity<br />
Company<br />
Indic<strong>at</strong>ed<br />
Change:<br />
Overall % R<strong>at</strong>e<br />
Impact:<br />
Written<br />
Premium<br />
Change for<br />
this Program:<br />
# of Policy<br />
Holders<br />
Affected for this<br />
Program:<br />
Written<br />
Premium for<br />
this Program:<br />
PDF Pipeline for SERFF Tracking Number ALSE-127823434 Gener<strong>at</strong>ed 03/05/2012 03:00 PM<br />
Maximum %<br />
Change (where<br />
required):<br />
Minimum %<br />
Change (where<br />
required):<br />
27.000% 15.000% $339,581 1,238 $2,263,871 108.500% -40.700%
SERFF Tracking Number: ALSE-127823434 St<strong>at</strong>e: <strong>Delaware</strong><br />
<strong>Filing</strong> Company: Allst<strong>at</strong>e Indemnity Company St<strong>at</strong>e Tracking Number: 45814<br />
Company Tracking Number: R24381: AI RATE CHANGE (+15.0%)<br />
TOI: 19.0 Personal Auto Sub-TOI: 19.0001 Priv<strong>at</strong>e Passenger Auto (PPA)<br />
Product Name: DE AI R<strong>at</strong>e Change (+15.0%)<br />
Project Name/Number: DE AI R<strong>at</strong>e Change (+15.0%)/810818<br />
R<strong>at</strong>e/Rule Schedule<br />
Schedule Item<br />
St<strong>at</strong>us:<br />
Exhibit Name: Rule # or Page<br />
#:<br />
R<strong>at</strong>e Action Previous St<strong>at</strong>e <strong>Filing</strong> Attachments<br />
Number:<br />
Manual Pages Replacement Manual - R24381.pdf<br />
PDF Pipeline for SERFF Tracking Number ALSE-127823434 Gener<strong>at</strong>ed 03/05/2012 03:00 PM
DELAWARE<br />
VOLUNTARY PRIVATE PASSENGER AUTO<br />
PREMIUM CALCULATION<br />
ROUND AFTER EACH CALCULATION TO THE NEAREST PENNY<br />
STEP<br />
# AA BB VA DD HH<br />
1 TERRITORIAL BASE RATE (RP-2A)<br />
2 RATE ADJUSTMENT FACTOR (PENNY ROUND) x 1.731 x 1.854 x 1.936 x 1.259 x 1.249<br />
3 INCREASED LIMIT FACTOR/ADDEND (RP-3A) x x x<br />
4 PIP DEDUCTIBLE FACTOR (RP-3A) x x x<br />
5 DRIVER CLASSIFICATION FACTOR (RP- 4A, 5A, 6A, 7A and 8A) x x x x x<br />
6 HOUSEHOLD COMPOSITION FACTOR (RP-9A) x x x x x<br />
7 MODEL YEAR FACTOR (RP-10A) x x<br />
8 DEDUCTIBLE BY PGS FACTOR (RP-10A) x x<br />
9 EXPERIENCE GROUP RATING FACTOR (EGR PAGES) x x x x x<br />
10 VEHICLE SURCHARGE FACTOR (RP-11A) x x<br />
11 RESIDENT STUDENT DISCOUNT FACTOR (RP-15A) x x x<br />
12 GOOD STUDENT DISCOUNT FACTOR (RP-15A) x x x x x<br />
13 PASSIVE RESTRAINT DISCOUNT FACTOR (RP-15A) x<br />
14 SENIOR ADULT DISCOUNT FACTOR (RP-15A) x x x x<br />
15 ACCIDENT FACTOR (RP-12A) x x x x<br />
16 MINOR VIOLATION FACTOR (RP-13A) x x x x<br />
17 MAJOR VIOLATION FACTOR (RP-14A) x x x x<br />
18 NONVERIFIABLE DRIVING RECORD SURCHARGE (RP-15A) x x x x<br />
19 INEXPERIENCED OPERATOR SURCHARGE FACTOR (RP-15A) x x x<br />
20 CAMPER UNIT ADDITIONAL PREMIUM (RP-22A) + +<br />
21 DEFENSIVE DRIVER DISCOUNT FACTOR (RP-15A) x x x x<br />
22 TIER FACTOR (RP-16A-21A) x x x x x<br />
23 PERFORMANCE DISCOUNT FACTOR (RP-15A) x x x x x<br />
24 HOMEOWNERSHIP DISCOUNT FACTOR (RP-15A) x x x x x<br />
25 MULTIPLE POLICY DISCOUNT FACTOR (RP-16A) x x x x x<br />
26 CERTIFIED RISK SURCHARGE FACTOR (RP-15A) x x<br />
27 ANTILOCK BRAKE DISCOUNT FACTOR (RP-15A) x x x<br />
28 THE GOOD HANDS PEOPLE® DISCOUNT FACTOR (RP-15A) x x x x x<br />
29 THE GOOD PAYER DISCOUNT FACTOR (RP-15A) x x x x x<br />
30 ALLSTATE® EASY PAY PLAN DISCOUNT FACTOR (RP-15A) x x x x x<br />
31 FUTURE EFFECTIVE DATE DISCOUNT FACTOR (RP-15A) x x x x x<br />
32 TOTAL COVERAGE PREMIUM<br />
33 MINIMUM PREMIUM AMOUNT $10 $5 $5 $15 $5<br />
34 LARGER OF 32 OR 33<br />
UM/UIM COVERAGE (SS) NOTES<br />
35 UM/UIM PREMIUM (RP-2A)<br />
36 RATE ADJUSTMENT FACTOR x 1.000 Territory #:<br />
37 INCREASED LIMIT FACTOR (RP-3A) x<br />
38 TOTAL UM/UIM COVERAGE PREMIUM Tier:<br />
RENTAL REIMBURSEMENT (UU) Classific<strong>at</strong>ion:<br />
39 BASE RATE (RP-22A)<br />
40 INCREASED LIMIT FACTOR (RP-22A) x Limits of Liability:<br />
41 TOTAL COVERAGE PREMIUM<br />
Model Year:<br />
42 ROADSIDE HELP RATE (JJ) (RP-22A)<br />
43 SOUND SYSTEMS RATE (ZA) (RP-22A) + PGS:<br />
44 TAPE RATE (ZZ) (RP-22A) +<br />
45<br />
LEASE OR LOAN GAP COVERAGE (LG) (RP-3B, LINE 28) OR<br />
REPAIR OR REPLACEMENT COST COVERAGE (RC) (RP-4B, LINE 28) + DD/HH Deductibles:<br />
46 TOTAL MISCELLANEOUS COVERAGES (LINES 42 TO 45) =<br />
Multi Car Y / N<br />
47 LINES 34 (AA+BB+CC+DD+HH) + 38 + 41 + 46<br />
December 1, 2011 Allst<strong>at</strong>e Indemnity Company RP-1A
DELAWARE<br />
VOLUNTARY PRIVATE PASSENGER AUTO<br />
INCREASED LIMITS FACTORS / RATES AND LOYALTY BONUS<br />
BODILY INJURY<br />
INCREASED LIMITS<br />
LIMIT FACTOR LIMIT FACTOR<br />
$ 10/20 (BASE) 1.00 $ 15/30 1.00<br />
15/30 (FR) 1.25 15/40 1.91<br />
15/40 1.31 25/50 2.40<br />
25/50 1.63 30/85 3.39<br />
30/85 1.80 25/100 3.48<br />
25/100 1.85 50/100 4.02<br />
50/100 2.05 100/300 6.47<br />
100/100 2.20 300/300 9.86<br />
100/300 2.60 250/500 10.85<br />
200/300 2.78 300/500 11.05<br />
300/300 2.85 500/500 11.82<br />
250/500 3.07 500/1000 12.67<br />
300/500 3.08 1000/1000 14.68<br />
500/500 3.20<br />
500/1000 3.30<br />
1000/1000 3.52<br />
2000/2000 3.91<br />
RULE 17<br />
UNINSURED / UNDERINSURED MOTORISTS<br />
INCREASED LIMITS<br />
PROPERTY DAMAGE PERSONAL INJURY PROTECTION<br />
INCREASED LIMITS<br />
DEDUCTIBLE FACTORS<br />
LIMIT FACTOR<br />
$10,000 (FR) 0.910 INCREASED LIMITS Named Named Insured &<br />
25,000 1.000 Insured Only Members Of Household<br />
50,000 1.065 LIMIT FACTOR DEDUCTIBLE Factor Factor<br />
100,000 1.130 VA04 1.00 $0 1.00 1.00<br />
200,000 1.195 VA02 1.10 $250 0.90 0.85<br />
300,000 1.236 VA03 1.20 $500 0.85 0.80<br />
400,000 1.277 VA05 1.50 $1,000 0.80 0.75<br />
500,000 1.319 $10,000 0.75 0.55<br />
750,000 1.360<br />
1,000,000 1.401<br />
2,000,000 1.545<br />
RULE 3<br />
POLICY FEES<br />
RATING POLICY<br />
GROUP FEE<br />
1 $30<br />
2 $30<br />
3 $30<br />
4 $30<br />
5 $30<br />
6 $30<br />
7 $30<br />
8 $30<br />
RULE 53<br />
LOYALTY BONUS<br />
Percent<br />
Bonus 10%<br />
December 1, 2011 Allst<strong>at</strong>e Indemnity Company RP-3A
DELAWARE<br />
VOLUNTARY PRIVATE PASSENGER AUTO<br />
DRIVER CLASSIFICATION FACTORS<br />
RULE 11<br />
Classific<strong>at</strong>ion Mileage Use Class Code AA BB VA DD HH<br />
14-16 Male Single Basic All All MB1 2.00 2.18 0.95 1.77 1.32<br />
17 Male Single Basic MB2 1.79 1.80 0.95 1.77 1.32<br />
18 Male Single Basic MB3 1.79 1.58 0.95 1.77 1.32<br />
19 Male Single Basic MB4 1.39 1.34 0.95 1.77 1.32<br />
20 Male Single Basic MB5 1.16 1.20 0.95 1.53 1.32<br />
21 Male Single Basic MB6 1.16 1.10 0.95 1.53 1.32<br />
22 Male Single Basic MB7 1.09 1.10 0.95 1.29 1.04<br />
23 Male Single Basic MB8 1.09 1.10 0.95 1.29 1.04<br />
24 Male Single Basic MB9 1.09 1.10 0.95 1.29 1.04<br />
14-16 Male Single Restricted All All MR1 1.90 2.07 0.95 1.68 1.13<br />
17 Male Single Restricted MR2 1.70 1.71 0.95 1.68 1.13<br />
18 Male Single Restricted MR3 1.70 1.50 0.95 1.68 1.13<br />
19 Male Single Restricted MR4 1.32 1.27 0.95 1.68 1.13<br />
20 Male Single Restricted MR5 1.10 1.14 0.95 1.46 1.13<br />
21 Male Single Restricted MR6 1.10 1.04 0.95 1.46 1.13<br />
22 Male Single Restricted MR7 1.04 1.04 0.95 1.24 0.89<br />
23 Male Single Restricted MR8 1.04 1.04 0.95 1.24 0.89<br />
24 Male Single Restricted MR9 1.04 1.04 0.95 1.24 0.89<br />
25-29 Male Single Short Pleasure MS1SP 1.00 1.04 1.00 1.24 1.21<br />
Work 0-3 MS1SW 0-3 1.00 1.04 1.00 1.24 1.21<br />
Work 3.1-9.9 MS1SW 3.1-9.9 1.00 1.04 1.00 1.24 1.21<br />
Work 10-20 MS1SW 10-20 1.00 1.04 1.00 1.24 1.21<br />
Work 20+ MS1SW 20+ 1.00 1.04 1.00 1.24 1.21<br />
Business MS1SB 1.34 1.21 1.00 1.24 1.21<br />
Long Pleasure MS1LP 1.00 1.04 1.00 1.24 1.21<br />
Work 0-3 MS1LW 0-3 1.00 1.04 1.00 1.24 1.21<br />
Work 3.1-9.9 MS1LW 3.1-9.9 1.00 1.04 1.00 1.24 1.21<br />
Work 10-20 MS1LW 10-20 1.00 1.04 1.00 1.24 1.21<br />
Work 20+ MS1LW 20+ 1.00 1.04 1.00 1.24 1.21<br />
Business MS1LB 1.34 1.21 1.00 1.24 1.21<br />
30-49 Male Single Short Pleasure MS2SP 1.00 1.00 1.00 1.03 1.08<br />
Work 0-3 MS2SW 0-3 1.00 1.00 1.00 1.03 1.08<br />
Work 3.1-9.9 MS2SW 3.1-9.9 1.00 1.00 1.00 1.03 1.08<br />
Work 10-20 MS2SW 10-20 1.00 1.00 1.00 1.03 1.08<br />
Work 20+ MS2SW 20+ 1.00 1.00 1.00 1.03 1.08<br />
Business MS2SB 1.34 1.16 1.00 1.03 1.08<br />
Long Pleasure MS2LP 1.00 1.00 1.00 1.03 1.08<br />
Work 0-3 MS2LW 0-3 1.00 1.00 1.00 1.03 1.08<br />
Work 3.1-9.9 MS2LW 3.1-9.9 1.00 1.00 1.00 1.03 1.08<br />
Work 10-20 MS2LW 10-20 1.00 1.00 1.00 1.03 1.08<br />
Work 20+ MS2LW 20+ 1.00 1.00 1.00 1.03 1.08<br />
Business MS2LB 1.34 1.16 1.00 1.03 1.08<br />
14-16 Male Married All All MM1 1.83 2.07 0.89 1.68 1.16<br />
17 Male Married MM2 1.64 1.71 0.89 1.68 1.16<br />
18 Male Married MM3 1.64 1.50 0.89 1.68 1.16<br />
19 Male Married MM4 1.27 1.27 0.89 1.68 1.16<br />
20 Male Married MM5 1.06 1.14 0.89 1.46 1.16<br />
21 Male Married MM6 1.06 1.02 0.89 1.46 1.16<br />
22 Male Married MM7 1.00 1.02 0.89 1.05 1.12<br />
23 Male Married MM8 1.00 1.02 0.89 1.05 1.12<br />
24 Male Married MM9 1.00 1.02 0.89 1.05 1.12<br />
25-29 Male Married Short Pleasure MM10SP 1.00 0.93 1.00 0.99 1.12<br />
Work 0-3 MM10SW 0-3 1.00 0.93 1.00 0.99 1.12<br />
Work 3.1-9.9 MM10SW 3.1-9.9 1.00 0.93 1.00 0.99 1.12<br />
Work 10-20 MM10SW 10-20 1.00 0.93 1.00 0.99 1.12<br />
Work 20+ MM10SW 20+ 1.00 0.93 1.00 0.99 1.12<br />
Business MM10SB 1.34 1.07 1.00 0.99 1.12<br />
December 1, 2011 Allst<strong>at</strong>e Indemnity Company RP-4A
DELAWARE<br />
VOLUNTARY PRIVATE PASSENGER AUTO<br />
DRIVER CLASSIFICATION FACTORS<br />
RULE 11<br />
Classific<strong>at</strong>ion Mileage Use Class Code AA BB VA DD HH<br />
Long Pleasure MM10LP 1.00 0.93 1.00 0.99 1.12<br />
Work 0-3 MM10LW 0-3 1.00 0.93 1.00 0.99 1.12<br />
Work 3.1-9.9 MM10LW 3.1-9.9 1.00 0.93 1.00 0.99 1.12<br />
Work 10-20 MM10LW 10-20 1.00 0.93 1.00 0.99 1.12<br />
Work 20+ MM10LW 20+ 1.00 0.93 1.00 0.99 1.12<br />
Business MM10LB 1.34 1.07 1.00 0.99 1.12<br />
30-49 Male Married Short Pleasure MM11SP 1.00 0.93 1.00 0.91 0.90<br />
Work 0-3 MM11SW 0-3 1.00 0.93 1.00 0.91 0.90<br />
Work 3.1-9.9 MM11SW 3.1-9.9 1.00 0.93 1.00 0.91 0.90<br />
Work 10-20 MM11SW 10-20 1.00 0.93 1.00 0.91 0.90<br />
Work 20+ MM11SW 20+ 1.00 0.93 1.00 0.91 0.90<br />
Business MM11SB 1.34 1.08 1.00 0.91 0.90<br />
Long Pleasure MM11LP 1.00 0.93 1.00 0.91 0.90<br />
Work 0-3 MM11LW 0-3 1.00 0.93 1.00 0.91 0.90<br />
Work 3.1-9.9 MM11LW 3.1-9.9 1.00 0.93 1.00 0.91 0.90<br />
Work 10-20 MM11LW 10-20 1.00 0.93 1.00 0.91 0.90<br />
Work 20+ MM11LW 20+ 1.00 0.93 1.00 0.91 0.90<br />
Business MM11LB 1.34 1.08 1.00 0.91 0.90<br />
14-16 Female Single Basic All All FB1 1.84 1.84 1.23 1.43 1.02<br />
17 Female Single Basic FB2 1.43 1.49 1.23 1.43 1.02<br />
18 Female Single Basic FB3 1.43 1.40 1.23 1.43 1.02<br />
19 Female Single Basic FB4 1.39 1.24 1.23 1.43 1.02<br />
20 Female Single Basic FB5 1.16 1.10 1.23 1.22 1.02<br />
21 Female Single Basic FB6 1.16 1.10 1.23 1.22 1.02<br />
22 Female Single Basic FB7 1.09 1.10 1.23 1.19 0.91<br />
23 Female Single Basic FB8 1.09 1.10 1.23 1.19 0.91<br />
24 Female Single Basic FB9 1.09 1.10 1.23 1.19 0.91<br />
14-16 Female Single Restricted All All FR1 1.75 1.75 1.23 1.36 0.87<br />
17 Female Single Restricted FR2 1.36 1.41 1.23 1.36 0.87<br />
18 Female Single Restricted FR3 1.36 1.33 1.23 1.36 0.87<br />
19 Female Single Restricted FR4 1.32 1.17 1.23 1.36 0.87<br />
20 Female Single Restricted FR5 1.10 1.04 1.23 1.16 0.87<br />
21 Female Single Restricted FR6 1.10 1.04 1.23 1.16 0.87<br />
22 Female Single Restricted FR7 1.04 1.04 1.23 1.14 0.78<br />
23 Female Single Restricted FR8 1.04 1.04 1.23 1.14 0.78<br />
24 Female Single Restricted FR9 1.04 1.04 1.23 1.14 0.78<br />
25-29 Female Single Short Pleasure FS1SP 1.00 1.04 1.07 1.14 1.06<br />
Work 0-3 FS1SW 0-3 1.00 1.04 1.07 1.14 1.06<br />
Work 3.1-9.9 FS1SW 3.1-9.9 1.00 1.04 1.07 1.14 1.06<br />
Work 10-20 FS1SW 10-20 1.00 1.04 1.07 1.14 1.06<br />
Work 20+ FS1SW 20+ 1.00 1.04 1.07 1.14 1.06<br />
Business FS1SB 1.34 1.21 1.07 1.14 1.06<br />
Long Pleasure FS1LP 1.00 1.04 1.07 1.14 1.06<br />
Work 0-3 FS1LW 0-3 1.00 1.04 1.07 1.14 1.06<br />
Work 3.1-9.9 FS1LW 3.1-9.9 1.00 1.04 1.07 1.14 1.06<br />
Work 10-20 FS1LW 10-20 1.00 1.04 1.07 1.14 1.06<br />
Work 20+ FS1LW 20+ 1.00 1.04 1.07 1.14 1.06<br />
Business FS1LB 1.34 1.21 1.07 1.14 1.06<br />
30-49 Female Single Short Pleasure FS2SP 1.00 1.00 1.07 1.00 1.00<br />
Work 0-3 FS2SW 0-3 1.00 1.00 1.07 1.00 1.00<br />
Work 3.1-9.9 FS2SW 3.1-9.9 1.00 1.00 1.07 1.00 1.00<br />
Work 10-20 FS2SW 10-20 1.00 1.00 1.07 1.00 1.00<br />
Work 20+ FS2SW 20+ 1.00 1.00 1.07 1.00 1.00<br />
Business FS2SB 1.34 1.16 1.07 1.00 1.00<br />
December 1, 2011 Allst<strong>at</strong>e Indemnity Company RP-5A
DELAWARE<br />
VOLUNTARY PRIVATE PASSENGER AUTO<br />
DRIVER CLASSIFICATION FACTORS<br />
RULE 11<br />
Classific<strong>at</strong>ion Mileage Use Class Code AA BB VA DD HH<br />
Long Pleasure FS2LP 1.00 1.00 1.07 1.00 1.00<br />
Work 0-3 FS2LW 0-3 1.00 1.00 1.07 1.00 1.00<br />
Work 3.1-9.9 FS2LW 3.1-9.9 1.00 1.00 1.07 1.00 1.00<br />
Work 10-20 FS2LW 10-20 1.00 1.00 1.07 1.00 1.00<br />
Work 20+ FS2LW 20+ 1.00 1.00 1.07 1.00 1.00<br />
Business FS2LB 1.34 1.16 1.07 1.00 1.00<br />
14-16 Female Married All All FM1 1.68 1.75 1.15 1.36 1.10<br />
17 Female Married FM2 1.31 1.41 1.15 1.36 1.10<br />
18 Female Married FM3 1.31 1.33 1.15 1.36 1.10<br />
19 Female Married FM4 1.27 1.17 1.15 1.36 1.10<br />
20 Female Married FM5 1.06 1.01 1.15 1.08 1.10<br />
21 Female Married FM6 1.06 1.01 1.15 1.08 1.10<br />
22 Female Married FM7 0.89 1.01 1.15 1.05 0.99<br />
23 Female Married FM8 0.89 1.01 1.15 1.05 0.99<br />
24 Female Married FM9 0.89 1.01 1.15 1.05 0.99<br />
25-29 Female Married Short Pleasure FM10SP 0.89 1.01 1.07 0.99 0.99<br />
Work 0-3 FM10SW 0-3 0.89 1.01 1.07 0.99 0.99<br />
Work 3.1-9.9 FM10SW 3.1-9.9 0.89 1.01 1.07 0.99 0.99<br />
Work 10-20 FM10SW 10-20 0.89 1.01 1.07 0.99 0.99<br />
Work 20+ FM10SW 20+ 0.89 1.01 1.07 0.99 0.99<br />
Business FM10SB 1.19 1.17 1.07 0.99 0.99<br />
Long Pleasure FM10LP 0.89 1.01 1.07 0.99 0.99<br />
Work 0-3 FM10LW 0-3 0.89 1.01 1.07 0.99 0.99<br />
Work 3.1-9.9 FM10LW 3.1-9.9 0.89 1.01 1.07 0.99 0.99<br />
Work 10-20 FM10LW 10-20 0.89 1.01 1.07 0.99 0.99<br />
Work 20+ FM10LW 20+ 0.89 1.01 1.07 0.99 0.99<br />
Business FM10LB 1.19 1.17 1.07 0.99 0.99<br />
30-49 Female Married Short Pleasure FM11SP 1.00 0.98 1.07 0.96 0.90<br />
Work 0-3 FM11SW 0-3 1.00 0.98 1.07 0.96 0.90<br />
Work 3.1-9.9 FM11SW 3.1-9.9 1.00 0.98 1.07 0.96 0.90<br />
Work 10-20 FM11SW 10-20 1.00 0.98 1.07 0.96 0.90<br />
Work 20+ FM11SW 20+ 1.00 0.98 1.07 0.96 0.90<br />
Business FM11SB 1.34 1.14 1.07 0.96 0.90<br />
Long Pleasure FM11LP 1.00 0.98 1.07 0.96 0.90<br />
Work 0-3 FM11LW 0-3 1.00 0.98 1.07 0.96 0.90<br />
Work 3.1-9.9 FM11LW 3.1-9.9 1.00 0.98 1.07 0.96 0.90<br />
Work 10-20 FM11LW 10-20 1.00 0.98 1.07 0.96 0.90<br />
Work 20+ FM11LW 20+ 1.00 0.98 1.07 0.96 0.90<br />
Business FM11LB 1.34 1.14 1.07 0.96 0.90<br />
50-54 Single Short Pleasure SMA1SP 1.03 0.95 0.86 0.95 0.87<br />
Work 0-3 SMA1SW 0-3 1.03 0.95 0.86 0.95 0.87<br />
Work 3.1-9.9 SMA1SW 3.1-9.9 1.03 0.95 0.86 0.95 0.87<br />
Work 10-20 SMA1SW 10-20 1.03 0.95 0.86 0.95 0.87<br />
Work 20+ SMA1SW 20+ 1.03 0.95 0.86 0.95 0.87<br />
Business SMA1SB 1.38 1.10 0.86 0.95 0.87<br />
Long Pleasure SMA1LP 1.03 0.95 0.86 0.95 0.87<br />
Work 0-3 SMA1LW 0-3 1.03 0.95 0.86 0.95 0.87<br />
Work 3.1-9.9 SMA1LW 3.1-9.9 1.03 0.95 0.86 0.95 0.87<br />
Work 10-20 SMA1LW 10-20 1.03 0.95 0.86 0.95 0.87<br />
Work 20+ SMA1LW 20+ 1.03 0.95 0.86 0.95 0.87<br />
Business SMA1LB 1.38 1.10 0.86 0.95 0.87<br />
55-59 Single Short Pleasure SMA2SP 1.03 0.95 0.85 0.92 0.87<br />
Work 0-3 SMA2SW 0-3 1.03 0.95 0.85 0.92 0.87<br />
Work 3.1-9.9 SMA2SW 3.1-9.9 1.03 0.95 0.85 0.92 0.87<br />
Work 10-20 SMA2SW 10-20 1.03 0.95 0.85 0.92 0.87<br />
Work 20+ SMA2SW 20+ 1.03 0.95 0.85 0.92 0.87<br />
Business SMA2SB 1.38 1.10 0.85 0.92 0.87<br />
December 1, 2011 Allst<strong>at</strong>e Indemnity Company RP-6A
DELAWARE<br />
VOLUNTARY PRIVATE PASSENGER AUTO<br />
DRIVER CLASSIFICATION FACTORS<br />
RULE 11<br />
Classific<strong>at</strong>ion Mileage Use Class Code AA BB VA DD HH<br />
Long Pleasure SMA2LP 1.03 0.95 0.85 0.92 0.87<br />
Work 0-3 SMA2LW 0-3 1.03 0.95 0.85 0.92 0.87<br />
Work 3.1-9.9 SMA2LW 3.1-9.9 1.03 0.95 0.85 0.92 0.87<br />
Work 10-20 SMA2LW 10-20 1.03 0.95 0.85 0.92 0.87<br />
Work 20+ SMA2LW 20+ 1.03 0.95 0.85 0.92 0.87<br />
Business SMA2LB 1.38 1.10 0.85 0.92 0.87<br />
60-64 Single Short Pleasure SMA3SP 1.03 0.94 0.85 0.91 0.76<br />
Work 0-3 SMA3SW 0-3 1.03 0.94 0.85 0.91 0.76<br />
Work 3.1-9.9 SMA3SW 3.1-9.9 1.03 0.94 0.85 0.91 0.76<br />
Work 10-20 SMA3SW 10-20 1.03 0.94 0.85 0.91 0.76<br />
Work 20+ SMA3SW 20+ 1.03 0.94 0.85 0.91 0.76<br />
Business SMA3SB 1.38 1.10 0.85 0.91 0.76<br />
Long Pleasure SMA3LP 1.03 0.94 0.85 0.91 0.76<br />
Work 0-3 SMA3LW 0-3 1.03 0.94 0.85 0.91 0.76<br />
Work 3.1-9.9 SMA3LW 3.1-9.9 1.03 0.94 0.85 0.91 0.76<br />
Work 10-20 SMA3LW 10-20 1.03 0.94 0.85 0.91 0.76<br />
Work 20+ SMA3LW 20+ 1.03 0.94 0.85 0.91 0.76<br />
Business SMA3LB 1.38 1.10 0.85 0.91 0.76<br />
65-70 Single Short All SMA4S 1.08 1.03 0.83 0.97 0.76<br />
71-75 Single SMA5S 1.18 1.16 0.83 0.98 0.76<br />
76-80 Single SMA6S 1.22 1.29 0.72 1.13 0.76<br />
81-85 Single SMA7S 1.23 1.51 0.72 1.23 0.76<br />
86+ Single SMA8S 1.23 1.57 0.72 1.25 0.76<br />
65-70 Single Long All SMA4L 1.08 1.03 0.83 0.97 0.76<br />
71-75 Single SMA5L 1.18 1.16 0.83 0.98 0.76<br />
76-80 Single SMA6L 1.22 1.29 0.72 1.13 0.76<br />
81-85 Single SMA7L 1.23 1.51 0.72 1.23 0.76<br />
86+ Single SMA8L 1.23 1.57 0.72 1.25 0.76<br />
50-54 Married Short Pleasure MMA1SP 1.03 0.94 0.94 0.91 0.79<br />
Work 0-3 MMA1SW 0-3 1.03 0.94 0.94 0.91 0.79<br />
Work 3.1-9.9 MMA1SW 3.1-9.9 1.03 0.94 0.94 0.91 0.79<br />
Work 10-20 MMA1SW 10-20 1.03 0.94 0.94 0.91 0.79<br />
Work 20+ MMA1SW 20+ 1.03 0.94 0.94 0.91 0.79<br />
Business MMA1SB 1.38 1.09 0.94 0.91 0.79<br />
Long Pleasure MMA1LP 1.03 0.94 0.94 0.91 0.79<br />
Work 0-3 MMA1LW 0-3 1.03 0.94 0.94 0.91 0.79<br />
Work 3.1-9.9 MMA1LW 3.1-9.9 1.03 0.94 0.94 0.91 0.79<br />
Work 10-20 MMA1LW 10-20 1.03 0.94 0.94 0.91 0.79<br />
Work 20+ MMA1LW 20+ 1.03 0.94 0.94 0.91 0.79<br />
Business MMA1LB 1.38 1.09 0.94 0.91 0.79<br />
55-59 Married Short Pleasure MMA2SP 0.96 0.94 0.84 0.88 0.79<br />
Work 0-3 MMA2SW 0-3 0.96 0.94 0.84 0.88 0.79<br />
Work 3.1-9.9 MMA2SW 3.1-9.9 0.96 0.94 0.84 0.88 0.79<br />
Work 10-20 MMA2SW 10-20 0.96 0.94 0.84 0.88 0.79<br />
Work 20+ MMA2SW 20+ 0.96 0.94 0.84 0.88 0.79<br />
Business MMA2SB 1.29 1.09 0.84 0.88 0.79<br />
Long Pleasure MMA2LP 0.96 0.94 0.84 0.88 0.79<br />
Work 0-3 MMA2LW 0-3 0.96 0.94 0.84 0.88 0.79<br />
Work 3.1-9.9 MMA2LW 3.1-9.9 0.96 0.94 0.84 0.88 0.79<br />
Work 10-20 MMA2LW 10-20 0.96 0.94 0.84 0.88 0.79<br />
Work 20+ MMA2LW 20+ 0.96 0.94 0.84 0.88 0.79<br />
Business MMA2LB 1.29 1.09 0.84 0.88 0.79<br />
December 1, 2011 Allst<strong>at</strong>e Indemnity Company RP-7A
DELAWARE<br />
VOLUNTARY PRIVATE PASSENGER AUTO<br />
DRIVER CLASSIFICATION FACTORS<br />
RULE 11<br />
Classific<strong>at</strong>ion Mileage Use Class Code AA BB VA DD HH<br />
60-64 Married Short Pleasure MMA3SP 0.93 0.88 0.84 0.88 0.77<br />
Work 0-3 MMA3SW 0-3 0.93 0.88 0.84 0.88 0.77<br />
Work 3.1-9.9 MMA3SW 3.1-9.9 0.93 0.88 0.84 0.88 0.77<br />
Work 10-20 MMA3SW 10-20 0.93 0.88 0.84 0.88 0.77<br />
Work 20+ MMA3SW 20+ 0.93 0.88 0.84 0.88 0.77<br />
Business MMA3SB 1.24 1.02 0.84 0.88 0.77<br />
Long Pleasure MMA3LP 0.93 0.88 0.84 0.88 0.77<br />
Work 0-3 MMA3LW 0-3 0.93 0.88 0.84 0.88 0.77<br />
Work 3.1-9.9 MMA3LW 3.1-9.9 0.93 0.88 0.84 0.88 0.77<br />
Work 10-20 MMA3LW 10-20 0.93 0.88 0.84 0.88 0.77<br />
Work 20+ MMA3LW 20+ 0.93 0.88 0.84 0.88 0.77<br />
Business MMA3LB 1.24 1.02 0.84 0.88 0.77<br />
65-70 Married Short All MMA4S 1.08 0.97 0.78 0.89 0.77<br />
71-75 Married MMA5S 1.18 1.09 0.78 0.90 0.68<br />
76-80 Married MMA6S 1.22 1.21 0.68 1.03 0.68<br />
81-85 Married MMA7S 1.22 1.42 0.68 1.12 0.68<br />
86+ Married MMA8S 1.22 1.47 0.68 1.14 0.68<br />
65-70 Married Long All MMA4L 1.08 0.97 0.78 0.89 0.77<br />
71-75 Married MMA5L 1.18 1.09 0.78 0.90 0.68<br />
76-80 Married MMA6L 1.22 1.21 0.68 1.03 0.68<br />
81-85 Married MMA7L 1.22 1.42 0.68 1.12 0.68<br />
86+ Married MMA8L 1.22 1.47 0.68 1.14 0.68<br />
Extra Vehicles All All EXV 1.08 1.02 1.15 1.07 0.97<br />
December 1, 2011 Allst<strong>at</strong>e Indemnity Company RP-8A
DELAWARE<br />
VOLUNTARY PRIVATE PASSENGER AUTO<br />
HOUSEHOLD COMPOSITION FACTORS<br />
RULE 48<br />
One Oper<strong>at</strong>or on Policy<br />
Number of Youngest Driver Age 14-20 Youngest Driver Age 21-24 Youngest Driver Age 25+<br />
Vehicles AA BB VA DD HH AA BB VA DD HH AA BB VA DD HH<br />
1 1.39 1.60 1.00 1.49 1.53 1.25 1.26 1.00 1.32 1.33 1.00 1.00 1.00 1.00 1.00<br />
2 1.00 1.05 0.64 1.63 1.74 0.82 0.88 0.64 1.20 1.74 0.75 0.79 0.64 0.87 1.04<br />
3 1.00 1.05 0.43 1.11 1.74 0.82 0.88 0.43 0.93 1.74 0.75 0.79 0.43 0.75 1.04<br />
4+ 1.00 1.05 0.43 1.11 1.74 0.82 0.88 0.43 0.93 1.74 0.75 0.79 0.43 0.75 1.04<br />
Two Oper<strong>at</strong>ors on Policy<br />
Number of Youngest Driver Age 14-20 Youngest Driver Age 21-24 Youngest Driver Age 25+<br />
Vehicles AA BB VA DD HH AA BB VA DD HH AA BB VA DD HH<br />
1 1.14 1.37 1.13 1.34 1.48 1.00 1.05 1.13 1.06 1.30 0.86 0.94 1.14 0.91 1.04<br />
2 0.94 1.07 0.82 1.16 1.03 0.82 0.91 0.82 0.98 1.03 0.74 0.80 0.82 0.80 0.90<br />
3 1.00 1.05 0.64 1.11 1.10 0.82 0.88 0.64 0.93 1.10 0.75 0.79 0.64 0.75 1.04<br />
4+ 1.00 1.05 0.43 1.11 1.14 0.82 0.88 0.43 0.93 1.14 0.75 0.79 0.43 0.75 1.04<br />
Three Oper<strong>at</strong>ors on Policy<br />
Number of Youngest Driver Age 14-20 Youngest Driver Age 21-24 Youngest Driver Age 25+<br />
Vehicles AA BB VA DD HH AA BB VA DD HH AA BB VA DD HH<br />
1 1.23 1.46 1.13 1.30 1.48 1.23 1.12 1.13 1.18 1.30 1.19 1.01 1.13 1.01 1.04<br />
2 1.14 1.14 0.91 1.15 1.08 1.00 0.88 0.91 1.01 1.08 0.86 0.86 0.91 0.89 1.04<br />
3 0.93 1.08 0.68 1.09 1.08 0.80 0.91 0.68 1.03 1.08 0.81 0.80 0.68 0.86 1.04<br />
4+ 1.00 1.05 0.64 1.11 1.08 0.82 0.88 0.64 0.93 1.08 0.75 0.79 0.64 0.75 1.04<br />
Four or More Oper<strong>at</strong>ors on Policy<br />
Number of Youngest Driver Age 14-20 Youngest Driver Age 21-24 Youngest Driver Age 25+<br />
Vehicles AA BB VA DD HH AA BB VA DD HH AA BB VA DD HH<br />
1 1.23 1.46 1.13 1.30 1.48 1.23 1.12 1.13 1.18 1.30 1.19 1.01 1.13 1.01 1.04<br />
2 1.23 1.46 0.91 1.30 1.09 1.23 1.12 0.91 1.18 1.09 1.19 1.01 0.91 1.01 1.04<br />
3 1.14 1.14 0.91 1.15 1.09 1.00 0.88 0.91 1.01 1.09 0.86 0.86 0.91 0.89 1.04<br />
4+ 0.93 1.08 0.68 1.09 1.09 0.80 0.91 0.68 1.03 1.09 0.81 0.80 0.68 0.86 1.04<br />
December 1, 2011 Allst<strong>at</strong>e Indemnity Company RP-9A
COLLISION AND COMPREHENSIVE<br />
MODEL YEAR FACTORS<br />
RULE 21<br />
LEASE OR LOAN GAP COVERAGE (RULE 41)<br />
COLLISION FACTOR = 0.07<br />
COMPREHENSIVE FACTOR = 0.07<br />
MODEL<br />
YEAR FACTOR Note: Both Collision and Comprehensive must be purchased.<br />
2012 3.82<br />
2011 3.57 REPAIR OR REPLACEMENT COST COVERAGE (RULE 42)<br />
2010 3.34<br />
2009 3.12 COLLISION FACTOR = 0.10<br />
2008 2.92<br />
2007 2.78 Note: Both Collision and Comprehensive must be purchased.<br />
2006 2.65<br />
2005 2.52<br />
2004 2.40<br />
2003 2.29<br />
2002 & 2.18<br />
PRIOR<br />
DELAWARE<br />
VOLUNTARY PRIVATE PASSENGER AUTO<br />
PHYSICAL DAMAGE RATING FACTORS<br />
SUBSEQUENT MODEL YEAR ADJUSTMENT:<br />
For model year factors not shown in the table, apply the following<br />
annual increase to the most recent model year factor shown above.<br />
Round to two decimal places after each calcul<strong>at</strong>ions.<br />
Collision = 7%<br />
Comprehensive = 7%<br />
DEDUCTIBLE BY PGS FACTOR DEDUCTIBLE BY PGS FACTOR<br />
RULES 19 AND 20 RULES 19 AND 20<br />
COLLISION COMPREHENSIVE<br />
DEDUCTIBLE DEDUCTIBLE<br />
PGS $200* $250 $500 $1,000 PGS $100 $150 $250 $500 $1,000<br />
M 0.75 0.71 0.54 0.34 M 0.71 0.60 0.48 0.37 0.26<br />
O 0.91 0.87 0.71 0.51 O 0.92 0.80 0.67 0.54 0.41<br />
S 1.03 1.00 0.85 0.64 S 1.34 1.17 1.00 0.83 0.66<br />
T 1.18 1.15 0.99 0.73 T 1.80 1.59 1.37 1.16 0.94<br />
U 1.33 1.29 1.12 0.89 U 2.28 2.06 1.83 1.68 1.37<br />
V 1.49 1.44 1.25 1.01 V 2.77 2.56 2.31 2.01 1.74<br />
W 1.68 1.63 1.43 1.16 W 3.34 3.12 2.80 2.48 2.15<br />
N 1.88 1.84 1.60 1.32 N 4.05 3.79 3.44 3.02 2.62<br />
P 1.88 1.84 1.60 1.32 P 4.05 3.79 3.44 3.02 2.62<br />
Q 2.19 2.14 1.93 1.63 Q 5.29 4.95 4.50 3.94 3.43<br />
R 2.19 2.14 1.93 1.63 R 5.29 4.95 4.50 3.94 3.43<br />
G 2.19 2.14 1.93 1.63 G 5.29 4.95 4.50 3.94 3.43<br />
I 2.64 2.59 2.34 1.98 I 7.14 6.84 6.39 5.71 4.96<br />
K 2.64 2.59 2.34 1.98 K 7.14 6.84 6.39 5.71 4.96<br />
C 3.19 3.13 2.86 2.46 C 9.42 9.03 8.44 7.75 6.77<br />
D 3.70 3.63 3.36 2.89 D 11.68 11.31 10.58 9.85 8.64<br />
E 4.33 4.24 3.92 3.38 E 13.77 13.34 12.48 11.62 10.18<br />
F 4.96 4.85 4.54 3.92 F 16.01 15.51 14.50 13.50 11.84<br />
H 5.61 5.49 5.14 4.44 H 18.64 18.05 16.88 15.72 13.78<br />
J 5.97 5.85 5.47 4.73 J 21.82 21.14 19.77 18.41 16.14<br />
L 6.69 6.55 6.13 5.29 L 23.09 22.36 20.92 19.48 17.07<br />
* These deductibles are available for existing policyholders prior to September 28, 1987 and Allst<strong>at</strong>e <strong>Insurance</strong> Company transfers only.<br />
December 1, 2011 Allst<strong>at</strong>e Indemnity Company RP-10A
DELAWARE<br />
VOLUNTARY PRIVATE PASSENGER AUTO<br />
ACCIDENT FACTORS<br />
RULE 12<br />
RATED OPERATOR AGE 20 OR LESS:<br />
0-11<br />
Months Since Most Recent Chargeable Accident<br />
12-23 24-35<br />
# of Chargeable<br />
Accidents in Last<br />
3 Years<br />
AA BB VA DD AA BB VA DD AA BB VA DD<br />
0 1.00 1.00 1.00 1.00 1.00 1.00 1.00 1.00 1.00 1.00 1.00 1.00<br />
1 1.39 1.22 1.20 1.20 1.16 1.10 1.20 1.11 1.12 1.03 1.03 1.00<br />
2 1.72 1.38 1.33 1.35 1.72 1.24 1.33 1.24 1.72 1.24 1.12 1.24<br />
3<br />
Each Additional<br />
1.99 1.89 2.18 1.82 1.79 1.52 1.86 1.52 1.79 1.52 1.86 1.52<br />
Accident add 0.28 add 0.28 add 0.29 add 0.26 add 0.28 add 0.28 add 0.29 add 0.26 add 0.28 add 0.28 add 0.29 add 0.26<br />
RATED OPERATOR AGE 21 - 24:<br />
0-11<br />
Months Since Most Recent Chargeable Accident<br />
12-23 24-35<br />
# of Chargeable<br />
Accidents in Last<br />
3 Years<br />
AA BB VA DD AA BB VA DD AA BB VA DD<br />
0 1.00 1.00 1.00 1.00 1.00 1.00 1.00 1.00 1.00 1.00 1.00 1.00<br />
1 1.39 1.22 1.23 1.20 1.16 1.10 1.23 1.11 1.12 1.03 1.06 1.00<br />
2 1.72 1.38 1.37 1.35 1.72 1.24 1.37 1.24 1.72 1.24 1.15 1.24<br />
3<br />
Each Additional<br />
1.99 1.89 2.24 1.82 1.79 1.52 1.92 1.52 1.79 1.52 1.92 1.52<br />
Accident add 0.28 add 0.28 add 0.29 add 0.26 add 0.28 add 0.28 add 0.29 add 0.26 add 0.28 add 0.28 add 0.29 add 0.26<br />
RATED OPERATOR AGE 25 - 49:<br />
0-11<br />
Months Since Most Recent Chargeable Accident<br />
12-23 24-35<br />
# of Chargeable<br />
Accidents in Last<br />
3 Years<br />
AA BB VA DD AA BB VA DD AA BB VA DD<br />
0 1.00 1.00 1.00 1.00 1.00 1.00 1.00 1.00 1.00 1.00 1.00 1.00<br />
1 1.39 1.45 1.23 1.34 1.16 1.31 1.23 1.23 1.12 1.21 1.06 1.10<br />
2 1.72 1.79 1.37 1.69 1.72 1.60 1.37 1.55 1.72 1.60 1.15 1.55<br />
3<br />
Each Additional<br />
1.99 2.82 2.24 2.46 1.79 2.26 1.92 2.05 1.79 2.26 1.92 2.05<br />
Accident add 0.96 add 0.91 add 0.42 add 0.66 add 0.96 add 0.91 add 0.42 add 0.66 add 0.96 add 0.91 add 0.42 add 0.66<br />
RATED OPERATOR AGE 50 OR OLDER:<br />
0-11<br />
Months Since Most Recent Chargeable Accident<br />
12-23 24-35<br />
# of Chargeable<br />
Accidents in Last<br />
3 Years<br />
AA BB VA DD AA BB VA DD AA BB VA DD<br />
0 1.00 1.00 1.00 1.00 1.00 1.00 1.00 1.00 1.00 1.00 1.00 1.00<br />
1 1.75 1.55 1.53 1.55 1.46 1.40 1.53 1.42 1.40 1.30 1.31 1.27<br />
2 2.08 2.16 1.81 1.86 2.08 1.94 1.81 1.70 2.08 1.94 1.51 1.70<br />
3<br />
Each Additional<br />
4.06 2.89 2.98 2.69 3.64 2.31 2.55 2.23 3.64 2.31 2.55 2.23<br />
Accident add 2.01 add 1.33 add 1.24 add 1.07 add 2.01 add 1.33 add 1.24 add 1.07 add 2.01 add 1.33 add 1.24 add 1.07<br />
December 1, 2011 Allst<strong>at</strong>e Indemnity Company RP-12A
DELAWARE<br />
VOLUNTARY PRIVATE PASSENGER AUTO<br />
MINOR VIOLATION FACTORS<br />
RULE 12<br />
RATED OPERATOR AGE 20 OR LESS:<br />
0-11<br />
Months Since Most Recent Minor Viol<strong>at</strong>ion<br />
12-23 24-35<br />
# of Minor<br />
Viol<strong>at</strong>ions in Last<br />
3 Years<br />
AA BB VA DD AA BB VA DD AA BB VA DD<br />
0 1.00 1.00 1.00 1.00 1.00 1.00 1.00 1.00 1.00 1.00 1.00 1.00<br />
1 1.00 1.00 1.00 1.04 1.00 1.00 1.00 1.00 1.00 1.00 1.00 1.00<br />
2 1.01 1.07 1.13 1.10 1.00 1.00 1.13 1.10 1.00 1.00 1.13 1.10<br />
3<br />
Each Additional<br />
1.13 1.13 1.16 1.27 1.08 1.07 1.16 1.15 1.08 1.07 1.16 1.12<br />
Minor Viol<strong>at</strong>ion add 0.02 add 0.02 add 0.05 add 0.06 add 0.02 add 0.02 add 0.05 add 0.06 add 0.02 add 0.02 add 0.05 add 0.06<br />
RATED OPERATOR AGE 21 - 24:<br />
0-11<br />
Months Since Most Recent Minor Viol<strong>at</strong>ion<br />
12-23 24-35<br />
# of Minor<br />
Viol<strong>at</strong>ions in Last<br />
3 Years<br />
AA BB VA DD AA BB VA DD AA BB VA DD<br />
0 1.00 1.00 1.00 1.00 1.00 1.00 1.00 1.00 1.00 1.00 1.00 1.00<br />
1 1.15 1.06 1.00 1.15 1.15 1.06 1.00 1.09 1.05 1.06 1.00 1.05<br />
2 1.20 1.29 1.13 1.22 1.19 1.17 1.13 1.22 1.19 1.17 1.13 1.22<br />
3<br />
Each Additional<br />
1.35 1.29 1.16 1.40 1.29 1.19 1.16 1.27 1.29 1.19 1.16 1.24<br />
Minor Viol<strong>at</strong>ion add 0.10 add 0.08 add 0.05 add 0.11 add 0.10 add 0.08 add 0.05 add 0.11 add 0.10 add 0.08 add 0.05 add 0.11<br />
RATED OPERATOR AGE 25 - 49:<br />
0-11<br />
Months Since Most Recent Minor Viol<strong>at</strong>ion<br />
12-23 24-35<br />
# of Minor<br />
Viol<strong>at</strong>ions in Last<br />
3 Years<br />
AA BB VA DD AA BB VA DD AA BB VA DD<br />
0 1.00 1.00 1.00 1.00 1.00 1.00 1.00 1.00 1.00 1.00 1.00 1.00<br />
1 1.15 1.10 1.00 1.19 1.15 1.10 1.00 1.13 1.05 1.10 1.00 1.09<br />
2 1.20 1.32 1.13 1.26 1.19 1.21 1.13 1.26 1.19 1.21 1.13 1.26<br />
3<br />
Each Additional<br />
1.35 1.39 1.16 1.45 1.29 1.32 1.16 1.31 1.29 1.32 1.16 1.28<br />
Minor Viol<strong>at</strong>ion add 0.10 add 0.13 add 0.05 add 0.14 add 0.10 add 0.13 add 0.05 add 0.14 add 0.10 add 0.13 add 0.05 add 0.14<br />
RATED OPERATOR AGE 50 OR OLDER:<br />
0-11<br />
Months Since Most Recent Minor Viol<strong>at</strong>ion<br />
12-23 24-35<br />
# of Minor<br />
Viol<strong>at</strong>ions in Last<br />
3 Years<br />
AA BB VA DD AA BB VA DD AA BB VA DD<br />
0 1.00 1.00 1.00 1.00 1.00 1.00 1.00 1.00 1.00 1.00 1.00 1.00<br />
1 1.24 1.20 1.18 1.20 1.24 1.20 1.18 1.15 1.13 1.20 1.18 1.11<br />
2 1.30 1.42 1.33 1.28 1.29 1.30 1.33 1.28 1.29 1.30 1.33 1.28<br />
3<br />
Each Additional<br />
1.45 1.54 1.37 1.47 1.39 1.46 1.37 1.33 1.39 1.46 1.37 1.30<br />
Minor Viol<strong>at</strong>ion add 0.20 add 0.21 add 0.22 add 0.16 add 0.20 add 0.21 add 0.22 add 0.16 add 0.20 add 0.21 add 0.22 add 0.16<br />
December 1, 2011 Allst<strong>at</strong>e Indemnity Company RP-13A
RATING FACTOR<br />
RATING PLAN RULE GROUP AA BB VA DD HH<br />
RESIDENT STUDENT DISCOUNT 28<br />
Male Restricted 16-20 (MR1-5) * 0.90 0.88 N/A 0.97 N/A<br />
Female Restricted 16-20 (FR1-5) * 0.90 0.88 N/A 0.97 N/A<br />
Male Restricted 21-24 (MR6-9) * 0.90 0.88 N/A 0.97 N/A<br />
Female Restricted 21-24 (FR6-9) * 0.90 0.88 N/A 0.97 N/A<br />
GOOD STUDENT DISCOUNT 39<br />
Male Basic (16-20) MB1-5, Male Restricted (16-20) MR1-5 * 0.90 0.90 0.90 0.90 0.90<br />
Female Basic (16-20) FB1-5, Female Restricted (16-20) FR1-5 * 0.90 0.90 0.90 0.90 0.90<br />
Male Basic (21-24) MB6-9, Male Restricted (21-24) MR6-9 * 0.90 0.90 0.90 0.90 0.90<br />
Female Basic (21-24) FB6-9, Female Restricted (21-24) FR6-9 * 0.90 0.90 0.90 0.90 0.90<br />
SENIOR ADULT DISCOUNT 30 N/A N/A 0.85 N/A N/A<br />
PASSIVE RESTRAINT DISCOUNT 25<br />
Airbags on both sides * N/A N/A 0.70 N/A N/A<br />
Airbags on driver side only * N/A N/A 0.80 N/A N/A<br />
Autom<strong>at</strong>ic motorized se<strong>at</strong>belts * N/A N/A 0.90 N/A N/A<br />
DEFENSIVE DRIVER DISCOUNT 27 * SEE RULE 27 N/A N/A<br />
CERTIFIED RISK SURCHARGE<br />
DELAWARE<br />
VOLUNTARY PRIVATE PASSENGER AUTO<br />
MISCELLANEOUS DISCOUNT & SURCHARGE RATING FACTORS<br />
Note: This factor is applied once per policy to the vehicle with the<br />
highest combined BI & PD premium.<br />
22 * 1.10 1.10 N/A N/A N/A<br />
ANTILOCK BRAKE DISCOUNT 26 * 0.90 0.90 N/A 0.90 N/A<br />
THE GOOD HANDS PEOPLE® DISCOUNT 45 * 0.90 0.90 0.90 0.90 0.90<br />
NONVERIFIABLE DRIVING RECORD SURCHARGE 14 * 1.10 1.10 1.10 1.10 N/A<br />
INEXPERIENCED OPERATOR SURCHARGE 24<br />
Years of<br />
Age Licensed Driving Experience<br />
14-16 All * 1.00 1.00 N/A 1.00 N/A<br />
17 < 1 Year * 1.38 1.21 N/A 1.27 N/A<br />
17 <strong>at</strong> least 1 Year but < 2 Years * 1.29 1.21 N/A 1.19 N/A<br />
17 <strong>at</strong> least 2 Years but < 3 Years * 1.29 1.10 N/A 1.11 N/A<br />
17 3 or More Years * 1.00 1.00 N/A 1.00 N/A<br />
18 < 1 Year * 1.38 1.21 N/A 1.27 N/A<br />
18 <strong>at</strong> least 1 Year but < 2 Years * 1.29 1.21 N/A 1.19 N/A<br />
18 <strong>at</strong> least 2 Years but < 3 Years * 1.29 1.10 N/A 1.11 N/A<br />
18 3 or More Years * 1.00 1.00 N/A 1.00 N/A<br />
19 < 1 Year * 1.38 1.21 N/A 1.27 N/A<br />
19 <strong>at</strong> least 1 Year but < 2 Years * 1.29 1.21 N/A 1.19 N/A<br />
19 <strong>at</strong> least 2 Years but < 3 Years * 1.29 1.10 N/A 1.11 N/A<br />
19 3 or More Years * 1.00 1.00 N/A 1.00 N/A<br />
20 < 1 Year * 1.38 1.21 N/A 1.27 N/A<br />
20 <strong>at</strong> least 1 Year but < 2 Years * 1.29 1.21 N/A 1.19 N/A<br />
20 <strong>at</strong> least 2 Years but < 3 Years * 1.29 1.10 N/A 1.11 N/A<br />
20 3 or More Years * 1.00 1.00 N/A 1.00 N/A<br />
21+ < 1 Year * 1.38 1.21 N/A 1.27 N/A<br />
21+ <strong>at</strong> least 1 Year but < 2 Years * 1.29 1.21 N/A 1.19 N/A<br />
21+ <strong>at</strong> least 2 Years but < 3 Years * 1.29 1.10 N/A 1.11 N/A<br />
21+ 3 or More Years * 1.00 1.00 N/A 1.00 N/A<br />
FUTURE EFFECTIVE DATE DISCOUNT 58 * 0.95 0.95 0.95 0.95 0.95<br />
GOOD PAYER DISCOUNT 43 * 0.90 0.90 0.90 0.90 0.90<br />
THE ALLSTATE® EASY PAY PLAN DISCOUNT 52 * 0.95 0.95 0.95 0.95 0.95<br />
HOMEOWNERSHIP DISCOUNT 44 1 0.95 0.95 0.95 0.95 0.95<br />
(R<strong>at</strong>ing Group is defined by Tier - please refer to the 2 0.95 0.95 0.95 0.95 0.95<br />
Tier section in the r<strong>at</strong>ing pages) 3 0.95 0.95 0.95 0.95 0.95<br />
4 0.95 0.95 0.95 0.95 0.95<br />
5 0.95 0.95 0.95 0.95 0.95<br />
6 0.95 0.95 0.95 0.95 0.95<br />
7 0.95 0.95 0.95 0.95 0.95<br />
8 0.95 0.95 0.95 0.95 0.95<br />
PERFORMANCE DISCOUNT 49 1 0.98 0.95 1.00 0.97 0.94<br />
(R<strong>at</strong>ing Group is defined by Tier - please refer to the 2 0.98 0.95 1.00 0.97 0.94<br />
Tier section in the r<strong>at</strong>ing pages) 3 0.98 0.95 1.00 0.97 0.94<br />
4 0.98 0.95 1.00 0.97 0.94<br />
5 0.98 0.95 1.00 0.97 0.94<br />
6 0.98 0.95 1.00 0.97 0.94<br />
7 0.98 0.95 1.00 0.97 0.94<br />
8 0.98 0.95 1.00 0.97 0.94<br />
December 1, 2011 Allst<strong>at</strong>e Indemnity Company RP-15A
DELAWARE<br />
VOLUNTARY PRIVATE PASSENGER AUTO<br />
MISCELLANEOUS DISCOUNT & SURCHARGE RATING FACTORS<br />
RATING FACTOR<br />
RATING PLAN RULE GROUP AA BB VA DD HH<br />
MULTIPLE POLICY DISCOUNT Homeowners 57 1 0.92 0.95 0.80 0.92 0.85<br />
(R<strong>at</strong>ing Group is defined by Tier - please refer to the Mobilehome and Manufactured Home Owners 1 0.92 0.95 0.80 0.92 0.85<br />
Tier section in the r<strong>at</strong>ing pages) Renters 1 0.92 0.95 0.80 0.92 0.85<br />
Condominium Owners 1 0.92 0.95 0.80 0.92 0.85<br />
Homeowners 2 0.92 0.95 0.80 0.92 0.85<br />
Mobilehome and Manufactured Home Owners 2 0.92 0.95 0.80 0.92 0.85<br />
Renters 2 0.92 0.95 0.80 0.92 0.85<br />
Condominium Owners 2 0.92 0.95 0.80 0.92 0.85<br />
Homeowners 3 0.92 0.95 0.80 0.92 0.85<br />
Mobilehome and Manufactured Home Owners 3 0.92 0.95 0.80 0.92 0.85<br />
Renters 3 0.92 0.95 0.80 0.92 0.85<br />
Condominium Owners 3 0.92 0.95 0.80 0.92 0.85<br />
Homeowners 4 0.92 0.95 0.80 0.92 0.85<br />
Mobilehome and Manufactured Home Owners 4 0.92 0.95 0.80 0.92 0.85<br />
Renters 4 0.92 0.95 0.80 0.92 0.85<br />
Condominium Owners 4 0.92 0.95 0.80 0.92 0.85<br />
Homeowners 5 0.92 0.95 0.80 0.92 0.85<br />
Mobilehome and Manufactured Home Owners 5 0.92 0.95 0.80 0.92 0.85<br />
Renters 5 0.92 0.95 0.80 0.92 0.85<br />
Condominium Owners 5 0.92 0.95 0.80 0.92 0.85<br />
Homeowners 6 0.92 0.95 0.80 0.92 0.85<br />
Mobilehome and Manufactured Home Owners 6 0.92 0.95 0.80 0.92 0.85<br />
Renters 6 0.92 0.95 0.80 0.92 0.85<br />
Condominium Owners 6 0.92 0.95 0.80 0.92 0.85<br />
Homeowners 7 0.92 0.95 0.80 0.92 0.85<br />
Mobilehome and Manufactured Home Owners 7 0.92 0.95 0.80 0.92 0.85<br />
Renters 7 0.92 0.95 0.80 0.92 0.85<br />
Condominium Owners 7 0.92 0.95 0.80 0.92 0.85<br />
Homeowners 8 0.92 0.95 0.80 0.92 0.85<br />
Mobilehome and Manufactured Home Owners 8 0.92 0.95 0.80 0.92 0.85<br />
Renters 8 0.92 0.95 0.80 0.92 0.85<br />
Condominium Owners 8 0.92 0.95 0.80 0.92 0.85<br />
TIER 1 51 1 0.68 0.80 0.44 0.77 0.60<br />
2 1 0.68 0.80 0.50 0.77 0.65<br />
3 1 0.74 0.82 0.63 0.78 0.69<br />
4 1 0.71 0.80 0.51 0.82 0.64<br />
5 1 0.71 0.80 0.58 0.82 0.69<br />
6 2 0.77 0.82 0.73 0.84 0.73<br />
7 1 0.68 0.80 0.44 0.77 0.60<br />
8 2 0.68 0.80 0.50 0.77 0.65<br />
9 2 0.74 0.82 0.63 0.78 0.69<br />
10 2 0.71 0.80 0.51 0.82 0.64<br />
11 2 0.71 0.80 0.58 0.82 0.69<br />
12 3 0.77 0.82 0.73 0.84 0.73<br />
13 1 0.68 0.80 0.44 0.77 0.60<br />
14 1 0.68 0.80 0.50 0.77 0.65<br />
15 1 0.74 0.82 0.63 0.78 0.69<br />
16 1 0.71 0.80 0.51 0.82 0.64<br />
17 1 0.71 0.80 0.58 0.82 0.69<br />
18 2 0.77 0.82 0.73 0.84 0.73<br />
19 1 0.68 0.80 0.44 0.77 0.60<br />
20 2 0.68 0.80 0.50 0.77 0.65<br />
21 2 0.74 0.82 0.63 0.78 0.69<br />
22 2 0.71 0.80 0.51 0.82 0.64<br />
23 2 0.71 0.80 0.58 0.82 0.69<br />
24 3 0.77 0.82 0.73 0.84 0.73<br />
25 1 0.71 0.80 0.51 0.82 0.64<br />
26 2 0.71 0.80 0.58 0.82 0.69<br />
27 2 0.77 0.82 0.73 0.84 0.73<br />
28 1 0.71 0.80 0.51 0.82 0.64<br />
29 1 0.71 0.80 0.58 0.82 0.69<br />
30 2 0.77 0.82 0.73 0.84 0.73<br />
31 1 0.69 0.81 0.45 0.77 0.61<br />
32 1 0.69 0.81 0.51 0.77 0.67<br />
33 2 0.75 0.84 0.65 0.79 0.71<br />
34 1 0.72 0.81 0.53 0.83 0.65<br />
35 2 0.72 0.81 0.59 0.83 0.71<br />
36 2 0.78 0.84 0.75 0.85 0.75<br />
37 2 0.69 0.81 0.45 0.77 0.61<br />
38 2 0.69 0.81 0.51 0.77 0.67<br />
39 3 0.75 0.84 0.65 0.79 0.71<br />
40 2 0.72 0.81 0.53 0.83 0.65<br />
41 2 0.72 0.81 0.59 0.83 0.71<br />
42 3 0.78 0.84 0.75 0.85 0.75<br />
43 1 0.69 0.81 0.45 0.77 0.61<br />
44 1 0.69 0.81 0.51 0.77 0.67<br />
45 2 0.75 0.84 0.65 0.79 0.71<br />
46 1 0.72 0.81 0.53 0.83 0.65<br />
47 2 0.72 0.81 0.59 0.83 0.71<br />
48 2 0.78 0.84 0.75 0.85 0.75<br />
49 2 0.69 0.81 0.45 0.77 0.61<br />
50 2 0.69 0.81 0.51 0.77 0.67<br />
51 3 0.75 0.84 0.65 0.79 0.71<br />
52 2 0.72 0.81 0.53 0.83 0.65<br />
53 2 0.72 0.81 0.59 0.83 0.71<br />
54 3 0.78 0.84 0.75 0.85 0.75<br />
55 2 0.72 0.81 0.53 0.83 0.65<br />
56 2 0.72 0.81 0.59 0.83 0.71<br />
57 3 0.78 0.84 0.75 0.85 0.75<br />
58 1 0.72 0.81 0.53 0.83 0.65<br />
59 2 0.72 0.81 0.59 0.83 0.71<br />
60 2 0.78 0.84 0.75 0.85 0.75<br />
December 1, 2011 Allst<strong>at</strong>e Indemnity Company RP-16A
DELAWARE<br />
VOLUNTARY PRIVATE PASSENGER AUTO<br />
MISCELLANEOUS DISCOUNT & SURCHARGE RATING FACTORS<br />
RATING FACTOR<br />
RATING PLAN RULE GROUP AA BB VA DD HH<br />
61 1 0.71 0.82 0.47 0.79 0.64<br />
62 2 0.71 0.82 0.53 0.79 0.70<br />
63 2 0.77 0.85 0.67 0.81 0.73<br />
64 1 0.74 0.82 0.55 0.85 0.68<br />
65 2 0.74 0.82 0.62 0.85 0.74<br />
66 2 0.80 0.85 0.78 0.87 0.78<br />
67 2 0.71 0.82 0.47 0.79 0.64<br />
68 2 0.71 0.82 0.53 0.79 0.70<br />
69 3 0.77 0.85 0.67 0.81 0.73<br />
70 2 0.74 0.82 0.55 0.85 0.68<br />
71 3 0.74 0.82 0.62 0.85 0.74<br />
72 3 0.80 0.85 0.78 0.87 0.78<br />
73 1 0.71 0.82 0.47 0.79 0.64<br />
74 2 0.71 0.82 0.53 0.79 0.70<br />
75 2 0.77 0.85 0.67 0.81 0.73<br />
76 1 0.74 0.82 0.55 0.85 0.68<br />
77 2 0.74 0.82 0.62 0.85 0.74<br />
78 2 0.80 0.85 0.78 0.87 0.78<br />
79 2 0.71 0.82 0.47 0.79 0.64<br />
80 2 0.71 0.82 0.53 0.79 0.70<br />
81 3 0.77 0.85 0.67 0.81 0.73<br />
82 2 0.74 0.82 0.55 0.85 0.68<br />
83 3 0.74 0.82 0.62 0.85 0.74<br />
84 3 0.80 0.85 0.78 0.87 0.78<br />
85 2 0.74 0.82 0.55 0.85 0.68<br />
86 2 0.74 0.82 0.62 0.85 0.74<br />
87 3 0.80 0.85 0.78 0.87 0.78<br />
88 1 0.74 0.82 0.55 0.85 0.68<br />
89 2 0.74 0.82 0.62 0.85 0.74<br />
90 2 0.80 0.85 0.78 0.87 0.78<br />
91 1 0.72 0.83 0.48 0.80 0.65<br />
92 2 0.72 0.83 0.54 0.80 0.71<br />
93 2 0.78 0.86 0.69 0.82 0.75<br />
94 2 0.75 0.83 0.56 0.86 0.70<br />
95 2 0.75 0.83 0.63 0.86 0.76<br />
96 3 0.81 0.86 0.80 0.88 0.80<br />
97 2 0.72 0.83 0.48 0.80 0.65<br />
98 3 0.72 0.83 0.54 0.80 0.71<br />
99 3 0.78 0.86 0.69 0.82 0.75<br />
100 2 0.75 0.83 0.56 0.86 0.70<br />
101 3 0.75 0.83 0.63 0.86 0.76<br />
102 4 0.81 0.86 0.80 0.88 0.80<br />
103 1 0.72 0.83 0.48 0.80 0.65<br />
104 2 0.72 0.83 0.54 0.80 0.71<br />
105 2 0.78 0.86 0.69 0.82 0.75<br />
106 2 0.75 0.83 0.56 0.86 0.70<br />
107 2 0.75 0.83 0.63 0.86 0.76<br />
108 3 0.81 0.86 0.80 0.88 0.80<br />
109 2 0.72 0.83 0.48 0.80 0.65<br />
110 3 0.72 0.83 0.54 0.80 0.71<br />
111 3 0.78 0.86 0.69 0.82 0.75<br />
112 2 0.75 0.83 0.56 0.86 0.70<br />
113 3 0.75 0.83 0.63 0.86 0.76<br />
114 4 0.81 0.86 0.80 0.88 0.80<br />
115 2 0.75 0.83 0.56 0.86 0.70<br />
116 2 0.75 0.83 0.63 0.86 0.76<br />
117 3 0.81 0.86 0.80 0.88 0.80<br />
118 2 0.75 0.83 0.56 0.86 0.70<br />
119 2 0.75 0.83 0.63 0.86 0.76<br />
120 3 0.81 0.86 0.80 0.88 0.80<br />
121 1 0.73 0.84 0.50 0.82 0.68<br />
122 2 0.73 0.84 0.56 0.82 0.74<br />
123 2 0.80 0.87 0.71 0.84 0.78<br />
124 2 0.76 0.84 0.58 0.88 0.72<br />
125 2 0.76 0.84 0.66 0.88 0.79<br />
126 3 0.83 0.87 0.83 0.90 0.83<br />
127 2 0.73 0.84 0.50 0.82 0.68<br />
128 3 0.73 0.84 0.56 0.82 0.74<br />
129 3 0.80 0.87 0.71 0.84 0.78<br />
130 3 0.76 0.84 0.58 0.88 0.72<br />
131 3 0.76 0.84 0.66 0.88 0.79<br />
132 4 0.83 0.87 0.83 0.90 0.83<br />
133 1 0.73 0.84 0.50 0.82 0.68<br />
134 2 0.73 0.84 0.56 0.82 0.74<br />
135 2 0.80 0.87 0.71 0.84 0.78<br />
136 2 0.76 0.84 0.58 0.88 0.72<br />
137 2 0.76 0.84 0.66 0.88 0.79<br />
138 3 0.83 0.87 0.83 0.90 0.83<br />
139 2 0.73 0.84 0.50 0.82 0.68<br />
140 3 0.73 0.84 0.56 0.82 0.74<br />
141 3 0.80 0.87 0.71 0.84 0.78<br />
142 3 0.76 0.84 0.58 0.88 0.72<br />
143 3 0.76 0.84 0.66 0.88 0.79<br />
144 4 0.83 0.87 0.83 0.90 0.83<br />
145 2 0.76 0.84 0.58 0.88 0.72<br />
146 3 0.76 0.84 0.66 0.88 0.79<br />
147 3 0.83 0.87 0.83 0.90 0.83<br />
148 2 0.76 0.84 0.58 0.88 0.72<br />
149 2 0.76 0.84 0.66 0.88 0.79<br />
150 3 0.83 0.87 0.83 0.90 0.83<br />
151 2 0.75 0.86 0.51 0.83 0.70<br />
152 2 0.75 0.86 0.58 0.83 0.76<br />
153 3 0.82 0.89 0.73 0.85 0.80<br />
154 2 0.78 0.86 0.60 0.89 0.74<br />
155 2 0.78 0.86 0.67 0.89 0.81<br />
156 3 0.85 0.89 0.85 0.91 0.85<br />
157 2 0.75 0.86 0.51 0.83 0.70<br />
158 3 0.75 0.86 0.58 0.83 0.76<br />
159 4 0.82 0.89 0.73 0.85 0.80<br />
160 3 0.78 0.86 0.60 0.89 0.74<br />
December 1, 2011 Allst<strong>at</strong>e Indemnity Company RP-17A
DELAWARE<br />
VOLUNTARY PRIVATE PASSENGER AUTO<br />
MISCELLANEOUS DISCOUNT & SURCHARGE RATING FACTORS<br />
RATING FACTOR<br />
RATING PLAN RULE GROUP AA BB VA DD HH<br />
161 3 0.78 0.86 0.67 0.89 0.81<br />
162 4 0.85 0.89 0.85 0.91 0.85<br />
163 2 0.75 0.86 0.51 0.83 0.70<br />
164 2 0.75 0.86 0.58 0.83 0.76<br />
165 3 0.82 0.89 0.73 0.85 0.80<br />
166 2 0.78 0.86 0.60 0.89 0.74<br />
167 2 0.78 0.86 0.67 0.89 0.81<br />
168 3 0.85 0.89 0.85 0.91 0.85<br />
169 2 0.75 0.86 0.51 0.83 0.70<br />
170 3 0.75 0.86 0.58 0.83 0.76<br />
171 4 0.82 0.89 0.73 0.85 0.80<br />
172 3 0.78 0.86 0.60 0.89 0.74<br />
173 3 0.78 0.86 0.67 0.89 0.81<br />
174 4 0.85 0.89 0.85 0.91 0.85<br />
175 2 0.78 0.86 0.60 0.89 0.74<br />
176 3 0.78 0.86 0.67 0.89 0.81<br />
177 3 0.85 0.89 0.85 0.91 0.85<br />
178 2 0.78 0.86 0.60 0.89 0.74<br />
179 2 0.78 0.86 0.67 0.89 0.81<br />
180 3 0.85 0.89 0.85 0.91 0.85<br />
181 2 0.76 0.87 0.53 0.85 0.72<br />
182 2 0.76 0.87 0.60 0.85 0.79<br />
183 3 0.83 0.90 0.76 0.86 0.83<br />
184 2 0.79 0.87 0.62 0.91 0.77<br />
185 3 0.79 0.87 0.70 0.91 0.84<br />
186 3 0.86 0.90 0.88 0.93 0.88<br />
187 3 0.76 0.87 0.53 0.85 0.72<br />
188 3 0.76 0.87 0.60 0.85 0.79<br />
189 4 0.83 0.90 0.76 0.86 0.83<br />
190 3 0.79 0.87 0.62 0.91 0.77<br />
191 4 0.79 0.87 0.70 0.91 0.84<br />
192 4 0.86 0.90 0.88 0.93 0.88<br />
193 2 0.76 0.87 0.53 0.85 0.72<br />
194 2 0.76 0.87 0.60 0.85 0.79<br />
195 3 0.83 0.90 0.76 0.86 0.83<br />
196 2 0.79 0.87 0.62 0.91 0.77<br />
197 3 0.79 0.87 0.70 0.91 0.84<br />
198 3 0.86 0.90 0.88 0.93 0.88<br />
199 3 0.76 0.87 0.53 0.85 0.72<br />
200 3 0.76 0.87 0.60 0.85 0.79<br />
201 4 0.83 0.90 0.76 0.86 0.83<br />
202 3 0.79 0.87 0.62 0.91 0.77<br />
203 4 0.79 0.87 0.70 0.91 0.84<br />
204 4 0.86 0.90 0.88 0.93 0.88<br />
205 2 0.79 0.87 0.62 0.91 0.77<br />
206 3 0.79 0.87 0.70 0.91 0.84<br />
207 4 0.86 0.90 0.88 0.93 0.88<br />
208 2 0.79 0.87 0.62 0.91 0.77<br />
209 3 0.79 0.87 0.70 0.91 0.84<br />
210 3 0.86 0.90 0.88 0.93 0.88<br />
211 2 0.78 0.88 0.55 0.87 0.74<br />
212 3 0.78 0.88 0.62 0.87 0.81<br />
213 3 0.84 0.91 0.78 0.88 0.86<br />
214 3 0.81 0.88 0.64 0.93 0.79<br />
215 3 0.81 0.88 0.72 0.93 0.86<br />
216 4 0.88 0.91 0.91 0.95 0.91<br />
217 3 0.78 0.88 0.55 0.87 0.74<br />
218 4 0.78 0.88 0.62 0.87 0.81<br />
219 5 0.84 0.91 0.78 0.88 0.86<br />
220 4 0.81 0.88 0.64 0.93 0.79<br />
221 4 0.81 0.88 0.72 0.93 0.86<br />
222 5 0.88 0.91 0.91 0.95 0.91<br />
223 2 0.78 0.88 0.55 0.87 0.74<br />
224 3 0.78 0.88 0.62 0.87 0.81<br />
225 3 0.84 0.91 0.78 0.88 0.86<br />
226 3 0.81 0.88 0.64 0.93 0.79<br />
227 3 0.81 0.88 0.72 0.93 0.86<br />
228 4 0.88 0.91 0.91 0.95 0.91<br />
229 3 0.78 0.88 0.55 0.87 0.74<br />
230 4 0.78 0.88 0.62 0.87 0.81<br />
231 5 0.84 0.91 0.78 0.88 0.86<br />
232 4 0.81 0.88 0.64 0.93 0.79<br />
233 4 0.81 0.88 0.72 0.93 0.86<br />
234 5 0.88 0.91 0.91 0.95 0.91<br />
235 3 0.81 0.88 0.64 0.93 0.79<br />
236 4 0.81 0.88 0.72 0.93 0.86<br />
237 4 0.88 0.91 0.91 0.95 0.91<br />
238 3 0.81 0.88 0.64 0.93 0.79<br />
239 3 0.81 0.88 0.72 0.93 0.86<br />
240 4 0.88 0.91 0.91 0.95 0.91<br />
241 3 0.79 0.90 0.57 0.87 0.77<br />
242 3 0.79 0.90 0.64 0.87 0.84<br />
243 4 0.86 0.93 0.81 0.89 0.88<br />
244 3 0.83 0.90 0.66 0.94 0.82<br />
245 4 0.83 0.90 0.74 0.94 0.89<br />
246 4 0.90 0.93 0.94 0.96 0.94<br />
247 4 0.79 0.90 0.57 0.87 0.77<br />
248 4 0.79 0.90 0.64 0.87 0.84<br />
249 5 0.86 0.93 0.81 0.89 0.88<br />
250 4 0.83 0.90 0.66 0.94 0.82<br />
251 5 0.83 0.90 0.74 0.94 0.89<br />
252 6 0.90 0.93 0.94 0.96 0.94<br />
253 3 0.79 0.90 0.57 0.87 0.77<br />
254 3 0.79 0.90 0.64 0.87 0.84<br />
255 4 0.86 0.93 0.81 0.89 0.88<br />
256 3 0.83 0.90 0.66 0.94 0.82<br />
257 4 0.83 0.90 0.74 0.94 0.89<br />
258 4 0.90 0.93 0.94 0.96 0.94<br />
259 4 0.79 0.90 0.57 0.87 0.77<br />
260 4 0.79 0.90 0.64 0.87 0.84<br />
December 1, 2011 Allst<strong>at</strong>e Indemnity Company RP-18A
DELAWARE<br />
VOLUNTARY PRIVATE PASSENGER AUTO<br />
MISCELLANEOUS DISCOUNT & SURCHARGE RATING FACTORS<br />
RATING FACTOR<br />
RATING PLAN RULE GROUP AA BB VA DD HH<br />
261 5 0.86 0.93 0.81 0.89 0.88<br />
262 4 0.83 0.90 0.66 0.94 0.82<br />
263 5 0.83 0.90 0.74 0.94 0.89<br />
264 6 0.90 0.93 0.94 0.96 0.94<br />
265 3 0.83 0.90 0.66 0.94 0.82<br />
266 4 0.83 0.90 0.74 0.94 0.89<br />
267 5 0.90 0.93 0.94 0.96 0.94<br />
268 3 0.83 0.90 0.66 0.94 0.82<br />
269 4 0.83 0.90 0.74 0.94 0.89<br />
270 4 0.90 0.93 0.94 0.96 0.94<br />
271 3 0.81 0.91 0.58 0.89 0.79<br />
272 3 0.81 0.91 0.66 0.89 0.87<br />
273 4 0.88 0.94 0.83 0.91 0.91<br />
274 3 0.85 0.91 0.68 0.96 0.84<br />
275 4 0.85 0.91 0.77 0.96 0.92<br />
276 5 0.92 0.94 0.97 0.98 0.97<br />
277 4 0.81 0.91 0.58 0.89 0.79<br />
278 5 0.81 0.91 0.66 0.89 0.87<br />
279 6 0.88 0.94 0.83 0.91 0.91<br />
280 4 0.85 0.91 0.68 0.96 0.84<br />
281 5 0.85 0.91 0.77 0.96 0.92<br />
282 6 0.92 0.94 0.97 0.98 0.97<br />
283 3 0.81 0.91 0.58 0.89 0.79<br />
284 3 0.81 0.91 0.66 0.89 0.87<br />
285 4 0.88 0.94 0.83 0.91 0.91<br />
286 3 0.85 0.91 0.68 0.96 0.84<br />
287 4 0.85 0.91 0.77 0.96 0.92<br />
288 5 0.92 0.94 0.97 0.98 0.97<br />
289 4 0.81 0.91 0.58 0.89 0.79<br />
290 5 0.81 0.91 0.66 0.89 0.87<br />
291 6 0.88 0.94 0.83 0.91 0.91<br />
292 4 0.85 0.91 0.68 0.96 0.84<br />
293 5 0.85 0.91 0.77 0.96 0.92<br />
294 6 0.92 0.94 0.97 0.98 0.97<br />
295 4 0.85 0.91 0.68 0.96 0.84<br />
296 4 0.85 0.91 0.77 0.96 0.92<br />
297 5 0.92 0.94 0.97 0.98 0.97<br />
298 3 0.85 0.91 0.68 0.96 0.84<br />
299 4 0.85 0.91 0.77 0.96 0.92<br />
300 5 0.92 0.94 0.97 0.98 0.97<br />
301 2 0.83 0.93 0.60 0.91 0.82<br />
302 2 0.83 0.93 0.68 0.91 0.89<br />
303 4 0.90 0.96 0.86 0.93 0.94<br />
304 3 0.86 0.93 0.70 0.98 0.87<br />
305 4 0.86 0.93 0.79 0.98 0.95<br />
306 5 0.94 0.96 1.00 1.00 1.00<br />
307 4 0.83 0.93 0.60 0.91 0.82<br />
308 5 0.83 0.93 0.68 0.91 0.89<br />
309 6 0.90 0.96 0.86 0.93 0.94<br />
310 5 0.86 0.93 0.70 0.98 0.87<br />
311 6 0.86 0.93 0.79 0.98 0.95<br />
312 7 0.94 0.96 1.00 1.00 1.00<br />
313 3 0.83 0.93 0.60 0.91 0.82<br />
314 4 0.83 0.93 0.68 0.91 0.89<br />
315 4 0.90 0.96 0.86 0.93 0.94<br />
316 3 0.86 0.93 0.70 0.98 0.87<br />
317 4 0.86 0.93 0.79 0.98 0.95<br />
318 5 0.94 0.96 1.00 1.00 1.00<br />
319 4 0.83 0.93 0.60 0.91 0.82<br />
320 5 0.83 0.93 0.68 0.91 0.89<br />
321 6 0.90 0.96 0.86 0.93 0.94<br />
322 5 0.86 0.93 0.70 0.98 0.87<br />
323 6 0.86 0.93 0.79 0.98 0.95<br />
324 7 0.94 0.96 1.00 1.00 1.00<br />
325 4 0.86 0.93 0.70 0.98 0.87<br />
326 5 0.86 0.93 0.79 0.98 0.95<br />
327 6 0.94 0.96 1.00 1.00 1.00<br />
328 3 0.86 0.93 0.70 0.98 0.87<br />
329 4 0.86 0.93 0.79 0.98 0.95<br />
330 5 0.94 0.96 1.00 1.00 1.00<br />
331 2 0.85 0.94 0.62 0.93 0.84<br />
332 3 0.85 0.94 0.70 0.93 0.92<br />
333 5 0.92 0.97 0.89 0.95 0.97<br />
334 4 0.88 0.94 0.72 1.00 0.90<br />
335 5 0.88 0.94 0.81 1.00 0.98<br />
336 5 0.96 0.97 1.03 1.02 1.03<br />
337 5 0.85 0.94 0.62 0.93 0.84<br />
338 5 0.85 0.94 0.70 0.93 0.92<br />
339 6 0.92 0.97 0.89 0.95 0.97<br />
340 5 0.88 0.94 0.72 1.00 0.90<br />
341 6 0.88 0.94 0.81 1.00 0.98<br />
342 7 0.96 0.97 1.03 1.02 1.03<br />
343 3 0.85 0.94 0.62 0.93 0.84<br />
344 4 0.85 0.94 0.70 0.93 0.92<br />
345 5 0.92 0.97 0.89 0.95 0.97<br />
346 4 0.88 0.94 0.72 1.00 0.90<br />
347 5 0.88 0.94 0.81 1.00 0.98<br />
348 5 0.96 0.97 1.03 1.02 1.03<br />
349 5 0.85 0.94 0.62 0.93 0.84<br />
350 5 0.85 0.94 0.70 0.93 0.92<br />
351 6 0.92 0.97 0.89 0.95 0.97<br />
352 5 0.88 0.94 0.72 1.00 0.90<br />
353 6 0.88 0.94 0.81 1.00 0.98<br />
354 7 0.96 0.97 1.03 1.02 1.03<br />
355 4 0.88 0.94 0.72 1.00 0.90<br />
356 5 0.88 0.94 0.81 1.00 0.98<br />
357 6 0.96 0.97 1.03 1.02 1.03<br />
358 4 0.88 0.94 0.72 1.00 0.90<br />
359 5 0.88 0.94 0.81 1.00 0.98<br />
360 5 0.96 0.97 1.03 1.02 1.03<br />
December 1, 2011 Allst<strong>at</strong>e Indemnity Company RP-19A
DELAWARE<br />
VOLUNTARY PRIVATE PASSENGER AUTO<br />
MISCELLANEOUS DISCOUNT & SURCHARGE RATING FACTORS<br />
RATING FACTOR<br />
RATING PLAN RULE GROUP AA BB VA DD HH<br />
361 3 0.87 0.96 0.64 0.95 0.88<br />
362 3 0.87 0.96 0.73 0.95 0.96<br />
363 5 0.94 0.99 0.92 0.97 1.01<br />
364 4 0.90 0.96 0.75 1.02 0.93<br />
365 5 0.90 0.96 0.85 1.02 1.02<br />
366 6 0.98 0.99 1.07 1.04 1.07<br />
367 5 0.87 0.96 0.64 0.95 0.88<br />
368 5 0.87 0.96 0.73 0.95 0.96<br />
369 7 0.94 0.99 0.92 0.97 1.01<br />
370 5 0.90 0.96 0.75 1.02 0.93<br />
371 6 0.90 0.96 0.85 1.02 1.02<br />
372 7 0.98 0.99 1.07 1.04 1.07<br />
373 3 0.87 0.96 0.64 0.95 0.88<br />
374 4 0.87 0.96 0.73 0.95 0.96<br />
375 5 0.94 0.99 0.92 0.97 1.01<br />
376 4 0.90 0.96 0.75 1.02 0.93<br />
377 5 0.90 0.96 0.85 1.02 1.02<br />
378 6 0.98 0.99 1.07 1.04 1.07<br />
379 5 0.87 0.96 0.64 0.95 0.88<br />
380 6 0.87 0.96 0.73 0.95 0.96<br />
381 7 0.94 0.99 0.92 0.97 1.01<br />
382 5 0.90 0.96 0.75 1.02 0.93<br />
383 6 0.90 0.96 0.85 1.02 1.02<br />
384 7 0.98 0.99 1.07 1.04 1.07<br />
385 4 0.90 0.96 0.75 1.02 0.93<br />
386 5 0.90 0.96 0.85 1.02 1.02<br />
387 6 0.98 0.99 1.07 1.04 1.07<br />
388 4 0.90 0.96 0.75 1.02 0.93<br />
389 5 0.90 0.96 0.85 1.02 1.02<br />
390 6 0.98 0.99 1.07 1.04 1.07<br />
391 3 0.88 0.97 0.66 0.97 0.90<br />
392 3 0.88 0.97 0.75 0.97 0.98<br />
393 5 0.96 1.00 0.95 0.99 1.03<br />
394 4 0.92 0.97 0.77 1.04 0.96<br />
395 5 0.92 0.97 0.87 1.04 1.05<br />
396 6 1.00 1.00 1.10 1.06 1.10<br />
397 5 0.88 0.97 0.66 0.97 0.90<br />
398 6 0.88 0.97 0.75 0.97 0.98<br />
399 7 0.96 1.00 0.95 0.99 1.03<br />
400 6 0.92 0.97 0.77 1.04 0.96<br />
401 7 0.92 0.97 0.87 1.04 1.05<br />
402 8 1.00 1.00 1.10 1.06 1.10<br />
403 4 0.88 0.97 0.66 0.97 0.90<br />
404 5 0.88 0.97 0.75 0.97 0.98<br />
405 5 0.96 1.00 0.95 0.99 1.03<br />
406 4 0.92 0.97 0.77 1.04 0.96<br />
407 5 0.92 0.97 0.87 1.04 1.05<br />
408 6 1.00 1.00 1.10 1.06 1.10<br />
409 5 0.88 0.97 0.66 0.97 0.90<br />
410 6 0.88 0.97 0.75 0.97 0.98<br />
411 7 0.96 1.00 0.95 0.99 1.03<br />
412 6 0.92 0.97 0.77 1.04 0.96<br />
413 7 0.92 0.97 0.87 1.04 1.05<br />
414 8 1.00 1.00 1.10 1.06 1.10<br />
415 5 0.92 0.97 0.77 1.04 0.96<br />
416 6 0.92 0.97 0.87 1.04 1.05<br />
417 7 1.00 1.00 1.10 1.06 1.10<br />
418 4 0.92 0.97 0.77 1.04 0.96<br />
419 5 0.92 0.97 0.87 1.04 1.05<br />
420 6 1.00 1.00 1.10 1.06 1.10<br />
421 3 0.90 0.99 0.69 0.98 0.93<br />
422 3 0.90 0.99 0.77 0.98 1.02<br />
423 6 0.98 1.02 0.98 1.00 1.07<br />
424 5 0.94 0.99 0.80 1.06 0.99<br />
425 6 0.94 0.99 0.90 1.06 1.08<br />
426 7 1.02 1.02 1.14 1.08 1.14<br />
427 6 0.90 0.99 0.69 0.98 0.93<br />
428 7 0.90 0.99 0.77 0.98 1.02<br />
429 8 0.98 1.02 0.98 1.00 1.07<br />
430 7 0.94 0.99 0.80 1.06 0.99<br />
431 7 0.94 0.99 0.90 1.06 1.08<br />
432 8 1.02 1.02 1.14 1.08 1.14<br />
433 4 0.90 0.99 0.69 0.98 0.93<br />
434 5 0.90 0.99 0.77 0.98 1.02<br />
435 6 0.98 1.02 0.98 1.00 1.07<br />
436 5 0.94 0.99 0.80 1.06 0.99<br />
437 6 0.94 0.99 0.90 1.06 1.08<br />
438 7 1.02 1.02 1.14 1.08 1.14<br />
439 6 0.90 0.99 0.69 0.98 0.93<br />
440 7 0.90 0.99 0.77 0.98 1.02<br />
441 8 0.98 1.02 0.98 1.00 1.07<br />
442 7 0.94 0.99 0.80 1.06 0.99<br />
443 7 0.94 0.99 0.90 1.06 1.08<br />
444 8 1.02 1.02 1.14 1.08 1.14<br />
445 6 0.94 0.99 0.80 1.06 0.99<br />
446 7 0.94 0.99 0.90 1.06 1.08<br />
447 7 1.02 1.02 1.14 1.08 1.14<br />
448 5 0.94 0.99 0.80 1.06 0.99<br />
449 6 0.94 0.99 0.90 1.06 1.08<br />
450 7 1.02 1.02 1.14 1.08 1.14<br />
451 3 0.92 1.00 0.71 1.00 0.97<br />
452 4 0.92 1.00 0.80 1.00 1.05<br />
453 7 1.00 1.03 1.01 1.02 1.11<br />
454 6 0.96 1.00 0.83 1.08 1.03<br />
455 7 0.96 1.00 0.93 1.08 1.12<br />
456 8 1.04 1.03 1.18 1.10 1.18<br />
457 7 0.92 1.00 0.71 1.00 0.97<br />
458 8 0.92 1.00 0.80 1.00 1.05<br />
459 8 1.00 1.03 1.01 1.02 1.11<br />
460 8 0.96 1.00 0.83 1.08 1.03<br />
December 1, 2011 Allst<strong>at</strong>e Indemnity Company RP-20A
DELAWARE<br />
VOLUNTARY PRIVATE PASSENGER AUTO<br />
MISCELLANEOUS DISCOUNT & SURCHARGE RATING FACTORS<br />
RATING FACTOR<br />
RATING PLAN RULE GROUP AA BB VA DD HH<br />
461 8 0.96 1.00 0.93 1.08 1.12<br />
462 8 1.04 1.03 1.18 1.10 1.18<br />
463 5 0.92 1.00 0.71 1.00 0.97<br />
464 6 0.92 1.00 0.80 1.00 1.05<br />
465 7 1.00 1.03 1.01 1.02 1.11<br />
466 6 0.96 1.00 0.83 1.08 1.03<br />
467 7 0.96 1.00 0.93 1.08 1.12<br />
468 8 1.04 1.03 1.18 1.10 1.18<br />
469 7 0.92 1.00 0.71 1.00 0.97<br />
470 8 0.92 1.00 0.80 1.00 1.05<br />
471 8 1.00 1.03 1.01 1.02 1.11<br />
472 8 0.96 1.00 0.83 1.08 1.03<br />
473 8 0.96 1.00 0.93 1.08 1.12<br />
474 8 1.04 1.03 1.18 1.10 1.18<br />
475 7 0.96 1.00 0.83 1.08 1.03<br />
476 8 0.96 1.00 0.93 1.08 1.12<br />
477 8 1.04 1.03 1.18 1.10 1.18<br />
478 6 0.96 1.00 0.83 1.08 1.03<br />
479 7 0.96 1.00 0.93 1.08 1.12<br />
480 8 1.04 1.03 1.18 1.10 1.18<br />
December 1, 2011 Allst<strong>at</strong>e Indemnity Company RP-21A
SERFF Tracking Number: ALSE-127823434 St<strong>at</strong>e: <strong>Delaware</strong><br />
<strong>Filing</strong> Company: Allst<strong>at</strong>e Indemnity Company St<strong>at</strong>e Tracking Number: 45814<br />
Company Tracking Number: R24381: AI RATE CHANGE (+15.0%)<br />
TOI: 19.0 Personal Auto Sub-TOI: 19.0001 Priv<strong>at</strong>e Passenger Auto (PPA)<br />
Product Name: DE AI R<strong>at</strong>e Change (+15.0%)<br />
Project Name/Number: DE AI R<strong>at</strong>e Change (+15.0%)/810818<br />
Supporting Document Schedules<br />
S<strong>at</strong>isfied - Item: P&C - St<strong>at</strong>e Specific Requirements<br />
Comments:<br />
Attachment:<br />
R24381 - St<strong>at</strong>e<strong>Filing</strong>Form.pdf<br />
S<strong>at</strong>isfied - Item: Supporting Documents<br />
Comments:<br />
Attachments:<br />
ActIndMemo01-R24381.pdf<br />
Bulletin 23-R24381.pdf<br />
S<strong>at</strong>isfied - Item: R<strong>at</strong>e Impact by Territory / Territory<br />
Definitions<br />
Comments:<br />
Attachments:<br />
R<strong>at</strong>e Impact by Territory.pdf<br />
Allst<strong>at</strong>e Indemnity Auto Territory Definitions.pdf<br />
PDF Pipeline for SERFF Tracking Number ALSE-127823434 Gener<strong>at</strong>ed 03/05/2012 03:00 PM<br />
Item St<strong>at</strong>us: St<strong>at</strong>us<br />
D<strong>at</strong>e:<br />
Item St<strong>at</strong>us: St<strong>at</strong>us<br />
D<strong>at</strong>e:<br />
Item St<strong>at</strong>us: St<strong>at</strong>us<br />
D<strong>at</strong>e:
ALLSTATE INDEMNITY COMPANY<br />
VOLUNTARY PRIVATE PASSENGER AUTOMOBILE<br />
DELAWARE<br />
INDEX OF ATTACHMENTS<br />
Attachment I – Summary of Disclosures<br />
Page 1 Actuarial Standards of Practice<br />
Page 2 M<strong>at</strong>erial Changes in Sources of D<strong>at</strong>a, Assumptions, or Methods<br />
Attachment II – Summary of R<strong>at</strong>e Level Indic<strong>at</strong>ion<br />
Page 1 Formula Calcul<strong>at</strong>ions for R<strong>at</strong>e Level Indic<strong>at</strong>ions<br />
Page 2 Base D<strong>at</strong>a<br />
Pages 3-5 Adjustments to Losses<br />
Pages 6-8 Expense and Profit Provision<br />
Page 9 Adjustments to Premiums<br />
Attachment III – R<strong>at</strong>e Level Indic<strong>at</strong>ion Exhibits<br />
Exhibits 1.1-1.6 Determin<strong>at</strong>ion of St<strong>at</strong>ewide R<strong>at</strong>e Level Indic<strong>at</strong>ion<br />
Exhibits 2.1-2.6 Development of Provision for Loss and LAE<br />
Exhibits 3.1-3.6 Calcul<strong>at</strong>ion of Loss Development Factors – Additive Method<br />
Exhibits 4.1-4.6 Calcul<strong>at</strong>ion of Loss Development Factors – Link R<strong>at</strong>io Method<br />
Exhibit 5 Ultim<strong>at</strong>e Losses & ALAE<br />
Exhibit 6 Unalloc<strong>at</strong>ed Loss Adjustment Expense Provision<br />
Exhibit 7 Calcul<strong>at</strong>ion of Pure Premium Trend Factor<br />
Exhibits 8.1-8.6 Loss Trends – Pure Premium<br />
Exhibits 8.7-8.12 Loss Trends – Frequency<br />
Exhibits 8.13-8.18 Loss Trends – Severity<br />
Exhibit 9 C<strong>at</strong>astrophe <strong>Insurance</strong> Losses - Comprehensive<br />
Exhibit 10 Summary of Expense Provisions<br />
Exhibit 11 Countrywide Expense Experience For Other Acquisition<br />
Exhibit 12 Countrywide Expense Experience For <strong>General</strong> Expenses<br />
Exhibit 13 Factor to Adjust for Subsequent Change in Fixed Expense<br />
Exhibits 14.1-14.2 Investment Income<br />
Exhibits 15.1-15.6 Development of Projected Average Earned Premium<br />
Exhibit 16 Calcul<strong>at</strong>ion of Premium Trend Factor<br />
Exhibits 17.1-17.6 Premium Trends<br />
Attachment IV– Summary of R<strong>at</strong>ing Plan Changes<br />
Pages 1-3 Summary of R<strong>at</strong>ing Plan Changes<br />
Exhibits 1-8 Summary of R<strong>at</strong>ing Plan Changes – Exhibits<br />
Attachment V– Summary of Manual Changes<br />
Page 1 Summary of Manual Changes<br />
Index<br />
Page 1
ATTACHMENT I<br />
Summary of Disclosures
ALLSTATE INDEMNITY COMPANY<br />
VOLUNTARY PRIVATE PASSENGER AUTOMOBILE<br />
DELAWARE<br />
ACTUARIAL STANDARDS OF PRACTICE<br />
This document confirms compliance with the following Actuarial Standards of Practices<br />
th<strong>at</strong> are applicable to the prepar<strong>at</strong>ion of st<strong>at</strong>ewide r<strong>at</strong>e filings performed by casualty<br />
actuaries as st<strong>at</strong>ed in “Applicability Guidelines for Actuarial Standards of Practice”<br />
(American Academy of Actuaries, September 2004). In addition, references to relevant<br />
sections of this filing are included, where applicable.<br />
Actuarial Standard of Practice No. 12, Risk Classific<strong>at</strong>ion (for all Practice Areas)<br />
- Att IV, Pages 1-3: Summary of R<strong>at</strong>ing Plan Changes.<br />
Actuarial Standard of Practice No. 13, Trending Procedures in Property/Casualty<br />
<strong>Insurance</strong> R<strong>at</strong>emaking<br />
- Att II, Page 1: Formula Calcul<strong>at</strong>ions for R<strong>at</strong>e Level Indic<strong>at</strong>ions<br />
- Att II, Pages 4-5: Adjustments to Losses – Loss Trend<br />
- Att II, Page 7: Expenses, Profit Provision– Fixed Expenses – Trend<br />
- Att II, Page 9: Adjustments to Premiums – Premium Trend<br />
Actuarial Standard of Practice No. 23, D<strong>at</strong>a Quality<br />
- Att II, Page 1: Formula Calcul<strong>at</strong>ions for R<strong>at</strong>e Level Indic<strong>at</strong>ions<br />
Actuarial Standard of Practice No. 25, Credibility Procedures Applicable to<br />
Accident and Health, Group Term Life, and Property/Casualty Coverages<br />
- Att II, Page 2: Base D<strong>at</strong>a – Accident Year Weights<br />
- Att II, Pages 4-5: Adjustments to Losses - Loss Trend<br />
Actuarial Standard of Practice No. 29, Expense Provisions in Property/Casualty<br />
<strong>Insurance</strong> R<strong>at</strong>emaking<br />
- Att II, Pages 6-8: Expenses and Profit Provision<br />
Actuarial Standard of Practice No. 30, Tre<strong>at</strong>ment of Profit and Contingency<br />
Provisions and the Cost of Capital in Property/Casualty <strong>Insurance</strong> R<strong>at</strong>emaking<br />
- Att II, Pages 7-8: Expenses and Profit Provision– Variable Expenses –<br />
Underwriting Profit<br />
Actuarial Standard of Practice No. 38, Using Models Outside the Actuary’s Area<br />
of Expertise (Property and Casualty)<br />
- This ASOP is not applicable to this r<strong>at</strong>e filing, as no models outside of the<br />
Actuary’s Area of Expertise were applied<br />
Actuarial Standard of Practice No. 39, Tre<strong>at</strong>ment of C<strong>at</strong>astrophe Losses in<br />
Property/Casualty <strong>Insurance</strong> R<strong>at</strong>emaking<br />
- Att II, Page 5: Adjustments to Losses - C<strong>at</strong>astrophes<br />
Actuarial Standard of Practice No. 41, Actuarial Communic<strong>at</strong>ions<br />
- Applies to this filing in its entirety<br />
Attachment I<br />
Page 1
ALLSTATE INDEMNITY COMPANY<br />
VOLUNTARY PRIVATE PASSENGER AUTOMOBILE<br />
DELAWARE<br />
MATERIAL CHANGES IN SOURCES OF DATA, ASSUMPTIONS, OR<br />
METHODS<br />
Attachment I<br />
Page 2<br />
This document lists all m<strong>at</strong>erial changes in sources of d<strong>at</strong>a, assumptions, or methods from<br />
the last priv<strong>at</strong>e passenger automobile Allst<strong>at</strong>e r<strong>at</strong>e level indic<strong>at</strong>ion filing. These changes<br />
are further described in the subsequent memos in compliance with Actuarial Standard of<br />
Practice No. 41, Actuarial Communic<strong>at</strong>ions.<br />
ULAE Provision<br />
- Use of combined-lines expense d<strong>at</strong>a, r<strong>at</strong>her than expense d<strong>at</strong>a separ<strong>at</strong>ed out by line of<br />
business, as described in Attachment II, Page 4<br />
Provision for <strong>General</strong> and Other Acquisition Expenses<br />
- Use of combined-lines expense d<strong>at</strong>a, r<strong>at</strong>her than expense d<strong>at</strong>a separ<strong>at</strong>ed out by line<br />
of business, as described in Attachment II, Page 6
ATTACHMENT II<br />
Summary of R<strong>at</strong>e Level Indic<strong>at</strong>ion
ALLSTATE INDEMNITY COMPANY<br />
VOLUNTARY PRIVATE PASSENGER AUTOMOBILE<br />
DELAWARE<br />
FORMULA CALCULATIONS FOR RATE LEVEL INDICATIONS<br />
Attachment II<br />
Page 1<br />
The d<strong>at</strong>a used in the calcul<strong>at</strong>ion of the r<strong>at</strong>e level indic<strong>at</strong>ion was selected in accordance with the<br />
consider<strong>at</strong>ions listed in Section 3.2 of Actuarial Standard of Practice No. 23, D<strong>at</strong>a Quality. The<br />
calcul<strong>at</strong>ion of the r<strong>at</strong>e level indic<strong>at</strong>ion is consistent with the St<strong>at</strong>ement of Principles Regarding<br />
Property and Casualty <strong>Insurance</strong> R<strong>at</strong>emaking.<br />
A r<strong>at</strong>e level indic<strong>at</strong>ion is a test of the adequacy of expected revenues versus expected costs<br />
during the future policy period. Therefore, to derive the indic<strong>at</strong>ed r<strong>at</strong>e level need accur<strong>at</strong>ely,<br />
Allst<strong>at</strong>e's historical premium and loss experience needs to be adjusted. In accordance with<br />
Section 3.1 of Actuarial Standard of Practice No. 13, Trending Procedures in Property/Casualty<br />
<strong>Insurance</strong> R<strong>at</strong>emaking, Allst<strong>at</strong>e trends the underlying historical experience for premiums, losses,<br />
and fixed expenses to appropri<strong>at</strong>ely reflect historical and projected changes in these components<br />
of the r<strong>at</strong>e level indic<strong>at</strong>ions. In addition, historical premiums must be adjusted to reflect the<br />
current r<strong>at</strong>e level; and historical losses must be adjusted to reflect expected development over<br />
time and to smooth the actual losses due to c<strong>at</strong>astrophes. Details of these necessary adjustments<br />
to the historical d<strong>at</strong>a used in the r<strong>at</strong>e level indic<strong>at</strong>ion are described in this memorandum. The<br />
adjustments have been applied to <strong>Delaware</strong>’s premium and loss experience in deriving the<br />
indic<strong>at</strong>ed r<strong>at</strong>e level changes by coverage.<br />
The table below summarizes the indic<strong>at</strong>ed r<strong>at</strong>e change, and the actual r<strong>at</strong>e level change being<br />
proposed. The determin<strong>at</strong>ion of the overall indic<strong>at</strong>ed change is included in Attachment III,<br />
Exhibits 1.1-1.6, and described in detail throughout this filing.<br />
Coverage<br />
Indic<strong>at</strong>ed R<strong>at</strong>e Level<br />
Change<br />
Proposed Change<br />
Bodily Injury + 33.9% + 22.9%<br />
Property Damage + 108.8% + 29.8%<br />
Personal Injury Protection + 36.3% + 22.8%<br />
Uninsured/Underinsured<br />
Motorist<br />
- 53.7% 0.0%<br />
Collision - 12.7% - 5.0%<br />
Comprehensive - 67.3% - 20.0%<br />
TOTAL + 26.9% + 15.0%
BASE DATA<br />
Attachment II<br />
Page 2<br />
In developing formula indic<strong>at</strong>ions for <strong>Delaware</strong>, d<strong>at</strong>a from fiscal accident years ending<br />
December 31, 2008, 2009 and 2010 for all coverages was used. Each of these fiscal accident<br />
years is evalu<strong>at</strong>ed as of March 31, 2010. Consistent with past Allst<strong>at</strong>e Indemnity Company<br />
filings, total limits d<strong>at</strong>a was used for all coverages.<br />
Accident Year Weights<br />
In order to develop a credible measure of the indic<strong>at</strong>ed r<strong>at</strong>e level, it is sometimes necessary to<br />
use more than one year of historical loss experience. A maximum of three accident years is<br />
combined to determine the indic<strong>at</strong>ed provision for loss and loss adjustment expense for each<br />
coverage. The number of years used by coverage and the credibility per year is based upon a<br />
credibility procedure from the paper "On the Credibility of the Pure Premium" (Proceedings of<br />
the Casualty Actuarial Society, Vol. LV, 1968), by Mayerson, Jones and Bowers, and the<br />
appendix of the paper "Classical Partial Credibility with Applic<strong>at</strong>ion to Trend" (Proceedings of<br />
the Casualty Actuarial Society, Vol. LXXIII, 1986), by Venter. The analysis for each coverage<br />
was completed using a k value of 7.5% and a P value of 90.0%; these parameters reflect the<br />
desire th<strong>at</strong> the observed pure premium should be within k% of the expected pure premium with<br />
probability P. In the present filing the following weights have been used:<br />
Accident Year Weights for Year Ending<br />
09/30/2008 09/30/2009 09/30/2010<br />
Bodily Injury 33% 33% 34%<br />
Property Damage 33% 33% 34%<br />
Personal Injury<br />
Protection<br />
33% 33% 34%<br />
Uninsured/Underinsure<br />
33% 33% 34%<br />
d Motorist<br />
Collision 33% 33% 34%<br />
Comprehensive 33% 33% 34%<br />
This approach for incorpor<strong>at</strong>ing credibility in determin<strong>at</strong>ion of the accident year weights is<br />
consistent with the Current Practices and Altern<strong>at</strong>ives detailed in Section 3 of Actuarial Standard<br />
of Practice No. 25, Credibility Procedures Applicable to Accident and Health, Group Term Life,<br />
and Property/Casualty Coverages.
Loss Development<br />
ADJUSTMENTS TO LOSSES<br />
Attachment II<br />
Page 3<br />
As in past filings, accident year incurred losses are developed for the liability coverages, and<br />
accident year paid losses are developed for the physical damage coverages. Allst<strong>at</strong>e's standard<br />
loss development procedure is to select ultim<strong>at</strong>e accident year losses after analyzing estim<strong>at</strong>es<br />
developed using the Link R<strong>at</strong>io and Additive methods. Accident year incurred losses are<br />
developed for the liability coverages. Accident year paid losses are developed for the physical<br />
damage coverages.<br />
While the link r<strong>at</strong>io method assumes th<strong>at</strong> future development is proportional to losses th<strong>at</strong> have<br />
already emerged as of a given evalu<strong>at</strong>ion d<strong>at</strong>e, the additive method assumes th<strong>at</strong> future<br />
development is proportional to the number of earned exposures in the accident period, where the<br />
expected development per exposure is based on historical development p<strong>at</strong>terns per exposure<br />
adjusted to account for differences in frequency and severity over time. Allst<strong>at</strong>e believes the<br />
approach of considering two loss development procedures when estim<strong>at</strong>ing ultim<strong>at</strong>e losses better<br />
upholds the suggestion contained in the St<strong>at</strong>ement of Principles Regarding Property and Casualty<br />
Loss and Loss Adjustment Expense Reserves th<strong>at</strong> “Ordinarily the actuary will examine the<br />
indic<strong>at</strong>ions of more than one method when estim<strong>at</strong>ing the loss and loss adjustment expense<br />
liability for a specific group of claims.”<br />
To calcul<strong>at</strong>e estim<strong>at</strong>ed ultim<strong>at</strong>e losses using the Link R<strong>at</strong>io methods, historical age-to-age link<br />
r<strong>at</strong>ios are calcul<strong>at</strong>ed, which represent loss development between different evalu<strong>at</strong>ion periods. An<br />
average of the historical link r<strong>at</strong>ios is then used to estim<strong>at</strong>e the ultim<strong>at</strong>e level of paid losses to be<br />
used in r<strong>at</strong>emaking. This method assumes th<strong>at</strong> historical loss development p<strong>at</strong>terns can be used<br />
to estim<strong>at</strong>e future loss development on current imm<strong>at</strong>ure claims.<br />
For the Additive loss development method, historical losses are first trended to today’s price<br />
level using pure premium trends selected from Allst<strong>at</strong>e Indemnity Company d<strong>at</strong>a. This is done<br />
to avoid distortions due to changes in the underlying loss costs. Please note th<strong>at</strong> due to the<br />
different lengths of trend periods in each analysis, the selected pure premium trend th<strong>at</strong> is used in<br />
loss development often differs from the selected trend th<strong>at</strong> applies to the underlying d<strong>at</strong>a.<br />
Trended additive amounts per exposures are calcul<strong>at</strong>ed, which represent trended loss<br />
development between different evalu<strong>at</strong>ion periods. An average of the historical trended additive<br />
amount per exposure is then used to estim<strong>at</strong>e the ultim<strong>at</strong>e trended level of paid losses. Trended<br />
age-to-ultim<strong>at</strong>e additive amounts per exposure are multiplied by earned exposures for each<br />
accident year to calcul<strong>at</strong>e trended losses th<strong>at</strong> have yet to emerge. A final step in the Additive<br />
Method is to detrend the trended losses yet to emerge. Losses are detrended because the<br />
applic<strong>at</strong>ion of trend is accounted for in a separ<strong>at</strong>e step in the r<strong>at</strong>emaking process. This method<br />
assumes th<strong>at</strong> historical loss development p<strong>at</strong>terns per exposure can be used to estim<strong>at</strong>e future<br />
loss development on current imm<strong>at</strong>ure claims.<br />
Refer to Exhibits 3.1 through 4.6 of Attachment III for the loss development of each coverage<br />
using both the Link R<strong>at</strong>io and Additive Methods of loss development. A summary of the<br />
estim<strong>at</strong>ed ultim<strong>at</strong>e losses using each method as well as the selected ultim<strong>at</strong>e losses is shown on
Exhibit 5. Please note th<strong>at</strong> the actual five year average, excluding high/low outliers, loss<br />
development factors and additive amounts per exposure were used for all coverages.<br />
Loss Adjustment Expenses<br />
Attachment II<br />
Page 4<br />
Alloc<strong>at</strong>ed loss adjustment expenses are included in both incurred losses and paid losses.<br />
Losses in the experience period for each coverage have been adjusted to account for unalloc<strong>at</strong>ed<br />
loss adjustment expenses (ULAE). A provision is developed using countrywide Allst<strong>at</strong>e<br />
<strong>Insurance</strong> Group d<strong>at</strong>a. In previous filings, expense d<strong>at</strong>a had been separ<strong>at</strong>ed out by line of<br />
business, as is done in the <strong>Insurance</strong> Expense Exhibit, to determine the ULAE provisions by line.<br />
Moving forward, Allst<strong>at</strong>e has opted to leave the ULAE d<strong>at</strong>a in combined-lines form since the<br />
alloc<strong>at</strong>ion of ULAE by line of business is done by accounting formula r<strong>at</strong>her than pricing<br />
analysis.<br />
A three-year average of the r<strong>at</strong>ios of countrywide, combined-lines, calendar year ULAE to<br />
countrywide, combined-lines, calendar year incurred losses is used to determine the ULAE<br />
provision. The average r<strong>at</strong>io is then applied to the losses for each coverage for each year used<br />
in the formula calcul<strong>at</strong>ion. The ULAE r<strong>at</strong>ios th<strong>at</strong> have been used in this filing are shown in<br />
Exhibit 6.<br />
Loss Trend<br />
Frequency and severity amounts are calcul<strong>at</strong>ed using the methodology described in “The Effect<br />
of Changing Exposure Levels on Calendar Year Loss Trends” (Casualty Actuarial Society<br />
Forum, Winter 2005) by Chris Styrsky. This methodology helps to more consistently m<strong>at</strong>ch<br />
losses and claims paid with the exposures th<strong>at</strong> produced the claims.<br />
Using adjusted Allst<strong>at</strong>e Indemnity Company d<strong>at</strong>a for the st<strong>at</strong>e of <strong>Delaware</strong>, the past changes in<br />
actual frequency and severity on a twelve-month-moving basis (evalu<strong>at</strong>ed <strong>at</strong> each quarter) over a<br />
six year period were examined. After considering past results, claim practice changes,<br />
countrywide Allst<strong>at</strong>e d<strong>at</strong>a and actuarial judgment, annual pure premium trends were selected for<br />
each coverage. The credibility level of Allst<strong>at</strong>e loss trend d<strong>at</strong>a was analyzed by coverage based<br />
on the number of claims paid in the l<strong>at</strong>est experience year, which is consistent with the criteria<br />
for selecting a credibility procedure outlined in section 3 of Actuarial Standard of Practice No.<br />
25, Credibility Procedures Applicable to Accident and Health. Group Term Life, and<br />
Property/Casualty Coverages. These selected trends are displayed in Exhibit 7. These annual<br />
selections are used to project the d<strong>at</strong>a from the average occurrence d<strong>at</strong>e of the experience period<br />
to the average occurrence d<strong>at</strong>e of the future policy period. This projection is also shown in<br />
Exhibit 7. Allst<strong>at</strong>e Indemnity Company trend d<strong>at</strong>a is included in Exhibits 8.1 through 8.18 of<br />
Attachment III.<br />
Paid frequency and paid severity d<strong>at</strong>a was primarily used for all coverages. Also, in order to<br />
reflect additional stability in Allst<strong>at</strong>e’s trend d<strong>at</strong>a for Comprehensive coverage, Comprehensive<br />
d<strong>at</strong>a excluding c<strong>at</strong>astrophes was used for selecting the trend.
Attachment II<br />
Page 5<br />
This approach for selecting pure premium trends is consistent with the Current Practices and<br />
Altern<strong>at</strong>ives detailed in Appendix 1 – Background and Current Practices of Actuarial Standard<br />
of Practice No. 13, Trending Procedures in Property/Casualty <strong>Insurance</strong> R<strong>at</strong>emaking.<br />
C<strong>at</strong>astrophes<br />
An adjustment has been made to Comprehensive coverage losses to more appropri<strong>at</strong>ely account<br />
for c<strong>at</strong>astrophes in the base d<strong>at</strong>a. All actual c<strong>at</strong>astrophe losses during the experience period were<br />
removed and then replaced with a provision to reflect expected c<strong>at</strong>astrophe losses in <strong>Delaware</strong>.<br />
A c<strong>at</strong>astrophe loss provision based upon 25 years of d<strong>at</strong>a was used. The provision was<br />
calcul<strong>at</strong>ed by dividing total c<strong>at</strong>astrophe losses by total Comprehensive coverage incurred losses<br />
excluding c<strong>at</strong>astrophes over the 25-year period. The resulting c<strong>at</strong>astrophe provision is 2.8%.<br />
The c<strong>at</strong>astrophe provision is developed in Exhibit 9 and is applied to the Comprehensive<br />
coverage losses in Exhibit 2.6. This adjustment to account for c<strong>at</strong>astrophes is consistent with<br />
the Analysis of Issues and Recommended Practices detailed in Section 3.4 of Actuarial Standard<br />
of Practice No. 39, Tre<strong>at</strong>ment of C<strong>at</strong>astrophe Losses in Property/Casualty <strong>Insurance</strong><br />
R<strong>at</strong>emaking.
EXPENSES AND PROFIT PROVISION<br />
Attachment II<br />
Page 6<br />
The expense provisions described below were derived in accordance to Section 3.2, Determining<br />
Expense Provisions, of Actuarial Standard of Practice No. 29, Expense Provisions in<br />
Property/Casualty <strong>Insurance</strong> R<strong>at</strong>emaking.<br />
Exhibit 10 shows the expense provisions used in developing the current fixed and variable<br />
expense r<strong>at</strong>ios, as well as the underwriting profit and debt provisions.<br />
Provisions<br />
Fixed Expenses<br />
<strong>General</strong> and Other Acquisition Expense<br />
The provisions for general expense and other acquisition expense are based on countrywide d<strong>at</strong>a.<br />
Since the methods and procedures th<strong>at</strong> incur these expenses are uniform within each st<strong>at</strong>e, it is a<br />
reasonable assumption th<strong>at</strong> these expense provisions are uniform across all st<strong>at</strong>es. To develop<br />
the provision for other acquisition and general expenses, a three-year average of countrywide<br />
calendar year incurred expense divided by countrywide calendar year direct earned premium was<br />
calcul<strong>at</strong>ed. Because premiums charged for the net cost of reinsurance (NCOR) do not include<br />
provisions for general and other acquisition expenses, the earned premium used in the<br />
development of the general and other acquisition expenses is countrywide direct earned premium<br />
less countrywide NCOR premium.<br />
In previous filings, expense d<strong>at</strong>a had been separ<strong>at</strong>ed out by line of business, as is done in the<br />
<strong>Insurance</strong> Expense Exhibit, to determine the general and other acquisition expense provisions by<br />
line. Moving forward, Allst<strong>at</strong>e has opted to leave the expense d<strong>at</strong>a in combined-lines form since<br />
the alloc<strong>at</strong>ion of general and other acquisition expenses by line of business is done by accounting<br />
formula r<strong>at</strong>her than pricing analysis. However, company- and line-specific adjustments to other<br />
acquisition expenses continue to be made, such as the reduction by the amount of installment<br />
fees collected and the adjustment for premiums written off.<br />
Licenses & Fees<br />
A provision for licenses and fees th<strong>at</strong> do not vary by premium size is determined by taking the<br />
arithmetic average r<strong>at</strong>io of these licenses and fees from the l<strong>at</strong>est three calendar years in<br />
<strong>Delaware</strong>. The provision for licenses and fees is considered, along with the general and other<br />
acquisition expense provisions, to be a fixed expense.<br />
R<strong>at</strong>e Need Calcul<strong>at</strong>ions<br />
In developing the dollar provision for fixed expenses used in the calcul<strong>at</strong>ion of our <strong>Delaware</strong> r<strong>at</strong>e<br />
level need by coverage, the three-year average expense r<strong>at</strong>io for fixed expenses is applied to the<br />
average earned premium of <strong>Delaware</strong>. The <strong>Delaware</strong> average earned premium is developed<br />
using the same three-year period used in the calcul<strong>at</strong>ion of the expense r<strong>at</strong>io. The provision is<br />
then adjusted for infl<strong>at</strong>ion expected to occur from the midpoint of the three years used in the<br />
calcul<strong>at</strong>ion of the average earned premium to the average earned d<strong>at</strong>e of the proposed policy
period to derive the provision included in the r<strong>at</strong>e level indic<strong>at</strong>ions.<br />
Attachment II<br />
Page 7<br />
The expense provisions for other acquisition and general expenses are shown in Exhibits 11 and<br />
12, respectively.<br />
Trend (Infl<strong>at</strong>ion)<br />
The method used to calcul<strong>at</strong>e the fixed expense trend is similar to the method used by the<br />
<strong>Insurance</strong> Services Office (I.S.O.) and other competitors to determine a fixed expense trend. The<br />
method utilizes the CPI (Consumer Price Index) and the ECI (Employment Cost Index –<br />
<strong>Insurance</strong> Carriers, Agents, Brokers, & Service) and is discussed by Geoffrey Todd Werner,<br />
FCAS, MAAA in his paper Incorpor<strong>at</strong>ion of Fixed Expenses, which was published in the CAS<br />
Forum (Winter 2004). Based on a review of the historical indices, an annual percentage change<br />
is selected for each index. These selected annual percent changes are then weighted together<br />
using the distribution of the Allst<strong>at</strong>e expenditures in the l<strong>at</strong>est calendar year for the two broad<br />
expense c<strong>at</strong>egories th<strong>at</strong> these indices represent. This method is expected to produce stable and<br />
reasonable estim<strong>at</strong>es of the true trend in fixed expenses and is consistent with the Current<br />
Practices and Altern<strong>at</strong>ives detailed in Appendix 1 – Background and Current Practices of<br />
Actuarial Standard of Practice No. 13, Trending Procedures in Property/Casualty <strong>Insurance</strong><br />
R<strong>at</strong>emaking. This trend is applied to all fixed expenses. Exhibit 13 shows the deriv<strong>at</strong>ion of the<br />
Factor to Adjust for Subsequent Change in Fixed Expense.<br />
Commission and Brokerage Expense<br />
Variable Expenses<br />
The proposed commission and brokerage expense provision has been developed from the most<br />
recent calendar year commission and brokerage incurred expense r<strong>at</strong>io in <strong>Delaware</strong>. The<br />
provision is shown on Exhibit 10.<br />
Taxes<br />
The provision for taxes is determined by taking the currently prescribed <strong>Delaware</strong> premium tax<br />
r<strong>at</strong>io and adding to th<strong>at</strong> the arithmetic average r<strong>at</strong>io of other assessments th<strong>at</strong> vary by the size of<br />
the premium from the l<strong>at</strong>est three calendar years in <strong>Delaware</strong>.<br />
Underwriting Profit Provision<br />
Allst<strong>at</strong>e performs two separ<strong>at</strong>e cost of capital analyses in the estim<strong>at</strong>ion of its cost of equity. The<br />
first uses the Fama-French Three-factor Model (FF3F), which reflects developments in the field<br />
of financial economics as published in the Casualty Actuarial Society Forum, Winter, 2004 and<br />
in Journal of Risk and <strong>Insurance</strong>, Vol. 72, No. 3, September 2005 (“Estim<strong>at</strong>ing the Cost of<br />
Equity Capital For Property-Liability Insurers” by J. David Cummins and Richard D. Phillips).<br />
The second is a Discounted Cash Flow (DCF) analysis, which estim<strong>at</strong>es the expected future cash<br />
flows to investors in order to gauge the proper cost of equity. Once both the DCF and FF3F<br />
estim<strong>at</strong>es had been calcul<strong>at</strong>ed, Allst<strong>at</strong>e selected a cost of equity of 10.00%, which reflected the
outcomes of both analyses.<br />
An analysis of premium, loss and expense cash flows is used to calcul<strong>at</strong>e the investment<br />
income on policy holder supplied funds (PHSF). This methodology is one of the two<br />
examples given in Actuarial Standard of Practice, No. 30, Tre<strong>at</strong>ment of Profit and<br />
Contingency Provisions and the Cost of Capital in Property/Casualty <strong>Insurance</strong><br />
R<strong>at</strong>emaking, as appropri<strong>at</strong>e methods for recognizing investment income from insurance<br />
oper<strong>at</strong>ions (page 4).<br />
Attachment II<br />
Page 8<br />
The calcul<strong>at</strong>ions detailing this investment income analysis are found in Exhibits 14.1 and 14.2<br />
for liability and physical damage coverages, respectively. The r<strong>at</strong>e (applied as a force of<br />
interest) used to discount losses and expenses includes anticip<strong>at</strong>ed net investment income and<br />
anticip<strong>at</strong>ed capital gains, both realized and unrealized. Oper<strong>at</strong>ing cash flows are discounted to<br />
the average time of earnings of premium and profit for the policy year, r<strong>at</strong>her than to the start of<br />
the policy year.<br />
Debt Provision<br />
The cost of debt is listed as a separ<strong>at</strong>e provision in the Variable Expense and Profit R<strong>at</strong>io. The<br />
debt provision amount is shown on Exhibit 10.
ADJUSTMENTS TO PREMIUMS<br />
Attachment II<br />
Page 9<br />
Current R<strong>at</strong>e Level<br />
All premiums in the experience period were adjusted to current r<strong>at</strong>e level in <strong>Delaware</strong>. As in the<br />
last filing, Allst<strong>at</strong>e uses the "Miller-Davis-Karlinski" method to do this since it more accur<strong>at</strong>ely<br />
calcul<strong>at</strong>es factors to current r<strong>at</strong>e level in instances when exposures are changing throughout the<br />
year, whether through growth, shrinkage or seasonality. (When exposures are, in fact, written<br />
uniformly throughout the year, this method produces approxim<strong>at</strong>ely the same answers as the<br />
parallelogram method.)<br />
We also use the Miller-Davis-Karlinski method to bring premiums to current r<strong>at</strong>e level prior to<br />
calcul<strong>at</strong>ing the changes in average premium (the premium trends).<br />
Premium Trend<br />
In addition to bringing premiums to current r<strong>at</strong>e level, changes in the average written premium <strong>at</strong><br />
the current premium level were reviewed. Based upon this review, historical premium trends<br />
were selected to account for shifts in the distribution of various r<strong>at</strong>ing characteristics such as<br />
driver classific<strong>at</strong>ion, increased limits, model year and price group symbols (PGS). Since the<br />
effects on losses caused by these shifts are reflected in the loss trends, it is important th<strong>at</strong><br />
Allst<strong>at</strong>e also account for the anticip<strong>at</strong>ed future changes in premiums. Therefore, projected<br />
premium trend was taken into consider<strong>at</strong>ion when calcul<strong>at</strong>ing the r<strong>at</strong>e level need by coverage.<br />
The selected projections are displayed in Exhibit 16. These annual selections are used to project<br />
the d<strong>at</strong>a from the average earned d<strong>at</strong>e of the experience period to the average earned d<strong>at</strong>e of the<br />
future policy period. Allst<strong>at</strong>e Indemnity Company premium trend d<strong>at</strong>a is included in Exhibits<br />
17.1 through 17.6 of Attachment III.<br />
This approach for selecting premium trends is consistent with the Current Practices and<br />
Altern<strong>at</strong>ives detailed in Appendix 1 – Background and Current Practices of Actuarial Standard<br />
of Practice No. 13, Trending Procedures in Property/Casualty <strong>Insurance</strong> R<strong>at</strong>emaking
ATTACHMENT III<br />
R<strong>at</strong>e Level Indic<strong>at</strong>ion Exhibits
Allst<strong>at</strong>e Indemnity Company<br />
Priv<strong>at</strong>e Passenger Auto<br />
<strong>Delaware</strong><br />
Determin<strong>at</strong>ion of St<strong>at</strong>ewide R<strong>at</strong>e Level Indic<strong>at</strong>ion<br />
Bodily Injury<br />
1) Indic<strong>at</strong>ed Provision for Loss and Loss Adjustment Expense<br />
2) Current Fixed Expense R<strong>at</strong>io<br />
3) Three Year Average Earned Premium<br />
4) Current Dollar Provision for Fixed Expense [ (2) x (3) ]<br />
5) Factor to Adjust for Subsequent Change in Fixed Expense<br />
6) Indic<strong>at</strong>ed Provision for Fixed Expense [ (4) x (5) ]<br />
7) Variable Expense and Profit R<strong>at</strong>io<br />
8) Indic<strong>at</strong>ed Average Premium [ (1) + (6) ] / [ 1 - (7) ]<br />
9) Projected Average Earned Premium <strong>at</strong> Current R<strong>at</strong>es<br />
10) Indic<strong>at</strong>ed R<strong>at</strong>e Level Change [ (8) / (9) - 1.0 ]<br />
Attachment III<br />
Exhibit 1.1<br />
$499.22<br />
9.6 %<br />
$518.86<br />
$49.81<br />
1.075<br />
$53.55<br />
20.5 %<br />
$695.31<br />
$519.22<br />
33.9 %
Allst<strong>at</strong>e Indemnity Company<br />
Priv<strong>at</strong>e Passenger Auto<br />
<strong>Delaware</strong><br />
Determin<strong>at</strong>ion of St<strong>at</strong>ewide R<strong>at</strong>e Level Indic<strong>at</strong>ion<br />
Property Damage<br />
1) Indic<strong>at</strong>ed Provision for Loss and Loss Adjustment Expense<br />
2) Current Fixed Expense R<strong>at</strong>io<br />
3) Three Year Average Earned Premium<br />
4) Current Dollar Provision for Fixed Expense [ (2) x (3) ]<br />
5) Factor to Adjust for Subsequent Change in Fixed Expense<br />
6) Indic<strong>at</strong>ed Provision for Fixed Expense [ (4) x (5) ]<br />
7) Variable Expense and Profit R<strong>at</strong>io<br />
8) Indic<strong>at</strong>ed Average Premium [ (1) + (6) ] / [ 1 - (7) ]<br />
9) Projected Average Earned Premium <strong>at</strong> Current R<strong>at</strong>es<br />
10) Indic<strong>at</strong>ed R<strong>at</strong>e Level Change [ (8) / (9) - 1.0 ]<br />
Attachment III<br />
Exhibit 1.2<br />
$436.96<br />
9.6 %<br />
$281.40<br />
$27.01<br />
1.075<br />
$29.04<br />
20.5 %<br />
$586.16<br />
$280.76<br />
108.8 %
Allst<strong>at</strong>e Indemnity Company<br />
Priv<strong>at</strong>e Passenger Auto<br />
<strong>Delaware</strong><br />
Determin<strong>at</strong>ion of St<strong>at</strong>ewide R<strong>at</strong>e Level Indic<strong>at</strong>ion<br />
Personal Injury Protection<br />
1) Indic<strong>at</strong>ed Provision for Loss and Loss Adjustment Expense<br />
2) Current Fixed Expense R<strong>at</strong>io<br />
3) Three Year Average Earned Premium<br />
4) Current Dollar Provision for Fixed Expense [ (2) x (3) ]<br />
5) Factor to Adjust for Subsequent Change in Fixed Expense<br />
6) Indic<strong>at</strong>ed Provision for Fixed Expense [ (4) x (5) ]<br />
7) Variable Expense and Profit R<strong>at</strong>io<br />
8) Indic<strong>at</strong>ed Average Premium [ (1) + (6) ] / [ 1 - (7) ]<br />
9) Projected Average Earned Premium <strong>at</strong> Current R<strong>at</strong>es<br />
10) Indic<strong>at</strong>ed R<strong>at</strong>e Level Change [ (8) / (9) - 1.0 ]<br />
Attachment III<br />
Exhibit 1.3<br />
$318.69<br />
9.6 %<br />
$336.30<br />
$32.28<br />
1.075<br />
$34.70<br />
20.5 %<br />
$444.52<br />
$326.09<br />
36.3 %
Allst<strong>at</strong>e Indemnity Company<br />
Priv<strong>at</strong>e Passenger Auto<br />
<strong>Delaware</strong><br />
Determin<strong>at</strong>ion of St<strong>at</strong>ewide R<strong>at</strong>e Level Indic<strong>at</strong>ion<br />
Uninsured / Underinsured Motorist<br />
1) Indic<strong>at</strong>ed Provision for Loss and Loss Adjustment Expense<br />
2) Current Fixed Expense R<strong>at</strong>io<br />
3) Three Year Average Earned Premium<br />
4) Current Dollar Provision for Fixed Expense [ (2) x (3) ]<br />
5) Factor to Adjust for Subsequent Change in Fixed Expense<br />
6) Indic<strong>at</strong>ed Provision for Fixed Expense [ (4) x (5) ]<br />
7) Variable Expense and Profit R<strong>at</strong>io<br />
8) Indic<strong>at</strong>ed Average Premium [ (1) + (6) ] / [ 1 - (7) ]<br />
9) Projected Average Earned Premium <strong>at</strong> Current R<strong>at</strong>es<br />
10) Indic<strong>at</strong>ed R<strong>at</strong>e Level Change [ (8) / (9) - 1.0 ]<br />
Attachment III<br />
Exhibit 1.4<br />
$29.46<br />
9.6 %<br />
$117.28<br />
$11.26<br />
1.075<br />
$12.10<br />
20.5 %<br />
$52.28<br />
$112.88<br />
-53.7 %
Allst<strong>at</strong>e Indemnity Company<br />
Priv<strong>at</strong>e Passenger Auto<br />
<strong>Delaware</strong><br />
Determin<strong>at</strong>ion of St<strong>at</strong>ewide R<strong>at</strong>e Level Indic<strong>at</strong>ion<br />
Collision<br />
1) Indic<strong>at</strong>ed Provision for Loss and Loss Adjustment Expense<br />
2) Current Fixed Expense R<strong>at</strong>io<br />
3) Three Year Average Earned Premium<br />
4) Current Dollar Provision for Fixed Expense [ (2) x (3) ]<br />
5) Factor to Adjust for Subsequent Change in Fixed Expense<br />
6) Indic<strong>at</strong>ed Provision for Fixed Expense [ (4) x (5) ]<br />
7) Variable Expense and Profit R<strong>at</strong>io<br />
8) Indic<strong>at</strong>ed Average Premium [ (1) + (6) ] / [ 1 - (7) ]<br />
9) Projected Average Earned Premium <strong>at</strong> Current R<strong>at</strong>es<br />
10) Indic<strong>at</strong>ed R<strong>at</strong>e Level Change [ (8) / (9) - 1.0 ]<br />
Attachment III<br />
Exhibit 1.5<br />
$583.32<br />
9.6 %<br />
$775.47<br />
$74.45<br />
1.075<br />
$80.03<br />
21.5 %<br />
$845.03<br />
$965.32<br />
-12.5 %
Allst<strong>at</strong>e Indemnity Company<br />
Priv<strong>at</strong>e Passenger Auto<br />
<strong>Delaware</strong><br />
Determin<strong>at</strong>ion of St<strong>at</strong>ewide R<strong>at</strong>e Level Indic<strong>at</strong>ion<br />
Comprehensive<br />
1) Indic<strong>at</strong>ed Provision for Loss and Loss Adjustment Expense<br />
2) Current Fixed Expense R<strong>at</strong>io<br />
3) Three Year Average Earned Premium<br />
4) Current Dollar Provision for Fixed Expense [ (2) x (3) ]<br />
5) Factor to Adjust for Subsequent Change in Fixed Expense<br />
6) Indic<strong>at</strong>ed Provision for Fixed Expense [ (4) x (5) ]<br />
7) Variable Expense and Profit R<strong>at</strong>io<br />
8) Indic<strong>at</strong>ed Average Premium [ (1) + (6) ] / [ 1 - (7) ]<br />
9) Projected Average Earned Premium <strong>at</strong> Current R<strong>at</strong>es<br />
10) Indic<strong>at</strong>ed R<strong>at</strong>e Level Change [ (8) / (9) - 1.0 ]<br />
Attachment III<br />
Exhibit 1.6<br />
$67.09<br />
9.6 %<br />
$336.43<br />
$32.30<br />
1.075<br />
$34.72<br />
21.5 %<br />
$129.69<br />
$395.50<br />
-67.2 %
Fiscal Year Ending<br />
(1)<br />
Earned Exposures<br />
(2)<br />
Accident Year *<br />
Non-C<strong>at</strong>astrophe<br />
Ultim<strong>at</strong>e Loss<br />
(3)<br />
Ultim<strong>at</strong>e Loss and<br />
LAE<br />
(4)<br />
Factor to Adjust<br />
Losses for Pure<br />
Premium Trend<br />
(5)<br />
Projected Ultim<strong>at</strong>e<br />
Loss and LAE<br />
(6)<br />
Projected Average<br />
Loss and LAE<br />
(5)/(1)<br />
12/31/2008 507 $71,700 $83,172 2.041 $169,754 $334.82<br />
12/31/2009 873 320,000 371,200 1.730 642,176 735.60<br />
12/31/2010 1,208 305,000 353,800 1.466 518,671 429.36<br />
* Evalu<strong>at</strong>ed <strong>at</strong> 15 months<br />
(8) Indic<strong>at</strong>ed Provision for Loss and LAE<br />
Allst<strong>at</strong>e Indemnity Company<br />
Priv<strong>at</strong>e Passenger Auto<br />
<strong>Delaware</strong><br />
Development of Provision for Loss and LAE<br />
Bodily Injury<br />
$499.22<br />
(7)<br />
Experience Year<br />
Weights<br />
33 %<br />
33<br />
34<br />
Attachment III<br />
Exhibit 2.1
Fiscal Year Ending<br />
(1)<br />
Earned Exposures<br />
(2)<br />
Accident Year *<br />
Non-C<strong>at</strong>astrophe<br />
Ultim<strong>at</strong>e Loss<br />
(3)<br />
Ultim<strong>at</strong>e Loss and<br />
LAE<br />
(4)<br />
Factor to Adjust<br />
Losses for Pure<br />
Premium Trend<br />
(5)<br />
Projected Ultim<strong>at</strong>e<br />
Loss and LAE<br />
(6)<br />
Projected Average<br />
Loss and LAE<br />
(5)/(1)<br />
12/31/2008 507 $92,243 $107,002 1.759 $188,217 $371.24<br />
12/31/2009 873 256,100 297,076 1.543 458,388 525.07<br />
12/31/2010 1,208 319,600 370,736 1.353 501,606 415.24<br />
* Evalu<strong>at</strong>ed <strong>at</strong> 15 months<br />
(8) Indic<strong>at</strong>ed Provision for Loss and LAE<br />
Allst<strong>at</strong>e Indemnity Company<br />
Priv<strong>at</strong>e Passenger Auto<br />
<strong>Delaware</strong><br />
Development of Provision for Loss and LAE<br />
Property Damage<br />
$436.96<br />
(7)<br />
Experience Year<br />
Weights<br />
33 %<br />
33<br />
34<br />
Attachment III<br />
Exhibit 2.2
Fiscal Year Ending<br />
(1)<br />
Earned Exposures<br />
(2)<br />
Accident Year *<br />
Non-C<strong>at</strong>astrophe<br />
Ultim<strong>at</strong>e Loss<br />
(3)<br />
Ultim<strong>at</strong>e Loss and<br />
LAE<br />
(4)<br />
Factor to Adjust<br />
Losses for Pure<br />
Premium Trend<br />
(5)<br />
Projected Ultim<strong>at</strong>e<br />
Loss and LAE<br />
(6)<br />
Projected Average<br />
Loss and LAE<br />
(5)/(1)<br />
12/31/2008 507 $12,000 $13,920 1.947 $27,102 $53.46<br />
12/31/2009 873 265,000 307,400 1.558 478,929 548.60<br />
12/31/2010 1,208 295,000 342,200 1.246 426,381 352.96<br />
* Evalu<strong>at</strong>ed <strong>at</strong> 15 months<br />
(8) Indic<strong>at</strong>ed Provision for Loss and LAE<br />
Allst<strong>at</strong>e Indemnity Company<br />
Priv<strong>at</strong>e Passenger Auto<br />
<strong>Delaware</strong><br />
Development of Provision for Loss and LAE<br />
Personal Injury Protection<br />
$318.69<br />
(7)<br />
Experience Year<br />
Weights<br />
33 %<br />
33<br />
34<br />
Attachment III<br />
Exhibit 2.3
Fiscal Year Ending<br />
(1)<br />
Earned Exposures<br />
(2)<br />
Accident Year *<br />
Non-C<strong>at</strong>astrophe<br />
Ultim<strong>at</strong>e Loss<br />
(3)<br />
Ultim<strong>at</strong>e Loss and<br />
LAE<br />
(4)<br />
Factor to Adjust<br />
Losses for Pure<br />
Premium Trend<br />
(5)<br />
Projected Ultim<strong>at</strong>e<br />
Loss and LAE<br />
(6)<br />
Projected Average<br />
Loss and LAE<br />
(5)/(1)<br />
12/31/2008 447 $1,946 $2,257 1.234 $2,785 $6.23<br />
12/31/2009 762 31,466 36,501 1.175 42,889 56.28<br />
12/31/2010 1,014 20,300 23,548 1.119 26,350 25.99<br />
* Evalu<strong>at</strong>ed <strong>at</strong> 15 months<br />
(8) Indic<strong>at</strong>ed Provision for Loss and LAE<br />
Allst<strong>at</strong>e Indemnity Company<br />
Priv<strong>at</strong>e Passenger Auto<br />
<strong>Delaware</strong><br />
Development of Provision for Loss and LAE<br />
Uninsured / Underinsured Motorist<br />
$29.46<br />
(7)<br />
Experience Year<br />
Weights<br />
33 %<br />
33<br />
34<br />
Attachment III<br />
Exhibit 2.4
Fiscal Year Ending<br />
(1)<br />
Earned Exposures<br />
(2)<br />
Accident Year *<br />
Non-C<strong>at</strong>astrophe<br />
Ultim<strong>at</strong>e Loss<br />
(3)<br />
Ultim<strong>at</strong>e Loss and<br />
LAE<br />
(4)<br />
Factor to Adjust<br />
Losses for Pure<br />
Premium Trend<br />
(5)<br />
Projected Ultim<strong>at</strong>e<br />
Loss and LAE<br />
(6)<br />
Projected Average<br />
Loss and LAE<br />
(5)/(1)<br />
12/31/2008 239 $56,615 $65,673 1.508 $99,035 $414.37<br />
12/31/2009 329 135,930 157,679 1.371 216,178 657.08<br />
12/31/2010 400 187,000 216,920 1.246 270,282 675.71<br />
* Evalu<strong>at</strong>ed <strong>at</strong> 15 months<br />
(8) Indic<strong>at</strong>ed Provision for Loss and LAE<br />
Allst<strong>at</strong>e Indemnity Company<br />
Priv<strong>at</strong>e Passenger Auto<br />
<strong>Delaware</strong><br />
Development of Provision for Loss and LAE<br />
Collision<br />
$583.32<br />
(7)<br />
Experience Year<br />
Weights<br />
33 %<br />
33<br />
34<br />
Attachment III<br />
Exhibit 2.5
Fiscal Year Ending<br />
(1)<br />
Earned Exposures<br />
(2)<br />
Accident Year *<br />
Non-C<strong>at</strong>astrophe<br />
Ultim<strong>at</strong>e Loss<br />
(3)<br />
Average<br />
C<strong>at</strong>astrophe Factor<br />
(4)<br />
Accident Year<br />
Ultim<strong>at</strong>e Loss<br />
(2) * (1+(3))<br />
(5)<br />
Ultim<strong>at</strong>e Loss and<br />
LAE<br />
(6)<br />
Factor to Adjust<br />
Losses for Pure<br />
Premium Trend <strong>at</strong><br />
3/31/2011<br />
(7)<br />
Projected Ultim<strong>at</strong>e<br />
Loss and LAE<br />
Attachment III<br />
Exhibit 2.6<br />
(8)<br />
Projected Average<br />
Loss and LAE<br />
(7)/(1)<br />
12/31/2008 262 $13,293 0.028 $13,665 $15,851 1.000 $15,851 $60.50<br />
12/31/2009 360 29,730 0.028 30,562 35,452 1.000 35,452 98.48<br />
12/31/2010 442 15,947 0.028 16,394 19,017 1.000 19,017 43.02<br />
* Evalu<strong>at</strong>ed <strong>at</strong> 15 months<br />
(10) Indic<strong>at</strong>ed Provision for Loss and LAE<br />
Allst<strong>at</strong>e Indemnity Company<br />
Priv<strong>at</strong>e Passenger Auto<br />
<strong>Delaware</strong><br />
Development of Provision for Loss and LAE<br />
Comprehensive<br />
$67.09<br />
(9)<br />
Experience Year<br />
Weights<br />
33 %<br />
33<br />
34
Fiscal Accident Earned<br />
Year Ending 12/31 15 Months 27 Months 39 Months 51 Months 63 Months 75 Months 87 Months 99 Months 111 Months 123 Months‡ Exposures<br />
1997 1,336,778 1,639,831 1,976,075 2,125,640 2,227,066 2,224,899 2,249,965 2,272,287 2,264,051 2,264,051 6,801<br />
1998 1,286,391 1,788,848 1,970,905 2,235,397 2,291,102 2,293,984 2,295,107 2,295,107 2,295,107 2,295,107 6,485<br />
1999 1,120,736 1,508,731 1,816,832 1,878,098 1,921,938 1,928,532 1,942,643 1,942,643 1,942,643 1,942,643 6,523<br />
2000 1,185,272 1,292,640 1,469,484 1,648,173 1,695,092 1,682,635 1,698,675 1,698,675 1,698,675 1,698,675 5,456<br />
2001 615,304 722,633 819,540 876,761 879,084 876,969 877,969 877,969 877,969 877,969 3,811<br />
2002 436,827 563,562 730,157 737,348 753,008 753,008 753,008 753,008 753,008 2,774<br />
2003 160,413 256,470 262,195 274,430 274,430 274,430 274,430 274,430 1,422<br />
2004 140,120 170,842 163,292 168,837 168,124 168,124 168,124 1,069<br />
2005 77,815 112,769 111,573 111,573 111,573 111,573 870<br />
2006 37,822 35,546 36,546 36,546 36,546 736<br />
2007 107,672 107,814 140,192 135,066 593<br />
2008 50,907 82,578 70,876 507<br />
2009 313,478 320,311 873<br />
2010 275,794 1,208<br />
Selected Trend: -4.0%<br />
Trended Incurred Losses<br />
Fiscal Accident<br />
Year Ending 12/31 15 Months 27 Months 39 Months 51 Months 63 Months 75 Months 87 Months 99 Months 111 Months 123 Months‡<br />
1997 1,331,718 1,331,718<br />
1998 1,406,234 1,406,234 1,406,234<br />
1999 1,239,871 1,239,871 1,239,871 1,239,871<br />
2000 1,118,671 1,129,335 1,129,335 1,129,335 1,129,335<br />
2001 608,796 607,331 608,023 608,023 608,023 608,023<br />
2002 531,915 543,212 543,212 543,212 543,212 543,212<br />
2003 197,026 206,220 206,220 206,220 206,220 206,220<br />
2004 133,728 127,818 132,158 131,600 131,600 131,600<br />
2005 63,448 91,949 90,974 90,974 90,974 90,974<br />
2006 32,124 30,191 31,040 31,040 31,040<br />
2007 95,261 95,387 124,033 119,498<br />
2008 46,916 76,104 65,319<br />
2009 300,939 307,499<br />
2010 275,794<br />
Development 15 to 27 27 to 39 39 to 51 51 to 63 63 to 75 75 to 87 87 to 99 99 to 111 111 to 123<br />
4th Prior 32.760 -5.529 6.466 4.072 -0.384 1.955 0.000 0.000 0.000<br />
3rd Prior -2.626 -1.121 4.060 0.000 0.000 0.182 0.000 0.000 0.000<br />
2nd Prior 0.212 1.154 0.000 -0.522 0.000 0.000 0.000 0.000 0.000<br />
1st Prior 57.570 48.307 0.000 0.000 0.000 0.000 0.000 0.000 0.000<br />
L<strong>at</strong>est 7.514 -21.272 -7.648 0.000 0.000 0.000 0.000 0.000 0.000<br />
5 Year Excluding High/Low Outliers: 15.06 -2.26 1.62 0.00 0.00 0.11 0.00 0.00 0.00<br />
Selected: 15.06 -2.26 1.62 0.00 0.00 0.11 0.00 0.00 0.00<br />
Selected Methodology<br />
Additive Method<br />
Loss Development Period ( months ): 15 - 123 27 - 123 39 - 123 51 - 123 63 - 123<br />
Additive Amt per Exp: 14.53 -0.53 1.73 0.11 0.11<br />
†Includes ALAE<br />
‡Includes supplemental reserves in addition to case reserves<br />
Year<br />
Trended<br />
Age-to-Ult<br />
Additive Amt<br />
Per Exposure<br />
Earned<br />
Exposures<br />
Allst<strong>at</strong>e Indemnity Company<br />
Trended<br />
Losses Yet<br />
To Emerge<br />
Allst<strong>at</strong>e Indemnity Company<br />
Priv<strong>at</strong>e Passenger Auto<br />
<strong>Delaware</strong><br />
Calcul<strong>at</strong>ion of Loss Development Factors<br />
Bodily Injury<br />
Incurred Losses †<br />
(36 pt. primary considered for all coverages)<br />
Trended Additive Amounts per Exposure<br />
De-Trended<br />
Losses Yet<br />
To Emerge<br />
Incurred<br />
Loss & ALAE<br />
Ultim<strong>at</strong>e<br />
Loss & ALAE<br />
2008 1.73 507 877 952 70,876 71,828<br />
2009 -0.53 873 -463 -482 320,311 319,829<br />
2010 14.53 1,208 17,552 17,552 275,794 293,346<br />
Attachment III<br />
Exhibit 3.1
Fiscal Accident Earned<br />
Year Ending 12/31 15 Months 27 Months 39 Months 51 Months 63 Months 75 Months 87 Months 99 Months 111 Months 123 Months‡ Exposures<br />
1997 1,018,648 1,051,203 1,085,217 1,075,217 1,075,723 1,065,985 1,065,985 1,065,985 1,065,985 1,065,985 6,801<br />
1998 931,634 1,017,760 1,069,121 1,046,290 1,054,269 1,054,269 1,054,269 1,054,269 1,054,269 1,054,269 6,485<br />
1999 1,001,992 1,058,159 1,101,518 1,105,860 1,105,860 1,105,860 1,105,860 1,105,860 1,105,860 1,105,860 6,523<br />
2000 848,516 930,350 961,178 941,197 941,197 946,197 946,197 946,197 946,197 946,197 5,456<br />
2001 435,805 471,489 488,739 481,915 481,915 481,915 481,915 481,915 481,915 481,915 3,811<br />
2002 398,675 421,277 432,273 434,220 434,220 434,220 434,220 434,220 434,220 2,774<br />
2003 187,571 218,712 218,712 218,712 218,712 218,712 218,712 218,712 1,422<br />
2004 98,334 109,195 110,146 110,146 110,146 110,146 110,146 1,069<br />
2005 131,342 141,531 141,531 141,531 141,531 141,531 870<br />
2006 54,791 54,791 54,791 54,791 54,791 736<br />
2007 118,460 121,942 122,564 122,564 593<br />
2008 95,450 92,243 92,243 507<br />
2009 195,427 255,675 873<br />
2010 308,194 1,208<br />
Selected Trend: 8.0%<br />
Trended Incurred Losses<br />
Fiscal Accident<br />
Year Ending 12/31 15 Months 27 Months 39 Months 51 Months 63 Months 75 Months 87 Months 99 Months 111 Months 123 Months‡<br />
1997 2,899,078 2,899,078<br />
1998 2,654,829 2,654,829 2,654,829<br />
1999 2,578,466 2,578,466 2,578,466 2,578,466<br />
2000 2,042,768 2,042,768 2,042,768 2,042,768 2,042,768<br />
2001 963,350 963,350 963,350 963,350 963,350 963,350<br />
2002 803,711 803,711 803,711 803,711 803,711 803,711<br />
2003 374,834 374,834 374,834 374,834 374,834 374,834<br />
2004 173,279 174,788 174,788 174,788 174,788 174,788<br />
2005 192,984 207,955 207,955 207,955 207,955 207,955<br />
2006 74,543 74,543 74,543 74,543 74,543<br />
2007 149,225 153,612 154,395 154,395<br />
2008 111,333 107,592 107,592<br />
2009 211,061 276,129<br />
2010 308,194<br />
Development 15 to 27 27 to 39 39 to 51 51 to 63 63 to 75 75 to 87 87 to 99 99 to 111 111 to 123<br />
4th Prior 17.208 1.412 0.000 0.000 0.000 0.000 0.000 0.000 0.000<br />
3rd Prior 0.000 0.000 0.000 0.000 0.000 0.000 0.000 0.000 0.000<br />
2nd Prior 7.398 0.000 0.000 0.000 0.000 0.000 0.000 0.000 0.000<br />
1st Prior -7.379 1.320 0.000 0.000 0.000 0.000 0.000 0.000 0.000<br />
L<strong>at</strong>est 74.534 0.000 0.000 0.000 0.000 0.000 0.000 0.000 0.000<br />
5 Year Excluding High/Low Outliers: 8.80 0.43 0.00 0.00 0.00 0.00 0.00 0.00 0.00<br />
Selected: 8.80 0.43 0.00 0.00 0.00 0.00 0.00 0.00 0.00<br />
Selected Methodology<br />
Additive Method<br />
Loss Development Period ( months ): 15 - 123 27 - 123 39 - 123 51 - 123 63 - 123<br />
Additive Amt per Exp: 9.23 0.43 0.00 0.00 0.00<br />
†Includes ALAE<br />
‡Includes supplemental reserves in addition to case reserves<br />
Year<br />
Trended<br />
Age-to-Ult<br />
Additive Amt<br />
Per Exposure<br />
Earned<br />
Exposures<br />
Allst<strong>at</strong>e Indemnity Company<br />
Trended<br />
Losses Yet<br />
To Emerge<br />
Allst<strong>at</strong>e Indemnity Company<br />
Priv<strong>at</strong>e Passenger Auto<br />
<strong>Delaware</strong><br />
Calcul<strong>at</strong>ion of Loss Development Factors<br />
Property Damage<br />
Incurred Losses †<br />
Trended Additive Amounts per Exposure<br />
De-Trended<br />
Losses Yet<br />
To Emerge<br />
Incurred<br />
Loss & ALAE<br />
Ultim<strong>at</strong>e<br />
Loss & ALAE<br />
2008 0.00 507 0 0 92,243 92,243<br />
2009 0.43 873 375 347 255,675 256,022<br />
2010 9.23 1,208 11,150 11,150 308,194 319,344<br />
Attachment III<br />
Exhibit 3.2
Fiscal Accident Earned<br />
Year Ending 12/31 15 Months 27 Months 39 Months 51 Months 63 Months 75 Months 87 Months 99 Months 111 Months 123 Months‡ Exposures<br />
1997 2,058,314 1,808,211 1,690,913 1,590,121 1,585,655 1,575,962 1,579,427 1,579,427 1,579,427 1,579,427 6,801<br />
1998 2,294,976 2,063,331 1,923,271 1,888,515 1,875,575 1,880,075 1,880,046 1,880,046 1,880,046 1,885,116 6,485<br />
1999 2,018,649 1,975,799 1,699,053 1,624,720 1,614,769 1,584,688 1,584,688 1,584,688 1,584,688 1,584,688 6,523<br />
2000 1,687,387 1,340,752 1,130,576 1,058,637 1,045,801 1,047,101 1,047,101 1,047,101 1,047,620 1,047,620 5,456<br />
2001 787,333 723,125 722,449 675,318 663,100 666,246 666,599 666,599 666,599 666,599 3,811<br />
2002 485,365 434,253 397,579 371,559 371,916 371,916 371,916 371,916 371,916 2,774<br />
2003 223,189 244,240 229,139 206,446 180,458 180,458 180,458 173,337 1,422<br />
2004 206,834 211,414 208,559 201,059 201,059 201,059 201,059 1,069<br />
2005 103,898 108,220 78,213 66,426 66,426 66,426 870<br />
2006 42,618 40,065 38,532 19,625 20,983 736<br />
2007 123,916 115,617 79,861 83,102 593<br />
2008 41,721 17,732 16,303 507<br />
2009 343,495 310,010 873<br />
2010 374,175 1,208<br />
Selected Trend: 0.0%<br />
Trended Incurred Losses<br />
Fiscal Accident<br />
Year Ending 12/31 15 Months 27 Months 39 Months 51 Months 63 Months 75 Months 87 Months 99 Months 111 Months 123 Months‡<br />
1997 1,579,427 1,579,427<br />
1998 1,880,046 1,880,046 1,885,116<br />
1999 1,584,688 1,584,688 1,584,688 1,584,688<br />
2000 1,047,101 1,047,101 1,047,101 1,047,620 1,047,620<br />
2001 663,100 666,246 666,599 666,599 666,599 666,599<br />
2002 371,559 371,916 371,916 371,916 371,916 371,916<br />
2003 229,139 206,446 180,458 180,458 180,458 173,337<br />
2004 211,414 208,559 201,059 201,059 201,059 201,059<br />
2005 103,898 108,220 78,213 66,426 66,426 66,426<br />
2006 42,618 40,065 38,532 19,625 20,983<br />
2007 123,916 115,617 79,861 83,102<br />
2008 41,721 17,732 16,303<br />
2009 343,495 310,010<br />
2010 374,175<br />
Development 15 to 27 27 to 39 39 to 51 51 to 63 63 to 75 75 to 87 87 to 99 99 to 111 111 to 123<br />
4th Prior 4.968 -2.671 -15.959 0.129 0.826 0.000 0.000 0.000 0.000<br />
3rd Prior -3.469 -34.491 -7.016 -18.276 0.000 0.093 0.000 0.000 0.782<br />
2nd Prior -13.995 -2.083 -13.548 0.000 0.000 0.000 0.000 0.095 0.000<br />
1st Prior -47.316 -60.297 -25.689 0.000 0.000 0.000 0.000 0.000 0.000<br />
L<strong>at</strong>est -38.356 -2.819 5.465 1.845 0.000 0.000 -5.008 0.000 0.000<br />
5 Year Excluding High/Low Outliers: -20.13 -14.02 -12.49 0.08 0.00 0.00 0.00 0.00 0.00<br />
Selected: -20.13 -14.02 -12.49 0.08 0.00 0.00 0.00 0.00 0.00<br />
Selected Methodology<br />
Additive Method<br />
Loss Development Period ( months ): 15 - 123 27 - 123 39 - 123 51 - 123 63 - 123<br />
Additive Amt per Exp: -46.56 -26.43 -12.41 0.08 0.00<br />
†Includes ALAE<br />
‡Includes supplemental reserves in addition to case reserves<br />
Year<br />
Trended<br />
Age-to-Ult<br />
Additive Amt<br />
Per Exposure<br />
Earned<br />
Exposures<br />
Allst<strong>at</strong>e Indemnity Company<br />
Trended<br />
Losses Yet<br />
To Emerge<br />
Allst<strong>at</strong>e Indemnity Company<br />
Priv<strong>at</strong>e Passenger Auto<br />
<strong>Delaware</strong><br />
Calcul<strong>at</strong>ion of Loss Development Factors<br />
Personal Injury Protection<br />
Incurred Losses †<br />
Trended Additive Amounts per Exposure<br />
De-Trended<br />
Losses Yet<br />
To Emerge<br />
Incurred<br />
Loss & ALAE<br />
Ultim<strong>at</strong>e<br />
Loss & ALAE<br />
2008 -12.41 507 -6,292 -6,292 16,303 10,011<br />
2009 -26.43 873 -23,073 -23,073 310,010 286,937<br />
2010 -46.56 1,208 -56,244 -56,244 374,175 317,931<br />
Attachment III<br />
Exhibit 3.3
Fiscal Accident Earned<br />
Year Ending 12/31 15 Months 27 Months 39 Months 51 Months 63 Months 75 Months 87 Months 99 Months 111 Months 123 Months‡ Exposures<br />
1997 406,384 447,708 464,566 426,016 467,688 442,743 442,925 443,461 443,461 443,461 6,127<br />
1998 262,015 314,066 353,545 366,875 359,690 350,401 350,401 350,401 350,401 350,401 5,970<br />
1999 276,622 339,078 413,066 419,029 425,586 406,732 406,732 406,732 406,732 406,732 6,122<br />
2000 135,531 184,960 220,021 219,292 219,959 219,959 219,959 219,959 219,959 219,959 5,090<br />
2001 111,243 117,039 151,631 158,849 159,014 159,014 160,095 160,095 160,095 160,095 3,566<br />
2002 55,069 82,039 93,979 90,446 93,081 93,081 93,081 93,081 93,081 2,596<br />
2003 27,703 26,044 26,044 26,044 26,044 26,044 26,044 26,044 1,315<br />
2004 23,121 12,421 22,421 22,421 19,386 19,386 19,386 989<br />
2005 5,930 5,734 5,734 5,734 5,734 5,734 806<br />
2006 32,688 11,188 11,188 11,188 11,188 681<br />
2007 7,632 7,632 7,632 7,632 529<br />
2008 2,196 1,946 1,946 447<br />
2009 28,052 31,466 762<br />
2010 20,895 1,014<br />
Selected Trend: -10.0%<br />
Trended Incurred Losses<br />
Fiscal Accident<br />
Year Ending 12/31 15 Months 27 Months 39 Months 51 Months 63 Months 75 Months 87 Months 99 Months 111 Months 123 Months‡<br />
1997 112,722 112,722<br />
1998 98,964 98,964 98,964<br />
1999 127,637 127,637 127,637 127,637<br />
2000 76,695 76,695 76,695 76,695 76,695<br />
2001 61,605 61,605 62,024 62,024 62,024 62,024<br />
2002 38,934 40,068 40,068 40,068 40,068 40,068<br />
2003 12,457 12,457 12,457 12,457 12,457 12,457<br />
2004 6,601 11,915 11,915 10,303 10,303 10,303<br />
2005 3,502 3,386 3,386 3,386 3,386 3,386<br />
2006 21,447 7,340 7,340 7,340 7,340<br />
2007 5,564 5,564 5,564 5,564<br />
2008 1,779 1,576 1,576<br />
2009 25,247 28,319<br />
2010 20,895<br />
Development 15 to 27 27 to 39 39 to 51 51 to 63 63 to 75 75 to 87 87 to 99 99 to 111 111 to 123<br />
4th Prior -0.144 5.373 0.000 0.437 0.000 0.000 0.000 0.000 0.000<br />
3rd Prior -20.715 0.000 0.000 0.000 0.000 0.117 0.000 0.000 0.000<br />
2nd Prior 0.000 0.000 0.000 -1.630 0.000 0.000 0.000 0.000 0.000<br />
1st Prior -0.454 0.000 0.000 0.000 0.000 0.000 0.000 0.000 0.000<br />
L<strong>at</strong>est 4.031 0.000 0.000 0.000 0.000 0.000 0.000 0.000 0.000<br />
5 Year Excluding High/Low Outliers: -0.18 0.00 0.00 0.00 0.00 0.00 0.00 0.00 0.00<br />
Selected: -0.18 0.00 0.00 0.00 0.00 0.00 0.00 0.00 0.00<br />
Selected Methodology<br />
Additive Method<br />
Loss Development Period ( months ): 15 - 123 27 - 123 39 - 123 51 - 123 63 - 123<br />
Additive Amt per Exp: -0.18 0.00 0.00 0.00 0.00<br />
†Includes ALAE<br />
‡Includes supplemental reserves in addition to case reserves<br />
Year<br />
Trended<br />
Age-to-Ult<br />
Additive Amt<br />
Per Exposure<br />
Earned<br />
Exposures<br />
Allst<strong>at</strong>e Indemnity Company<br />
Trended<br />
Losses Yet<br />
To Emerge<br />
Allst<strong>at</strong>e Indemnity Company<br />
Priv<strong>at</strong>e Passenger Auto<br />
<strong>Delaware</strong><br />
Calcul<strong>at</strong>ion of Loss Development Factors<br />
Uninsured / Underinsured Motorist<br />
Incurred Losses †<br />
Trended Additive Amounts per Exposure<br />
De-Trended<br />
Losses Yet<br />
To Emerge<br />
Incurred<br />
Loss & ALAE<br />
Ultim<strong>at</strong>e<br />
Loss & ALAE<br />
2008 0.00 447 0 0 1,946 1,946<br />
2009 0.00 762 0 0 31,466 31,466<br />
2010 -0.18 1,014 -183 -183 20,895 20,712<br />
Attachment III<br />
Exhibit 3.4
Fiscal Accident Earned<br />
Year Ending 12/31 15 Months 27 Months 39 Months 51 Months 63 Months 75 Months 87 Months 99 Months 111 Months 123 Months Exposures<br />
1997 1,130,059 1,069,463 1,065,927 1,066,558 1,066,558 1,071,407 1,071,407 1,071,407 1,071,407 1,071,407 3,369<br />
1998 1,219,119 1,149,919 1,143,054 1,136,501 1,136,501 1,136,501 1,136,501 1,136,501 1,136,501 1,136,501 3,289<br />
1999 1,210,791 1,165,700 1,169,058 1,169,574 1,169,574 1,169,574 1,169,574 1,169,819 1,170,139 1,168,952 3,289<br />
2000 935,167 905,852 903,073 903,073 903,084 903,094 902,729 902,794 902,239 901,699 2,906<br />
2001 684,988 663,909 666,830 668,630 668,675 668,675 668,675 668,675 668,675 668,675 2,204<br />
2002 546,308 527,086 527,108 527,108 527,108 527,108 527,108 527,108 527,108 1,647<br />
2003 359,432 340,297 341,608 341,608 341,608 341,608 341,608 341,608 849<br />
2004 197,565 191,029 191,104 189,656 189,656 189,656 189,656 620<br />
2005 136,519 118,709 118,709 118,709 118,709 118,709 501<br />
2006 86,375 86,375 86,378 86,378 86,378 404<br />
2007 76,177 75,576 75,576 75,576 300<br />
2008 60,637 55,973 56,622 239<br />
2009 133,785 135,930 329<br />
2010 190,719 400<br />
Selected Trend: 1.0%<br />
Trended Paid Losses<br />
Fiscal Accident<br />
Year Ending 12/31 15 Months 27 Months 39 Months 51 Months 63 Months 75 Months 87 Months 99 Months 111 Months 123 Months<br />
1997 1,219,361 1,219,361<br />
1998 1,280,638 1,280,638 1,280,638<br />
1999 1,304,857 1,305,130 1,305,487 1,304,163<br />
2000 997,578 997,174 997,246 996,633 996,037<br />
2001 731,320 731,320 731,320 731,320 731,320 731,320<br />
2002 570,782 570,782 570,782 570,782 570,782 570,782<br />
2003 366,250 366,250 366,250 366,250 366,250 366,250<br />
2004 202,781 202,861 201,324 201,324 201,324 201,324<br />
2005 143,483 124,764 124,764 124,764 124,764 124,764<br />
2006 89,882 89,882 89,885 89,885 89,885<br />
2007 78,485 77,866 77,866 77,866<br />
2008 61,856 57,098 57,760<br />
2009 135,123 137,289<br />
2010 190,719<br />
Development 15 to 27 27 to 39 39 to 51 51 to 63 63 to 75 75 to 87 87 to 99 99 to 111 111 to 123<br />
4th Prior -37.363 0.129 0.000 0.000 0.000 -0.139 0.083 0.000 0.000<br />
3rd Prior 0.000 0.000 -2.479 0.000 0.000 0.000 0.025 0.109 0.000<br />
2nd Prior -2.063 0.007 0.000 0.000 0.000 0.000 0.000 -0.211 -0.403<br />
1st Prior -19.908 0.000 0.000 0.000 0.000 0.000 0.000 0.000 -0.205<br />
L<strong>at</strong>est 6.584 2.770 0.000 0.000 0.000 0.000 0.000 0.000 0.000<br />
5 Year Excluding High/Low Outliers -5.70 0.06 0.00 0.00 0.00 0.00 0.01 0.00 -0.07<br />
Selected Methodology<br />
Loss Development Period ( months ): 15 - 123 27 - 123 39 - 123 51 - 123 63 - 123<br />
Additive Amt per Exp: -5.70 0.00 -0.06 -0.06 -0.06<br />
†Includes ALAE<br />
Additive Method<br />
Year<br />
Trended<br />
Age-to-Ult<br />
Additive Amt<br />
Per Exposure<br />
Earned<br />
Exposures<br />
Allst<strong>at</strong>e Indemnity Company<br />
Trended<br />
Losses Yet<br />
To Emerge<br />
Allst<strong>at</strong>e Indemnity Company<br />
Priv<strong>at</strong>e Passenger Auto<br />
<strong>Delaware</strong><br />
Calcul<strong>at</strong>ion of Loss Development Factors<br />
Collision<br />
Paid Losses †<br />
Trended Additive Amounts per Exposure<br />
De-Trended<br />
Losses Yet<br />
To Emerge<br />
Paid<br />
Loss & ALAE<br />
Ultim<strong>at</strong>e<br />
Loss & ALAE<br />
2008 -0.06 239 -14 -14 56,622 56,608<br />
2009 0.00 329 0 0 135,930 135,930<br />
2010 -5.70 400 -2,280 -2,280 190,719 188,439<br />
Attachment III<br />
Exhibit 3.5
Fiscal Accident Earned<br />
Year Ending 12/31 15 Months 27 Months 39 Months 51 Months 63 Months 75 Months 87 Months 99 Months 111 Months 123 Months Exposures<br />
1997 431,745 444,313 444,246 444,619 444,619 444,619 444,619 444,619 444,619 444,619 3,521<br />
1998 385,907 399,948 399,958 399,958 399,958 399,958 399,958 399,958 399,958 399,958 3,462<br />
1999 455,119 460,485 460,438 459,578 458,698 458,062 458,062 458,062 458,062 452,665 3,449<br />
2000 261,592 260,146 256,886 256,871 256,871 256,571 256,571 253,121 253,121 253,121 3,037<br />
2001 201,647 204,283 204,388 204,388 204,388 204,388 204,388 204,388 204,388 204,388 2,305<br />
2002 144,501 140,347 140,656 140,656 140,656 140,656 140,656 140,656 140,656 1,719<br />
2003 74,238 74,128 74,128 74,128 74,128 74,128 74,128 74,128 891<br />
2004 34,728 34,578 34,578 34,578 34,578 34,578 34,578 654<br />
2005 26,272 26,269 26,269 26,269 26,269 26,269 530<br />
2006 27,635 28,617 28,617 28,617 28,617 433<br />
2007 23,686 23,686 23,686 23,686 329<br />
2008 13,368 13,293 13,293 262<br />
2009 29,730 29,730 360<br />
2010 15,947 442<br />
Selected Trend: -3.0%<br />
Trended Paid Losses<br />
Fiscal Accident<br />
Year Ending 12/31 15 Months 27 Months 39 Months 51 Months 63 Months 75 Months 87 Months 99 Months 111 Months 123 Months<br />
1997 299,241 299,241<br />
1998 277,508 277,508 277,508<br />
1999 327,652 327,652 327,652 323,792<br />
2000 189,202 189,202 186,658 186,658 186,658<br />
2001 155,382 155,382 155,382 155,382 155,382 155,382<br />
2002 110,238 110,238 110,238 110,238 110,238 110,238<br />
2003 59,894 59,894 59,894 59,894 59,894 59,894<br />
2004 28,803 28,803 28,803 28,803 28,803 28,803<br />
2005 22,561 22,558 22,558 22,558 22,558 22,558<br />
2006 24,465 25,334 25,334 25,334 25,334<br />
2007 21,618 21,618 21,618 21,618<br />
2008 12,578 12,507 12,507<br />
2009 28,838 28,838<br />
2010 15,947<br />
Development 15 to 27 27 to 39 39 to 51 51 to 63 63 to 75 75 to 87 87 to 99 99 to 111 111 to 123<br />
4th Prior -0.006 0.000 0.000 0.000 0.000 0.000 0.000 0.000 0.000<br />
3rd Prior 2.007 0.000 0.000 0.000 0.000 0.000 -0.838 0.000 0.000<br />
2nd Prior 0.000 0.000 0.000 0.000 0.000 0.000 0.000 0.000 -1.119<br />
1st Prior -0.271 0.000 0.000 0.000 0.000 0.000 0.000 0.000 0.000<br />
L<strong>at</strong>est 0.000 0.000 0.000 0.000 0.000 0.000 0.000 0.000 0.000<br />
5 Year Excluding High/Low Outliers: 0.00 0.00 0.00 0.00 0.00 0.00 0.00 0.00 0.00<br />
Selected: 0.00 0.00 0.00 0.00 0.00 0.00 0.00 0.00 0.00<br />
Selected Methodology<br />
Loss Development Period ( months ): 15 - 123 27 - 123 39 - 123 51 - 123 63 - 123<br />
Additive Amt per Exp: 0.00 0.00 0.00 0.00 0.00<br />
†Includes ALAE<br />
Additive Method<br />
Year<br />
Trended<br />
Age-to-Ult<br />
Additive Amt<br />
Per Exposure<br />
Earned<br />
Exposures<br />
Allst<strong>at</strong>e Indemnity Company<br />
Trended<br />
Losses Yet<br />
To Emerge<br />
Allst<strong>at</strong>e Indemnity Company<br />
Priv<strong>at</strong>e Passenger Auto<br />
<strong>Delaware</strong><br />
Calcul<strong>at</strong>ion of Loss Development Factors<br />
Comprehensive<br />
Paid Losses †<br />
Trended Additive Amounts per Exposure<br />
De-Trended<br />
Losses Yet<br />
To Emerge<br />
Paid<br />
Loss & ALAE<br />
Ultim<strong>at</strong>e<br />
Loss & ALAE<br />
2008 0.00 262 0 0 13,293 13,293<br />
2009 0.00 360 0 0 29,730 29,730<br />
2010 0.00 442 0 0 15,947 15,947<br />
Attachment III<br />
Exhibit 3.6
Fiscal Accident<br />
Attachment III<br />
Exhibit 4.1<br />
Year Ending 12/31 15 Months 27 Months 39 Months 51 Months 63 Months 75 Months 87 Months 99 Months 111 Months 123 Months‡<br />
1997 2,264,051 2,264,051<br />
1998 2,295,107 2,295,107 2,295,107<br />
1999 1,942,643 1,942,643 1,942,643 1,942,643<br />
2000 1,682,635 1,698,675 1,698,675 1,698,675 1,698,675<br />
2001 879,084 876,969 877,969 877,969 877,969 877,969<br />
2002 737,348 753,008 753,008 753,008 753,008 753,008<br />
2003 262,195 274,430 274,430 274,430 274,430 274,430<br />
2004 170,842 163,292 168,837 168,124 168,124 168,124<br />
2005 77,815 112,769 111,573 111,573 111,573 111,573<br />
2006 37,822 35,546 36,546 36,546 36,546<br />
2007 107,672 107,814 140,192 135,066<br />
2008 50,907 82,578 70,876<br />
2009 313,478 320,311<br />
2010 275,794<br />
Development 15 to 27 27 to 39 39 to 51 51 to 63 63 to 75 75 to 87 87 to 99 99 to 111 111 to 123<br />
4th Prior 1.449 0.956 1.047 1.021 0.998 1.010 1.000 1.000 1.000<br />
3rd Prior 0.940 0.989 1.034 1.000 1.000 1.001 1.000 1.000 1.000<br />
2nd Prior 1.001 1.028 1.000 0.996 1.000 1.000 1.000 1.000 1.000<br />
1st Prior 1.622 1.300 1.000 1.000 1.000 1.000 1.000 1.000 1.000<br />
L<strong>at</strong>est 1.022 0.858 0.963 1.000 1.000 1.000 1.000 1.000 1.000<br />
5 Year Excluding High/Low Outliers: 1.157 0.991 1.011 1.000 1.000 1.000 1.000 1.000 1.000<br />
Selected: 1.157 0.991 1.011 1.000 1.000 1.000 1.000 1.000 1.000<br />
Selected Methodology<br />
Link R<strong>at</strong>io Method<br />
Loss Development Period ( months ): 15 - 123 27 - 123 39 - 123 51 - 123 63 - 123<br />
Loss Development Factor: 1.159 1.002 1.011 1.000 1.000<br />
†Includes ALAE<br />
‡Includes supplemental reserves in addition to case reserves<br />
Allst<strong>at</strong>e Indemnity Company<br />
Year Inc. Loss Factor to Ultim<strong>at</strong>e<br />
Ultim<strong>at</strong>e Loss &<br />
ALAE<br />
2008 $70,876 1.011 71,656<br />
2009 $320,311 1.002 320,952<br />
2010 $275,794 1.159 319,645<br />
Allst<strong>at</strong>e Indemnity Company<br />
Priv<strong>at</strong>e Passenger Auto<br />
<strong>Delaware</strong><br />
Calcul<strong>at</strong>ion of Loss Development Factors<br />
Bodily Injury<br />
Incurred Losses †<br />
Link R<strong>at</strong>ios
Fiscal Accident<br />
Attachment III<br />
Exhibit 4.2<br />
Year Ending 12/31 15 Months 27 Months 39 Months 51 Months 63 Months 75 Months 87 Months 99 Months 111 Months 123 Months‡<br />
1997 1,065,985 1,065,985<br />
1998 1,054,269 1,054,269 1,054,269<br />
1999 1,105,860 1,105,860 1,105,860 1,105,860<br />
2000 946,197 946,197 946,197 946,197 946,197<br />
2001 481,915 481,915 481,915 481,915 481,915 481,915<br />
2002 434,220 434,220 434,220 434,220 434,220 434,220<br />
2003 218,712 218,712 218,712 218,712 218,712 218,712<br />
2004 109,195 110,146 110,146 110,146 110,146 110,146<br />
2005 131,342 141,531 141,531 141,531 141,531 141,531<br />
2006 54,791 54,791 54,791 54,791 54,791<br />
2007 118,460 121,942 122,564 122,564<br />
2008 95,450 92,243 92,243<br />
2009 195,427 255,675<br />
2010 308,194<br />
Development 15 to 27 27 to 39 39 to 51 51 to 63 63 to 75 75 to 87 87 to 99 99 to 111 111 to 123<br />
4th Prior 1.078 1.009 1.000 1.000 1.000 1.000 1.000 1.000 1.000<br />
3rd Prior 1.000 1.000 1.000 1.000 1.000 1.000 1.000 1.000 1.000<br />
2nd Prior 1.029 1.000 1.000 1.000 1.000 1.000 1.000 1.000 1.000<br />
1st Prior 0.966 1.005 1.000 1.000 1.000 1.000 1.000 1.000 1.000<br />
L<strong>at</strong>est 1.308 1.000 1.000 1.000 1.000 1.000 1.000 1.000 1.000<br />
5 Year Excluding High/Low Outliers: 1.036 1.002 1.000 1.000 1.000 1.000 1.000 1.000 1.000<br />
Selected: 1.036 1.002 1.000 1.000 1.000 1.000 1.000 1.000 1.000<br />
Selected Methodology<br />
Link R<strong>at</strong>io Method<br />
Loss Development Period ( months ): 15 - 123 27 - 123 39 - 123 51 - 123 63 - 123<br />
Loss Development Factor: 1.038 1.002 1.000 1.000 1.000<br />
†Includes ALAE<br />
‡Includes supplemental reserves in addition to case reserves<br />
Allst<strong>at</strong>e Indemnity Company<br />
Year Inc. Loss Factor to Ultim<strong>at</strong>e<br />
Ultim<strong>at</strong>e Loss &<br />
ALAE<br />
2008 $92,243 1.000 92,243<br />
2009 $255,675 1.002 256,186<br />
2010 $308,194 1.038 319,905<br />
Allst<strong>at</strong>e Indemnity Company<br />
Priv<strong>at</strong>e Passenger Auto<br />
<strong>Delaware</strong><br />
Calcul<strong>at</strong>ion of Loss Development Factors<br />
Property Damage<br />
Incurred Losses †<br />
Link R<strong>at</strong>ios
Fiscal Accident<br />
Attachment III<br />
Exhibit 4.3<br />
Year Ending 12/31 15 Months 27 Months 39 Months 51 Months 63 Months 75 Months 87 Months 99 Months 111 Months 123 Months‡<br />
1997 1,579,427 1,579,427<br />
1998 1,880,046 1,880,046 1,885,116<br />
1999 1,584,688 1,584,688 1,584,688 1,584,688<br />
2000 1,047,101 1,047,101 1,047,101 1,047,620 1,047,620<br />
2001 663,100 666,246 666,599 666,599 666,599 666,599<br />
2002 371,559 371,916 371,916 371,916 371,916 371,916<br />
2003 229,139 206,446 180,458 180,458 180,458 173,337<br />
2004 211,414 208,559 201,059 201,059 201,059 201,059<br />
2005 103,898 108,220 78,213 66,426 66,426 66,426<br />
2006 42,618 40,065 38,532 19,625 20,983<br />
2007 123,916 115,617 79,861 83,102<br />
2008 41,721 17,732 16,303<br />
2009 343,495 310,010<br />
2010 374,175<br />
Development 15 to 27 27 to 39 39 to 51 51 to 63 63 to 75 75 to 87 87 to 99 99 to 111 111 to 123<br />
4th Prior 1.042 0.986 0.901 1.001 1.005 1.000 1.000 1.000 1.000<br />
3rd Prior 0.940 0.723 0.964 0.874 1.000 1.001 1.000 1.000 1.003<br />
2nd Prior 0.933 0.962 0.849 1.000 1.000 1.000 1.000 1.000 1.000<br />
1st Prior 0.425 0.691 0.509 1.000 1.000 1.000 1.000 1.000 1.000<br />
L<strong>at</strong>est 0.903 0.919 1.041 1.069 1.000 1.000 0.961 1.000 1.000<br />
5 Year Excluding High/Low Outliers: 0.925 0.868 0.905 1.000 1.000 1.000 1.000 1.000 1.000<br />
Selected: 0.925 0.868 0.905 1.000 1.000 1.000 1.000 1.000 1.000<br />
Selected Methodology<br />
Link R<strong>at</strong>io Method<br />
Loss Development Period ( months ): 15 - 123 27 - 123 39 - 123 51 - 123 63 - 123<br />
Loss Development Factor: 0.727 0.786 0.905 1.000 1.000<br />
†Includes ALAE<br />
‡Includes supplemental reserves in addition to case reserves<br />
Allst<strong>at</strong>e Indemnity Company<br />
Year Inc. Loss Factor to Ultim<strong>at</strong>e<br />
Ultim<strong>at</strong>e Loss &<br />
ALAE<br />
2008 $16,303 0.905 14,754<br />
2009 $310,010 0.786 243,668<br />
2010 $374,175 0.727 272,025<br />
Allst<strong>at</strong>e Indemnity Company<br />
Priv<strong>at</strong>e Passenger Auto<br />
<strong>Delaware</strong><br />
Calcul<strong>at</strong>ion of Loss Development Factors<br />
Personal Injury Protection<br />
Incurred Losses †<br />
Link R<strong>at</strong>ios
Fiscal Accident<br />
Attachment III<br />
Exhibit 4.4<br />
Year Ending 12/31 15 Months 27 Months 39 Months 51 Months 63 Months 75 Months 87 Months 99 Months 111 Months 123 Months‡<br />
1997 443,461 443,461<br />
1998 350,401 350,401 350,401<br />
1999 406,732 406,732 406,732 406,732<br />
2000 219,959 219,959 219,959 219,959 219,959<br />
2001 159,014 159,014 160,095 160,095 160,095 160,095<br />
2002 90,446 93,081 93,081 93,081 93,081 93,081<br />
2003 26,044 26,044 26,044 26,044 26,044 26,044<br />
2004 12,421 22,421 22,421 19,386 19,386 19,386<br />
2005 5,930 5,734 5,734 5,734 5,734 5,734<br />
2006 32,688 11,188 11,188 11,188 11,188<br />
2007 7,632 7,632 7,632 7,632<br />
2008 2,196 1,946 1,946<br />
2009 28,052 31,466<br />
2010 20,895<br />
Development 15 to 27 27 to 39 39 to 51 51 to 63 63 to 75 75 to 87 87 to 99 99 to 111 111 to 123<br />
4th Prior 0.967 1.805 1.000 1.029 1.000 1.000 1.000 1.000 1.000<br />
3rd Prior 0.342 1.000 1.000 1.000 1.000 1.007 1.000 1.000 1.000<br />
2nd Prior 1.000 1.000 1.000 0.865 1.000 1.000 1.000 1.000 1.000<br />
1st Prior 0.886 1.000 1.000 1.000 1.000 1.000 1.000 1.000 1.000<br />
L<strong>at</strong>est 1.122 1.000 1.000 1.000 1.000 1.000 1.000 1.000 1.000<br />
5 Year Excluding High/Low Outliers: 0.951 1.000 1.000 1.000 1.000 1.000 1.000 1.000 1.000<br />
Selected: 0.951 1.000 1.000 1.000 1.000 1.000 1.000 1.000 1.000<br />
Selected Methodology<br />
Link R<strong>at</strong>io Method<br />
Loss Development Period ( months ): 15 - 123 27 - 123 39 - 123 51 - 123 63 - 123<br />
Loss Development Factor: 0.951 1.000 1.000 1.000 1.000<br />
†Includes ALAE<br />
‡Includes supplemental reserves in addition to case reserves<br />
Allst<strong>at</strong>e Indemnity Company<br />
Year Inc. Loss Factor to Ultim<strong>at</strong>e<br />
Ultim<strong>at</strong>e Loss &<br />
ALAE<br />
2008 $1,946 1.000 1,946<br />
2009 $31,466 1.000 31,466<br />
2010 $20,895 0.951 19,871<br />
Allst<strong>at</strong>e Indemnity Company<br />
Priv<strong>at</strong>e Passenger Auto<br />
<strong>Delaware</strong><br />
Calcul<strong>at</strong>ion of Loss Development Factors<br />
Uninsured / Underinsured Motorist<br />
Incurred Losses †<br />
Link R<strong>at</strong>ios
Fiscal Accident<br />
Attachment III<br />
Exhibit 4.5<br />
Year Ending 12/31 15 Months 27 Months 39 Months 51 Months 63 Months 75 Months 87 Months 99 Months 111 Months 123 Months<br />
1997 1,071,407 1,071,407<br />
1998 1,136,501 1,136,501 1,136,501<br />
1999 1,169,574 1,169,819 1,170,139 1,168,952<br />
2000 903,094 902,729 902,794 902,239 901,699<br />
2001 668,675 668,675 668,675 668,675 668,675 668,675<br />
2002 527,108 527,108 527,108 527,108 527,108 527,108<br />
2003 341,608 341,608 341,608 341,608 341,608 341,608<br />
2004 191,029 191,104 189,656 189,656 189,656 189,656<br />
2005 136,519 118,709 118,709 118,709 118,709 118,709<br />
2006 86,375 86,375 86,378 86,378 86,378<br />
2007 76,177 75,576 75,576 75,576<br />
2008 60,637 55,973 56,622<br />
2009 133,785 135,930<br />
2010 190,719<br />
Development 15 to 27 27 to 39 39 to 51 51 to 63 63 to 75 75 to 87 87 to 99 99 to 111 111 to 123<br />
4th Prior 0.870 1.000 1.000 1.000 1.000 1.000 1.000 1.000 1.000<br />
3rd Prior 1.000 1.000 0.992 1.000 1.000 1.000 1.000 1.000 1.000<br />
2nd Prior 0.992 1.000 1.000 1.000 1.000 1.000 1.000 0.999 0.999<br />
1st Prior 0.923 1.000 1.000 1.000 1.000 1.000 1.000 1.000 0.999<br />
L<strong>at</strong>est 1.016 1.012 1.000 1.000 1.000 1.000 1.000 1.000 1.000<br />
5 Year Excluding High/Low Outliers: 0.972 1.000 1.000 1.000 1.000 1.000 1.000 1.000 1.000<br />
Selected: 0.972 1.000 1.000 1.000 1.000 1.000 1.000 1.000 1.000<br />
Selected Methodology<br />
Loss Development Period ( months ): 15 - 123 27 - 123 39 - 123 51 - 123 63 - 123<br />
Loss Development Factor: 0.972 1.000 1.000 1.000 1.000<br />
†Includes ALAE<br />
Link R<strong>at</strong>io Method<br />
Allst<strong>at</strong>e Indemnity Company<br />
Year Paid Loss Factor to Ultim<strong>at</strong>e<br />
Ultim<strong>at</strong>e Loss &<br />
ALAE<br />
2008 $56,622 1.000 56,622<br />
2009 $135,930 1.000 135,930<br />
2010 $190,719 0.972 185,379<br />
Allst<strong>at</strong>e Indemnity Company<br />
Priv<strong>at</strong>e Passenger Auto<br />
<strong>Delaware</strong><br />
Calcul<strong>at</strong>ion of Loss Development Factors<br />
Collision<br />
Paid Losses †<br />
Link R<strong>at</strong>ios
Fiscal Accident<br />
Attachment III<br />
Exhibit 4.6<br />
Year Ending 12/31 15 Months 27 Months 39 Months 51 Months 63 Months 75 Months 87 Months 99 Months 111 Months 123 Months<br />
1997 444,619 444,619<br />
1998 399,958 399,958 399,958<br />
1999 458,062 458,062 458,062 452,665<br />
2000 256,571 256,571 253,121 253,121 253,121<br />
2001 204,388 204,388 204,388 204,388 204,388 204,388<br />
2002 140,656 140,656 140,656 140,656 140,656 140,656<br />
2003 74,128 74,128 74,128 74,128 74,128 74,128<br />
2004 34,578 34,578 34,578 34,578 34,578 34,578<br />
2005 26,272 26,269 26,269 26,269 26,269 26,269<br />
2006 27,635 28,617 28,617 28,617 28,617<br />
2007 23,686 23,686 23,686 23,686<br />
2008 13,368 13,293 13,293<br />
2009 29,730 29,730<br />
2010 15,947<br />
Development 15 to 27 27 to 39 39 to 51 51 to 63 63 to 75 75 to 87 87 to 99 99 to 111 111 to 123<br />
4th Prior 1.000 1.000 1.000 1.000 1.000 1.000 1.000 1.000 1.000<br />
3rd Prior 1.036 1.000 1.000 1.000 1.000 1.000 0.987 1.000 1.000<br />
2nd Prior 1.000 1.000 1.000 1.000 1.000 1.000 1.000 1.000 0.988<br />
1st Prior 0.994 1.000 1.000 1.000 1.000 1.000 1.000 1.000 1.000<br />
L<strong>at</strong>est 1.000 1.000 1.000 1.000 1.000 1.000 1.000 1.000 1.000<br />
5 Year Excluding High/Low Outliers: 1.000 1.000 1.000 1.000 1.000 1.000 1.000 1.000 1.000<br />
Selected: 1.000 1.000 1.000 1.000 1.000 1.000 1.000 1.000 1.000<br />
Selected Methodology<br />
Loss Development Period ( months ): 15 - 123 27 - 123 39 - 123 51 - 123 63 - 123<br />
Loss Development Factor: 1.000 1.000 1.000 1.000 1.000<br />
†Includes ALAE<br />
Link R<strong>at</strong>io Method<br />
Allst<strong>at</strong>e Indemnity Company<br />
Year Paid Loss Factor to Ultim<strong>at</strong>e<br />
Ultim<strong>at</strong>e Loss &<br />
ALAE<br />
2008 $13,293 1.000 13,293<br />
2009 $29,730 1.000 29,730<br />
2010 $15,947 1.000 15,947<br />
Allst<strong>at</strong>e Indemnity Company<br />
Priv<strong>at</strong>e Passenger Auto<br />
<strong>Delaware</strong><br />
Calcul<strong>at</strong>ion of Loss Development Factors<br />
Comprehensive<br />
Paid Losses †<br />
Link R<strong>at</strong>ios
Allst<strong>at</strong>e Indemnity Company<br />
<strong>Delaware</strong><br />
Priv<strong>at</strong>e Passenger Auto<br />
Ultim<strong>at</strong>e Losses & ALAE<br />
Attachment III<br />
Exhibit 5<br />
Ultim<strong>at</strong>e Losses & ALAE<br />
Link R<strong>at</strong>io Additive<br />
Coverage Year Estim<strong>at</strong>e Estim<strong>at</strong>e Selected<br />
Bodily Injury 2008 71,656 71,828<br />
Bodily Injury 2009 320,952 319,829<br />
Bodily Injury 2010 319,645 293,346<br />
Property Damage 2008 92,243 92,243<br />
Property Damage 2009 256,186 256,022<br />
Property Damage 2010 319,905 319,344<br />
Personal Injury Protection 2008 14,754 10,011<br />
Personal Injury Protection 2009 243,668 286,937<br />
Personal Injury Protection 2010 272,025 317,931<br />
Uninsured / Underinsured Motorist 2008 1,946 1,946<br />
Uninsured / Underinsured Motorist 2009 31,466 31,466<br />
Uninsured / Underinsured Motorist 2010 19,871 20,712<br />
Collision 2008 56,622 56,608<br />
Collision 2009 135,930 135,930<br />
Collision 2010 185,379 188,439<br />
Comprehensive 2008 13,293 13,293<br />
Comprehensive 2009 29,730 29,730<br />
Comprehensive 2010 15,947 15,947<br />
71,700<br />
320,000<br />
305,000<br />
92,243<br />
256,100<br />
319,600<br />
12,000<br />
265,000<br />
295,000<br />
1,946<br />
31,466<br />
20,300<br />
56,615<br />
135,930<br />
187,000<br />
13,293<br />
29,730<br />
15,947
ALLSTATE INSURANCE GROUP*<br />
Countrywide Expense Experience - Unalloc<strong>at</strong>ed (Adjusting and Other Expense) Factor<br />
2007, 2008 & 2009<br />
Attachment III<br />
Exhibit 6<br />
2007 - 2009**<br />
1. Direct Losses and Alloc<strong>at</strong>ed Loss Adjustment<br />
Expense Incurred excluding Earthquake and $39,781,693<br />
Hurricane Losses<br />
2. Direct Unalloc<strong>at</strong>ed Loss Adjustment Expense<br />
Incurred excluding Earthquake and Hurricane $6,347,066<br />
3. R<strong>at</strong>io (2)/(1) 0.160<br />
4. Proposed Provision 0.160<br />
* Allst<strong>at</strong>e <strong>Insurance</strong> Company, Allst<strong>at</strong>e Indemnity Company, Allst<strong>at</strong>e Property and Casualty <strong>Insurance</strong> Company, Allst<strong>at</strong>e County<br />
Mutual <strong>Insurance</strong> Company, Allst<strong>at</strong>e Fire & Casualty <strong>Insurance</strong> Company, Northbrook Indemnity Company and Allst<strong>at</strong>e Texas Lloyds.<br />
** Includes Personal Property Lines and Priv<strong>at</strong>e Passenger Automobile <strong>Insurance</strong><br />
(000 Omitted)
Coverage<br />
Bodily Injury<br />
Property Damage<br />
Personal Injury Protection<br />
Uninsured / Underinsured Motorist<br />
Collision<br />
Comprehensive<br />
2nd Prior Year 1st Prior Year Current Year<br />
1) Loss Trend Projection D<strong>at</strong>e 10/21/2012 10/21/2012 10/21/2012<br />
2) Mid-Point of Current Year's Experience Period 6/30/2010 6/30/2010 6/30/2010<br />
3) Experience Period Ended 12/31/2008 12/31/2009 12/31/2010<br />
4) Midpoint of Experience Period 6/30/2008 6/30/2009 6/30/2010<br />
5) Historical: Number of Years from (4) to (2) 2.000 1.000 0.000<br />
6) Projected: Number of Years from (2) to (1) 2.310 2.310 2.310<br />
Calcul<strong>at</strong>ion of Trend Factors<br />
Allst<strong>at</strong>e Indemnity Company<br />
Priv<strong>at</strong>e Passenger Auto<br />
<strong>Delaware</strong><br />
Calcul<strong>at</strong>ion of Pure Premium Trend Factor<br />
Selected Annual Pure Premium Impacts<br />
Historical Projected<br />
18.00% 18.00%<br />
14.00 14.00<br />
25.00 10.00<br />
5.00 5.00<br />
10.00 10.00<br />
0.00 0.00<br />
(a) Historical Pure Premium Factors are the Annual Historical Impacts plus unity compounded for the number of years in (5)<br />
(b) Projected Pure Premium Factors are the Annual Projected Impacts plus unity compounded for the number of years in (6)<br />
(c) Factor to Adjust Losses for Pure Premium Trend = (a) x (b)<br />
Attachment III<br />
Exhibit 7
Allst<strong>at</strong>e Indemnity Company<br />
Priv<strong>at</strong>e Passenger Auto<br />
<strong>Delaware</strong><br />
Loss Trends - Pure Premium<br />
Bodily Injury<br />
Exponential Curve of Best Fit<br />
Attachment III<br />
Exhibit 8.1<br />
Year Ending<br />
Actual Paid Pure<br />
Premium Annual Change 24 pt. 12 pt. 6 pt.<br />
06/05 $214.22 -11.34 % $164.55<br />
09/05 177.81 -22.16 165.42<br />
12/05 175.03 -25.74 166.29<br />
03/06 170.53 -23.58 167.16<br />
06/06 169.77 -20.75 168.04<br />
09/06 208.77 17.41 168.92<br />
12/06 173.11 -1.10 169.81<br />
03/07 205.66 20.60 170.70<br />
06/07 161.89 -4.64 171.60<br />
09/07 145.35 -30.38 172.50<br />
12/07 165.68 -4.29 173.41<br />
03/08 178.20 -13.35 174.32<br />
06/08 173.46 7.15 175.24 $115.19<br />
09/08 153.57 5.66 176.16 123.88<br />
12/08 123.26 -25.60 177.09 133.22<br />
03/09 88.55 -50.31 178.02 143.27<br />
06/09 110.50 -36.30 178.95 154.07<br />
09/09 170.92 11.30 179.89 165.69<br />
12/09 154.78 25.57 180.84 178.19 $171.28<br />
03/10 199.96 † 125.82 181.79 191.63 190.11<br />
06/10 248.17 † 124.59 182.75 206.08 211.00<br />
09/10 223.37 † 30.69 183.71 221.63 234.18<br />
12/10 238.08 † 53.82 184.67 238.34 259.92<br />
03/11 295.36 † 47.71 185.64 256.32 288.48<br />
Regression 24 pt. 12 pt.<br />
Avg Annual Percent Change Based on Best Fit: 2.12%<br />
33.76%<br />
†Adjusted Values<br />
6 pt.<br />
51.75%
Allst<strong>at</strong>e Indemnity Company<br />
Priv<strong>at</strong>e Passenger Auto<br />
<strong>Delaware</strong><br />
Loss Trends - Pure Premium<br />
Property Damage<br />
Exponential Curve of Best Fit<br />
Attachment III<br />
Exhibit 8.2<br />
Year Ending<br />
Actual Paid Pure<br />
Premium Annual Change 24 pt. 12 pt. 6 pt.<br />
06/05 $133.38 1.83 % $102.40<br />
09/05 143.84 6.79 107.05<br />
12/05 168.49 31.81 111.91<br />
03/06 168.01 45.17 116.99<br />
06/06 148.57 11.39 122.30<br />
09/06 118.88 -17.35 127.86<br />
12/06 86.37 -48.74 133.66<br />
03/07 79.03 -52.96 139.73<br />
06/07 68.61 -53.82 146.07<br />
09/07 74.10 -37.67 152.71<br />
12/07 115.97 34.27 159.64<br />
03/08 192.90 144.08 166.89<br />
06/08 227.53 231.63 174.46 $216.37<br />
09/08 300.30 305.26 182.38 221.53<br />
12/08 249.19 114.87 190.66 226.81<br />
03/09 188.01 -2.53 199.32 232.21<br />
06/09 225.37 -0.95 208.37 237.75<br />
09/09 201.94 -32.75 217.83 243.41<br />
12/09 206.70 -17.05 227.72 249.21 $208.11<br />
03/10 249.82 † 32.88 238.05 255.15 229.04<br />
06/10 237.57 † 5.41 248.86 261.23 252.07<br />
09/10 259.11 † 28.31 260.16 267.45 277.43<br />
12/10 305.63 † 47.86 271.97 273.83 305.33<br />
03/11 352.04 † 40.92 284.32 280.35 336.04<br />
Regression 24 pt. 12 pt.<br />
Avg Annual Percent Change Based on Best Fit: 19.43%<br />
9.88%<br />
†Adjusted Values<br />
6 pt.<br />
46.72%
Allst<strong>at</strong>e Indemnity Company<br />
Priv<strong>at</strong>e Passenger Auto<br />
<strong>Delaware</strong><br />
Loss Trends - Pure Premium<br />
Personal Injury Protection<br />
Exponential Curve of Best Fit<br />
Attachment III<br />
Exhibit 8.3<br />
Year Ending<br />
Actual Paid Pure<br />
Premium Annual Change 24 pt. 12 pt. 6 pt.<br />
06/05 $170.55 23.46 % $10.07<br />
09/05 177.86 39.65 11.36<br />
12/05 196.43 95.41 12.81<br />
03/06 100.68 -40.31 14.44<br />
06/06 88.44 -48.14 16.28<br />
09/06 78.51 -55.86 18.36<br />
12/06 81.29 -58.62 20.71<br />
03/07 45.38 -54.93 23.35<br />
06/07 -5.08 -105.74 26.33<br />
09/07 -15.18 -119.34 29.69<br />
12/07 14.63 -82.00 33.47<br />
03/08 68.01 49.87 37.75<br />
06/08 89.71 -1,865.94 42.56 $93.27<br />
09/08 102.40 -774.57 47.99 105.94<br />
12/08 130.18 789.82 54.12 120.32<br />
03/09 102.44 50.62 61.02 136.66<br />
06/09 177.18 97.50 68.81 155.21<br />
09/09 179.98 75.76 77.59 176.28<br />
12/09 150.84 15.87 87.49 200.22 $235.66<br />
03/10 349.58 † 241.25 98.65 227.40 252.93<br />
06/10 330.26 † 86.40 111.24 258.27 271.47<br />
09/10 354.38 † 96.90 125.44 293.34 291.36<br />
12/10 299.46 † 98.53 141.44 333.17 312.72<br />
03/11 267.75 † -23.41 159.49 378.40 335.63<br />
Regression 24 pt. 12 pt.<br />
Avg Annual Percent Change Based on Best Fit: 61.67%<br />
66.40%<br />
†Adjusted Values<br />
6 pt.<br />
32.70%
Allst<strong>at</strong>e Indemnity Company<br />
Priv<strong>at</strong>e Passenger Auto<br />
<strong>Delaware</strong><br />
Loss Trends - Pure Premium<br />
Uninsured / Underinsured Motorist<br />
Exponential Curve of Best Fit<br />
Attachment III<br />
Exhibit 8.4<br />
Year Ending<br />
Actual Paid Pure<br />
Premium Annual Change 24 pt. 12 pt. 6 pt.<br />
06/05 $6.69 -85.52 % $11.35<br />
09/05 9.70 -78.53 11.51<br />
12/05 12.44 -32.17 11.67<br />
03/06 21.76 818.14 11.82<br />
06/06 19.48 191.18 11.98<br />
09/06 18.01 85.67 12.15<br />
12/06 12.78 2.73 12.31<br />
03/07 4.75 -78.17 12.48<br />
06/07 7.17 -63.19 12.65<br />
09/07 6.01 -66.63 12.82<br />
12/07 22.62 77.00 13.00<br />
03/08 23.03 384.84 13.17<br />
06/08 24.20 237.52 13.35 $16.28<br />
09/08 26.56 341.93 13.54 15.98<br />
12/08 11.54 -48.98 13.72 15.70<br />
03/09 9.47 -58.88 13.91 15.42<br />
06/09 13.39 -44.67 14.10 15.14<br />
09/09 16.59 -37.54 14.29 14.87<br />
12/09 10.52 -8.84 14.48 14.60 $10.30<br />
03/10 12.76 34.74 14.68 14.34 11.56<br />
06/10 11.97 -10.60 14.88 14.08 12.97<br />
09/10 12.50 -24.65 15.08 13.83 14.55<br />
12/10 17.03 61.88 15.29 13.58 16.32<br />
03/11 19.62 53.76 15.50 13.34 18.31<br />
Regression 24 pt. 12 pt.<br />
Avg Annual Percent Change Based on Best Fit: 5.56%<br />
-6.98%<br />
6 pt.<br />
58.42%
Allst<strong>at</strong>e Indemnity Company<br />
Priv<strong>at</strong>e Passenger Auto<br />
<strong>Delaware</strong><br />
Loss Trends - Pure Premium<br />
Collision<br />
Exponential Curve of Best Fit<br />
Attachment III<br />
Exhibit 8.5<br />
Year Ending<br />
Actual Paid Pure<br />
Premium Annual Change 24 pt. 12 pt. 6 pt.<br />
06/05 $296.97 -1.42 % $203.63<br />
09/05 304.77 26.74 209.33<br />
12/05 259.74 -14.02 215.20<br />
03/06 256.89 -13.60 221.24<br />
06/06 300.85 1.31 227.44<br />
09/06 249.26 -18.21 233.81<br />
12/06 218.71 -15.80 240.37<br />
03/07 166.92 -35.02 247.11<br />
06/07 134.56 -55.27 254.04<br />
09/07 143.89 -42.27 261.16<br />
12/07 173.16 -20.83 268.48<br />
03/08 251.61 50.74 276.00<br />
06/08 298.97 122.18 283.74 $278.40<br />
09/08 319.26 121.88 291.70 290.77<br />
12/08 282.75 63.29 299.87 303.68<br />
03/09 318.17 26.45 308.28 317.17<br />
06/09 316.91 6.00 316.92 331.25<br />
09/09 296.98 -6.98 325.81 345.96<br />
12/09 387.27 36.97 334.94 361.33 $360.85<br />
03/10 344.36 † 8.23 344.33 377.38 379.61<br />
06/10 374.53 † 18.18 353.98 394.14 399.34<br />
09/10 480.17 † 61.68 363.91 411.64 420.10<br />
12/10 425.32 † 9.83 374.11 429.92 441.95<br />
03/11 462.90 † 34.42 384.60 449.01 464.92<br />
Regression 24 pt. 12 pt.<br />
Avg Annual Percent Change Based on Best Fit: 11.69%<br />
18.98%<br />
†Adjusted Values<br />
6 pt.<br />
22.47%
Allst<strong>at</strong>e Indemnity Company<br />
Priv<strong>at</strong>e Passenger Auto<br />
<strong>Delaware</strong><br />
Loss Trends - Pure Premium<br />
Comprehensive<br />
Exponential Curve of Best Fit<br />
Attachment III<br />
Exhibit 8.6<br />
Year Ending<br />
Actual Paid Pure<br />
Premium Annual Change 24 pt. 12 pt. 6 pt.<br />
06/05 $44.93 -45.05 % $66.74<br />
09/05 70.03 0.70 65.73<br />
12/05 62.14 44.65 64.74<br />
03/06 50.65 3.16 63.76<br />
06/06 77.21 71.85 62.80<br />
09/06 56.81 -18.88 61.85<br />
12/06 63.59 2.33 60.91<br />
03/07 63.19 24.76 59.99<br />
06/07 41.63 -46.08 59.08<br />
09/07 45.02 -20.75 58.19<br />
12/07 62.98 -0.96 57.31<br />
03/08 79.65 26.05 56.44<br />
06/08 72.67 74.56 55.59 $84.37<br />
09/08 79.43 76.43 54.75 77.67<br />
12/08 51.60 -18.07 53.92 71.51<br />
03/09 45.51 -42.86 53.11 65.83<br />
06/09 62.69 -13.73 52.30 60.61<br />
09/09 55.74 -29.83 51.51 55.80<br />
12/09 119.37 131.34 50.73 51.37 $121.50<br />
03/10 83.53 † 83.54 49.97 47.30 83.56<br />
06/10 65.15 † 3.92 49.21 43.54 57.47<br />
09/10 82.61 † 48.21 48.47 40.09 39.52<br />
12/10 4.67 † -96.09 47.73 36.91 27.18<br />
03/11 46.74 -44.04 47.01 33.98 18.69<br />
Regression 24 pt. 12 pt.<br />
Avg Annual Percent Change Based on Best Fit: -5.91%<br />
-28.16%<br />
†Adjusted Values<br />
6 pt.<br />
-77.63%
Allst<strong>at</strong>e Indemnity<br />
Year Ending<br />
Allst<strong>at</strong>e Indemnity Company<br />
Priv<strong>at</strong>e Passenger Auto<br />
<strong>Delaware</strong><br />
Loss Trends - Frequency<br />
Bodily Injury<br />
Attachment III<br />
Exhibit 8.7<br />
Exponential Curve of Best Fit<br />
Actual Paid<br />
Frequency Annual Change 24 pt. 12 pt. 6 pt.<br />
06/05 2.4796 % 19.33 % 2.1017 %<br />
09/05 2.8064 49.50 2.1419<br />
12/05 2.4981 3.82 2.1830<br />
03/06 2.3083 -8.60 2.2248<br />
06/06 2.5170 1.51 2.2675<br />
09/06 2.3628 -15.81 2.3109<br />
12/06 1.7890 -28.39 2.3552<br />
03/07 1.8299 -20.73 2.4003<br />
06/07 1.8535 -26.36 2.4463<br />
09/07 1.7396 -26.38 2.4932<br />
12/07 3.0824 72.30 2.5410<br />
03/08 3.7619 105.58 2.5897<br />
06/08 3.1045 67.49 2.6393 2.2556 %<br />
09/08 2.9002 66.72 2.6899 2.3613<br />
12/08 1.9329 -37.29 2.7415 2.4719<br />
03/09 1.7702 -52.94 2.7940 2.5877<br />
06/09 2.7104 -12.69 2.8476 2.7089<br />
09/09 2.7281 -5.93 2.9021 2.8358<br />
12/09 2.6247 35.79 2.9578 2.9687 2.8544 %<br />
03/10 3.2265 † 82.27 3.0144 3.1077 3.0636<br />
06/10 3.3972 † 25.34 3.0722 3.2533 3.2882<br />
09/10 3.7416 † 37.15 3.1311 3.4057 3.5292<br />
12/10 3.7783 † 43.95 3.1911 3.5652 3.7879<br />
03/11 3.8424 † 19.09 3.2523 3.7323 4.0655<br />
Regression 24 pt. 12 pt. 6 pt.<br />
Avg Annual Percent Change Based on Best Fit: 7.89%<br />
20.10% 32.70%<br />
†Adjusted Values
Allst<strong>at</strong>e Indemnity<br />
Year Ending<br />
Allst<strong>at</strong>e Indemnity Company<br />
Priv<strong>at</strong>e Passenger Auto<br />
<strong>Delaware</strong><br />
Loss Trends - Frequency<br />
Property Damage<br />
Exponential Curve of Best Fit<br />
Actual Paid<br />
Frequency Annual Change 24 pt. 12 pt.<br />
Attachment III<br />
Exhibit 8.8<br />
06/05 5.0705 % 9.42 % 4.6291 %<br />
09/05 5.3246 19.14 4.7643<br />
12/05 5.7838 15.35 4.9035<br />
03/06 5.7715 26.91 5.0468<br />
06/06 5.9127 16.61 5.1942<br />
09/06 5.4213 1.82 5.3460<br />
12/06 4.4941 -22.30 5.5021<br />
03/07 4.7140 -18.32 5.6629<br />
06/07 4.0487 -31.53 5.8283<br />
09/07 3.5753 -34.05 5.9986<br />
12/07 6.1203 36.19 6.1739<br />
03/08 7.4449 57.93 6.3542<br />
06/08 8.4640 109.05 6.5399 7.1490 %<br />
09/08 9.7863 173.72 6.7309 7.2918<br />
12/08 6.5080 6.33 6.9276 7.4373<br />
03/09 5.9757 -19.73 7.1300 7.5858<br />
06/09 6.9967 -17.34 7.3383 7.7372<br />
09/09 6.9875 -28.60 7.5526 7.8917<br />
12/09 7.4950 15.17 7.7733 8.0492 7.5692 %<br />
03/10 8.4843 † 41.98 8.0004 8.2099 7.9821<br />
06/10 8.1498 † 16.48 8.2341 8.3738 8.4175<br />
09/10 8.3490 † 19.48 8.4747 8.5410 8.8767<br />
12/10 9.5954 † 28.02 8.7223 8.7115 9.3609<br />
03/11 10.0478 † 18.43 8.9771 8.8854 9.8715<br />
Regression 24 pt. 12 pt. 6 pt.<br />
Avg Annual Percent Change Based on Best Fit: 12.21%<br />
8.23% 23.67%<br />
†Adjusted Values<br />
6 pt.
Allst<strong>at</strong>e Indemnity<br />
Year Ending<br />
Allst<strong>at</strong>e Indemnity Company<br />
Priv<strong>at</strong>e Passenger Auto<br />
<strong>Delaware</strong><br />
Loss Trends - Frequency<br />
Personal Injury Protection<br />
Exponential Curve of Best Fit<br />
Actual Paid<br />
Frequency Annual Change 24 pt. 12 pt.<br />
Attachment III<br />
Exhibit 8.9<br />
06/05 .9169 % -59.62 % 1.0323 %<br />
09/05 1.5625 -13.29 1.0881<br />
12/05 2.2391 76.11 1.1469<br />
03/06 2.6257 374.64 1.2090<br />
06/06 2.6666 190.83 1.2743<br />
09/06 1.7378 11.22 1.3432<br />
12/06 1.0769 -51.90 1.4159<br />
03/07 .9296 -64.60 1.4925<br />
06/07 .4222 -84.17 1.5732<br />
09/07 .7138 -58.93 1.6582<br />
12/07 1.2718 18.10 1.7479<br />
03/08 1.5471 66.43 1.8424<br />
06/08 1.9279 356.63 1.9421 1.5506 %<br />
09/08 2.2033 208.67 2.0471 1.7213<br />
12/08 1.9083 50.05 2.1578 1.9107<br />
03/09 1.7703 14.43 2.2745 2.1210<br />
06/09 1.5052 -21.93 2.3975 2.3545<br />
09/09 2.2583 2.50 2.5271 2.6136<br />
12/09 2.2620 18.53 2.6638 2.9013 2.9796 %<br />
03/10 3.7303 † 110.72 2.8079 3.2206 3.3410<br />
06/10 5.0157 † 233.22 2.9597 3.5751 3.7462<br />
09/10 4.2844 † 89.72 3.1198 3.9686 4.2006<br />
12/10 4.8146 † 112.85 3.2885 4.4053 4.7101<br />
03/11 4.4639 † 19.67 3.4663 4.8902 5.2814<br />
Regression 24 pt. 12 pt. 6 pt.<br />
Avg Annual Percent Change Based on Best Fit: 23.45%<br />
51.84% 58.08%<br />
†Adjusted Values<br />
6 pt.
Allst<strong>at</strong>e Indemnity<br />
Year Ending<br />
Allst<strong>at</strong>e Indemnity Company<br />
Priv<strong>at</strong>e Passenger Auto<br />
<strong>Delaware</strong><br />
Loss Trends - Frequency<br />
Uninsured / Underinsured Motorist<br />
Exponential Curve of Best Fit<br />
Actual Paid<br />
Frequency Annual Change 24 pt. 12 pt.<br />
Attachment III<br />
Exhibit 8.10<br />
06/05 1.1626 % -44.47 % 1.1593 %<br />
09/05 1.2423 -34.48 1.1744<br />
12/05 1.4704 12.86 1.1897<br />
03/06 1.3473 15.62 1.2052<br />
06/06 1.1250 -3.23 1.2209<br />
09/06 1.1621 -6.46 1.2368<br />
12/06 .8126 -44.74 1.2529<br />
03/07 1.0471 -22.28 1.2692<br />
06/07 1.7834 58.52 1.2858<br />
09/07 1.5776 35.75 1.3025<br />
12/07 1.9944 145.43 1.3195<br />
03/08 1.5316 46.27 1.3367<br />
06/08 .7582 -57.49 1.3541 1.0269 %<br />
09/08 1.0360 -34.33 1.3717 1.0827<br />
12/08 1.4099 -29.31 1.3896 1.1415<br />
03/09 1.3356 -12.80 1.4077 1.2036<br />
06/09 1.6558 118.39 1.4260 1.2689<br />
09/09 1.8005 73.79 1.4446 1.3379<br />
12/09 1.0506 -25.48 1.4634 1.4106 1.0766 %<br />
03/10 1.3295 -0.46 1.4824 1.4872 1.2206<br />
06/10 1.2369 -25.30 1.5018 1.5680 1.3840<br />
09/10 1.6484 -8.45 1.5213 1.6532 1.5692<br />
12/10 1.8133 72.60 1.5411 1.7430 1.7792<br />
03/11 1.9836 49.20 1.5612 1.8377 2.0173<br />
Regression 24 pt. 12 pt. 6 pt.<br />
Avg Annual Percent Change Based on Best Fit: 5.31%<br />
23.57% 65.27%<br />
6 pt.
Allst<strong>at</strong>e Indemnity<br />
Year Ending<br />
Allst<strong>at</strong>e Indemnity Company<br />
Priv<strong>at</strong>e Passenger Auto<br />
<strong>Delaware</strong><br />
Loss Trends - Frequency<br />
Collision<br />
Attachment III<br />
Exhibit 8.11<br />
Exponential Curve of Best Fit<br />
Actual Paid<br />
Frequency Annual Change 24 pt. 12 pt. 6 pt.<br />
06/05 8.6716 % -7.49 % 6.6165 %<br />
09/05 9.7882 16.47 6.7810<br />
12/05 10.2977 19.18 6.9496<br />
03/06 9.0678 3.83 7.1223<br />
06/06 10.1421 16.96 7.2994<br />
09/06 7.6143 -22.21 7.4808<br />
12/06 5.5369 -46.23 7.6668<br />
03/07 4.5330 -50.01 7.8574<br />
06/07 4.5218 -55.42 8.0527<br />
09/07 4.4438 -41.64 8.2529<br />
12/07 6.1060 10.28 8.4580<br />
03/08 7.1725 58.23 8.6683<br />
06/08 8.5182 88.38 8.8838 9.2277 %<br />
09/08 10.3504 132.92 9.1046 9.5308<br />
12/08 10.1973 67.00 9.3309 9.8438<br />
03/09 10.8798 51.69 9.5629 10.1671<br />
06/09 11.4518 34.44 9.8006 10.5011<br />
09/09 10.4442 0.91 10.0442 10.8460<br />
12/09 10.1749 -0.22 10.2939 11.2022 9.7405 %<br />
03/10 10.4198 † -4.23 10.5498 11.5701 10.5301<br />
06/10 10.1526 † -11.34 10.8121 11.9501 11.3837<br />
09/10 13.2365 † 26.74 11.0809 12.3426 12.3066<br />
12/10 13.5954 † 33.62 11.3563 12.7480 13.3042<br />
03/11 14.1950 † 36.23 11.6386 13.1667 14.3827<br />
Regression 24 pt. 12 pt. 6 pt.<br />
Avg Annual Percent Change Based on Best Fit: 10.32%<br />
13.80% 36.59%<br />
†Adjusted Values
Allst<strong>at</strong>e Indemnity<br />
Year Ending<br />
Allst<strong>at</strong>e Indemnity Company<br />
Priv<strong>at</strong>e Passenger Auto<br />
<strong>Delaware</strong><br />
Loss Trends - Frequency<br />
Comprehensive<br />
Exponential Curve of Best Fit<br />
Attachment III<br />
Exhibit 8.12<br />
06/05 5.5847 % -9.20 % 4.7932 %<br />
09/05 6.3353 15.68 4.8554<br />
12/05 5.6278 -1.31 4.9185<br />
03/06 4.6888 -22.04 4.9824<br />
06/06 5.8606 4.94 5.0471<br />
09/06 4.9711 -21.53 5.1126<br />
12/06 4.4291 -21.30 5.1790<br />
03/07 3.7024 -21.04 5.2462<br />
06/07 3.6462 -37.78 5.3144<br />
09/07 3.6554 -26.47 5.3834<br />
12/07 3.5305 -20.29 5.4533<br />
03/08 6.2095 67.72 5.5241<br />
06/08 6.0671 66.40 5.5958 7.3238 %<br />
09/08 7.5270 105.91 5.6685 7.1695<br />
12/08 8.9062 152.26 5.7421 7.0184<br />
03/09 6.8608 10.49 5.8167 6.8706<br />
06/09 7.9365 30.81 5.8922 6.7258<br />
09/09 6.7839 -9.87 5.9687 6.5841<br />
12/09 5.5617 -37.55 6.0462 6.4454 5.2050 %<br />
03/10 5.5446 † -19.18 6.1248 6.3096 5.4429<br />
06/10 4.8181 † -39.29 6.2043 6.1767 5.6918<br />
09/10 6.3526 † -6.36 6.2849 6.0466 5.9520<br />
12/10 6.0051 † 7.97 6.3665 5.9192 6.2241<br />
03/11 6.8596 23.72 6.4492 5.7945 6.5086<br />
Avg Annual Percent Change Based on Best Fit:<br />
†Adjusted Values<br />
Actual Paid<br />
Frequency Annual Change 24 pt. 12 pt.<br />
Regression 24 pt. 12 pt. 6 pt.<br />
5.30%<br />
-8.16%<br />
6 pt.<br />
19.58%
Allst<strong>at</strong>e Indemnity<br />
Allst<strong>at</strong>e Indemnity Company<br />
Priv<strong>at</strong>e Passenger Auto<br />
<strong>Delaware</strong><br />
Loss Trends - Severity<br />
Bodily Injury<br />
Exponential Curve of Best Fit<br />
Attachment III<br />
Exhibit 8.13<br />
Year Ending<br />
Actual Paid<br />
Severity Annual Change 24 pt. 12 pt. 6 pt.<br />
06/05 $8,639.00 -25.71 % $7,830.00<br />
09/05 6,336.00 -47.93 7,723.00<br />
12/05 7,007.00 -28.46 7,617.00<br />
03/06 7,388.00 -16.39 7,513.00<br />
06/06 6,745.00 -21.92 7,411.00<br />
09/06 8,836.00 39.46 7,310.00<br />
12/06 9,676.00 38.09 7,210.00<br />
03/07 11,239.00 52.13 7,112.00<br />
06/07 8,734.00 29.49 7,015.00<br />
09/07 8,355.00 -5.44 6,919.00<br />
12/07 5,375.00 -44.45 6,824.00<br />
03/08 4,737.00 -57.85 6,731.00<br />
06/08 5,587.00 -36.03 6,639.00 $5,107.00<br />
09/08 5,295.00 -36.62 6,549.00 5,246.00<br />
12/08 6,377.00 18.64 6,459.00 5,389.00<br />
03/09 5,002.00 5.59 6,371.00 5,536.00<br />
06/09 4,077.00 -27.03 6,284.00 5,688.00<br />
09/09 6,265.00 18.32 6,199.00 5,843.00<br />
12/09 5,897.00 -7.53 6,114.00 6,002.00 $6,001.00<br />
03/10 6,197.00 † 23.89 6,030.00 6,166.00 6,205.00<br />
06/10 7,305.00 † 79.18 5,948.00 6,335.00 6,417.00<br />
09/10 5,970.00 † -4.71 5,867.00 6,507.00 6,636.00<br />
12/10 6,301.00 † 6.85 5,787.00 6,685.00 6,862.00<br />
03/11 7,687.00 † 24.04 5,708.00 6,868.00 7,096.00<br />
Regression 24 pt. 12 pt.<br />
Avg Annual Percent Change Based on Best Fit: -5.35%<br />
11.38%<br />
†Adjusted Values<br />
6 pt.<br />
14.35%
Allst<strong>at</strong>e Indemnity<br />
Allst<strong>at</strong>e Indemnity Company<br />
Priv<strong>at</strong>e Passenger Auto<br />
<strong>Delaware</strong><br />
Loss Trends - Severity<br />
Property Damage<br />
Exponential Curve of Best Fit<br />
Attachment III<br />
Exhibit 8.14<br />
Year Ending<br />
Actual Paid<br />
Severity Annual Change 24 pt. 12 pt. 6 pt.<br />
06/05 $2,631.00 -6.93 % $2,212.00<br />
09/05 2,701.00 -10.38 2,247.00<br />
12/05 2,913.00 14.28 2,282.00<br />
03/06 2,911.00 14.38 2,318.00<br />
06/06 2,513.00 -4.48 2,355.00<br />
09/06 2,193.00 -18.81 2,392.00<br />
12/06 1,922.00 -34.02 2,429.00<br />
03/07 1,676.00 -42.43 2,468.00<br />
06/07 1,695.00 -32.55 2,506.00<br />
09/07 2,073.00 -5.47 2,546.00<br />
12/07 1,895.00 -1.40 2,586.00<br />
03/08 2,591.00 54.59 2,626.00<br />
06/08 2,688.00 58.58 2,668.00 $3,027.00<br />
09/08 3,069.00 48.05 2,710.00 3,038.00<br />
12/08 3,829.00 102.06 2,752.00 3,050.00<br />
03/09 3,146.00 21.42 2,796.00 3,061.00<br />
06/09 3,221.00 19.83 2,839.00 3,073.00<br />
09/09 2,890.00 -5.83 2,884.00 3,084.00<br />
12/09 2,758.00 -27.97 2,929.00 3,096.00 $2,750.00<br />
03/10 2,945.00 † -6.39 2,976.00 3,108.00 2,870.00<br />
06/10 2,915.00 † -9.50 3,022.00 3,120.00 2,995.00<br />
09/10 3,103.00 † 7.37 3,070.00 3,131.00 3,125.00<br />
12/10 3,185.00 † 15.48 3,118.00 3,143.00 3,262.00<br />
03/11 3,504.00 † 18.98 3,167.00 3,155.00 3,404.00<br />
Regression 24 pt. 12 pt.<br />
Avg Annual Percent Change Based on Best Fit: 6.44%<br />
1.52%<br />
†Adjusted Values<br />
6 pt.<br />
18.63%
Allst<strong>at</strong>e Indemnity<br />
Allst<strong>at</strong>e Indemnity Company<br />
Priv<strong>at</strong>e Passenger Auto<br />
<strong>Delaware</strong><br />
Loss Trends - Severity<br />
Personal Injury Protection<br />
Exponential Curve of Best Fit<br />
Attachment III<br />
Exhibit 8.15<br />
Year Ending<br />
Actual Paid<br />
Severity Annual Change 24 pt. 12 pt. 6 pt.<br />
06/05 $18,600.00 205.72 % $462.00<br />
09/05 11,383.00 61.05 507.00<br />
12/05 8,773.00 10.95 558.00<br />
03/06 3,834.00 -87.42 613.00<br />
06/06 3,316.00 -82.17 674.00<br />
09/06 4,518.00 -60.31 741.00<br />
12/06 7,548.00 -13.96 815.00<br />
03/07 4,882.00 27.33 896.00<br />
06/07 -1,203.00 -136.28 985.00<br />
09/07 -2,126.00 -147.06 1,083.00<br />
12/07 1,151.00 -84.75 1,191.00<br />
03/08 4,396.00 -9.95 1,310.00<br />
06/08 4,653.00 -486.78 1,440.00 $6,015.00<br />
09/08 4,647.00 -318.58 1,583.00 6,154.00<br />
12/08 6,822.00 492.70 1,741.00 6,297.00<br />
03/09 5,787.00 31.64 1,914.00 6,443.00<br />
06/09 11,771.00 152.98 2,104.00 6,592.00<br />
09/09 7,970.00 71.51 2,313.00 6,745.00<br />
12/09 6,669.00 -2.24 2,543.00 6,901.00 $7,909.00<br />
03/10 9,371.00 † 61.93 2,796.00 7,061.00 7,570.00<br />
06/10 6,584.00 † -44.07 3,074.00 7,224.00 7,246.00<br />
09/10 8,271.00 † 3.78 3,380.00 7,392.00 6,936.00<br />
12/10 6,220.00 † -6.73 3,716.00 7,563.00 6,639.00<br />
03/11 5,998.00 † -35.99 4,086.00 7,738.00 6,355.00<br />
Regression 24 pt. 12 pt.<br />
Avg Annual Percent Change Based on Best Fit: 46.12%<br />
9.59%<br />
†Adjusted Values<br />
6 pt.<br />
-16.06%
Allst<strong>at</strong>e Indemnity<br />
Allst<strong>at</strong>e Indemnity Company<br />
Priv<strong>at</strong>e Passenger Auto<br />
<strong>Delaware</strong><br />
Loss Trends - Severity<br />
Uninsured / Underinsured Motorist<br />
Exponential Curve of Best Fit<br />
Attachment III<br />
Exhibit 8.16<br />
Year Ending<br />
Actual Paid<br />
Severity Annual Change 24 pt. 12 pt. 6 pt.<br />
06/05 $575.00 -73.93 % $979.00<br />
09/05 781.00 -67.23 980.00<br />
12/05 846.00 -39.87 981.00<br />
03/06 1,615.00 695.57 981.00<br />
06/06 1,732.00 201.22 982.00<br />
09/06 1,550.00 98.46 982.00<br />
12/06 1,573.00 85.93 983.00<br />
03/07 454.00 -71.89 983.00<br />
06/07 402.00 -76.79 984.00<br />
09/07 381.00 -75.42 984.00<br />
12/07 1,134.00 -27.91 985.00<br />
03/08 1,503.00 231.06 986.00<br />
06/08 3,191.00 693.78 986.00 $1,585.00<br />
09/08 2,563.00 572.70 987.00 1,476.00<br />
12/08 818.00 -27.87 987.00 1,375.00<br />
03/09 709.00 -52.83 988.00 1,281.00<br />
06/09 809.00 -74.65 988.00 1,193.00<br />
09/09 921.00 -64.07 989.00 1,111.00<br />
12/09 1,002.00 22.49 990.00 1,035.00 $957.00<br />
03/10 960.00 35.40 990.00 964.00 947.00<br />
06/10 967.00 19.53 991.00 898.00 937.00<br />
09/10 758.00 -17.70 991.00 836.00 927.00<br />
12/10 939.00 -6.29 992.00 779.00 917.00<br />
03/11 989.00 3.02 992.00 726.00 907.00<br />
Regression 24 pt. 12 pt.<br />
Avg Annual Percent Change Based on Best Fit: 0.23%<br />
-24.72%<br />
6 pt.<br />
-4.20%
Allst<strong>at</strong>e Indemnity<br />
Allst<strong>at</strong>e Indemnity Company<br />
Priv<strong>at</strong>e Passenger Auto<br />
<strong>Delaware</strong><br />
Loss Trends - Severity<br />
Collision<br />
Exponential Curve of Best Fit<br />
Attachment III<br />
Exhibit 8.17<br />
Year Ending<br />
Actual Paid<br />
Severity Annual Change 24 pt. 12 pt. 6 pt.<br />
06/05 $3,425.00 6.57 % $3,078.00<br />
09/05 3,114.00 8.84 3,087.00<br />
12/05 2,522.00 -27.86 3,097.00<br />
03/06 2,833.00 -16.77 3,106.00<br />
06/06 2,966.00 -13.40 3,116.00<br />
09/06 3,274.00 5.14 3,126.00<br />
12/06 3,950.00 56.62 3,135.00<br />
03/07 3,682.00 29.97 3,145.00<br />
06/07 2,976.00 0.34 3,155.00<br />
09/07 3,238.00 -1.10 3,164.00<br />
12/07 2,836.00 -28.20 3,174.00<br />
03/08 3,508.00 -4.73 3,184.00<br />
06/08 3,510.00 17.94 3,194.00 $3,017.00<br />
09/08 3,085.00 -4.73 3,204.00 3,051.00<br />
12/08 2,773.00 -2.22 3,214.00 3,085.00<br />
03/09 2,924.00 -16.65 3,224.00 3,120.00<br />
06/09 2,767.00 -21.17 3,234.00 3,155.00<br />
09/09 2,844.00 -7.81 3,244.00 3,190.00<br />
12/09 3,806.00 37.25 3,254.00 3,226.00 $3,705.00<br />
03/10 3,305.00 † 13.03 3,264.00 3,262.00 3,605.00<br />
06/10 3,689.00 † 33.32 3,274.00 3,298.00 3,508.00<br />
09/10 3,628.00 † 27.57 3,284.00 3,335.00 3,414.00<br />
12/10 3,128.00 † -17.81 3,294.00 3,372.00 3,322.00<br />
03/11 3,261.00 † -1.33 3,305.00 3,410.00 3,232.00<br />
Regression 24 pt. 12 pt.<br />
Avg Annual Percent Change Based on Best Fit: 1.24%<br />
4.55%<br />
†Adjusted Values<br />
6 pt.<br />
-10.33%
Allst<strong>at</strong>e Indemnity<br />
Allst<strong>at</strong>e Indemnity Company<br />
Priv<strong>at</strong>e Passenger Auto<br />
<strong>Delaware</strong><br />
Loss Trends - Severity<br />
Comprehensive<br />
Exponential Curve of Best Fit<br />
Attachment III<br />
Exhibit 8.18<br />
Year Ending<br />
Actual Paid<br />
Severity Annual Change 24 pt. 12 pt. 6 pt.<br />
06/05 $804.00 -39.50 % $1,392.00<br />
09/05 1,105.00 -12.99 1,353.00<br />
12/05 1,104.00 46.61 1,316.00<br />
03/06 1,080.00 32.35 1,279.00<br />
06/06 1,317.00 63.81 1,244.00<br />
09/06 1,143.00 3.44 1,210.00<br />
12/06 1,436.00 30.07 1,176.00<br />
03/07 1,707.00 58.06 1,143.00<br />
06/07 1,142.00 -13.29 1,112.00<br />
09/07 1,232.00 7.79 1,081.00<br />
12/07 1,784.00 24.23 1,051.00<br />
03/08 1,283.00 -24.84 1,022.00<br />
06/08 1,198.00 4.90 993.00 $1,152.00<br />
09/08 1,055.00 -14.37 966.00 1,083.00<br />
12/08 579.00 -67.54 939.00 1,019.00<br />
03/09 663.00 -48.32 913.00 958.00<br />
06/09 790.00 -34.06 888.00 901.00<br />
09/09 822.00 -22.09 863.00 848.00<br />
12/09 2,146.00 270.64 839.00 797.00 $2,334.00<br />
03/10 1,507.00 127.30 816.00 750.00 1,535.00<br />
06/10 1,352.00 † 71.14 793.00 705.00 1,010.00<br />
09/10 1,300.00 † 58.15 771.00 663.00 664.00<br />
12/10 78.00 † -96.37 750.00 624.00 437.00<br />
03/11 681.00 -54.81 729.00 587.00 287.00<br />
Regression 24 pt. 12 pt.<br />
Avg Annual Percent Change Based on Best Fit: -10.63%<br />
-21.75%<br />
†Adjusted Values<br />
6 pt.<br />
-81.28%
Allst<strong>at</strong>e <strong>Insurance</strong> Group<br />
Priv<strong>at</strong>e Passenger Auto<br />
<strong>Delaware</strong><br />
C<strong>at</strong>astrophe <strong>Insurance</strong> Losses<br />
Comprehensive<br />
DE AIC+AI+AP&C<br />
Incurred Losses<br />
Calendar Year Total Incurred Losses C<strong>at</strong>astrophe Losses Excluding C<strong>at</strong>astrophes<br />
1986 $917,225 $0 $917,225<br />
1987 866,257 834 865,423<br />
1988 856,731 4,851 851,880<br />
1989 1,111,907 753 1,111,154<br />
1990 937,870 5,068 932,802<br />
1991 970,602 -2,894 973,496<br />
1992 685,750 44,765 640,985<br />
1993 1,036,718 -3,311 1,040,029<br />
1994 1,067,749 58,619 1,009,130<br />
1995 998,297 10,803 987,494<br />
1996 1,470,360 9,465 1,460,895<br />
1997 1,496,149 9,239 1,486,910<br />
1998 1,259,919 21,183 1,238,736<br />
1999 1,316,110 103,725 1,212,385<br />
2000 1,117,052 2,132 1,114,920<br />
2001 1,183,944 2,390 1,181,554<br />
2002 1,125,716 10,559 1,115,157<br />
2003 1,162,977 49,495 1,113,482<br />
2004 1,032,746 -17,786 1,050,532<br />
2005 738,133 4,817 733,316<br />
2006 952,485 102,114 850,371<br />
2007 863,076 -5,955 869,031<br />
2008 1,012,531 132,329 880,202<br />
2009 1,059,651 205,531 854,120<br />
2010 853,409 -31,540 884,949<br />
$717,186 $25,376,178<br />
25 Year Aggreg<strong>at</strong>e Average<br />
Selected C<strong>at</strong>astrophe Provision<br />
Attachment III<br />
Exhibit 9<br />
Percentage C<strong>at</strong>astrophe<br />
Losses<br />
2.8 %<br />
2.8 %
Allst<strong>at</strong>e Indemnity Company<br />
Priv<strong>at</strong>e Passenger Auto<br />
<strong>Delaware</strong><br />
Summary of Expense Provisions<br />
Attachment III<br />
Exhibit 10<br />
Personal Injury Uninsured /<br />
Percent Fixed Bodily Injury Property Damage Protection Underinsured Motorist<br />
Commissions 0% 7.6 % 7.6 % 7.6 % 7.6 %<br />
Taxes † 0 2.3 2.3 2.3 2.3<br />
Licenses and Fees 100 0.1 0.1 0.1 0.1<br />
Other Acquisition 100 4.7 4.7 4.7 4.7<br />
<strong>General</strong> Expense 100 4.8 4.8 4.8 4.8<br />
Debt Provision 0 1.3 1.3 1.3 1.3<br />
Profit Provision 0 9.3 9.3 9.3 9.3<br />
Percent Fixed Collision Comprehensive<br />
Commissions 0% 7.6 % 7.6 %<br />
Taxes † 0 2.2 2.2<br />
Licenses and Fees 100 0.1 0.1<br />
Other Acquisition 100 4.7 4.7<br />
<strong>General</strong> Expense 100 4.8 4.8<br />
Debt Provision 0 1.3 1.3<br />
Profit Provision 0 10.4 10.4<br />
† St<strong>at</strong>e Taxes - Does not include Federal Income Tax<br />
Liability Expense Provision<br />
Physical Damage Expense Provision
ALLSTATE INSURANCE GROUP*<br />
ALLSTATE INDEMNITY CO.<br />
PRIVATE PASSENGER AUTOMOBILE INSURANCE<br />
Countrywide Experience for Other Acquisition Expenses<br />
2007 2008 2009<br />
1. Direct Premium Earned Less Reinsurance Premium** $22,348,897 $22,179,653 $21,698,432<br />
2. Other Acquisition Expense Incurred 1,403,527 1,286,955 1,259,684<br />
3. R<strong>at</strong>io (2)/(1) 0.0628 0.0580 0.0581<br />
4. Three Year Average 0.060<br />
5. Adjusted Three Year Average*** 0.047<br />
6. Proposed Provision 0.047<br />
* Allst<strong>at</strong>e <strong>Insurance</strong> Company, Allst<strong>at</strong>e Property and Casualty <strong>Insurance</strong> Company, Allst<strong>at</strong>e Indemnity Company, Northbrook Indemnity Company, Allst<strong>at</strong>e Fire & Casualty<br />
<strong>Insurance</strong> Company and Allst<strong>at</strong>e County Mutual. D<strong>at</strong>a includes Personal Property Lines (excluding Earthquake) and Priv<strong>at</strong>e Passenger Autombobile <strong>Insurance</strong><br />
** Premiums for Net Cost of Reinsurance (NCOR) do not include provisions for Other Acquisition expenses. Therefore, direct premiums<br />
must be reduced by NCOR premiums to get the premium base upon which the other acquisition expense provision is applied.<br />
***Reduced by 1.27% to reflect the amount of Installment Fees collected for Allst<strong>at</strong>e <strong>Insurance</strong> Group and by 0.64% to reflect the amount of Policy Fees<br />
collected by Allst<strong>at</strong>e Indemnity Company. Includes a 0.65% provision for Allst<strong>at</strong>e Indemnity Company and Northbrook Indemnity Company premiums written off.<br />
(000 Omitted)<br />
Attachment III<br />
Exhibit 11
ALLSTATE INSURANCE GROUP*<br />
Countrywide Experience for <strong>General</strong> Expenses<br />
2007<br />
<strong>General</strong> Expense**<br />
2008 2009<br />
1. Direct Premium Earned Less Reinsurance Premium*** $22,348,897 $22,179,653 $21,698,432<br />
2. <strong>General</strong> Expense Incurred 1,037,950 1,103,876 1,011,399<br />
3. R<strong>at</strong>io (2)/(1) 0.0464 0.0498 0.0466<br />
4. Three Year Average 0.048<br />
5. Proposed Provision 0.048<br />
* Allst<strong>at</strong>e <strong>Insurance</strong> Company, Allst<strong>at</strong>e Property and Casualty <strong>Insurance</strong> Company, Allst<strong>at</strong>e Indemnity Company, Northbrook Indemnity<br />
Company, Allst<strong>at</strong>e Fire & Casualty <strong>Insurance</strong> Company and Allst<strong>at</strong>e County Mutual<br />
** D<strong>at</strong>a includes Personal Property Lines (excluding Earthquake) and Priv<strong>at</strong>e Passenger Automobile <strong>Insurance</strong><br />
*** Premiums for Net Cost of Reinsurance (NCOR) do not include provisions for <strong>General</strong> Expenses. Therefore, direct premiums must<br />
be reduced by NCOR premiums to get the premium base upon which the general expense provision is applied.<br />
(000's) omitted<br />
Attachment III<br />
Exhibit 12
1) Average Earned D<strong>at</strong>e of Experience Period<br />
2) Average Earned D<strong>at</strong>e of Proposed Policy Period<br />
3) Number of Years from (1) to (2)<br />
4) Selected Annual Impact<br />
Allst<strong>at</strong>e Indemnity Company<br />
Priv<strong>at</strong>e Passenger Auto<br />
<strong>Delaware</strong><br />
Factor to Adjust for Subsequent Change in Fixed Expense<br />
(For calendar years 2007-2009 )<br />
5) Factor to Adjust for Subsequent Change in Fixed Expense [ 1.0 + (4) ] ^ (3)<br />
Attachment III<br />
Exhibit 13<br />
6/30/2008<br />
10/21/2012<br />
4.310<br />
1.70%<br />
1.075
Allst<strong>at</strong>e Indemnity Company<br />
Priv<strong>at</strong>e Passenger Auto<br />
<strong>Delaware</strong><br />
Investment Income - Liability Coverages<br />
Calcul<strong>at</strong>ion of Present Value, as of the Average Earning D<strong>at</strong>e of a<br />
Policy Year, of all Income and Outgo @ 2.4% †force of interest,<br />
assuming an Oper<strong>at</strong>ing Profit of 7.10% and six month Policy Terms<br />
Cumul<strong>at</strong>ive<br />
Discounted‡ to<br />
Years From Start Percent of Yearly Percent Time from Start Average Time of Discounted<br />
of Policy Year Losses Paid of Losses Paid of Policy Year Profit @ 2.4% Payments<br />
1 37.7 % 37.70 % 0.69 1.001 37.7 %<br />
2 86.0 48.30 1.39 0.985 47.6<br />
3 103.2 17.20 2.45 0.960 16.5<br />
4 101.7 -1.50 3.47 0.937 -1.4<br />
5 100.9 -0.80 4.45 0.915 -0.7<br />
6 100.0 -0.90 5.44 0.894 -0.8<br />
Subsequent 100.0 0.00 7.46 0.851 0.0<br />
Total<br />
Expected Losses and Loss Expense R<strong>at</strong>io<br />
Present Value of Loss and Loss Expense Payments<br />
<strong>General</strong> Expense<br />
Other Acquisition<br />
Taxes<br />
Licenses and Fees<br />
Commissions<br />
Debt Provision<br />
Profit<br />
98.9 %<br />
69.9 %<br />
69.1 %<br />
4.8 % 0.63 1.003 4.8 %<br />
4.7 % 0.56 1.005 4.7 %<br />
2.3 % 0.52 1.006 2.3 %<br />
0.1 % 0.52 1.006 0.1 %<br />
7.6 % 0.58 1.004 7.6 %<br />
1.3 % 0.75 1.000 1.3 %<br />
9.3 % 0.75 1.000 9.3 %<br />
Total Present Value of Outgo<br />
99.2 %<br />
Premiums<br />
100.0 % 0.61 1.003 100.3 %<br />
Difference, Present Value of Income Less Present Value of Outgo<br />
1.1 %<br />
†Discount r<strong>at</strong>e from Investment Department forecast<br />
‡exp (force of interest x (timing of profit being earned – timing of cash flow))<br />
Attachment III<br />
Exhibit 14.1
Allst<strong>at</strong>e Indemnity Company<br />
Priv<strong>at</strong>e Passenger Auto<br />
<strong>Delaware</strong><br />
Investment Income - Physical Damage Coverages<br />
Calcul<strong>at</strong>ion of Present Value, as of the Average Earning D<strong>at</strong>e of a<br />
Policy Year, of all Income and Outgo @ 2.4% †force of interest,<br />
assuming an Oper<strong>at</strong>ing Profit of 7.10% and six month Policy Terms<br />
Cumul<strong>at</strong>ive<br />
Discounted‡ to<br />
Years From Start Percent of Yearly Percent Time from Start Average Time of Discounted<br />
of Policy Year Losses Paid of Losses Paid of Policy Year Profit @ 2.4% Payments<br />
1 70.9 % 70.90 % 0.63 1.003 71.1 %<br />
2 100.6 29.70 1.13 0.991 29.4<br />
3 100.1 -0.50 2.35 0.962 -0.5<br />
4 100.0 -0.10 3.98 0.925 -0.1<br />
5 100.0 0.00 4.11 0.923 0.0<br />
6 100.0 0.00 6.82 0.864 0.0<br />
Subsequent 100.0 0.00 7.63 0.848 0.0<br />
Total<br />
Expected Losses and Loss Expense R<strong>at</strong>io<br />
Present Value of Loss and Loss Expense Payments<br />
<strong>General</strong> Expense<br />
Other Acquisition<br />
Taxes<br />
Licenses and Fees<br />
Commissions<br />
Debt Provision<br />
Profit<br />
99.9 %<br />
68.9 %<br />
68.8 %<br />
4.8 % 0.63 1.003 4.8 %<br />
4.7 % 0.56 1.005 4.7 %<br />
2.2 % 0.52 1.006 2.2 %<br />
0.1 % 0.52 1.006 0.1 %<br />
7.6 % 0.58 1.004 7.6 %<br />
1.3 % 0.75 1.000 1.3 %<br />
10.4 % 0.75 1.000 10.4 %<br />
Total Present Value of Outgo<br />
99.9 %<br />
Premiums<br />
100.0 % 0.61 1.003 100.3 %<br />
Difference, Present Value of Income Less Present Value of Outgo<br />
0.4 %<br />
†Discount r<strong>at</strong>e from Investment Department forecast<br />
‡exp (force of interest x (timing of profit being earned – timing of cash flow))<br />
Attachment III<br />
Exhibit 14.2
Fiscal Year Ending<br />
(1)<br />
Earned Exposures<br />
(2)<br />
Earned Premium<br />
<strong>at</strong> Current R<strong>at</strong>es<br />
Allst<strong>at</strong>e Indemnity Company<br />
Priv<strong>at</strong>e Passenger Auto<br />
<strong>Delaware</strong><br />
Development of Projected Average Earned Premium<br />
Bodily Injury<br />
(3)<br />
Factor to Adjust to<br />
Projected Premium<br />
Level<br />
(4)<br />
Projected Earned<br />
Premium <strong>at</strong><br />
Current R<strong>at</strong>es<br />
(2) x (3)<br />
(5)<br />
Projected Average<br />
Earned Premium<br />
<strong>at</strong> Current R<strong>at</strong>es<br />
(4) / (1)<br />
12/31/2010 1,208 $627,218 1.000 $627,218 $519.22<br />
(7) Projected Average Earned Premium At Current R<strong>at</strong>es<br />
$519.22<br />
Attachment III<br />
Exhibit 15.1<br />
(6)<br />
Experience Year<br />
Weights<br />
100 %
Fiscal Year Ending<br />
(1)<br />
Earned Exposures<br />
(2)<br />
Earned Premium<br />
<strong>at</strong> Current R<strong>at</strong>es<br />
Allst<strong>at</strong>e Indemnity Company<br />
Priv<strong>at</strong>e Passenger Auto<br />
<strong>Delaware</strong><br />
Development of Projected Average Earned Premium<br />
Property Damage<br />
(3)<br />
Factor to Adjust to<br />
Projected Premium<br />
Level<br />
(4)<br />
Projected Earned<br />
Premium <strong>at</strong><br />
Current R<strong>at</strong>es<br />
(2) x (3)<br />
(5)<br />
Projected Average<br />
Earned Premium<br />
<strong>at</strong> Current R<strong>at</strong>es<br />
(4) / (1)<br />
12/31/2010 1,208 $339,156 1.000 $339,156 $280.76<br />
(7) Projected Average Earned Premium At Current R<strong>at</strong>es<br />
$280.76<br />
Attachment III<br />
Exhibit 15.2<br />
(6)<br />
Experience Year<br />
Weights<br />
100 %
Fiscal Year Ending<br />
(1)<br />
Earned Exposures<br />
(2)<br />
Earned Premium<br />
<strong>at</strong> Current R<strong>at</strong>es<br />
Allst<strong>at</strong>e Indemnity Company<br />
Priv<strong>at</strong>e Passenger Auto<br />
<strong>Delaware</strong><br />
Development of Projected Average Earned Premium<br />
Personal Injury Protection<br />
(3)<br />
Factor to Adjust to<br />
Projected Premium<br />
Level<br />
(4)<br />
Projected Earned<br />
Premium <strong>at</strong><br />
Current R<strong>at</strong>es<br />
(2) x (3)<br />
(5)<br />
Projected Average<br />
Earned Premium<br />
<strong>at</strong> Current R<strong>at</strong>es<br />
(4) / (1)<br />
12/31/2010 1,208 $393,921 1.000 $393,921 $326.09<br />
(7) Projected Average Earned Premium At Current R<strong>at</strong>es<br />
$326.09<br />
Attachment III<br />
Exhibit 15.3<br />
(6)<br />
Experience Year<br />
Weights<br />
100 %
Fiscal Year Ending<br />
(1)<br />
Earned Exposures<br />
(2)<br />
Earned Premium<br />
<strong>at</strong> Current R<strong>at</strong>es<br />
Allst<strong>at</strong>e Indemnity Company<br />
Priv<strong>at</strong>e Passenger Auto<br />
<strong>Delaware</strong><br />
Development of Projected Average Earned Premium<br />
Uninsured / Underinsured Motorist<br />
(3)<br />
Factor to Adjust to<br />
Projected Premium<br />
Level<br />
(4)<br />
Projected Earned<br />
Premium <strong>at</strong><br />
Current R<strong>at</strong>es<br />
(2) x (3)<br />
(5)<br />
Projected Average<br />
Earned Premium<br />
<strong>at</strong> Current R<strong>at</strong>es<br />
(4) / (1)<br />
12/31/2010 1,014 $114,462 1.000 $114,462 $112.88<br />
(7) Projected Average Earned Premium At Current R<strong>at</strong>es<br />
$112.88<br />
Attachment III<br />
Exhibit 15.4<br />
(6)<br />
Experience Year<br />
Weights<br />
100 %
Fiscal Year Ending<br />
(1)<br />
Earned Exposures<br />
(2)<br />
Earned Premium<br />
<strong>at</strong> Current R<strong>at</strong>es<br />
Allst<strong>at</strong>e Indemnity Company<br />
Priv<strong>at</strong>e Passenger Auto<br />
<strong>Delaware</strong><br />
Development of Projected Average Earned Premium<br />
Collision<br />
(3)<br />
Factor to Adjust to<br />
Projected Premium<br />
Level<br />
(4)<br />
Projected Earned<br />
Premium <strong>at</strong><br />
Current R<strong>at</strong>es<br />
(2) x (3)<br />
(5)<br />
Projected Average<br />
Earned Premium<br />
<strong>at</strong> Current R<strong>at</strong>es<br />
(4) / (1)<br />
12/31/2010 400 $330,307 1.169 $386,129 $965.32<br />
(7) Projected Average Earned Premium At Current R<strong>at</strong>es<br />
$965.32<br />
Attachment III<br />
Exhibit 15.5<br />
(6)<br />
Experience Year<br />
Weights<br />
100 %
Fiscal Year Ending<br />
(1)<br />
Earned Exposures<br />
(2)<br />
Earned Premium<br />
<strong>at</strong> Current R<strong>at</strong>es<br />
Allst<strong>at</strong>e Indemnity Company<br />
Priv<strong>at</strong>e Passenger Auto<br />
<strong>Delaware</strong><br />
Development of Projected Average Earned Premium<br />
Comprehensive<br />
(3)<br />
Factor to Adjust to<br />
Projected Premium<br />
Level<br />
(4)<br />
Projected Earned<br />
Premium <strong>at</strong><br />
Current R<strong>at</strong>es<br />
(2) x (3)<br />
(5)<br />
Projected Average<br />
Earned Premium<br />
<strong>at</strong> Current R<strong>at</strong>es<br />
(4) / (1)<br />
12/31/2010 442 $152,806 1.144 $174,810 $395.50<br />
(7) Projected Average Earned Premium At Current R<strong>at</strong>es<br />
$395.50<br />
Attachment III<br />
Exhibit 15.6<br />
(6)<br />
Experience Year<br />
Weights<br />
100 %
Coverage<br />
Bodily Injury<br />
Property Damage<br />
Personal Injury Protection<br />
Uninsured / Underinsured Motorist<br />
Collision<br />
Comprehensive<br />
1)Average Earned D<strong>at</strong>e of Proposed Policy Period<br />
2) Mid-Point of Current Year's Experience Period<br />
3) Experience Period Ended<br />
4) Midpoint of Experience Period<br />
5) Historical: Number of Years from (4) to (2)<br />
6) Projected: Number of Years from (2) to (1)<br />
Calcul<strong>at</strong>ion of Trend Factors<br />
Allst<strong>at</strong>e Indemnity Company<br />
Priv<strong>at</strong>e Passenger Auto<br />
<strong>Delaware</strong><br />
Calcul<strong>at</strong>ion of Premium Trend Factor<br />
Selected Annual Premium Impacts<br />
Projected<br />
0.00%<br />
0.00<br />
0.00<br />
0.00<br />
7.00<br />
6.00<br />
Current Year<br />
10/21/2012<br />
6/30/2010<br />
12/31/2010<br />
6/30/2010<br />
0.000<br />
2.310<br />
(a) Historical Premium Factors are the Annual Historical Impacts plus unity compounded for the number of years in (5)<br />
(b) Projected Premium Factors are the Annual Projected Impacts plus unity compounded for the number of years in (6)<br />
(c) Factor to Adjust to Projected Premium Level = (a) x (b)<br />
Attachment III<br />
Exhibit 16
Attachment III<br />
Exhibit 17.1<br />
Year Ending<br />
Average Written<br />
Premium @ CRL Annual Change 24 pt. 12 pt. 6 pt.<br />
06/05 $434.21 5.24 % $421.45<br />
09/05 433.48 4.70 425.70<br />
12/05 439.77 4.83 430.00<br />
03/06 443.20 4.44 434.33<br />
06/06 437.17 0.68 438.72<br />
09/06 451.54 4.17 443.14<br />
12/06 439.81 0.01 447.61<br />
03/07 444.37 0.26 452.12<br />
06/07 442.04 1.11 456.68<br />
09/07 435.33 -3.59 461.29<br />
12/07 451.01 2.55 465.94<br />
03/08 454.81 2.35 470.64<br />
06/08 463.61 4.88 475.39 $478.89<br />
09/08 472.92 8.63 480.19 483.71<br />
12/08 483.65 7.24 485.03 488.57<br />
03/09 502.37 10.46 489.92 493.49<br />
06/09 508.44 9.67 494.86 498.45<br />
09/09 523.02 10.59 499.85 503.47<br />
12/09 516.87 6.87 504.89 508.53 $521.60<br />
03/10 522.52 † 4.01 509.99 513.65 521.16<br />
06/10 522.69 † 2.80 515.13 518.82 520.72<br />
09/10 525.49 † 0.47 520.33 524.04 520.28<br />
12/10 521.82 † 0.96 525.57 529.31 519.84<br />
03/11 513.68 -1.69 530.88 534.63 519.40<br />
Avg Annual Percent Change Based on Best Fit:<br />
†Adjusted Values<br />
Allst<strong>at</strong>e Indemnity Company<br />
Priv<strong>at</strong>e Passenger Auto<br />
<strong>Delaware</strong><br />
Premium Trends<br />
Bodily Injury<br />
Exponential Curve of Best Fit<br />
Regression 24 pt. 12 pt.<br />
4.10% 4.09%<br />
6 pt.<br />
-0.34%
Attachment III<br />
Exhibit 17.2<br />
Year Ending<br />
Average Written<br />
Premium @ CRL Annual Change 24 pt. 12 pt. 6 pt.<br />
06/05 $222.67 5.41 % $220.92<br />
09/05 223.75 6.20 223.57<br />
12/05 229.29 7.33 226.26<br />
03/06 230.36 6.44 228.98<br />
06/06 229.48 3.06 231.73<br />
09/06 238.31 6.51 234.51<br />
12/06 234.67 2.35 237.33<br />
03/07 239.66 4.04 240.18<br />
06/07 239.78 4.49 243.06<br />
09/07 237.18 -0.47 245.98<br />
12/07 245.99 4.82 248.93<br />
03/08 247.75 3.38 251.92<br />
06/08 251.47 4.88 254.95 $258.90<br />
09/08 256.92 8.32 258.01 261.51<br />
12/08 262.37 6.66 261.11 264.14<br />
03/09 268.24 8.27 264.25 266.80<br />
06/09 275.47 9.54 267.42 269.48<br />
09/09 280.92 9.34 270.63 272.20<br />
12/09 279.59 6.56 273.88 274.94 $282.05<br />
03/10 283.06 † 5.52 277.17 277.71 281.89<br />
06/10 282.14 † 2.42 280.50 280.50 281.74<br />
09/10 284.64 † 1.32 283.87 283.33 281.58<br />
12/10 281.80 † 0.79 287.28 286.18 281.43<br />
03/11 278.77 -1.52 290.73 289.06 281.27<br />
Avg Annual Percent Change Based on Best Fit:<br />
†Adjusted Values<br />
Allst<strong>at</strong>e Indemnity Company<br />
Priv<strong>at</strong>e Passenger Auto<br />
<strong>Delaware</strong><br />
Premium Trends<br />
Property Damage<br />
Exponential Curve of Best Fit<br />
Regression 24 pt. 12 pt.<br />
4.89% 4.09%<br />
6 pt.<br />
-0.22%
†Adjusted Values<br />
Allst<strong>at</strong>e Indemnity Company<br />
Priv<strong>at</strong>e Passenger Auto<br />
<strong>Delaware</strong><br />
Premium Trends<br />
Personal Injury Protection<br />
Exponential Curve of Best Fit<br />
Attachment III<br />
Exhibit 17.3<br />
Year Ending<br />
Average Written<br />
Premium @ CRL Annual Change 24 pt. 12 pt. 6 pt.<br />
06/05 $292.44 1.10 % $271.40<br />
09/05 290.89 0.88 274.27<br />
12/05 291.09 0.51 277.17<br />
03/06 294.03 1.35 280.11<br />
06/06 288.77 -1.25 283.08<br />
09/06 292.14 0.43 286.07<br />
12/06 285.28 -2.00 289.10<br />
03/07 282.76 -3.83 292.16<br />
06/07 280.69 -2.80 295.26<br />
09/07 276.41 -5.38 298.38<br />
12/07 278.63 -2.33 301.54<br />
03/08 278.27 -1.59 304.74<br />
06/08 281.32 0.22 307.96 $292.87<br />
09/08 287.55 4.03 311.23 299.01<br />
12/08 298.18 7.02 314.52 305.28<br />
03/09 316.41 13.71 317.85 311.68<br />
06/09 323.11 14.85 321.22 318.21<br />
09/09 335.97 16.84 324.62 324.89<br />
12/09 331.18 11.07 328.06 331.70 $359.57<br />
03/10 373.85 † 18.15 331.53 338.65 356.37<br />
06/10 368.27 † 13.98 335.04 345.75 353.21<br />
09/10 361.60 † 7.63 338.59 353.00 350.07<br />
12/10 357.38 † 7.91 342.17 360.40 346.95<br />
03/11 320.81 -14.19 345.80 367.95 343.87<br />
Regression 24 pt. 12 pt.<br />
Avg Annual Percent Change Based on Best Fit: 4.30% 8.65%<br />
6 pt.<br />
-3.51%
Allst<strong>at</strong>e Indemnity Company<br />
Priv<strong>at</strong>e Passenger Auto<br />
<strong>Delaware</strong><br />
Premium Trends<br />
Uninsured / Underinsured Motorist<br />
Exponential Curve of Best Fit<br />
Attachment III<br />
Exhibit 17.4<br />
Year Ending<br />
Average Written<br />
Premium @ CRL Annual Change 24 pt. 12 pt. 6 pt.<br />
06/05 $111.80 -1.80 % $107.10<br />
09/05 112.79 0.80 107.32<br />
12/05 111.35 -1.16 107.55<br />
03/06 111.96 -0.75 107.77<br />
06/06 108.57 -2.89 108.00<br />
09/06 108.30 -3.98 108.22<br />
12/06 105.10 -5.61 108.45<br />
03/07 104.40 -6.75 108.68<br />
06/07 102.54 -5.55 108.91<br />
09/07 101.97 -5.84 109.13<br />
12/07 104.21 -0.85 109.36<br />
03/08 103.87 -0.51 109.59<br />
06/08 108.88 6.18 109.82 $110.59<br />
09/08 110.26 8.13 110.05 110.90<br />
12/08 112.59 8.04 110.28 111.21<br />
03/09 112.91 8.70 110.51 111.52<br />
06/09 112.80 3.60 110.74 111.83<br />
09/09 112.97 2.46 110.97 112.14<br />
12/09 111.48 -0.99 111.21 112.46 $111.51<br />
03/10 112.38 -0.47 111.44 112.77 112.05<br />
06/10 111.52 -1.13 111.67 113.09 112.60<br />
09/10 114.05 0.96 111.90 113.40 113.16<br />
12/10 114.04 2.30 112.14 113.72 113.71<br />
03/11 113.84 1.30 112.37 114.03 114.27<br />
Regression 24 pt. 12 pt.<br />
Avg Annual Percent Change Based on Best Fit: 0.84% 1.12%<br />
6 pt.<br />
1.98%
Attachment III<br />
Exhibit 17.5<br />
Year Ending<br />
Average Written<br />
Premium @ CRL Annual Change 24 pt. 12 pt. 6 pt.<br />
06/05 $566.11 10.57 % $554.06<br />
09/05 573.25 9.40 564.45<br />
12/05 583.79 8.07 575.03<br />
03/06 595.86 7.57 585.81<br />
06/06 601.52 6.25 596.79<br />
09/06 615.98 7.45 607.98<br />
12/06 615.25 5.39 619.37<br />
03/07 624.88 4.87 630.98<br />
06/07 632.90 5.22 642.81<br />
09/07 640.33 3.95 654.86<br />
12/07 655.82 6.59 667.14<br />
03/08 662.87 6.08 679.64<br />
06/08 665.76 5.19 692.38 $677.60<br />
09/08 677.41 5.79 705.36 693.08<br />
12/08 712.96 8.71 718.58 708.92<br />
03/09 724.07 9.23 732.05 725.12<br />
06/09 758.01 13.86 745.78 741.69<br />
09/09 774.73 14.37 759.76 758.63<br />
12/09 779.10 9.28 774.00 775.97 $788.64<br />
03/10 809.51 † 11.80 788.51 793.70 801.11<br />
06/10 810.80 † 6.96 803.29 811.84 813.77<br />
09/10 838.64 † 8.25 818.35 830.39 826.62<br />
12/10 840.71 † 7.91 833.69 849.36 839.69<br />
03/11 844.25 4.29 849.31 868.77 852.96<br />
Avg Annual Percent Change Based on Best Fit:<br />
†Adjusted Values<br />
Allst<strong>at</strong>e Indemnity Company<br />
Priv<strong>at</strong>e Passenger Auto<br />
<strong>Delaware</strong><br />
Premium Trends<br />
Collision<br />
Exponential Curve of Best Fit<br />
Regression 24 pt. 12 pt.<br />
7.71% 9.46%<br />
6 pt.<br />
6.47%
Allst<strong>at</strong>e Indemnity Company<br />
Priv<strong>at</strong>e Passenger Auto<br />
<strong>Delaware</strong><br />
Premium Trends<br />
Comprehensive<br />
Exponential Curve of Best Fit<br />
Attachment III<br />
Exhibit 17.6<br />
Year Ending<br />
Average Written<br />
Premium @ CRL Annual Change 24 pt. 12 pt. 6 pt.<br />
06/05 $234.99 10.72 % $228.39<br />
09/05 239.86 10.28 232.97<br />
12/05 244.06 8.79 237.65<br />
03/06 247.24 7.51 242.42<br />
06/06 248.61 5.80 247.28<br />
09/06 253.04 5.49 252.25<br />
12/06 253.04 3.68 257.31<br />
03/07 258.50 4.55 262.48<br />
06/07 263.30 5.91 267.75<br />
09/07 263.79 4.25 273.12<br />
12/07 268.48 6.10 278.60<br />
03/08 272.62 5.46 284.20<br />
06/08 272.82 3.62 289.90 $286.29<br />
09/08 283.22 7.37 295.72 292.92<br />
12/08 300.23 11.83 301.66 299.71<br />
03/09 313.11 14.85 307.71 306.65<br />
06/09 330.07 20.98 313.89 313.76<br />
09/09 337.64 19.21 320.19 321.03<br />
12/09 334.12 11.29 326.62 328.47 $332.39<br />
03/10 338.41 † 8.08 333.18 336.09 337.54<br />
06/10 339.26 † 2.78 339.87 343.87 342.77<br />
09/10 346.68 † 2.68 346.69 351.84 348.09<br />
12/10 354.44 † 6.08 353.65 360.00 353.48<br />
03/11 360.36 6.49 360.75 368.34 358.97<br />
Avg Annual Percent Change Based on Best Fit:<br />
†Adjusted Values<br />
Regression 24 pt. 12 pt.<br />
8.27% 9.60%<br />
6 pt.<br />
6.35%
ATTACHMENT IV<br />
Summary of R<strong>at</strong>ing Plan Changes
Methodology<br />
ALLSTATE INDEMNITY COMPANY<br />
PRIVATE PASSENGER AUTOMOBILE<br />
DELAWARE<br />
GENERALIZED LINEAR MODELS PROCEDURE<br />
Attachment IV<br />
Page 1<br />
A multivari<strong>at</strong>e analysis using <strong>General</strong>ized Linear Models (GLMs) is used to determine indic<strong>at</strong>ed factors for<br />
each coverage. GLMs provide regression-like modeling of the response variable of pure premium, but<br />
provide more flexibility versus linear regression, as GLMs allow the response variable to come from an<br />
exponential family of distributions, including normal, Poisson, binomial, neg<strong>at</strong>ive binomial, gamma and<br />
Tweedie distributions. Six models are developed for this analysis; one GLM for each of Bodily Injury,<br />
Property Damage, Medical, Personal Injury Protection, Collision and Comprehensive coverages.<br />
For more inform<strong>at</strong>ion on GLMs and usage in insurance r<strong>at</strong>emaking, please see the following references:<br />
1. Anderson, D.; Feldblum, S; Modlin, C; Schirmacher, D. Schirmacher, E.; and Thandi, N., “A<br />
Practitioner’s Guide to <strong>General</strong>ized Linear Models” (Third Edition), CAS Study Note, February<br />
2007.<br />
http://www.casact.org/library/studynotes/anderson9.pdf<br />
2. McCullagh, P. and Nelder, J., <strong>General</strong>ized Linear Models (Second Edition), Chapman and Hall,<br />
London, 1989.<br />
D<strong>at</strong>a<br />
The d<strong>at</strong>a used in the analysis is countrywide nonstandard automobile policies th<strong>at</strong> have been with Allst<strong>at</strong>e for<br />
five years or less, from accident years 2005-2008, evalu<strong>at</strong>ed <strong>at</strong> March 31, 2009. Note th<strong>at</strong> policy d<strong>at</strong>a from<br />
nine st<strong>at</strong>es (CA, HI, MA, MI, MN, ND, NJ, NC and SD) are excluded, as these st<strong>at</strong>es either do not have a<br />
distinct nonstandard auto company or do not have all of the d<strong>at</strong>a fields necessary for the GLM analysis.<br />
In preparing the d<strong>at</strong>a, the following variables are fixed in advance of running the GLMs:<br />
Bodily Injury increased limit factors<br />
Property Damage increased limit factors<br />
Medical increased limit factors<br />
Personal Injury Protection increased limit factors or deductible<br />
Model Year and Deductible by Price Group Symbol for Collision and Comprehensive coverages<br />
Vehicle Surcharge factors<br />
Standard practice to assemble d<strong>at</strong>a for a GLM is to utilize a Development D<strong>at</strong>aset to cre<strong>at</strong>e the model and a<br />
Holdout D<strong>at</strong>aset to valid<strong>at</strong>e the model. Once this was completed, we established our model structure. We<br />
then upd<strong>at</strong>ed our d<strong>at</strong>a and used the established model to run the GLMs.<br />
Model and Variables Structure<br />
For each coverage, indic<strong>at</strong>ed r<strong>at</strong>ing plan factors are produced by fitting a GLM using a Tweedie 1 distribution<br />
with a log link function 2 to predict the response variable of pure premium.<br />
1. The Tweedie distribution is commonly used in practice for modeling automobile insurance pure<br />
premiums.<br />
2. The log link function is commonly used in practice for modeling automobile insurance as it has the<br />
appealing property of producing factors th<strong>at</strong> are intended to be multiplied together r<strong>at</strong>her than added.<br />
This is consistent with how the factors are applied in the r<strong>at</strong>e calcul<strong>at</strong>ion.
Attachment IV<br />
Page 2<br />
Below is a list of the explan<strong>at</strong>ory variables included in the GLMs. Please note th<strong>at</strong> if a r<strong>at</strong>ing variable does<br />
not apply to a particular coverage it was not included in the GLM for th<strong>at</strong> coverage.<br />
Territory<br />
Driver Class (various combin<strong>at</strong>ions of age, gender and marital st<strong>at</strong>us)<br />
Basic/Restricted Usage<br />
Inexperienced Oper<strong>at</strong>or Surcharge<br />
Resident Student Discount<br />
Good Student Discount<br />
Multiple Policy Discount<br />
Household Composition (various combin<strong>at</strong>ions of # drivers, # cars and youngest age on policy)<br />
<strong>Insurance</strong> Score Group<br />
Years with Prior Carrier<br />
Prior Bodily Injury Limits<br />
Homeownership Discount<br />
Accident Factor (various combin<strong>at</strong>ions of # At-Faults, # years since most recent At-Fault and Age<br />
Group)<br />
Minor Viol<strong>at</strong>ions Factor (various combin<strong>at</strong>ions of # Minor Viol<strong>at</strong>ions, # years since most recent<br />
Minor Viol<strong>at</strong>ion and Age Group)<br />
Number of Major Viol<strong>at</strong>ions<br />
Vehicle Usage<br />
Secondary Analysis<br />
After the GLMs are solved and their resulting factors are applied back to the d<strong>at</strong>aset, a secondary loss r<strong>at</strong>io<br />
analysis is conducted to obtain indic<strong>at</strong>ed r<strong>at</strong>ing plan factors for the following variables:<br />
Performance Discount<br />
Easy Pay Discount<br />
Future Effective D<strong>at</strong>e Discount<br />
Good Payer Discount<br />
Since not all st<strong>at</strong>es include the Performance Discount variables in r<strong>at</strong>ing, this variable was not included in the<br />
GLM but instead the indic<strong>at</strong>ed factors were calcul<strong>at</strong>ed with a secondary analysis.<br />
Property Damage Increased Limits Analysis<br />
Allst<strong>at</strong>e is modifying the factors for Property Damage (PD) Limits with this filing based on an upd<strong>at</strong>ed<br />
analysis. PD limit was initially included as a variable in the <strong>General</strong>ized Linear Model. Then PD limit<br />
factors were selected based on the model output and ensuring th<strong>at</strong> the factors increased <strong>at</strong> a decreasing r<strong>at</strong>e.<br />
These selected factors were then fixed in the final <strong>General</strong>ized Linear Model.<br />
Indic<strong>at</strong>ed and Selected Factors<br />
Both indic<strong>at</strong>ed and selected factors were fl<strong>at</strong>tened for fixed expenses. Selected factors were adjusted for<br />
reversals and actuarial judgment.<br />
Valid<strong>at</strong>ion<br />
With this filing, Allst<strong>at</strong>e is implementing our l<strong>at</strong>est version of our nonstandard automobile r<strong>at</strong>ing plan, Blue<br />
2.0, which has improved predictive accuracy over its predecessor, Blue.
Attachment IV<br />
Page 3<br />
We have used two-way lift charts to numerically compare the performance of the new r<strong>at</strong>ing plan factors<br />
versus the prior phase r<strong>at</strong>ing plan factors when both sets of factors are used to r<strong>at</strong>e the common set of policies<br />
in the d<strong>at</strong>aset. For two-way lift charts, the more accur<strong>at</strong>e model has a line plot th<strong>at</strong> is closer to 1.00. By this<br />
measure, our new r<strong>at</strong>ing plan is a more accur<strong>at</strong>e r<strong>at</strong>ing plan compared to the Blue r<strong>at</strong>ing plan as illustr<strong>at</strong>ed in<br />
the chart below.<br />
Additional Revisions<br />
Blue 2.0<br />
Blue 2.0 r<strong>at</strong>es lower than<br />
Blue<br />
Allst<strong>at</strong>e is making the editorial revision of adding 2010, 2011 and 2012 Model Year Factors to the r<strong>at</strong>e pages.<br />
These factors were determined per Rule 21A. Model years prior to 2002 have been set equal to the Model<br />
Year 2002 factor as per Rule 21B.<br />
Blue<br />
Blue 2.0 r<strong>at</strong>es higher<br />
than Blue
ALLSTATE INDEMNITY COMPANY<br />
PRIVATE PASSENGER AUTO<br />
DELAWARE<br />
TIER FACTORS<br />
Indic<strong>at</strong>ed Selected Indic<strong>at</strong>ed Selected Indic<strong>at</strong>ed Selected Indic<strong>at</strong>ed Selected Indic<strong>at</strong>ed Selected<br />
Tier BI Factor BI Factor PD Factor PD Factor PIP Factor PIP Factor Coll Factor Coll Factor Comp Factor Comp Factor<br />
1 0.68 0.68 0.80 0.80 0.44 0.44 0.77 0.77 0.60 0.60<br />
2 0.68 0.68 0.80 0.80 0.50 0.50 0.77 0.77 0.65 0.65<br />
3 0.74 0.74 0.82 0.82 0.63 0.63 0.78 0.78 0.69 0.69<br />
4 0.71 0.71 0.80 0.80 0.51 0.51 0.82 0.82 0.64 0.64<br />
5 0.71 0.71 0.80 0.80 0.58 0.58 0.82 0.82 0.69 0.69<br />
6 0.77 0.77 0.82 0.82 0.73 0.73 0.84 0.84 0.73 0.73<br />
7 0.68 0.68 0.80 0.80 0.44 0.44 0.77 0.77 0.60 0.60<br />
8 0.68 0.68 0.80 0.80 0.50 0.50 0.77 0.77 0.65 0.65<br />
9 0.74 0.74 0.82 0.82 0.63 0.63 0.78 0.78 0.69 0.69<br />
10 0.71 0.71 0.80 0.80 0.51 0.51 0.82 0.82 0.64 0.64<br />
11 0.71 0.71 0.80 0.80 0.58 0.58 0.82 0.82 0.69 0.69<br />
12 0.77 0.77 0.82 0.82 0.73 0.73 0.84 0.84 0.73 0.73<br />
13 0.68 0.68 0.80 0.80 0.44 0.44 0.77 0.77 0.60 0.60<br />
14 0.68 0.68 0.80 0.80 0.50 0.50 0.77 0.77 0.65 0.65<br />
15 0.74 0.74 0.82 0.82 0.63 0.63 0.78 0.78 0.69 0.69<br />
16 0.71 0.71 0.80 0.80 0.51 0.51 0.82 0.82 0.64 0.64<br />
17 0.71 0.71 0.80 0.80 0.58 0.58 0.82 0.82 0.69 0.69<br />
18 0.77 0.77 0.82 0.82 0.73 0.73 0.84 0.84 0.73 0.73<br />
19 0.68 0.68 0.80 0.80 0.44 0.44 0.77 0.77 0.60 0.60<br />
20 0.68 0.68 0.80 0.80 0.50 0.50 0.77 0.77 0.65 0.65<br />
21 0.74 0.74 0.82 0.82 0.63 0.63 0.78 0.78 0.69 0.69<br />
22 0.71 0.71 0.80 0.80 0.51 0.51 0.82 0.82 0.64 0.64<br />
23 0.71 0.71 0.80 0.80 0.58 0.58 0.82 0.82 0.69 0.69<br />
24 0.77 0.77 0.82 0.82 0.73 0.73 0.84 0.84 0.73 0.73<br />
25 0.71 0.71 0.80 0.80 0.51 0.51 0.82 0.82 0.64 0.64<br />
26 0.71 0.71 0.80 0.80 0.58 0.58 0.82 0.82 0.69 0.69<br />
27 0.77 0.77 0.82 0.82 0.73 0.73 0.84 0.84 0.73 0.73<br />
28 0.71 0.71 0.80 0.80 0.51 0.51 0.82 0.82 0.64 0.64<br />
29 0.71 0.71 0.80 0.80 0.58 0.58 0.82 0.82 0.69 0.69<br />
30 0.77 0.77 0.82 0.82 0.73 0.73 0.84 0.84 0.73 0.73<br />
31 0.69 0.69 0.81 0.81 0.45 0.45 0.77 0.77 0.61 0.61<br />
32 0.69 0.69 0.81 0.81 0.51 0.51 0.77 0.77 0.67 0.67<br />
33 0.75 0.75 0.84 0.84 0.65 0.65 0.79 0.79 0.71 0.71<br />
34 0.72 0.72 0.81 0.81 0.53 0.53 0.83 0.83 0.65 0.65<br />
35 0.72 0.72 0.81 0.81 0.59 0.59 0.83 0.83 0.71 0.71<br />
36 0.78 0.78 0.84 0.84 0.75 0.75 0.85 0.85 0.75 0.75<br />
37 0.69 0.69 0.81 0.81 0.45 0.45 0.77 0.77 0.61 0.61<br />
38 0.69 0.69 0.81 0.81 0.51 0.51 0.77 0.77 0.67 0.67<br />
39 0.75 0.75 0.84 0.84 0.65 0.65 0.79 0.79 0.71 0.71<br />
40 0.72 0.72 0.81 0.81 0.53 0.53 0.83 0.83 0.65 0.65<br />
41 0.72 0.72 0.81 0.81 0.59 0.59 0.83 0.83 0.71 0.71<br />
42 0.78 0.78 0.84 0.84 0.75 0.75 0.85 0.85 0.75 0.75<br />
43 0.69 0.69 0.81 0.81 0.45 0.45 0.77 0.77 0.61 0.61<br />
44 0.69 0.69 0.81 0.81 0.51 0.51 0.77 0.77 0.67 0.67<br />
45 0.75 0.75 0.84 0.84 0.65 0.65 0.79 0.79 0.71 0.71<br />
46 0.72 0.72 0.81 0.81 0.53 0.53 0.83 0.83 0.65 0.65<br />
47 0.72 0.72 0.81 0.81 0.59 0.59 0.83 0.83 0.71 0.71<br />
48 0.78 0.78 0.84 0.84 0.75 0.75 0.85 0.85 0.75 0.75<br />
49 0.69 0.69 0.81 0.81 0.45 0.45 0.77 0.77 0.61 0.61<br />
50 0.69 0.69 0.81 0.81 0.51 0.51 0.77 0.77 0.67 0.67<br />
51 0.75 0.75 0.84 0.84 0.65 0.65 0.79 0.79 0.71 0.71<br />
52 0.72 0.72 0.81 0.81 0.53 0.53 0.83 0.83 0.65 0.65<br />
53 0.72 0.72 0.81 0.81 0.59 0.59 0.83 0.83 0.71 0.71<br />
54 0.78 0.78 0.84 0.84 0.75 0.75 0.85 0.85 0.75 0.75<br />
55 0.72 0.72 0.81 0.81 0.53 0.53 0.83 0.83 0.65 0.65<br />
56 0.72 0.72 0.81 0.81 0.59 0.59 0.83 0.83 0.71 0.71<br />
57 0.78 0.78 0.84 0.84 0.75 0.75 0.85 0.85 0.75 0.75<br />
58 0.72 0.72 0.81 0.81 0.53 0.53 0.83 0.83 0.65 0.65<br />
59 0.72 0.72 0.81 0.81 0.59 0.59 0.83 0.83 0.71 0.71<br />
60 0.78 0.78 0.84 0.84 0.75 0.75 0.85 0.85 0.75 0.75<br />
61 0.71 0.71 0.82 0.82 0.47 0.47 0.79 0.79 0.64 0.64<br />
62 0.71 0.71 0.82 0.82 0.53 0.53 0.79 0.79 0.70 0.70<br />
63 0.77 0.77 0.85 0.85 0.67 0.67 0.81 0.81 0.73 0.73<br />
64 0.74 0.74 0.82 0.82 0.55 0.55 0.85 0.85 0.68 0.68<br />
65 0.74 0.74 0.82 0.82 0.62 0.62 0.85 0.85 0.74 0.74<br />
66 0.80 0.80 0.85 0.85 0.78 0.78 0.87 0.87 0.78 0.78<br />
67 0.71 0.71 0.82 0.82 0.47 0.47 0.79 0.79 0.64 0.64<br />
68 0.71 0.71 0.82 0.82 0.53 0.53 0.79 0.79 0.70 0.70<br />
69 0.77 0.77 0.85 0.85 0.67 0.67 0.81 0.81 0.73 0.73<br />
70 0.74 0.74 0.82 0.82 0.55 0.55 0.85 0.85 0.68 0.68<br />
71 0.74 0.74 0.82 0.82 0.62 0.62 0.85 0.85 0.74 0.74<br />
72 0.80 0.80 0.85 0.85 0.78 0.78 0.87 0.87 0.78 0.78<br />
73 0.71 0.71 0.82 0.82 0.47 0.47 0.79 0.79 0.64 0.64<br />
74 0.71 0.71 0.82 0.82 0.53 0.53 0.79 0.79 0.70 0.70<br />
75 0.77 0.77 0.85 0.85 0.67 0.67 0.81 0.81 0.73 0.73<br />
76 0.74 0.74 0.82 0.82 0.55 0.55 0.85 0.85 0.68 0.68<br />
77 0.74 0.74 0.82 0.82 0.62 0.62 0.85 0.85 0.74 0.74<br />
78 0.80 0.80 0.85 0.85 0.78 0.78 0.87 0.87 0.78 0.78<br />
79 0.71 0.71 0.82 0.82 0.47 0.47 0.79 0.79 0.64 0.64<br />
80 0.71 0.71 0.82 0.82 0.53 0.53 0.79 0.79 0.70 0.70<br />
81 0.77 0.77 0.85 0.85 0.67 0.67 0.81 0.81 0.73 0.73<br />
82 0.74 0.74 0.82 0.82 0.55 0.55 0.85 0.85 0.68 0.68<br />
83 0.74 0.74 0.82 0.82 0.62 0.62 0.85 0.85 0.74 0.74<br />
84 0.80 0.80 0.85 0.85 0.78 0.78 0.87 0.87 0.78 0.78<br />
85 0.74 0.74 0.82 0.82 0.55 0.55 0.85 0.85 0.68 0.68<br />
86 0.74 0.74 0.82 0.82 0.62 0.62 0.85 0.85 0.74 0.74<br />
87 0.80 0.80 0.85 0.85 0.78 0.78 0.87 0.87 0.78 0.78<br />
88 0.74 0.74 0.82 0.82 0.55 0.55 0.85 0.85 0.68 0.68<br />
89 0.74 0.74 0.82 0.82 0.62 0.62 0.85 0.85 0.74 0.74<br />
90 0.80 0.80 0.85 0.85 0.78 0.78 0.87 0.87 0.78 0.78<br />
Attachment IV<br />
Exhibit 1<br />
Page 1
ALLSTATE INDEMNITY COMPANY<br />
PRIVATE PASSENGER AUTO<br />
DELAWARE<br />
TIER FACTORS<br />
Indic<strong>at</strong>ed Selected Indic<strong>at</strong>ed Selected Indic<strong>at</strong>ed Selected Indic<strong>at</strong>ed Selected Indic<strong>at</strong>ed Selected<br />
Tier BI Factor BI Factor PD Factor PD Factor PIP Factor PIP Factor Coll Factor Coll Factor Comp Factor Comp Factor<br />
91 0.72 0.72 0.83 0.83 0.48 0.48 0.80 0.80 0.65 0.65<br />
92 0.72 0.72 0.83 0.83 0.54 0.54 0.80 0.80 0.71 0.71<br />
93 0.78 0.78 0.86 0.86 0.69 0.69 0.82 0.82 0.75 0.75<br />
94 0.75 0.75 0.83 0.83 0.56 0.56 0.86 0.86 0.70 0.70<br />
95 0.75 0.75 0.83 0.83 0.63 0.63 0.86 0.86 0.76 0.76<br />
96 0.81 0.81 0.86 0.86 0.80 0.80 0.88 0.88 0.80 0.80<br />
97 0.72 0.72 0.83 0.83 0.48 0.48 0.80 0.80 0.65 0.65<br />
98 0.72 0.72 0.83 0.83 0.54 0.54 0.80 0.80 0.71 0.71<br />
99 0.78 0.78 0.86 0.86 0.69 0.69 0.82 0.82 0.75 0.75<br />
100 0.75 0.75 0.83 0.83 0.56 0.56 0.86 0.86 0.70 0.70<br />
101 0.75 0.75 0.83 0.83 0.63 0.63 0.86 0.86 0.76 0.76<br />
102 0.81 0.81 0.86 0.86 0.80 0.80 0.88 0.88 0.80 0.80<br />
103 0.72 0.72 0.83 0.83 0.48 0.48 0.80 0.80 0.65 0.65<br />
104 0.72 0.72 0.83 0.83 0.54 0.54 0.80 0.80 0.71 0.71<br />
105 0.78 0.78 0.86 0.86 0.69 0.69 0.82 0.82 0.75 0.75<br />
106 0.75 0.75 0.83 0.83 0.56 0.56 0.86 0.86 0.70 0.70<br />
107 0.75 0.75 0.83 0.83 0.63 0.63 0.86 0.86 0.76 0.76<br />
108 0.81 0.81 0.86 0.86 0.80 0.80 0.88 0.88 0.80 0.80<br />
109 0.72 0.72 0.83 0.83 0.48 0.48 0.80 0.80 0.65 0.65<br />
110 0.72 0.72 0.83 0.83 0.54 0.54 0.80 0.80 0.71 0.71<br />
111 0.78 0.78 0.86 0.86 0.69 0.69 0.82 0.82 0.75 0.75<br />
112 0.75 0.75 0.83 0.83 0.56 0.56 0.86 0.86 0.70 0.70<br />
113 0.75 0.75 0.83 0.83 0.63 0.63 0.86 0.86 0.76 0.76<br />
114 0.81 0.81 0.86 0.86 0.80 0.80 0.88 0.88 0.80 0.80<br />
115 0.75 0.75 0.83 0.83 0.56 0.56 0.86 0.86 0.70 0.70<br />
116 0.75 0.75 0.83 0.83 0.63 0.63 0.86 0.86 0.76 0.76<br />
117 0.81 0.81 0.86 0.86 0.80 0.80 0.88 0.88 0.80 0.80<br />
118 0.75 0.75 0.83 0.83 0.56 0.56 0.86 0.86 0.70 0.70<br />
119 0.75 0.75 0.83 0.83 0.63 0.63 0.86 0.86 0.76 0.76<br />
120 0.81 0.81 0.86 0.86 0.80 0.80 0.88 0.88 0.80 0.80<br />
121 0.73 0.73 0.84 0.84 0.50 0.50 0.82 0.82 0.68 0.68<br />
122 0.73 0.73 0.84 0.84 0.56 0.56 0.82 0.82 0.74 0.74<br />
123 0.80 0.80 0.87 0.87 0.71 0.71 0.84 0.84 0.78 0.78<br />
124 0.76 0.76 0.84 0.84 0.58 0.58 0.88 0.88 0.72 0.72<br />
125 0.76 0.76 0.84 0.84 0.66 0.66 0.88 0.88 0.79 0.79<br />
126 0.83 0.83 0.87 0.87 0.83 0.83 0.90 0.90 0.83 0.83<br />
127 0.73 0.73 0.84 0.84 0.50 0.50 0.82 0.82 0.68 0.68<br />
128 0.73 0.73 0.84 0.84 0.56 0.56 0.82 0.82 0.74 0.74<br />
129 0.80 0.80 0.87 0.87 0.71 0.71 0.84 0.84 0.78 0.78<br />
130 0.76 0.76 0.84 0.84 0.58 0.58 0.88 0.88 0.72 0.72<br />
131 0.76 0.76 0.84 0.84 0.66 0.66 0.88 0.88 0.79 0.79<br />
132 0.83 0.83 0.87 0.87 0.83 0.83 0.90 0.90 0.83 0.83<br />
133 0.73 0.73 0.84 0.84 0.50 0.50 0.82 0.82 0.68 0.68<br />
134 0.73 0.73 0.84 0.84 0.56 0.56 0.82 0.82 0.74 0.74<br />
135 0.80 0.80 0.87 0.87 0.71 0.71 0.84 0.84 0.78 0.78<br />
136 0.76 0.76 0.84 0.84 0.58 0.58 0.88 0.88 0.72 0.72<br />
137 0.76 0.76 0.84 0.84 0.66 0.66 0.88 0.88 0.79 0.79<br />
138 0.83 0.83 0.87 0.87 0.83 0.83 0.90 0.90 0.83 0.83<br />
139 0.73 0.73 0.84 0.84 0.50 0.50 0.82 0.82 0.68 0.68<br />
140 0.73 0.73 0.84 0.84 0.56 0.56 0.82 0.82 0.74 0.74<br />
141 0.80 0.80 0.87 0.87 0.71 0.71 0.84 0.84 0.78 0.78<br />
142 0.76 0.76 0.84 0.84 0.58 0.58 0.88 0.88 0.72 0.72<br />
143 0.76 0.76 0.84 0.84 0.66 0.66 0.88 0.88 0.79 0.79<br />
144 0.83 0.83 0.87 0.87 0.83 0.83 0.90 0.90 0.83 0.83<br />
145 0.76 0.76 0.84 0.84 0.58 0.58 0.88 0.88 0.72 0.72<br />
146 0.76 0.76 0.84 0.84 0.66 0.66 0.88 0.88 0.79 0.79<br />
147 0.83 0.83 0.87 0.87 0.83 0.83 0.90 0.90 0.83 0.83<br />
148 0.76 0.76 0.84 0.84 0.58 0.58 0.88 0.88 0.72 0.72<br />
149 0.76 0.76 0.84 0.84 0.66 0.66 0.88 0.88 0.79 0.79<br />
150 0.83 0.83 0.87 0.87 0.83 0.83 0.90 0.90 0.83 0.83<br />
151 0.75 0.75 0.86 0.86 0.51 0.51 0.83 0.83 0.70 0.70<br />
152 0.75 0.75 0.86 0.86 0.58 0.58 0.83 0.83 0.76 0.76<br />
153 0.82 0.82 0.89 0.89 0.73 0.73 0.85 0.85 0.80 0.80<br />
154 0.78 0.78 0.86 0.86 0.60 0.60 0.89 0.89 0.74 0.74<br />
155 0.78 0.78 0.86 0.86 0.67 0.67 0.89 0.89 0.81 0.81<br />
156 0.85 0.85 0.89 0.89 0.85 0.85 0.91 0.91 0.85 0.85<br />
157 0.75 0.75 0.86 0.86 0.51 0.51 0.83 0.83 0.70 0.70<br />
158 0.75 0.75 0.86 0.86 0.58 0.58 0.83 0.83 0.76 0.76<br />
159 0.82 0.82 0.89 0.89 0.73 0.73 0.85 0.85 0.80 0.80<br />
160 0.78 0.78 0.86 0.86 0.60 0.60 0.89 0.89 0.74 0.74<br />
161 0.78 0.78 0.86 0.86 0.67 0.67 0.89 0.89 0.81 0.81<br />
162 0.85 0.85 0.89 0.89 0.85 0.85 0.91 0.91 0.85 0.85<br />
163 0.75 0.75 0.86 0.86 0.51 0.51 0.83 0.83 0.70 0.70<br />
164 0.75 0.75 0.86 0.86 0.58 0.58 0.83 0.83 0.76 0.76<br />
165 0.82 0.82 0.89 0.89 0.73 0.73 0.85 0.85 0.80 0.80<br />
166 0.78 0.78 0.86 0.86 0.60 0.60 0.89 0.89 0.74 0.74<br />
167 0.78 0.78 0.86 0.86 0.67 0.67 0.89 0.89 0.81 0.81<br />
168 0.85 0.85 0.89 0.89 0.85 0.85 0.91 0.91 0.85 0.85<br />
169 0.75 0.75 0.86 0.86 0.51 0.51 0.83 0.83 0.70 0.70<br />
170 0.75 0.75 0.86 0.86 0.58 0.58 0.83 0.83 0.76 0.76<br />
171 0.82 0.82 0.89 0.89 0.73 0.73 0.85 0.85 0.80 0.80<br />
172 0.78 0.78 0.86 0.86 0.60 0.60 0.89 0.89 0.74 0.74<br />
173 0.78 0.78 0.86 0.86 0.67 0.67 0.89 0.89 0.81 0.81<br />
174 0.85 0.85 0.89 0.89 0.85 0.85 0.91 0.91 0.85 0.85<br />
175 0.78 0.78 0.86 0.86 0.60 0.60 0.89 0.89 0.74 0.74<br />
176 0.78 0.78 0.86 0.86 0.67 0.67 0.89 0.89 0.81 0.81<br />
177 0.85 0.85 0.89 0.89 0.85 0.85 0.91 0.91 0.85 0.85<br />
178 0.78 0.78 0.86 0.86 0.60 0.60 0.89 0.89 0.74 0.74<br />
179 0.78 0.78 0.86 0.86 0.67 0.67 0.89 0.89 0.81 0.81<br />
180 0.85 0.85 0.89 0.89 0.85 0.85 0.91 0.91 0.85 0.85<br />
Attachment IV<br />
Exhibit 1<br />
Page 2
ALLSTATE INDEMNITY COMPANY<br />
PRIVATE PASSENGER AUTO<br />
DELAWARE<br />
TIER FACTORS<br />
Indic<strong>at</strong>ed Selected Indic<strong>at</strong>ed Selected Indic<strong>at</strong>ed Selected Indic<strong>at</strong>ed Selected Indic<strong>at</strong>ed Selected<br />
Tier BI Factor BI Factor PD Factor PD Factor PIP Factor PIP Factor Coll Factor Coll Factor Comp Factor Comp Factor<br />
181 0.76 0.76 0.87 0.87 0.53 0.53 0.85 0.85 0.72 0.72<br />
182 0.76 0.76 0.87 0.87 0.60 0.60 0.85 0.85 0.79 0.79<br />
183 0.83 0.83 0.90 0.90 0.76 0.76 0.86 0.86 0.83 0.83<br />
184 0.79 0.79 0.87 0.87 0.62 0.62 0.91 0.91 0.77 0.77<br />
185 0.79 0.79 0.87 0.87 0.70 0.70 0.91 0.91 0.84 0.84<br />
186 0.86 0.86 0.90 0.90 0.88 0.88 0.93 0.93 0.88 0.88<br />
187 0.76 0.76 0.87 0.87 0.53 0.53 0.85 0.85 0.72 0.72<br />
188 0.76 0.76 0.87 0.87 0.60 0.60 0.85 0.85 0.79 0.79<br />
189 0.83 0.83 0.90 0.90 0.76 0.76 0.86 0.86 0.83 0.83<br />
190 0.79 0.79 0.87 0.87 0.62 0.62 0.91 0.91 0.77 0.77<br />
191 0.79 0.79 0.87 0.87 0.70 0.70 0.91 0.91 0.84 0.84<br />
192 0.86 0.86 0.90 0.90 0.88 0.88 0.93 0.93 0.88 0.88<br />
193 0.76 0.76 0.87 0.87 0.53 0.53 0.85 0.85 0.72 0.72<br />
194 0.76 0.76 0.87 0.87 0.60 0.60 0.85 0.85 0.79 0.79<br />
195 0.83 0.83 0.90 0.90 0.76 0.76 0.86 0.86 0.83 0.83<br />
196 0.79 0.79 0.87 0.87 0.62 0.62 0.91 0.91 0.77 0.77<br />
197 0.79 0.79 0.87 0.87 0.70 0.70 0.91 0.91 0.84 0.84<br />
198 0.86 0.86 0.90 0.90 0.88 0.88 0.93 0.93 0.88 0.88<br />
199 0.76 0.76 0.87 0.87 0.53 0.53 0.85 0.85 0.72 0.72<br />
200 0.76 0.76 0.87 0.87 0.60 0.60 0.85 0.85 0.79 0.79<br />
201 0.83 0.83 0.90 0.90 0.76 0.76 0.86 0.86 0.83 0.83<br />
202 0.79 0.79 0.87 0.87 0.62 0.62 0.91 0.91 0.77 0.77<br />
203 0.79 0.79 0.87 0.87 0.70 0.70 0.91 0.91 0.84 0.84<br />
204 0.86 0.86 0.90 0.90 0.88 0.88 0.93 0.93 0.88 0.88<br />
205 0.79 0.79 0.87 0.87 0.62 0.62 0.91 0.91 0.77 0.77<br />
206 0.79 0.79 0.87 0.87 0.70 0.70 0.91 0.91 0.84 0.84<br />
207 0.86 0.86 0.90 0.90 0.88 0.88 0.93 0.93 0.88 0.88<br />
208 0.79 0.79 0.87 0.87 0.62 0.62 0.91 0.91 0.77 0.77<br />
209 0.79 0.79 0.87 0.87 0.70 0.70 0.91 0.91 0.84 0.84<br />
210 0.86 0.86 0.90 0.90 0.88 0.88 0.93 0.93 0.88 0.88<br />
211 0.78 0.78 0.88 0.88 0.55 0.55 0.87 0.87 0.74 0.74<br />
212 0.78 0.78 0.88 0.88 0.62 0.62 0.87 0.87 0.81 0.81<br />
213 0.84 0.84 0.91 0.91 0.78 0.78 0.88 0.88 0.86 0.86<br />
214 0.81 0.81 0.88 0.88 0.64 0.64 0.93 0.93 0.79 0.79<br />
215 0.81 0.81 0.88 0.88 0.72 0.72 0.93 0.93 0.86 0.86<br />
216 0.88 0.88 0.91 0.91 0.91 0.91 0.95 0.95 0.91 0.91<br />
217 0.78 0.78 0.88 0.88 0.55 0.55 0.87 0.87 0.74 0.74<br />
218 0.78 0.78 0.88 0.88 0.62 0.62 0.87 0.87 0.81 0.81<br />
219 0.84 0.84 0.91 0.91 0.78 0.78 0.88 0.88 0.86 0.86<br />
220 0.81 0.81 0.88 0.88 0.64 0.64 0.93 0.93 0.79 0.79<br />
221 0.81 0.81 0.88 0.88 0.72 0.72 0.93 0.93 0.86 0.86<br />
222 0.88 0.88 0.91 0.91 0.91 0.91 0.95 0.95 0.91 0.91<br />
223 0.78 0.78 0.88 0.88 0.55 0.55 0.87 0.87 0.74 0.74<br />
224 0.78 0.78 0.88 0.88 0.62 0.62 0.87 0.87 0.81 0.81<br />
225 0.84 0.84 0.91 0.91 0.78 0.78 0.88 0.88 0.86 0.86<br />
226 0.81 0.81 0.88 0.88 0.64 0.64 0.93 0.93 0.79 0.79<br />
227 0.81 0.81 0.88 0.88 0.72 0.72 0.93 0.93 0.86 0.86<br />
228 0.88 0.88 0.91 0.91 0.91 0.91 0.95 0.95 0.91 0.91<br />
229 0.78 0.78 0.88 0.88 0.55 0.55 0.87 0.87 0.74 0.74<br />
230 0.78 0.78 0.88 0.88 0.62 0.62 0.87 0.87 0.81 0.81<br />
231 0.84 0.84 0.91 0.91 0.78 0.78 0.88 0.88 0.86 0.86<br />
232 0.81 0.81 0.88 0.88 0.64 0.64 0.93 0.93 0.79 0.79<br />
233 0.81 0.81 0.88 0.88 0.72 0.72 0.93 0.93 0.86 0.86<br />
234 0.88 0.88 0.91 0.91 0.91 0.91 0.95 0.95 0.91 0.91<br />
235 0.81 0.81 0.88 0.88 0.64 0.64 0.93 0.93 0.79 0.79<br />
236 0.81 0.81 0.88 0.88 0.72 0.72 0.93 0.93 0.86 0.86<br />
237 0.88 0.88 0.91 0.91 0.91 0.91 0.95 0.95 0.91 0.91<br />
238 0.81 0.81 0.88 0.88 0.64 0.64 0.93 0.93 0.79 0.79<br />
239 0.81 0.81 0.88 0.88 0.72 0.72 0.93 0.93 0.86 0.86<br />
240 0.88 0.88 0.91 0.91 0.91 0.91 0.95 0.95 0.91 0.91<br />
241 0.79 0.79 0.90 0.90 0.57 0.57 0.87 0.87 0.77 0.77<br />
242 0.79 0.79 0.90 0.90 0.64 0.64 0.87 0.87 0.84 0.84<br />
243 0.86 0.86 0.93 0.93 0.81 0.81 0.89 0.89 0.88 0.88<br />
244 0.83 0.83 0.90 0.90 0.66 0.66 0.94 0.94 0.82 0.82<br />
245 0.83 0.83 0.90 0.90 0.74 0.74 0.94 0.94 0.89 0.89<br />
246 0.90 0.90 0.93 0.93 0.94 0.94 0.96 0.96 0.94 0.94<br />
247 0.79 0.79 0.90 0.90 0.57 0.57 0.87 0.87 0.77 0.77<br />
248 0.79 0.79 0.90 0.90 0.64 0.64 0.87 0.87 0.84 0.84<br />
249 0.86 0.86 0.93 0.93 0.81 0.81 0.89 0.89 0.88 0.88<br />
250 0.83 0.83 0.90 0.90 0.66 0.66 0.94 0.94 0.82 0.82<br />
251 0.83 0.83 0.90 0.90 0.74 0.74 0.94 0.94 0.89 0.89<br />
252 0.90 0.90 0.93 0.93 0.94 0.94 0.96 0.96 0.94 0.94<br />
253 0.79 0.79 0.90 0.90 0.57 0.57 0.87 0.87 0.77 0.77<br />
254 0.79 0.79 0.90 0.90 0.64 0.64 0.87 0.87 0.84 0.84<br />
255 0.86 0.86 0.93 0.93 0.81 0.81 0.89 0.89 0.88 0.88<br />
256 0.83 0.83 0.90 0.90 0.66 0.66 0.94 0.94 0.82 0.82<br />
257 0.83 0.83 0.90 0.90 0.74 0.74 0.94 0.94 0.89 0.89<br />
258 0.90 0.90 0.93 0.93 0.94 0.94 0.96 0.96 0.94 0.94<br />
259 0.79 0.79 0.90 0.90 0.57 0.57 0.87 0.87 0.77 0.77<br />
260 0.79 0.79 0.90 0.90 0.64 0.64 0.87 0.87 0.84 0.84<br />
261 0.86 0.86 0.93 0.93 0.81 0.81 0.89 0.89 0.88 0.88<br />
262 0.83 0.83 0.90 0.90 0.66 0.66 0.94 0.94 0.82 0.82<br />
263 0.83 0.83 0.90 0.90 0.74 0.74 0.94 0.94 0.89 0.89<br />
264 0.90 0.90 0.93 0.93 0.94 0.94 0.96 0.96 0.94 0.94<br />
265 0.83 0.83 0.90 0.90 0.66 0.66 0.94 0.94 0.82 0.82<br />
266 0.83 0.83 0.90 0.90 0.74 0.74 0.94 0.94 0.89 0.89<br />
267 0.90 0.90 0.93 0.93 0.94 0.94 0.96 0.96 0.94 0.94<br />
268 0.83 0.83 0.90 0.90 0.66 0.66 0.94 0.94 0.82 0.82<br />
269 0.83 0.83 0.90 0.90 0.74 0.74 0.94 0.94 0.89 0.89<br />
270 0.90 0.90 0.93 0.93 0.94 0.94 0.96 0.96 0.94 0.94<br />
Attachment IV<br />
Exhibit 1<br />
Page 3
ALLSTATE INDEMNITY COMPANY<br />
PRIVATE PASSENGER AUTO<br />
DELAWARE<br />
TIER FACTORS<br />
Indic<strong>at</strong>ed Selected Indic<strong>at</strong>ed Selected Indic<strong>at</strong>ed Selected Indic<strong>at</strong>ed Selected Indic<strong>at</strong>ed Selected<br />
Tier BI Factor BI Factor PD Factor PD Factor PIP Factor PIP Factor Coll Factor Coll Factor Comp Factor Comp Factor<br />
271 0.81 0.81 0.91 0.91 0.58 0.58 0.89 0.89 0.79 0.79<br />
272 0.81 0.81 0.91 0.91 0.66 0.66 0.89 0.89 0.87 0.87<br />
273 0.88 0.88 0.94 0.94 0.83 0.83 0.91 0.91 0.91 0.91<br />
274 0.85 0.85 0.91 0.91 0.68 0.68 0.96 0.96 0.84 0.84<br />
275 0.85 0.85 0.91 0.91 0.77 0.77 0.96 0.96 0.92 0.92<br />
276 0.92 0.92 0.94 0.94 0.97 0.97 0.98 0.98 0.97 0.97<br />
277 0.81 0.81 0.91 0.91 0.58 0.58 0.89 0.89 0.79 0.79<br />
278 0.81 0.81 0.91 0.91 0.66 0.66 0.89 0.89 0.87 0.87<br />
279 0.88 0.88 0.94 0.94 0.83 0.83 0.91 0.91 0.91 0.91<br />
280 0.85 0.85 0.91 0.91 0.68 0.68 0.96 0.96 0.84 0.84<br />
281 0.85 0.85 0.91 0.91 0.77 0.77 0.96 0.96 0.92 0.92<br />
282 0.92 0.92 0.94 0.94 0.97 0.97 0.98 0.98 0.97 0.97<br />
283 0.81 0.81 0.91 0.91 0.58 0.58 0.89 0.89 0.79 0.79<br />
284 0.81 0.81 0.91 0.91 0.66 0.66 0.89 0.89 0.87 0.87<br />
285 0.88 0.88 0.94 0.94 0.83 0.83 0.91 0.91 0.91 0.91<br />
286 0.85 0.85 0.91 0.91 0.68 0.68 0.96 0.96 0.84 0.84<br />
287 0.85 0.85 0.91 0.91 0.77 0.77 0.96 0.96 0.92 0.92<br />
288 0.92 0.92 0.94 0.94 0.97 0.97 0.98 0.98 0.97 0.97<br />
289 0.81 0.81 0.91 0.91 0.58 0.58 0.89 0.89 0.79 0.79<br />
290 0.81 0.81 0.91 0.91 0.66 0.66 0.89 0.89 0.87 0.87<br />
291 0.88 0.88 0.94 0.94 0.83 0.83 0.91 0.91 0.91 0.91<br />
292 0.85 0.85 0.91 0.91 0.68 0.68 0.96 0.96 0.84 0.84<br />
293 0.85 0.85 0.91 0.91 0.77 0.77 0.96 0.96 0.92 0.92<br />
294 0.92 0.92 0.94 0.94 0.97 0.97 0.98 0.98 0.97 0.97<br />
295 0.85 0.85 0.91 0.91 0.68 0.68 0.96 0.96 0.84 0.84<br />
296 0.85 0.85 0.91 0.91 0.77 0.77 0.96 0.96 0.92 0.92<br />
297 0.92 0.92 0.94 0.94 0.97 0.97 0.98 0.98 0.97 0.97<br />
298 0.85 0.85 0.91 0.91 0.68 0.68 0.96 0.96 0.84 0.84<br />
299 0.85 0.85 0.91 0.91 0.77 0.77 0.96 0.96 0.92 0.92<br />
300 0.92 0.92 0.94 0.94 0.97 0.97 0.98 0.98 0.97 0.97<br />
301 0.83 0.83 0.93 0.93 0.60 0.60 0.91 0.91 0.82 0.82<br />
302 0.83 0.83 0.93 0.93 0.68 0.68 0.91 0.91 0.89 0.89<br />
303 0.90 0.90 0.96 0.96 0.86 0.86 0.93 0.93 0.94 0.94<br />
304 0.86 0.86 0.93 0.93 0.70 0.70 0.98 0.98 0.87 0.87<br />
305 0.86 0.86 0.93 0.93 0.79 0.79 0.98 0.98 0.95 0.95<br />
306 0.94 0.94 0.96 0.96 1.00 1.00 1.00 1.00 1.00 1.00<br />
307 0.83 0.83 0.93 0.93 0.60 0.60 0.91 0.91 0.82 0.82<br />
308 0.83 0.83 0.93 0.93 0.68 0.68 0.91 0.91 0.89 0.89<br />
309 0.90 0.90 0.96 0.96 0.86 0.86 0.93 0.93 0.94 0.94<br />
310 0.86 0.86 0.93 0.93 0.70 0.70 0.98 0.98 0.87 0.87<br />
311 0.86 0.86 0.93 0.93 0.79 0.79 0.98 0.98 0.95 0.95<br />
312 0.94 0.94 0.96 0.96 1.00 1.00 1.00 1.00 1.00 1.00<br />
313 0.83 0.83 0.93 0.93 0.60 0.60 0.91 0.91 0.82 0.82<br />
314 0.83 0.83 0.93 0.93 0.68 0.68 0.91 0.91 0.89 0.89<br />
315 0.90 0.90 0.96 0.96 0.86 0.86 0.93 0.93 0.94 0.94<br />
316 0.86 0.86 0.93 0.93 0.70 0.70 0.98 0.98 0.87 0.87<br />
317 0.86 0.86 0.93 0.93 0.79 0.79 0.98 0.98 0.95 0.95<br />
318 0.94 0.94 0.96 0.96 1.00 1.00 1.00 1.00 1.00 1.00<br />
319 0.83 0.83 0.93 0.93 0.60 0.60 0.91 0.91 0.82 0.82<br />
320 0.83 0.83 0.93 0.93 0.68 0.68 0.91 0.91 0.89 0.89<br />
321 0.90 0.90 0.96 0.96 0.86 0.86 0.93 0.93 0.94 0.94<br />
322 0.86 0.86 0.93 0.93 0.70 0.70 0.98 0.98 0.87 0.87<br />
323 0.86 0.86 0.93 0.93 0.79 0.79 0.98 0.98 0.95 0.95<br />
324 0.94 0.94 0.96 0.96 1.00 1.00 1.00 1.00 1.00 1.00<br />
325 0.86 0.86 0.93 0.93 0.70 0.70 0.98 0.98 0.87 0.87<br />
326 0.86 0.86 0.93 0.93 0.79 0.79 0.98 0.98 0.95 0.95<br />
327 0.94 0.94 0.96 0.96 1.00 1.00 1.00 1.00 1.00 1.00<br />
328 0.86 0.86 0.93 0.93 0.70 0.70 0.98 0.98 0.87 0.87<br />
329 0.86 0.86 0.93 0.93 0.79 0.79 0.98 0.98 0.95 0.95<br />
330 0.94 0.94 0.96 0.96 1.00 1.00 1.00 1.00 1.00 1.00<br />
331 0.85 0.85 0.94 0.94 0.62 0.62 0.93 0.93 0.84 0.84<br />
332 0.85 0.85 0.94 0.94 0.70 0.70 0.93 0.93 0.92 0.92<br />
333 0.92 0.92 0.97 0.97 0.89 0.89 0.95 0.95 0.97 0.97<br />
334 0.88 0.88 0.94 0.94 0.72 0.72 1.00 1.00 0.90 0.90<br />
335 0.88 0.88 0.94 0.94 0.81 0.81 1.00 1.00 0.98 0.98<br />
336 0.96 0.96 0.97 0.97 1.03 1.03 1.02 1.02 1.03 1.03<br />
337 0.85 0.85 0.94 0.94 0.62 0.62 0.93 0.93 0.84 0.84<br />
338 0.85 0.85 0.94 0.94 0.70 0.70 0.93 0.93 0.92 0.92<br />
339 0.92 0.92 0.97 0.97 0.89 0.89 0.95 0.95 0.97 0.97<br />
340 0.88 0.88 0.94 0.94 0.72 0.72 1.00 1.00 0.90 0.90<br />
341 0.88 0.88 0.94 0.94 0.81 0.81 1.00 1.00 0.98 0.98<br />
342 0.96 0.96 0.97 0.97 1.03 1.03 1.02 1.02 1.03 1.03<br />
343 0.85 0.85 0.94 0.94 0.62 0.62 0.93 0.93 0.84 0.84<br />
344 0.85 0.85 0.94 0.94 0.70 0.70 0.93 0.93 0.92 0.92<br />
345 0.92 0.92 0.97 0.97 0.89 0.89 0.95 0.95 0.97 0.97<br />
346 0.88 0.88 0.94 0.94 0.72 0.72 1.00 1.00 0.90 0.90<br />
347 0.88 0.88 0.94 0.94 0.81 0.81 1.00 1.00 0.98 0.98<br />
348 0.96 0.96 0.97 0.97 1.03 1.03 1.02 1.02 1.03 1.03<br />
349 0.85 0.85 0.94 0.94 0.62 0.62 0.93 0.93 0.84 0.84<br />
350 0.85 0.85 0.94 0.94 0.70 0.70 0.93 0.93 0.92 0.92<br />
351 0.92 0.92 0.97 0.97 0.89 0.89 0.95 0.95 0.97 0.97<br />
352 0.88 0.88 0.94 0.94 0.72 0.72 1.00 1.00 0.90 0.90<br />
353 0.88 0.88 0.94 0.94 0.81 0.81 1.00 1.00 0.98 0.98<br />
354 0.96 0.96 0.97 0.97 1.03 1.03 1.02 1.02 1.03 1.03<br />
355 0.88 0.88 0.94 0.94 0.72 0.72 1.00 1.00 0.90 0.90<br />
356 0.88 0.88 0.94 0.94 0.81 0.81 1.00 1.00 0.98 0.98<br />
357 0.96 0.96 0.97 0.97 1.03 1.03 1.02 1.02 1.03 1.03<br />
358 0.88 0.88 0.94 0.94 0.72 0.72 1.00 1.00 0.90 0.90<br />
359 0.88 0.88 0.94 0.94 0.81 0.81 1.00 1.00 0.98 0.98<br />
360 0.96 0.96 0.97 0.97 1.03 1.03 1.02 1.02 1.03 1.03<br />
Attachment IV<br />
Exhibit 1<br />
Page 4
ALLSTATE INDEMNITY COMPANY<br />
PRIVATE PASSENGER AUTO<br />
DELAWARE<br />
TIER FACTORS<br />
Indic<strong>at</strong>ed Selected Indic<strong>at</strong>ed Selected Indic<strong>at</strong>ed Selected Indic<strong>at</strong>ed Selected Indic<strong>at</strong>ed Selected<br />
Tier BI Factor BI Factor PD Factor PD Factor PIP Factor PIP Factor Coll Factor Coll Factor Comp Factor Comp Factor<br />
361 0.87 0.87 0.96 0.96 0.64 0.64 0.95 0.95 0.88 0.88<br />
362 0.87 0.87 0.96 0.96 0.73 0.73 0.95 0.95 0.96 0.96<br />
363 0.94 0.94 0.99 0.99 0.92 0.92 0.97 0.97 1.01 1.01<br />
364 0.90 0.90 0.96 0.96 0.75 0.75 1.02 1.02 0.93 0.93<br />
365 0.90 0.90 0.96 0.96 0.85 0.85 1.02 1.02 1.02 1.02<br />
366 0.98 0.98 0.99 0.99 1.07 1.07 1.04 1.04 1.07 1.07<br />
367 0.87 0.87 0.96 0.96 0.64 0.64 0.95 0.95 0.88 0.88<br />
368 0.87 0.87 0.96 0.96 0.73 0.73 0.95 0.95 0.96 0.96<br />
369 0.94 0.94 0.99 0.99 0.92 0.92 0.97 0.97 1.01 1.01<br />
370 0.90 0.90 0.96 0.96 0.75 0.75 1.02 1.02 0.93 0.93<br />
371 0.90 0.90 0.96 0.96 0.85 0.85 1.02 1.02 1.02 1.02<br />
372 0.98 0.98 0.99 0.99 1.07 1.07 1.04 1.04 1.07 1.07<br />
373 0.87 0.87 0.96 0.96 0.64 0.64 0.95 0.95 0.88 0.88<br />
374 0.87 0.87 0.96 0.96 0.73 0.73 0.95 0.95 0.96 0.96<br />
375 0.94 0.94 0.99 0.99 0.92 0.92 0.97 0.97 1.01 1.01<br />
376 0.90 0.90 0.96 0.96 0.75 0.75 1.02 1.02 0.93 0.93<br />
377 0.90 0.90 0.96 0.96 0.85 0.85 1.02 1.02 1.02 1.02<br />
378 0.98 0.98 0.99 0.99 1.07 1.07 1.04 1.04 1.07 1.07<br />
379 0.87 0.87 0.96 0.96 0.64 0.64 0.95 0.95 0.88 0.88<br />
380 0.87 0.87 0.96 0.96 0.73 0.73 0.95 0.95 0.96 0.96<br />
381 0.94 0.94 0.99 0.99 0.92 0.92 0.97 0.97 1.01 1.01<br />
382 0.90 0.90 0.96 0.96 0.75 0.75 1.02 1.02 0.93 0.93<br />
383 0.90 0.90 0.96 0.96 0.85 0.85 1.02 1.02 1.02 1.02<br />
384 0.98 0.98 0.99 0.99 1.07 1.07 1.04 1.04 1.07 1.07<br />
385 0.90 0.90 0.96 0.96 0.75 0.75 1.02 1.02 0.93 0.93<br />
386 0.90 0.90 0.96 0.96 0.85 0.85 1.02 1.02 1.02 1.02<br />
387 0.98 0.98 0.99 0.99 1.07 1.07 1.04 1.04 1.07 1.07<br />
388 0.90 0.90 0.96 0.96 0.75 0.75 1.02 1.02 0.93 0.93<br />
389 0.90 0.90 0.96 0.96 0.85 0.85 1.02 1.02 1.02 1.02<br />
390 0.98 0.98 0.99 0.99 1.07 1.07 1.04 1.04 1.07 1.07<br />
391 0.88 0.88 0.97 0.97 0.66 0.66 0.97 0.97 0.90 0.90<br />
392 0.88 0.88 0.97 0.97 0.75 0.75 0.97 0.97 0.98 0.98<br />
393 0.96 0.96 1.00 1.00 0.95 0.95 0.99 0.99 1.03 1.03<br />
394 0.92 0.92 0.97 0.97 0.77 0.77 1.04 1.04 0.96 0.96<br />
395 0.92 0.92 0.97 0.97 0.87 0.87 1.04 1.04 1.05 1.05<br />
396 1.00 1.00 1.00 1.00 1.10 1.10 1.06 1.06 1.10 1.10<br />
397 0.88 0.88 0.97 0.97 0.66 0.66 0.97 0.97 0.90 0.90<br />
398 0.88 0.88 0.97 0.97 0.75 0.75 0.97 0.97 0.98 0.98<br />
399 0.96 0.96 1.00 1.00 0.95 0.95 0.99 0.99 1.03 1.03<br />
400 0.92 0.92 0.97 0.97 0.77 0.77 1.04 1.04 0.96 0.96<br />
401 0.92 0.92 0.97 0.97 0.87 0.87 1.04 1.04 1.05 1.05<br />
402 1.00 1.00 1.00 1.00 1.10 1.10 1.06 1.06 1.10 1.10<br />
403 0.88 0.88 0.97 0.97 0.66 0.66 0.97 0.97 0.90 0.90<br />
404 0.88 0.88 0.97 0.97 0.75 0.75 0.97 0.97 0.98 0.98<br />
405 0.96 0.96 1.00 1.00 0.95 0.95 0.99 0.99 1.03 1.03<br />
406 0.92 0.92 0.97 0.97 0.77 0.77 1.04 1.04 0.96 0.96<br />
407 0.92 0.92 0.97 0.97 0.87 0.87 1.04 1.04 1.05 1.05<br />
408 1.00 1.00 1.00 1.00 1.10 1.10 1.06 1.06 1.10 1.10<br />
409 0.88 0.88 0.97 0.97 0.66 0.66 0.97 0.97 0.90 0.90<br />
410 0.88 0.88 0.97 0.97 0.75 0.75 0.97 0.97 0.98 0.98<br />
411 0.96 0.96 1.00 1.00 0.95 0.95 0.99 0.99 1.03 1.03<br />
412 0.92 0.92 0.97 0.97 0.77 0.77 1.04 1.04 0.96 0.96<br />
413 0.92 0.92 0.97 0.97 0.87 0.87 1.04 1.04 1.05 1.05<br />
414 1.00 1.00 1.00 1.00 1.10 1.10 1.06 1.06 1.10 1.10<br />
415 0.92 0.92 0.97 0.97 0.77 0.77 1.04 1.04 0.96 0.96<br />
416 0.92 0.92 0.97 0.97 0.87 0.87 1.04 1.04 1.05 1.05<br />
417 1.00 1.00 1.00 1.00 1.10 1.10 1.06 1.06 1.10 1.10<br />
418 0.92 0.92 0.97 0.97 0.77 0.77 1.04 1.04 0.96 0.96<br />
419 0.92 0.92 0.97 0.97 0.87 0.87 1.04 1.04 1.05 1.05<br />
420 1.00 1.00 1.00 1.00 1.10 1.10 1.06 1.06 1.10 1.10<br />
421 0.90 0.90 0.99 0.99 0.69 0.69 0.98 0.98 0.93 0.93<br />
422 0.90 0.90 0.99 0.99 0.77 0.77 0.98 0.98 1.02 1.02<br />
423 0.98 0.98 1.02 1.02 0.98 0.98 1.00 1.00 1.07 1.07<br />
424 0.94 0.94 0.99 0.99 0.80 0.80 1.06 1.06 0.99 0.99<br />
425 0.94 0.94 0.99 0.99 0.90 0.90 1.06 1.06 1.08 1.08<br />
426 1.02 1.02 1.02 1.02 1.14 1.14 1.08 1.08 1.14 1.14<br />
427 0.90 0.90 0.99 0.99 0.69 0.69 0.98 0.98 0.93 0.93<br />
428 0.90 0.90 0.99 0.99 0.77 0.77 0.98 0.98 1.02 1.02<br />
429 0.98 0.98 1.02 1.02 0.98 0.98 1.00 1.00 1.07 1.07<br />
430 0.94 0.94 0.99 0.99 0.80 0.80 1.06 1.06 0.99 0.99<br />
431 0.94 0.94 0.99 0.99 0.90 0.90 1.06 1.06 1.08 1.08<br />
432 1.02 1.02 1.02 1.02 1.14 1.14 1.08 1.08 1.14 1.14<br />
433 0.90 0.90 0.99 0.99 0.69 0.69 0.98 0.98 0.93 0.93<br />
434 0.90 0.90 0.99 0.99 0.77 0.77 0.98 0.98 1.02 1.02<br />
435 0.98 0.98 1.02 1.02 0.98 0.98 1.00 1.00 1.07 1.07<br />
436 0.94 0.94 0.99 0.99 0.80 0.80 1.06 1.06 0.99 0.99<br />
437 0.94 0.94 0.99 0.99 0.90 0.90 1.06 1.06 1.08 1.08<br />
438 1.02 1.02 1.02 1.02 1.14 1.14 1.08 1.08 1.14 1.14<br />
439 0.90 0.90 0.99 0.99 0.69 0.69 0.98 0.98 0.93 0.93<br />
440 0.90 0.90 0.99 0.99 0.77 0.77 0.98 0.98 1.02 1.02<br />
441 0.98 0.98 1.02 1.02 0.98 0.98 1.00 1.00 1.07 1.07<br />
442 0.94 0.94 0.99 0.99 0.80 0.80 1.06 1.06 0.99 0.99<br />
443 0.94 0.94 0.99 0.99 0.90 0.90 1.06 1.06 1.08 1.08<br />
444 1.02 1.02 1.02 1.02 1.14 1.14 1.08 1.08 1.14 1.14<br />
445 0.94 0.94 0.99 0.99 0.80 0.80 1.06 1.06 0.99 0.99<br />
446 0.94 0.94 0.99 0.99 0.90 0.90 1.06 1.06 1.08 1.08<br />
447 1.02 1.02 1.02 1.02 1.14 1.14 1.08 1.08 1.14 1.14<br />
448 0.94 0.94 0.99 0.99 0.80 0.80 1.06 1.06 0.99 0.99<br />
449 0.94 0.94 0.99 0.99 0.90 0.90 1.06 1.06 1.08 1.08<br />
450 1.02 1.02 1.02 1.02 1.14 1.14 1.08 1.08 1.14 1.14<br />
Attachment IV<br />
Exhibit 1<br />
Page 5
ALLSTATE INDEMNITY COMPANY<br />
PRIVATE PASSENGER AUTO<br />
DELAWARE<br />
TIER FACTORS<br />
Indic<strong>at</strong>ed Selected Indic<strong>at</strong>ed Selected Indic<strong>at</strong>ed Selected Indic<strong>at</strong>ed Selected Indic<strong>at</strong>ed Selected<br />
Tier BI Factor BI Factor PD Factor PD Factor PIP Factor PIP Factor Coll Factor Coll Factor Comp Factor Comp Factor<br />
451 0.92 0.92 1.00 1.00 0.71 0.71 1.00 1.00 0.97 0.97<br />
452 0.92 0.92 1.00 1.00 0.80 0.80 1.00 1.00 1.05 1.05<br />
453 1.00 1.00 1.03 1.03 1.01 1.01 1.02 1.02 1.11 1.11<br />
454 0.96 0.96 1.00 1.00 0.83 0.83 1.08 1.08 1.03 1.03<br />
455 0.96 0.96 1.00 1.00 0.93 0.93 1.08 1.08 1.12 1.12<br />
456 1.04 1.04 1.03 1.03 1.18 1.18 1.10 1.10 1.18 1.18<br />
457 0.92 0.92 1.00 1.00 0.71 0.71 1.00 1.00 0.97 0.97<br />
458 0.92 0.92 1.00 1.00 0.80 0.80 1.00 1.00 1.05 1.05<br />
459 1.00 1.00 1.03 1.03 1.01 1.01 1.02 1.02 1.11 1.11<br />
460 0.96 0.96 1.00 1.00 0.83 0.83 1.08 1.08 1.03 1.03<br />
461 0.96 0.96 1.00 1.00 0.93 0.93 1.08 1.08 1.12 1.12<br />
462 1.04 1.04 1.03 1.03 1.18 1.18 1.10 1.10 1.18 1.18<br />
463 0.92 0.92 1.00 1.00 0.71 0.71 1.00 1.00 0.97 0.97<br />
464 0.92 0.92 1.00 1.00 0.80 0.80 1.00 1.00 1.05 1.05<br />
465 1.00 1.00 1.03 1.03 1.01 1.01 1.02 1.02 1.11 1.11<br />
466 0.96 0.96 1.00 1.00 0.83 0.83 1.08 1.08 1.03 1.03<br />
467 0.96 0.96 1.00 1.00 0.93 0.93 1.08 1.08 1.12 1.12<br />
468 1.04 1.04 1.03 1.03 1.18 1.18 1.10 1.10 1.18 1.18<br />
469 0.92 0.92 1.00 1.00 0.71 0.71 1.00 1.00 0.97 0.97<br />
470 0.92 0.92 1.00 1.00 0.80 0.80 1.00 1.00 1.05 1.05<br />
471 1.00 1.00 1.03 1.03 1.01 1.01 1.02 1.02 1.11 1.11<br />
472 0.96 0.96 1.00 1.00 0.83 0.83 1.08 1.08 1.03 1.03<br />
473 0.96 0.96 1.00 1.00 0.93 0.93 1.08 1.08 1.12 1.12<br />
474 1.04 1.04 1.03 1.03 1.18 1.18 1.10 1.10 1.18 1.18<br />
475 0.96 0.96 1.00 1.00 0.83 0.83 1.08 1.08 1.03 1.03<br />
476 0.96 0.96 1.00 1.00 0.93 0.93 1.08 1.08 1.12 1.12<br />
477 1.04 1.04 1.03 1.03 1.18 1.18 1.10 1.10 1.18 1.18<br />
478 0.96 0.96 1.00 1.00 0.83 0.83 1.08 1.08 1.03 1.03<br />
479 0.96 0.96 1.00 1.00 0.93 0.93 1.08 1.08 1.12 1.12<br />
480 1.04 1.04 1.03 1.03 1.18 1.18 1.10 1.10 1.18 1.18<br />
Attachment IV<br />
Exhibit 1<br />
Page 6
ALLSTATE INDEMNITY COMPANY<br />
PRIVATE PASSENGER AUTO<br />
DELAWARE<br />
CLASS FACTORS<br />
Indic<strong>at</strong>ed Selected Indic<strong>at</strong>ed Selected Indic<strong>at</strong>ed Selected Indic<strong>at</strong>ed Selected Indic<strong>at</strong>ed Selected<br />
Classific<strong>at</strong>ion Mileage Use BI Factor BI Factor PD Factor PD Factor PIP Factor PIP Factor Coll Factor Coll Factor Comp Factor Comp Factor<br />
14-16 Male Single Basic All All 2.00 2.00 2.18 2.18 0.95 0.95 1.76 1.77 1.32 1.32<br />
17 Male Single Basic 1.79 1.79 1.80 1.80 0.95 0.95 1.76 1.77 1.32 1.32<br />
18 Male Single Basic 1.79 1.79 1.58 1.58 0.95 0.95 1.76 1.77 1.32 1.32<br />
19 Male Single Basic 1.39 1.39 1.34 1.34 0.95 0.95 1.76 1.77 1.32 1.32<br />
20 Male Single Basic 1.16 1.16 1.20 1.20 0.95 0.95 1.53 1.53 1.32 1.32<br />
21 Male Single Basic 1.16 1.16 1.10 1.10 0.95 0.95 1.53 1.53 1.32 1.32<br />
22 Male Single Basic 1.09 1.09 1.10 1.10 0.95 0.95 1.29 1.29 1.04 1.04<br />
23 Male Single Basic 1.09 1.09 1.10 1.10 0.95 0.95 1.29 1.29 1.04 1.04<br />
24 Male Single Basic 1.09 1.09 1.10 1.10 0.95 0.95 1.29 1.29 1.04 1.04<br />
14-16 Male Single Restricted All All 1.90 1.90 2.07 2.07 0.95 0.95 1.68 1.68 1.13 1.13<br />
17 Male Single Restricted 1.70 1.70 1.71 1.71 0.95 0.95 1.68 1.68 1.13 1.13<br />
18 Male Single Restricted 1.70 1.70 1.50 1.50 0.95 0.95 1.68 1.68 1.13 1.13<br />
19 Male Single Restricted 1.32 1.32 1.27 1.27 0.95 0.95 1.68 1.68 1.13 1.13<br />
20 Male Single Restricted 1.10 1.10 1.14 1.14 0.95 0.95 1.46 1.46 1.13 1.13<br />
21 Male Single Restricted 1.10 1.10 1.04 1.04 0.95 0.95 1.46 1.46 1.13 1.13<br />
22 Male Single Restricted 1.04 1.04 1.04 1.04 0.95 0.95 1.23 1.24 0.89 0.89<br />
23 Male Single Restricted 1.04 1.04 1.04 1.04 0.95 0.95 1.23 1.24 0.89 0.89<br />
24 Male Single Restricted 1.04 1.04 1.04 1.04 0.95 0.95 1.23 1.24 0.89 0.89<br />
25-29 Male Single Short Pleasure 1.00 1.00 1.04 1.04 1.00 1.00 1.23 1.24 1.21 1.21<br />
Work 0-3 1.00 1.00 1.04 1.04 1.00 1.00 1.23 1.24 1.21 1.21<br />
Work 3.1-9.9 1.00 1.00 1.04 1.04 1.00 1.00 1.23 1.24 1.21 1.21<br />
Work 10-20 1.00 1.00 1.04 1.04 1.00 1.00 1.23 1.24 1.21 1.21<br />
Work 20+ 1.00 1.00 1.04 1.04 1.00 1.00 1.23 1.24 1.21 1.21<br />
Business 1.34 1.34 1.21 1.21 1.00 1.00 1.23 1.24 1.21 1.21<br />
Long Pleasure 1.00 1.00 1.04 1.04 1.00 1.00 1.23 1.24 1.21 1.21<br />
Work 0-3 1.00 1.00 1.04 1.04 1.00 1.00 1.23 1.24 1.21 1.21<br />
Work 3.1-9.9 1.00 1.00 1.04 1.04 1.00 1.00 1.23 1.24 1.21 1.21<br />
Work 10-20 1.00 1.00 1.04 1.04 1.00 1.00 1.23 1.24 1.21 1.21<br />
Work 20+ 1.00 1.00 1.04 1.04 1.00 1.00 1.23 1.24 1.21 1.21<br />
Business 1.34 1.34 1.21 1.21 1.00 1.00 1.23 1.24 1.21 1.21<br />
30-49 Male Single Short Pleasure 1.00 1.00 1.00 1.00 1.00 1.00 1.03 1.03 1.08 1.08<br />
Work 0-3 1.00 1.00 1.00 1.00 1.00 1.00 1.03 1.03 1.08 1.08<br />
Work 3.1-9.9 1.00 1.00 1.00 1.00 1.00 1.00 1.03 1.03 1.08 1.08<br />
Work 10-20 1.00 1.00 1.00 1.00 1.00 1.00 1.03 1.03 1.08 1.08<br />
Work 20+ 1.00 1.00 1.00 1.00 1.00 1.00 1.03 1.03 1.08 1.08<br />
Business 1.34 1.34 1.16 1.16 1.00 1.00 1.03 1.03 1.08 1.08<br />
Long Pleasure 1.00 1.00 1.00 1.00 1.00 1.00 1.03 1.03 1.08 1.08<br />
Work 0-3 1.00 1.00 1.00 1.00 1.00 1.00 1.03 1.03 1.08 1.08<br />
Work 3.1-9.9 1.00 1.00 1.00 1.00 1.00 1.00 1.03 1.03 1.08 1.08<br />
Work 10-20 1.00 1.00 1.00 1.00 1.00 1.00 1.03 1.03 1.08 1.08<br />
Work 20+ 1.00 1.00 1.00 1.00 1.00 1.00 1.03 1.03 1.08 1.08<br />
Business 1.34 1.34 1.16 1.16 1.00 1.00 1.03 1.03 1.08 1.08<br />
14-16 Male Married All All 1.83 1.83 2.07 2.07 0.89 0.89 1.68 1.68 1.16 1.16<br />
17 Male Married 1.64 1.64 1.71 1.71 0.89 0.89 1.68 1.68 1.16 1.16<br />
18 Male Married 1.64 1.64 1.50 1.50 0.89 0.89 1.68 1.68 1.16 1.16<br />
19 Male Married 1.27 1.27 1.27 1.27 0.89 0.89 1.68 1.68 1.16 1.16<br />
20 Male Married 1.06 1.06 1.14 1.14 0.89 0.89 1.46 1.46 1.16 1.16<br />
21 Male Married 1.06 1.06 1.02 1.02 0.89 0.89 1.46 1.46 1.16 1.16<br />
22 Male Married 1.00 1.00 1.02 1.02 0.89 0.89 1.05 1.05 1.12 1.12<br />
23 Male Married 1.00 1.00 1.02 1.02 0.89 0.89 1.05 1.05 1.12 1.12<br />
24 Male Married 1.00 1.00 1.02 1.02 0.89 0.89 1.05 1.05 1.12 1.12<br />
25-29 Male Married Short Pleasure 1.00 1.00 0.93 0.93 1.00 1.00 0.99 0.99 1.12 1.12<br />
Work 0-3 1.00 1.00 0.93 0.93 1.00 1.00 0.99 0.99 1.12 1.12<br />
Work 3.1-9.9 1.00 1.00 0.93 0.93 1.00 1.00 0.99 0.99 1.12 1.12<br />
Work 10-20 1.00 1.00 0.93 0.93 1.00 1.00 0.99 0.99 1.12 1.12<br />
Work 20+ 1.00 1.00 0.93 0.93 1.00 1.00 0.99 0.99 1.12 1.12<br />
Business 1.34 1.34 1.07 1.07 1.00 1.00 0.99 0.99 1.12 1.12<br />
Long Pleasure 1.00 1.00 0.93 0.93 1.00 1.00 0.99 0.99 1.12 1.12<br />
Work 0-3 1.00 1.00 0.93 0.93 1.00 1.00 0.99 0.99 1.12 1.12<br />
Work 3.1-9.9 1.00 1.00 0.93 0.93 1.00 1.00 0.99 0.99 1.12 1.12<br />
Work 10-20 1.00 1.00 0.93 0.93 1.00 1.00 0.99 0.99 1.12 1.12<br />
Work 20+ 1.00 1.00 0.93 0.93 1.00 1.00 0.99 0.99 1.12 1.12<br />
Business 1.34 1.34 1.07 1.07 1.00 1.00 0.99 0.99 1.12 1.12<br />
30-49 Male Married Short Pleasure 1.04 1.00 0.93 0.93 1.00 1.00 0.91 0.91 0.90 0.90<br />
Work 0-3 1.04 1.00 0.93 0.93 1.00 1.00 0.91 0.91 0.90 0.90<br />
Work 3.1-9.9 1.04 1.00 0.93 0.93 1.00 1.00 0.91 0.91 0.90 0.90<br />
Work 10-20 1.04 1.00 0.93 0.93 1.00 1.00 0.91 0.91 0.90 0.90<br />
Work 20+ 1.04 1.00 0.93 0.93 1.00 1.00 0.91 0.91 0.90 0.90<br />
Business 1.40 1.34 1.08 1.08 1.00 1.00 0.91 0.91 0.90 0.90<br />
Long Pleasure 1.04 1.00 0.93 0.93 1.00 1.00 0.91 0.91 0.90 0.90<br />
Work 0-3 1.04 1.00 0.93 0.93 1.00 1.00 0.91 0.91 0.90 0.90<br />
Work 3.1-9.9 1.04 1.00 0.93 0.93 1.00 1.00 0.91 0.91 0.90 0.90<br />
Work 10-20 1.04 1.00 0.93 0.93 1.00 1.00 0.91 0.91 0.90 0.90<br />
Work 20+ 1.04 1.00 0.93 0.93 1.00 1.00 0.91 0.91 0.90 0.90<br />
Business 1.40 1.34 1.08 1.08 1.00 1.00 0.91 0.91 0.90 0.90<br />
14-16 Female Single Basic All All 1.84 1.84 1.84 1.84 1.23 1.23 1.43 1.43 1.02 1.02<br />
17 Female Single Basic 1.43 1.43 1.49 1.49 1.23 1.23 1.43 1.43 1.02 1.02<br />
18 Female Single Basic 1.43 1.43 1.40 1.40 1.23 1.23 1.43 1.43 1.02 1.02<br />
19 Female Single Basic 1.39 1.39 1.24 1.24 1.23 1.23 1.43 1.43 1.02 1.02<br />
20 Female Single Basic 1.16 1.16 1.10 1.10 1.23 1.23 1.22 1.22 1.02 1.02<br />
21 Female Single Basic 1.16 1.16 1.10 1.10 1.23 1.23 1.22 1.22 1.02 1.02<br />
22 Female Single Basic 1.09 1.09 1.10 1.10 1.23 1.23 1.19 1.19 0.91 0.91<br />
23 Female Single Basic 1.09 1.09 1.10 1.10 1.23 1.23 1.19 1.19 0.91 0.91<br />
24 Female Single Basic 1.09 1.09 1.10 1.10 1.23 1.23 1.19 1.19 0.91 0.91<br />
Attachment IV<br />
Exhibit 2<br />
Page 1
ALLSTATE INDEMNITY COMPANY<br />
PRIVATE PASSENGER AUTO<br />
DELAWARE<br />
CLASS FACTORS<br />
Indic<strong>at</strong>ed Selected Indic<strong>at</strong>ed Selected Indic<strong>at</strong>ed Selected Indic<strong>at</strong>ed Selected Indic<strong>at</strong>ed Selected<br />
Classific<strong>at</strong>ion Mileage Use BI Factor BI Factor PD Factor PD Factor PIP Factor PIP Factor Coll Factor Coll Factor Comp Factor Comp Factor<br />
14-16 Female Single Restricted All All 1.75 1.75 1.75 1.75 1.23 1.23 1.36 1.36 0.87 0.87<br />
17 Female Single Restricted 1.36 1.36 1.41 1.41 1.23 1.23 1.36 1.36 0.87 0.87<br />
18 Female Single Restricted 1.36 1.36 1.33 1.33 1.23 1.23 1.36 1.36 0.87 0.87<br />
19 Female Single Restricted 1.32 1.32 1.17 1.17 1.23 1.23 1.36 1.36 0.87 0.87<br />
20 Female Single Restricted 1.10 1.10 1.04 1.04 1.23 1.23 1.16 1.16 0.87 0.87<br />
21 Female Single Restricted 1.10 1.10 1.04 1.04 1.23 1.23 1.16 1.16 0.87 0.87<br />
22 Female Single Restricted 1.04 1.04 1.04 1.04 1.23 1.23 1.14 1.14 0.78 0.78<br />
23 Female Single Restricted 1.04 1.04 1.04 1.04 1.23 1.23 1.14 1.14 0.78 0.78<br />
24 Female Single Restricted 1.04 1.04 1.04 1.04 1.23 1.23 1.14 1.14 0.78 0.78<br />
25-29 Female Single Short Pleasure 1.00 1.00 1.04 1.04 1.07 1.07 1.14 1.14 1.06 1.06<br />
Work 0-3 1.00 1.00 1.04 1.04 1.07 1.07 1.14 1.14 1.06 1.06<br />
Work 3.1-9.9 1.00 1.00 1.04 1.04 1.07 1.07 1.14 1.14 1.06 1.06<br />
Work 10-20 1.00 1.00 1.04 1.04 1.07 1.07 1.14 1.14 1.06 1.06<br />
Work 20+ 1.00 1.00 1.04 1.04 1.07 1.07 1.14 1.14 1.06 1.06<br />
Business 1.34 1.34 1.21 1.21 1.07 1.07 1.14 1.14 1.06 1.06<br />
Long Pleasure 1.00 1.00 1.04 1.04 1.07 1.07 1.14 1.14 1.06 1.06<br />
Work 0-3 1.00 1.00 1.04 1.04 1.07 1.07 1.14 1.14 1.06 1.06<br />
Work 3.1-9.9 1.00 1.00 1.04 1.04 1.07 1.07 1.14 1.14 1.06 1.06<br />
Work 10-20 1.00 1.00 1.04 1.04 1.07 1.07 1.14 1.14 1.06 1.06<br />
Work 20+ 1.00 1.00 1.04 1.04 1.07 1.07 1.14 1.14 1.06 1.06<br />
Business 1.34 1.34 1.21 1.21 1.07 1.07 1.14 1.14 1.06 1.06<br />
30-49 Female Single Short Pleasure 1.00 1.00 1.00 1.00 1.07 1.07 1.00 1.00 1.00 1.00<br />
Work 0-3 1.00 1.00 1.00 1.00 1.07 1.07 1.00 1.00 1.00 1.00<br />
Work 3.1-9.9 1.00 1.00 1.00 1.00 1.07 1.07 1.00 1.00 1.00 1.00<br />
Work 10-20 1.00 1.00 1.00 1.00 1.07 1.07 1.00 1.00 1.00 1.00<br />
Work 20+ 1.00 1.00 1.00 1.00 1.07 1.07 1.00 1.00 1.00 1.00<br />
Business 1.34 1.34 1.16 1.16 1.07 1.07 1.00 1.00 1.00 1.00<br />
Long Pleasure 1.00 1.00 1.00 1.00 1.07 1.07 1.00 1.00 1.00 1.00<br />
Work 0-3 1.00 1.00 1.00 1.00 1.07 1.07 1.00 1.00 1.00 1.00<br />
Work 3.1-9.9 1.00 1.00 1.00 1.00 1.07 1.07 1.00 1.00 1.00 1.00<br />
Work 10-20 1.00 1.00 1.00 1.00 1.07 1.07 1.00 1.00 1.00 1.00<br />
Work 20+ 1.00 1.00 1.00 1.00 1.07 1.07 1.00 1.00 1.00 1.00<br />
Business 1.34 1.34 1.16 1.16 1.07 1.07 1.00 1.00 1.00 1.00<br />
14-16 Female Married All All 1.68 1.68 1.75 1.75 1.15 1.15 1.36 1.36 1.10 1.10<br />
17 Female Married 1.31 1.31 1.41 1.41 1.15 1.15 1.36 1.36 1.10 1.10<br />
18 Female Married 1.31 1.31 1.33 1.33 1.15 1.15 1.36 1.36 1.10 1.10<br />
19 Female Married 1.27 1.27 1.17 1.17 1.15 1.15 1.36 1.36 1.10 1.10<br />
20 Female Married 1.06 1.06 1.01 1.01 1.15 1.15 1.08 1.08 1.10 1.10<br />
21 Female Married 1.06 1.06 1.01 1.01 1.15 1.15 1.08 1.08 1.10 1.10<br />
22 Female Married 0.89 0.89 1.01 1.01 1.15 1.15 1.05 1.05 0.99 0.99<br />
23 Female Married 0.89 0.89 1.01 1.01 1.15 1.15 1.05 1.05 0.99 0.99<br />
24 Female Married 0.89 0.89 1.01 1.01 1.15 1.15 1.05 1.05 0.99 0.99<br />
25-29 Female Married Short Pleasure 0.89 0.89 1.01 1.01 1.07 1.07 0.99 0.99 0.99 0.99<br />
Work 0-3 0.89 0.89 1.01 1.01 1.07 1.07 0.99 0.99 0.99 0.99<br />
Work 3.1-9.9 0.89 0.89 1.01 1.01 1.07 1.07 0.99 0.99 0.99 0.99<br />
Work 10-20 0.89 0.89 1.01 1.01 1.07 1.07 0.99 0.99 0.99 0.99<br />
Work 20+ 0.89 0.89 1.01 1.01 1.07 1.07 0.99 0.99 0.99 0.99<br />
Business 1.19 1.19 1.17 1.17 1.07 1.07 0.99 0.99 0.99 0.99<br />
Long Pleasure 0.89 0.89 1.01 1.01 1.07 1.07 0.99 0.99 0.99 0.99<br />
Work 0-3 0.89 0.89 1.01 1.01 1.07 1.07 0.99 0.99 0.99 0.99<br />
Work 3.1-9.9 0.89 0.89 1.01 1.01 1.07 1.07 0.99 0.99 0.99 0.99<br />
Work 10-20 0.89 0.89 1.01 1.01 1.07 1.07 0.99 0.99 0.99 0.99<br />
Work 20+ 0.89 0.89 1.01 1.01 1.07 1.07 0.99 0.99 0.99 0.99<br />
Business 1.19 1.19 1.17 1.17 1.07 1.07 0.99 0.99 0.99 0.99<br />
30-49 Female Married Short Pleasure 1.09 1.00 0.98 0.98 1.07 1.07 0.96 0.96 0.90 0.90<br />
Work 0-3 1.09 1.00 0.98 0.98 1.07 1.07 0.96 0.96 0.90 0.90<br />
Work 3.1-9.9 1.09 1.00 0.98 0.98 1.07 1.07 0.96 0.96 0.90 0.90<br />
Work 10-20 1.09 1.00 0.98 0.98 1.07 1.07 0.96 0.96 0.90 0.90<br />
Work 20+ 1.09 1.00 0.98 0.98 1.07 1.07 0.96 0.96 0.90 0.90<br />
Business 1.46 1.34 1.14 1.14 1.07 1.07 0.96 0.96 0.90 0.90<br />
Long Pleasure 1.09 1.00 0.98 0.98 1.07 1.07 0.96 0.96 0.90 0.90<br />
Work 0-3 1.09 1.00 0.98 0.98 1.07 1.07 0.96 0.96 0.90 0.90<br />
Work 3.1-9.9 1.09 1.00 0.98 0.98 1.07 1.07 0.96 0.96 0.90 0.90<br />
Work 10-20 1.09 1.00 0.98 0.98 1.07 1.07 0.96 0.96 0.90 0.90<br />
Work 20+ 1.09 1.00 0.98 0.98 1.07 1.07 0.96 0.96 0.90 0.90<br />
Business 1.46 1.34 1.14 1.14 1.07 1.07 0.96 0.96 0.90 0.90<br />
50-54 Single Short Pleasure 1.04 1.03 0.95 0.95 0.86 0.86 0.95 0.95 0.87 0.87<br />
Work 0-3 1.04 1.03 0.95 0.95 0.86 0.86 0.95 0.95 0.87 0.87<br />
Work 3.1-9.9 1.04 1.03 0.95 0.95 0.86 0.86 0.95 0.95 0.87 0.87<br />
Work 10-20 1.04 1.03 0.95 0.95 0.86 0.86 0.95 0.95 0.87 0.87<br />
Work 20+ 1.04 1.03 0.95 0.95 0.86 0.86 0.95 0.95 0.87 0.87<br />
Business 1.40 1.38 1.10 1.10 0.86 0.86 0.95 0.95 0.87 0.87<br />
Long Pleasure 1.04 1.03 0.95 0.95 0.86 0.86 0.95 0.95 0.87 0.87<br />
Work 0-3 1.04 1.03 0.95 0.95 0.86 0.86 0.95 0.95 0.87 0.87<br />
Work 3.1-9.9 1.04 1.03 0.95 0.95 0.86 0.86 0.95 0.95 0.87 0.87<br />
Work 10-20 1.04 1.03 0.95 0.95 0.86 0.86 0.95 0.95 0.87 0.87<br />
Work 20+ 1.04 1.03 0.95 0.95 0.86 0.86 0.95 0.95 0.87 0.87<br />
Business 1.40 1.38 1.10 1.10 0.86 0.86 0.95 0.95 0.87 0.87<br />
55-59 Single Short Pleasure 1.03 1.03 0.92 0.95 0.85 0.85 0.92 0.92 0.87 0.87<br />
Work 0-3 1.03 1.03 0.92 0.95 0.85 0.85 0.92 0.92 0.87 0.87<br />
Work 3.1-9.9 1.03 1.03 0.92 0.95 0.85 0.85 0.92 0.92 0.87 0.87<br />
Work 10-20 1.03 1.03 0.92 0.95 0.85 0.85 0.92 0.92 0.87 0.87<br />
Work 20+ 1.03 1.03 0.92 0.95 0.85 0.85 0.92 0.92 0.87 0.87<br />
Business 1.38 1.38 1.07 1.10 0.85 0.85 0.92 0.92 0.87 0.87<br />
Long Pleasure 1.03 1.03 0.92 0.95 0.85 0.85 0.92 0.92 0.87 0.87<br />
Work 0-3 1.03 1.03 0.92 0.95 0.85 0.85 0.92 0.92 0.87 0.87<br />
Work 3.1-9.9 1.03 1.03 0.92 0.95 0.85 0.85 0.92 0.92 0.87 0.87<br />
Work 10-20 1.03 1.03 0.92 0.95 0.85 0.85 0.92 0.92 0.87 0.87<br />
Work 20+ 1.03 1.03 0.92 0.95 0.85 0.85 0.92 0.92 0.87 0.87<br />
Business 1.38 1.38 1.07 1.10 0.85 0.85 0.92 0.92 0.87 0.87<br />
Attachment IV<br />
Exhibit 2<br />
Page 2
ALLSTATE INDEMNITY COMPANY<br />
PRIVATE PASSENGER AUTO<br />
DELAWARE<br />
CLASS FACTORS<br />
Indic<strong>at</strong>ed Selected Indic<strong>at</strong>ed Selected Indic<strong>at</strong>ed Selected Indic<strong>at</strong>ed Selected Indic<strong>at</strong>ed Selected<br />
Classific<strong>at</strong>ion Mileage Use BI Factor BI Factor PD Factor PD Factor PIP Factor PIP Factor Coll Factor Coll Factor Comp Factor Comp Factor<br />
60-64 Single Short Pleasure 1.03 1.03 0.94 0.94 0.85 0.85 0.91 0.91 0.76 0.76<br />
Work 0-3 1.03 1.03 0.94 0.94 0.85 0.85 0.91 0.91 0.76 0.76<br />
Work 3.1-9.9 1.03 1.03 0.94 0.94 0.85 0.85 0.91 0.91 0.76 0.76<br />
Work 10-20 1.03 1.03 0.94 0.94 0.85 0.85 0.91 0.91 0.76 0.76<br />
Work 20+ 1.03 1.03 0.94 0.94 0.85 0.85 0.91 0.91 0.76 0.76<br />
Business 1.38 1.38 1.10 1.10 0.85 0.85 0.91 0.91 0.76 0.76<br />
Long Pleasure 1.03 1.03 0.94 0.94 0.85 0.85 0.91 0.91 0.76 0.76<br />
Work 0-3 1.03 1.03 0.94 0.94 0.85 0.85 0.91 0.91 0.76 0.76<br />
Work 3.1-9.9 1.03 1.03 0.94 0.94 0.85 0.85 0.91 0.91 0.76 0.76<br />
Work 10-20 1.03 1.03 0.94 0.94 0.85 0.85 0.91 0.91 0.76 0.76<br />
Work 20+ 1.03 1.03 0.94 0.94 0.85 0.85 0.91 0.91 0.76 0.76<br />
Business 1.38 1.38 1.10 1.10 0.85 0.85 0.91 0.91 0.76 0.76<br />
65-70 Single Short All 1.08 1.08 1.03 1.03 0.83 0.83 0.97 0.97 0.76 0.76<br />
71-75 Single 1.18 1.18 1.16 1.16 0.83 0.83 0.98 0.98 0.76 0.76<br />
76-80 Single 1.22 1.22 1.29 1.29 0.72 0.72 1.13 1.13 0.76 0.76<br />
81-85 Single 1.16 1.23 1.51 1.51 0.72 0.72 1.23 1.23 0.76 0.76<br />
86+ Single 1.16 1.23 1.57 1.57 0.72 0.72 1.25 1.25 0.76 0.76<br />
65-70 Single Long All 1.08 1.08 1.03 1.03 0.83 0.83 0.97 0.97 0.76 0.76<br />
71-75 Single 1.18 1.18 1.16 1.16 0.83 0.83 0.98 0.98 0.76 0.76<br />
76-80 Single 1.22 1.22 1.29 1.29 0.72 0.72 1.13 1.13 0.76 0.76<br />
81-85 Single 1.16 1.23 1.51 1.51 0.72 0.72 1.23 1.23 0.76 0.76<br />
86+ Single 1.16 1.23 1.57 1.57 0.72 0.72 1.25 1.25 0.76 0.76<br />
50-54 Married Short Pleasure 1.04 1.03 0.94 0.94 0.94 0.94 0.99 0.91 0.79 0.79<br />
Work 0-3 1.04 1.03 0.94 0.94 0.94 0.94 0.99 0.91 0.79 0.79<br />
Work 3.1-9.9 1.04 1.03 0.94 0.94 0.94 0.94 0.99 0.91 0.79 0.79<br />
Work 10-20 1.04 1.03 0.94 0.94 0.94 0.94 0.99 0.91 0.79 0.79<br />
Work 20+ 1.04 1.03 0.94 0.94 0.94 0.94 0.99 0.91 0.79 0.79<br />
Business 1.40 1.38 1.09 1.09 0.94 0.94 0.99 0.91 0.79 0.79<br />
Long Pleasure 1.04 1.03 0.94 0.94 0.94 0.94 0.99 0.91 0.79 0.79<br />
Work 0-3 1.04 1.03 0.94 0.94 0.94 0.94 0.99 0.91 0.79 0.79<br />
Work 3.1-9.9 1.04 1.03 0.94 0.94 0.94 0.94 0.99 0.91 0.79 0.79<br />
Work 10-20 1.04 1.03 0.94 0.94 0.94 0.94 0.99 0.91 0.79 0.79<br />
Work 20+ 1.04 1.03 0.94 0.94 0.94 0.94 0.99 0.91 0.79 0.79<br />
Business 1.40 1.38 1.09 1.09 0.94 0.94 0.99 0.91 0.79 0.79<br />
55-59 Married Short Pleasure 0.96 0.96 0.94 0.94 0.84 0.84 0.88 0.88 0.79 0.79<br />
Work 0-3 0.96 0.96 0.94 0.94 0.84 0.84 0.88 0.88 0.79 0.79<br />
Work 3.1-9.9 0.96 0.96 0.94 0.94 0.84 0.84 0.88 0.88 0.79 0.79<br />
Work 10-20 0.96 0.96 0.94 0.94 0.84 0.84 0.88 0.88 0.79 0.79<br />
Work 20+ 0.96 0.96 0.94 0.94 0.84 0.84 0.88 0.88 0.79 0.79<br />
Business 1.29 1.29 1.09 1.09 0.84 0.84 0.88 0.88 0.79 0.79<br />
Long Pleasure 0.96 0.96 0.94 0.94 0.84 0.84 0.88 0.88 0.79 0.79<br />
Work 0-3 0.96 0.96 0.94 0.94 0.84 0.84 0.88 0.88 0.79 0.79<br />
Work 3.1-9.9 0.96 0.96 0.94 0.94 0.84 0.84 0.88 0.88 0.79 0.79<br />
Work 10-20 0.96 0.96 0.94 0.94 0.84 0.84 0.88 0.88 0.79 0.79<br />
Work 20+ 0.96 0.96 0.94 0.94 0.84 0.84 0.88 0.88 0.79 0.79<br />
Business 1.29 1.29 1.09 1.09 0.84 0.84 0.88 0.88 0.79 0.79<br />
60-64 Married Short Pleasure 0.93 0.93 0.88 0.88 0.84 0.84 0.92 0.88 0.77 0.77<br />
Work 0-3 0.93 0.93 0.88 0.88 0.84 0.84 0.92 0.88 0.77 0.77<br />
Work 3.1-9.9 0.93 0.93 0.88 0.88 0.84 0.84 0.92 0.88 0.77 0.77<br />
Work 10-20 0.93 0.93 0.88 0.88 0.84 0.84 0.92 0.88 0.77 0.77<br />
Work 20+ 0.93 0.93 0.88 0.88 0.84 0.84 0.92 0.88 0.77 0.77<br />
Business 1.24 1.24 1.02 1.02 0.84 0.84 0.92 0.88 0.77 0.77<br />
Long Pleasure 0.93 0.93 0.88 0.88 0.84 0.84 0.92 0.88 0.77 0.77<br />
Work 0-3 0.93 0.93 0.88 0.88 0.84 0.84 0.92 0.88 0.77 0.77<br />
Work 3.1-9.9 0.93 0.93 0.88 0.88 0.84 0.84 0.92 0.88 0.77 0.77<br />
Work 10-20 0.93 0.93 0.88 0.88 0.84 0.84 0.92 0.88 0.77 0.77<br />
Work 20+ 0.93 0.93 0.88 0.88 0.84 0.84 0.92 0.88 0.77 0.77<br />
Business 1.24 1.24 1.02 1.02 0.84 0.84 0.92 0.88 0.77 0.77<br />
65-70 Married Short All 1.08 1.08 0.97 0.97 0.78 0.78 0.89 0.89 0.77 0.77<br />
71-75 Married 1.18 1.18 1.09 1.09 0.78 0.78 0.90 0.90 0.68 0.68<br />
76-80 Married 1.22 1.22 1.21 1.21 0.68 0.68 1.03 1.03 0.68 0.68<br />
81-85 Married 1.16 1.22 1.42 1.42 0.68 0.68 1.12 1.12 0.68 0.68<br />
86+ Married 1.16 1.22 1.47 1.47 0.68 0.68 1.14 1.14 0.68 0.68<br />
65-70 Married Long All 1.08 1.08 0.97 0.97 0.78 0.78 0.89 0.89 0.77 0.77<br />
71-75 Married 1.18 1.18 1.09 1.09 0.78 0.78 0.90 0.90 0.68 0.68<br />
76-80 Married 1.22 1.22 1.21 1.21 0.68 0.68 1.03 1.03 0.68 0.68<br />
81-85 Married 1.16 1.22 1.42 1.42 0.68 0.68 1.12 1.12 0.68 0.68<br />
86+ Married 1.16 1.22 1.47 1.47 0.68 0.68 1.14 1.14 0.68 0.68<br />
Extra Vehicles 1.08 1.08 1.02 1.02 1.15 1.15 1.07 1.07 0.97 0.97<br />
Attachment IV<br />
Exhibit 2<br />
Page 3
ALLSTATE INDEMNITY COMPANY<br />
PRIVATE PASSENGER AUTO<br />
DELAWARE<br />
INEXPERIENCED OPERATOR FACTORS<br />
Years Indic<strong>at</strong>ed Selected Indic<strong>at</strong>ed Selected Indic<strong>at</strong>ed Selected<br />
Age Licensed BI Factor BI Factor PD Factor PD Factor Coll Factor Coll Factor<br />
14-16 0 - 1 1.00 1.00 1.00 1.00 1.00 1.00<br />
14-16 1 - 2 1.00 1.00 1.00 1.00 1.00 1.00<br />
14-16 2 - 3 1.00 1.00 1.00 1.00 1.00 1.00<br />
14-16 3+ 1.00 1.00 1.00 1.00 1.00 1.00<br />
17 0 - 1 1.38 1.38 1.21 1.21 1.27 1.27<br />
17 1 - 2 1.29 1.29 1.21 1.21 1.19 1.19<br />
17 2 - 3 1.29 1.29 1.10 1.10 1.11 1.11<br />
17 3+ 1.00 1.00 1.00 1.00 1.00 1.00<br />
18 0 - 1 1.38 1.38 1.21 1.21 1.27 1.27<br />
18 1 - 2 1.29 1.29 1.21 1.21 1.19 1.19<br />
18 2 - 3 1.29 1.29 1.10 1.10 1.11 1.11<br />
18 3+ 1.00 1.00 1.00 1.00 1.00 1.00<br />
19 0 - 1 1.38 1.38 1.21 1.21 1.27 1.27<br />
19 1 - 2 1.29 1.29 1.21 1.21 1.19 1.19<br />
19 2 - 3 1.29 1.29 1.10 1.10 1.11 1.11<br />
19 3+ 1.00 1.00 1.00 1.00 1.00 1.00<br />
20 0 - 1 1.38 1.38 1.21 1.21 1.27 1.27<br />
20 1 - 2 1.29 1.29 1.21 1.21 1.19 1.19<br />
20 2 - 3 1.29 1.29 1.10 1.10 1.11 1.11<br />
20 3+ 1.00 1.00 1.00 1.00 1.00 1.00<br />
21+ 0 - 1 1.38 1.38 1.21 1.21 1.27 1.27<br />
21+ 1 - 2 1.29 1.29 1.21 1.21 1.19 1.19<br />
21+ 2 - 3 1.29 1.29 1.10 1.10 1.11 1.11<br />
21+ 3+ 1.00 1.00 1.00 1.00 1.00 1.00<br />
Attachment IV<br />
Exhibit 3<br />
Page 1
ALLSTATE INDEMNITY COMPANY<br />
PRIVATE PASSENGER AUTO<br />
DELAWARE<br />
HOUSEHOLD COMPOSITION FACTORS<br />
Household Indic<strong>at</strong>ed Selected Indic<strong>at</strong>ed Selected Indic<strong>at</strong>ed Selected Indic<strong>at</strong>ed Selected Indic<strong>at</strong>ed Selected<br />
Composition BI Factor BI Factor PD Factor PD Factor PIP Factor PIP Factor Coll Factor Coll Factor Comp Factor Comp Factor<br />
14-20, 1car/1oper<strong>at</strong>or 1.39 1.39 1.60 1.60 1.00 1.00 1.49 1.49 1.53 1.53<br />
14-20, 2cars/1oper<strong>at</strong>or 1.00 1.00 1.05 1.05 0.64 0.64 1.63 1.63 1.61 1.74<br />
14-20, 3cars/1oper<strong>at</strong>or 1.00 1.00 1.05 1.05 0.43 0.43 1.11 1.11 1.61 1.74<br />
14-20, 4cars/1oper<strong>at</strong>or 1.00 1.00 1.05 1.05 0.43 0.43 1.11 1.11 1.61 1.74<br />
21-24, 1car/1oper<strong>at</strong>or 1.25 1.25 1.26 1.26 1.00 1.00 1.32 1.32 1.33 1.33<br />
21-24, 2cars/1oper<strong>at</strong>or 0.82 0.82 0.88 0.88 0.64 0.64 1.20 1.20 1.76 1.74<br />
21-24, 3cars/1oper<strong>at</strong>or 0.82 0.82 0.88 0.88 0.43 0.43 0.93 0.93 1.76 1.74<br />
21-24, 4cars/1oper<strong>at</strong>or 0.82 0.82 0.88 0.88 0.43 0.43 0.93 0.93 1.76 1.74<br />
25+, 1car/1oper<strong>at</strong>or 1.00 1.00 1.00 1.00 1.00 1.00 1.00 1.00 1.00 1.00<br />
25+ 2cars/1oper<strong>at</strong>or 0.75 0.75 0.79 0.79 0.64 0.64 0.87 0.87 1.04 1.04<br />
25+, 3cars/1oper<strong>at</strong>or 0.75 0.75 0.79 0.79 0.43 0.43 0.75 0.75 1.04 1.04<br />
25+, 4cars/1oper<strong>at</strong>or 0.75 0.75 0.79 0.79 0.43 0.43 0.75 0.75 1.04 1.04<br />
14-20, 1car/2oper<strong>at</strong>ors 1.14 1.14 1.37 1.37 1.13 1.13 1.34 1.34 1.48 1.48<br />
14-20, 2cars/2oper<strong>at</strong>ors 0.94 0.94 1.07 1.07 0.82 0.82 1.16 1.16 1.03 1.03<br />
14-20, 3cars/2oper<strong>at</strong>ors 1.00 1.00 1.05 1.05 0.64 0.64 1.11 1.11 1.07 1.10<br />
14-20, 4cars/2oper<strong>at</strong>ors 1.00 1.00 1.05 1.05 0.43 0.43 1.11 1.11 1.00 1.14<br />
21-24, 1car/2oper<strong>at</strong>ors 1.00 1.00 1.05 1.05 1.13 1.13 1.06 1.06 1.30 1.30<br />
21-24, 2cars/2oper<strong>at</strong>ors 0.82 0.82 0.91 0.91 0.82 0.82 0.98 0.98 1.03 1.03<br />
21-24, 3cars/2oper<strong>at</strong>ors 0.82 0.82 0.88 0.88 0.64 0.64 0.93 0.93 1.12 1.10<br />
21-24, 4cars/2oper<strong>at</strong>ors 0.82 0.82 0.88 0.88 0.43 0.43 0.93 0.93 1.20 1.14<br />
25+, 1car/2oper<strong>at</strong>ors 0.86 0.86 0.94 0.94 1.14 1.14 0.91 0.91 1.04 1.04<br />
25+ 2cars/2oper<strong>at</strong>ors 0.74 0.74 0.80 0.80 0.82 0.82 0.80 0.80 0.90 0.90<br />
25+, 3cars/2oper<strong>at</strong>ors 0.75 0.75 0.79 0.79 0.64 0.64 0.75 0.75 1.04 1.04<br />
25+, 4cars/2oper<strong>at</strong>ors 0.75 0.75 0.79 0.79 0.43 0.43 0.75 0.75 1.04 1.04<br />
14-20, 1car/3oper<strong>at</strong>ors 1.23 1.23 1.46 1.46 1.13 1.13 1.30 1.30 1.48 1.48<br />
14-20, 2cars/3oper<strong>at</strong>ors 1.14 1.14 1.14 1.14 0.91 0.91 1.15 1.15 1.00 1.08<br />
14-20, 3cars/3oper<strong>at</strong>ors 0.93 0.93 1.08 1.08 0.68 0.68 1.09 1.09 1.00 1.08<br />
14-20, 4cars/3oper<strong>at</strong>ors 1.00 1.00 1.05 1.05 0.64 0.64 1.11 1.11 1.00 1.08<br />
21-24, 1car/3oper<strong>at</strong>ors 1.24 1.23 1.12 1.12 1.13 1.13 1.18 1.18 1.30 1.30<br />
21-24, 2cars/3oper<strong>at</strong>ors 1.00 1.00 0.88 0.88 0.91 0.91 1.01 1.01 1.20 1.08<br />
21-24, 3cars/3oper<strong>at</strong>ors 0.79 0.80 0.91 0.91 0.68 0.68 1.03 1.03 1.20 1.08<br />
21-24, 4cars/3oper<strong>at</strong>ors 0.82 0.82 0.88 0.88 0.64 0.64 0.93 0.93 1.20 1.08<br />
25+, 1car/3oper<strong>at</strong>ors 1.19 1.19 1.01 1.01 1.13 1.13 1.01 1.01 1.04 1.04<br />
25+ 2cars/3oper<strong>at</strong>ors 0.86 0.86 0.86 0.86 0.91 0.91 0.89 0.89 1.04 1.04<br />
25+, 3cars/3oper<strong>at</strong>ors 0.81 0.81 0.80 0.80 0.68 0.68 0.86 0.86 1.04 1.04<br />
25+, 4cars/3oper<strong>at</strong>ors 0.75 0.75 0.79 0.79 0.64 0.64 0.75 0.75 1.04 1.04<br />
14-20, 1car/4oper<strong>at</strong>ors 1.23 1.23 1.46 1.46 1.13 1.13 1.30 1.30 1.48 1.48<br />
14-20, 2cars/4oper<strong>at</strong>ors 1.23 1.23 1.46 1.46 0.91 0.91 1.30 1.30 1.07 1.09<br />
14-20, 3cars/4oper<strong>at</strong>ors 1.14 1.14 1.14 1.14 0.91 0.91 1.15 1.15 1.07 1.09<br />
14-20, 4cars/4oper<strong>at</strong>ors 0.93 0.93 1.08 1.08 0.68 0.68 1.09 1.09 1.07 1.09<br />
21-24, 1car/4oper<strong>at</strong>ors 1.24 1.23 1.12 1.12 1.13 1.13 1.18 1.18 1.30 1.30<br />
21-24, 2cars/4oper<strong>at</strong>ors 1.24 1.23 1.12 1.12 0.91 0.91 1.18 1.18 1.12 1.09<br />
21-24, 3cars/4oper<strong>at</strong>ors 1.00 1.00 0.88 0.88 0.91 0.91 1.01 1.01 1.12 1.09<br />
21-24, 4cars/4oper<strong>at</strong>ors 0.79 0.80 0.91 0.91 0.68 0.68 1.03 1.03 1.12 1.09<br />
25+, 1car/4oper<strong>at</strong>ors 1.19 1.19 1.01 1.01 1.13 1.13 1.01 1.01 1.04 1.04<br />
25+ 2cars/4oper<strong>at</strong>ors 1.19 1.19 1.01 1.01 0.91 0.91 1.01 1.01 1.04 1.04<br />
25+, 3cars/4oper<strong>at</strong>ors 0.86 0.86 0.86 0.86 0.91 0.91 0.89 0.89 1.04 1.04<br />
25+, 4cars/4oper<strong>at</strong>ors 0.81 0.81 0.80 0.80 0.68 0.68 0.86 0.86 1.04 1.04<br />
Attachment IV<br />
Exhibit 4<br />
Page 1
ALLSTATE INDEMNITY COMPANY<br />
PRIVATE PASSENGER AUTO<br />
DELAWARE<br />
ACCIDENT FACTORS<br />
Age of # Accidents - Indic<strong>at</strong>ed Selected Indic<strong>at</strong>ed Selected Indic<strong>at</strong>ed Selected Indic<strong>at</strong>ed Selected<br />
R<strong>at</strong>ed Oper<strong>at</strong>or Years since most recent BI Factor BI Factor PD Factor PD Factor PIP Factor PIP Factor Coll Factor Coll Factor<br />
ALL 0 1.00 1.00 1.00 1.00 1.00 1.00 1.00 1.00<br />
age
ALLSTATE INDEMNITY COMPANY<br />
PRIVATE PASSENGER AUTO<br />
DELAWARE<br />
MINOR VIOLATION FACTORS<br />
Age of # Minor Viol<strong>at</strong>ions - Indic<strong>at</strong>ed Selected Indic<strong>at</strong>ed Selected Indic<strong>at</strong>ed Selected Indic<strong>at</strong>ed Selected<br />
R<strong>at</strong>ed Oper<strong>at</strong>or Years since most recent BI Factor BI Factor PD Factor PD Factor PIP Factor PIP Factor Coll Factor Coll Factor<br />
ALL 0 1.00 1.00 1.00 1.00 1.00 1.00 1.00 1.00<br />
age
ALLSTATE INDEMNITY COMPANY<br />
PRIVATE PASSENGER AUTO<br />
DELAWARE<br />
DISCOUNTS<br />
Indic<strong>at</strong>ed Selected Indic<strong>at</strong>ed Selected Indic<strong>at</strong>ed Selected Indic<strong>at</strong>ed Selected Indic<strong>at</strong>ed Selected<br />
Discounts BI Factor BI Factor PD Factor PD Factor PIP Factor PIP Factor Coll Factor Coll Factor Comp Factor Comp Factor<br />
RESIDENT STUDENT DISCOUNT 0.90 0.90 0.88 0.88 N/A N/A 0.97 0.97 N/A N/A<br />
GOOD STUDENT DISCOUNT 0.92 0.90 0.99 0.90 N/A 0.90 0.84 0.90 N/A 0.90<br />
FUTURE EFFECTIVE DATE DISCOUNT 0.98 0.95 1.00 0.95 0.95 0.95 1.03 0.95 0.98 0.95<br />
GOOD PAYER DISCOUNT 0.84 0.90 0.87 0.90 0.87 0.90 0.84 0.90 0.87 0.90<br />
ALLSTATE EASY PAY PLAN DISCOUNT 0.89 0.95 1.11 0.95 0.68 0.95 0.94 0.95 0.93 0.95<br />
HOMEOWNERSHIP DISCOUNT 0.98 0.95 0.97 0.95 0.98 0.95 0.98 0.95 1.00 0.95<br />
PERFORMANCE DISCOUNT 0.98 0.98 0.95 0.95 1.00 1.00 0.97 0.97 0.94 0.94<br />
MULTIPLE POLICY DISCOUNT 0.92 0.92 0.95 0.95 0.80 0.80 0.92 0.92 0.85 0.85<br />
Attachment IV<br />
Exhibit 7<br />
Page 1
ALLSTATE INDEMNITY COMPANY<br />
PRIVATE PASSENGER AUTO<br />
DELAWARE<br />
INCREASED LIMIT FACTORS<br />
Indic<strong>at</strong>ed Selected<br />
Limit PD Factor PD Factor<br />
10,000 0.910 0.910<br />
25,000 1.000 1.000<br />
50,000 1.065 1.065<br />
100,000 1.130 1.130<br />
200,000 1.195 1.195<br />
300,000 1.236 1.236<br />
400,000 1.277 1.277<br />
500,000 1.319 1.319<br />
750,000 1.360 1.360<br />
1,000,000 1.401 1.401<br />
2,000,000 1.545 1.545<br />
Note: PD ILFs for 300,000 and up were determined based<br />
on the current factor rel<strong>at</strong>ivity between the respective PD<br />
ILF and the 200,000 PD ILF. This rel<strong>at</strong>ivity was then<br />
applied to the proposed 200,000 PD ILF in order to<br />
maintain a similar rel<strong>at</strong>ionship between limits<br />
Attachment IV<br />
Exhibit 8<br />
Page 1
ATTACHMENT V<br />
Summary of Manual Changes
R<strong>at</strong>es Manual:<br />
ALLSTATE INDEMNITY COMPANY<br />
PRIVATE PASSENGER AUTO<br />
DELAWARE<br />
SUMMARY OF MANUAL CHANGES<br />
RP-1A Revised R<strong>at</strong>e Adjustment Factors<br />
RP-3A Revised Property Damage Increase Limit Factors<br />
RP-4A – RP-8A Revised Driver Classific<strong>at</strong>ion Factors<br />
RP-9A Revised Household Composition Factors<br />
RP-10A Added 2010, 2011 and 2012 Model Year Factors<br />
RP-12A Revised Accident Factors<br />
RP-13A Revised Minor Viol<strong>at</strong>ion Factors<br />
RP-15A –<br />
RP-21A<br />
Revised Discount and Surcharge R<strong>at</strong>ing Factors<br />
Revised Tier Factors<br />
Attachment V<br />
Page 1
Bulletin 23
ALLSTATE INDEMNITY COMPANY<br />
PRIVATE PASSENGER AUTOMOBILE<br />
DATA REQUIREMENTS FOR FILINGS OF MANUAL RATES<br />
FORMS AND RATES BULLETIN 23<br />
DELAWARE<br />
Bulletin 23<br />
Page 1<br />
Below are Allst<strong>at</strong>e Indemnity Company’s responses to <strong>Delaware</strong>’s Forms and R<strong>at</strong>es Bulletin 23<br />
revised on September 23, 2002.<br />
1. Earned Premium<br />
Page 3 of this <strong>at</strong>tachment contains earned premium on an actual and on a current r<strong>at</strong>e<br />
level basis. Allst<strong>at</strong>e uses a methodology th<strong>at</strong> assumes th<strong>at</strong> exposures are written<br />
uniformly by month, using a procedure described in a discussion by Frank Karlinksi of<br />
the paper entitled “A Refined Model for Premium Adjustment,” by David Miller and<br />
George Davis. (Mr. Karlinski’s discussion appeared in the Proceedings of the Casualty<br />
Actuarial Society (PCAS), Vol. LXIV, 1977, and the paper by Miller and Davis appeared<br />
in the PCAS, Vol. LXIII, 1976.)<br />
2. Loss & Loss Adjustment Expenses (LAE) R<strong>at</strong>io<br />
Pertinent calcul<strong>at</strong>ions of the r<strong>at</strong>e level as well as explan<strong>at</strong>ions of the methodologies used,<br />
and background exhibits are provided in Attachments I through III of the filing packet.<br />
Attachment II describes the adjustments to the incurred loss and alloc<strong>at</strong>ed loss adjustment<br />
expense (ALAE) d<strong>at</strong>a in the “Adjustments to Losses” section of the memo. Pages 4<br />
through 39 of this <strong>at</strong>tachment provide loss development triangles for both paid and<br />
incurred loss and ALAE for <strong>Delaware</strong> and countrywide, with the countrywide d<strong>at</strong>a<br />
including only tort st<strong>at</strong>es. The calcul<strong>at</strong>ion of ULAE factors for liability and physical<br />
damage coverages can be found in Attachment III, Exhibit 6. Attachment III,<br />
Exhibits 3.1 through 5 provide the calcul<strong>at</strong>ion of Ultim<strong>at</strong>e Loss and Loss Adjustment<br />
Expenses by Coverage by year.<br />
3. Permissible Loss and Loss Adjustment Expense (LAE) R<strong>at</strong>io<br />
Pages 40 and 41 of this <strong>at</strong>tachment provide taxes, licenses and fees for <strong>Delaware</strong>. Page<br />
42 of this <strong>at</strong>tachment provides the deriv<strong>at</strong>ion of the commission and brokerage expense<br />
provision. The countrywide experience for other acquisition expenses and general<br />
expenses can be found in Attachment III, Exhibits 11 and 12. Page 43 of this<br />
<strong>at</strong>tachment shows the development of the expected loss and loss adjustment expense<br />
r<strong>at</strong>ios used in the r<strong>at</strong>e level calcul<strong>at</strong>ions. Investment income is reflected in the<br />
underwriting profit provision which is used to determine the permissible loss and LAE<br />
r<strong>at</strong>io. The determin<strong>at</strong>ion of the underwriting profit provisions is shown on Exhibits 14.1<br />
and 14.2 of Attachment III.
4. Investment Income<br />
Bulletin 23<br />
Page 2<br />
Allst<strong>at</strong>e does not calcul<strong>at</strong>e investment income according to the “St<strong>at</strong>e X” Method. Please<br />
see number six of this memo, Exceptions, where reference is made to the calcul<strong>at</strong>ion of<br />
the investment income.<br />
5. R<strong>at</strong>ing System Changes<br />
Please see page 44 of this <strong>at</strong>tachment for the premium effect of all changes to the present<br />
r<strong>at</strong>ing system by coverage. Justific<strong>at</strong>ion for proposed r<strong>at</strong>ing plan upd<strong>at</strong>es for Bodily<br />
Injury, Property Damage, Personal Injury Protection, Uninsured / Underinsured Motorist,<br />
Collision, and Comprehensive coverages is provided in Attachment IV.<br />
6. Exceptions<br />
Investment Income – Please see pages 7 and 8 of Attachment II and Exhibits 14.1 and<br />
14.2 of Attachment III for a description and exhibits supporting Allst<strong>at</strong>e’s method of<br />
calcul<strong>at</strong>ing after-tax oper<strong>at</strong>ing profit provision.
ALLSTATE INDEMNITY COMPANY<br />
PRIVATE PASSENGER AUTOMOBILE<br />
DELAWARE<br />
EARNED PREMIUM<br />
Bulletin 23<br />
Page 3<br />
2010 Actual Adjusted Factor to Earned Premium<br />
Earned<br />
Earned Current R<strong>at</strong>e <strong>at</strong> Current R<strong>at</strong>e<br />
Premium Premium* Level<br />
Level<br />
Bodily Injury 616,628 627,218 1.0000 627,218<br />
Property Damage 329,153 339,156 1.0000 339,156<br />
Personal Injury Protection 393,106 393,921 1.0000 393,921<br />
Uninsured Motorist 114,462 114,462 1.0000 114,462<br />
Collision 325,505 330,307 1.0000 330,307<br />
Comprehensive 147,262 152,806 1.0000 152,806<br />
*Premiums adjusted due to a refund-rel<strong>at</strong>ed d<strong>at</strong>a issue in January 2010. A smoothing adjustment was made by<br />
setting January 2010 premium equal to the average of December 2009 and February 2010 premium.
Bulletin 23<br />
Page 4<br />
Accident<br />
Paid Loss*<br />
Year Ending Mar. 15 Months 27 Months 39 Months 51 Months 63 Months 75 Months 87 Months 99 Months 111 Months 123 Months<br />
1998 359,239 1,083,050 1,707,157 1,974,454 2,034,879 2,041,998 2,041,998 2,041,998 2,041,998 2,041,998<br />
1999 294,538 859,780 1,449,744 1,579,422 1,677,063 1,692,063 1,702,063 1,702,063 1,702,063 1,702,063<br />
2000 280,611 718,948 1,093,015 1,379,603 1,397,686 1,445,536 1,460,466 1,460,466 1,460,466 1,460,466<br />
2001 260,685 533,161 684,718 764,962 773,712 808,712 808,712 808,712 808,712 808,712<br />
2002 93,952 350,516 530,934 662,258 675,758 675,758 675,758 675,758 675,758<br />
2003 77,841 218,707 260,280 273,874 273,874 273,874 273,874 273,874<br />
2004 18,795 66,764 147,637 151,527 151,527 151,527 151,527<br />
2005 21,971 91,559 106,559 106,559 106,559 106,559<br />
2006 12,695 35,425 36,425 36,425 36,425<br />
2007 66,526 90,885 112,779 127,779<br />
2008 21,381 44,738 70,536<br />
2009 97,163 196,528<br />
2010 73,974<br />
LOSS DEVELOPMENT FACTORS<br />
Development 15 to 27 27 to 39 39 to 51 51 to 63 63 to 75 75 to 87 87 to 99 99 to 111 111 to 123<br />
3rd Prior 2.790 1.164 1.026 1.000 1.000 1.000 1.000 1.000 1.000<br />
2nd Prior 1.366 1.028 1.000 1.000 1.000 1.000 1.000 1.000 1.000<br />
1st Prior 2.092 1.241 1.000 1.000 1.000 1.000 1.000 1.000 1.000<br />
L<strong>at</strong>est 2.023 1.577 1.133 1.000 1.000 1.000 1.000 1.000 1.000<br />
Average 2.068 1.252 1.040 1.000 1.000 1.000 1.000 1.000 1.000<br />
*Excludes Paid Alloc<strong>at</strong>ed Expense<br />
Loss Development Factors 15 to 159 months = 2.693<br />
27 to 159 months = 1.302<br />
39 to 159 months = 1.040<br />
51 to 159 months = 1.000<br />
ALLSTATE INDEMNITY COMPANY<br />
DELAWARE<br />
Calcul<strong>at</strong>ion of Loss Development Factors<br />
BODILY INJURY
Bulletin 23<br />
Page 5<br />
Accident<br />
Paid Loss*<br />
Year Ending Mar. 15 Months 27 Months 39 Months 51 Months 63 Months 75 Months 87 Months 99 Months 111 Months 123 Months<br />
1998 828,080 986,689 1,028,050 1,034,144 1,042,124 1,042,124 1,042,124 1,042,124 1,042,124 1,042,124<br />
1999 927,471 1,051,295 1,094,654 1,098,996 1,098,996 1,098,996 1,098,996 1,098,996 1,098,996 1,098,996<br />
2000 814,053 913,381 932,107 932,107 932,107 937,107 937,107 937,107 937,107 937,107<br />
2001 431,060 469,681 474,282 474,282 474,282 474,282 474,282 474,282 474,282 474,282<br />
2002 379,233 411,618 422,614 424,561 424,561 424,561 424,561 424,561 424,561<br />
2003 187,214 218,256 218,256 218,256 218,256 218,256 218,256 218,256<br />
2004 97,585 108,446 109,166 109,166 109,166 109,166 109,166<br />
2005 131,084 141,273 141,273 141,273 141,273 141,273<br />
2006 54,050 54,050 54,050 54,050 54,050<br />
2007 93,589 115,071 121,903 121,903<br />
2008 86,878 92,081 92,081<br />
2009 190,039 254,060<br />
2010 307,498<br />
LOSS DEVELOPMENT FACTORS<br />
Development 15 to 27 27 to 39 39 to 51 51 to 63 63 to 75 75 to 87 87 to 99 99 to 111 111 to 123<br />
3rd Prior 1.000 1.000 1.000 1.000 1.000 1.000 1.000 1.000 1.000<br />
2nd Prior 1.230 1.000 1.000 1.000 1.000 1.000 1.000 1.000 1.000<br />
1st Prior 1.060 1.059 1.000 1.000 1.000 1.000 1.000 1.000 1.000<br />
L<strong>at</strong>est 1.337 1.000 1.000 1.000 1.000 1.000 1.000 1.000 1.000<br />
Average 1.157 1.015 1.000 1.000 1.000 1.000 1.000 1.000 1.000<br />
*Excludes Paid Alloc<strong>at</strong>ed Expense<br />
Loss Development Factors 15 to 123 months = 1.174<br />
27 to 123 months = 1.015<br />
39 to 123 months = 1.000<br />
51 to 123 months = 1.000<br />
ALLSTATE INDEMNITY COMPANY<br />
DELAWARE<br />
Calcul<strong>at</strong>ion of Loss Development Factors<br />
PROPERTY DAMAGE
Bulletin 23<br />
Page 6<br />
Accident<br />
Paid Loss*<br />
Year Ending Mar. 15 Months 27 Months 39 Months 51 Months 63 Months 75 Months 87 Months 99 Months 111 Months 123 Months<br />
1998 1,720,375 1,963,205 1,845,734 1,816,099 1,802,781 1,806,036 1,806,802 1,806,802 1,806,802 1,811,768<br />
1999 1,523,832 1,826,234 1,631,229 1,572,526 1,562,716 1,532,635 1,532,635 1,532,635 1,532,635 1,532,635<br />
2000 1,163,358 1,309,039 1,111,420 1,039,316 1,024,644 1,024,644 1,024,644 1,024,644 1,025,163 1,025,163<br />
2001 643,830 701,493 694,053 643,465 628,229 628,229 628,582 628,582 628,582 628,582<br />
2002 399,293 412,502 365,515 338,303 338,303 338,303 338,303 338,303 338,303<br />
2003 207,218 236,807 221,706 198,788 167,133 167,133 167,133 160,012<br />
2004 183,116 206,294 202,923 195,423 195,423 195,423 195,423<br />
2005 90,109 99,315 70,070 58,283 58,283 58,283<br />
2006 36,750 38,507 38,507 19,600 20,958<br />
2007 78,327 96,027 78,071 81,312<br />
2008 36,675 15,882 15,453<br />
2009 306,122 281,781<br />
2010 357,958<br />
LOSS DEVELOPMENT FACTORS<br />
Development 15 to 27 27 to 39 39 to 51 51 to 63 63 to 75 75 to 87 87 to 99 99 to 111 111 to 123<br />
3rd Prior 1.048 0.706 0.963 0.841 1.000 1.001 1.000 1.000 1.003<br />
2nd Prior 1.226 1.000 0.832 1.000 1.000 1.000 1.000 1.001 1.000<br />
1st Prior 0.433 0.813 0.509 1.000 1.000 1.000 1.000 1.000 1.000<br />
L<strong>at</strong>est 0.920 0.973 1.042 1.069 1.000 1.000 0.957 1.000 1.000<br />
Average 0.907 0.873 0.836 0.978 1.000 1.000 0.989 1.000 1.001<br />
*Excludes Paid Alloc<strong>at</strong>ed Expense<br />
Loss Development Factors 15 to 123 months = 0.641<br />
27 to 123 months = 0.707<br />
39 to 123 months = 0.810<br />
51 to 123 months = 0.968<br />
ALLSTATE INDEMNITY COMPANY<br />
DELAWARE<br />
Calcul<strong>at</strong>ion of Loss Development Factors<br />
PERSONAL INJURY PROTECTION
Bulletin 23<br />
Page 7<br />
Accident<br />
Paid Loss*<br />
Year Ending Mar. 15 Months 27 Months 39 Months 51 Months 63 Months 75 Months 87 Months 99 Months 111 Months 123 Months<br />
1998 180,378 244,903 311,458 315,958 323,458 323,458 323,458 323,458 323,458 323,458<br />
1999 124,973 253,235 335,014 363,847 363,847 363,847 363,847 363,847 363,847 363,847<br />
2000 86,547 114,203 164,316 189,228 189,228 189,228 189,228 189,228 189,228 189,228<br />
2001 62,897 115,966 143,287 143,012 143,012 143,012 143,012 143,012 143,012 143,012<br />
2002 33,475 71,743 71,993 86,495 86,495 86,495 86,495 86,495 86,495<br />
2003 27,666 26,007 26,007 26,007 26,007 26,007 26,007 26,007<br />
2004 3,121 12,421 12,421 12,421 13,921 13,921 13,921<br />
2005 5,905 5,709 5,709 5,709 5,709 5,709<br />
2006 2,688 11,188 11,188 11,188 11,188<br />
2007 6,114 7,614 7,614 7,614<br />
2008 2,196 1,946 1,946<br />
2009 9,501 9,501<br />
2010 19,350<br />
LOSS DEVELOPMENT FACTORS<br />
Development 15 to 27 27 to 39 39 to 51 51 to 63 63 to 75 75 to 87 87 to 99 99 to 111 111 to 123<br />
3rd Prior 4.162 1.000 1.000 1.000 1.000 1.000 1.000 1.000 1.000<br />
2nd Prior 1.245 1.000 1.000 1.121 1.000 1.000 1.000 1.000 1.000<br />
1st Prior 0.886 1.000 1.000 1.000 1.000 1.000 1.000 1.000 1.000<br />
L<strong>at</strong>est 1.000 1.000 1.000 1.000 1.000 1.000 1.000 1.000 1.000<br />
Average 1.823 1.000 1.000 1.030 1.000 1.000 1.000 1.000 1.000<br />
*Excludes Paid Alloc<strong>at</strong>ed Expense<br />
Loss Development Factors 15 to 123 months = 1.879<br />
27 to 123 months = 1.030<br />
39 to 123 months = 1.030<br />
51 to 123 months = 1.030<br />
ALLSTATE INDEMNITY COMPANY<br />
DELAWARE<br />
Calcul<strong>at</strong>ion of Loss Development Factors<br />
UNINSURED / UNDERINSURED MOTORISTS
Bulletin 23<br />
Page 8<br />
Accident<br />
Paid Loss*<br />
Year Ending Mar. 15 Months 27 Months 39 Months 51 Months 63 Months 75 Months 87 Months 99 Months 111 Months 123 Months<br />
1998 1,209,848 1,138,628 1,131,646 1,123,980 1,123,980 1,123,980 1,123,980 1,123,980 1,123,980 1,123,980<br />
1999 1,203,945 1,158,354 1,161,615 1,162,131 1,162,131 1,162,131 1,162,131 1,162,366 1,162,366 1,160,804<br />
2000 913,566 883,678 880,880 880,880 880,891 880,901 880,526 880,591 880,036 879,496<br />
2001 682,479 661,361 664,282 666,082 666,127 666,127 666,127 666,127 666,127 666,127<br />
2002 542,622 522,583 522,583 522,583 522,583 522,583 522,583 522,583 522,583<br />
2003 358,101 338,991 340,301 340,301 340,301 340,301 340,301 340,301<br />
2004 197,123 190,587 190,587 189,044 189,044 189,044 189,044<br />
2005 136,280 117,080 117,080 117,080 117,080 117,080<br />
2006 86,172 86,172 86,172 86,172 86,172<br />
2007 75,522 74,921 74,921 74,921<br />
2008 60,592 55,928 55,928<br />
2009 131,412 133,558<br />
2010 190,679<br />
LOSS DEVELOPMENT FACTORS<br />
Development 15 to 27 27 to 39 39 to 51 51 to 63 63 to 75 75 to 87 87 to 99 99 to 111 111 to 123<br />
3rd Prior 1.000 1.000 0.992 1.000 1.000 1.000 1.000 1.000 1.000<br />
2nd Prior 0.992 1.000 1.000 1.000 1.000 1.000 1.000 0.999 0.999<br />
1st Prior 0.923 1.000 1.000 1.000 1.000 1.000 1.000 1.000 0.999<br />
L<strong>at</strong>est 1.016 1.000 1.000 1.000 1.000 1.000 1.000 1.000 1.000<br />
Average 0.983 1.000 0.998 1.000 1.000 1.000 1.000 1.000 1.000<br />
*Excludes Paid Alloc<strong>at</strong>ed Expense<br />
Loss Development Factors 15 to 123 months = 0.980<br />
27 to 123 months = 0.997<br />
39 to 123 months = 0.997<br />
51 to 123 months = 0.999<br />
ALLSTATE INDEMNITY COMPANY<br />
DELAWARE<br />
Calcul<strong>at</strong>ion of Loss Development Factors<br />
COLLISION
Bulletin 23<br />
Page 9<br />
Accident<br />
Paid Loss*<br />
Year Ending Mar. 15 Months 27 Months 39 Months 51 Months 63 Months 75 Months 87 Months 99 Months 111 Months 123 Months<br />
1998 379,388 389,422 389,398 389,398 389,398 389,398 389,398 389,398 389,398 389,398<br />
1999 449,014 452,995 451,970 451,110 450,230 449,594 449,594 449,594 449,594 444,197<br />
2000 260,533 259,088 255,828 255,813 255,813 255,513 255,513 252,062 252,062 252,062<br />
2001 200,855 203,495 203,600 203,600 203,600 203,600 203,600 203,600 203,600 203,600<br />
2002 144,225 140,090 140,090 140,090 140,090 140,090 140,090 140,090 140,090<br />
2003 74,183 74,073 74,073 74,073 74,073 74,073 74,073 74,073<br />
2004 34,703 34,553 34,553 34,553 34,553 34,553 34,553<br />
2005 26,215 26,212 26,212 26,212 26,212 26,212<br />
2006 27,615 28,597 28,597 28,597 28,597<br />
2007 23,686 23,686 23,686 23,686<br />
2008 13,368 13,293 13,293<br />
2009 29,712 29,712<br />
2010 15,947<br />
LOSS DEVELOPMENT FACTORS<br />
Development 15 to 27 27 to 39 39 to 51 51 to 63 63 to 75 75 to 87 87 to 99 99 to 111 111 to 123<br />
3rd Prior 1.036 1.000 1.000 1.000 1.000 1.000 0.986 1.000 1.000<br />
2nd Prior 1.000 1.000 1.000 1.000 1.000 1.000 1.000 1.000 0.988<br />
1st Prior 0.994 1.000 1.000 1.000 1.000 1.000 1.000 1.000 1.000<br />
L<strong>at</strong>est 1.000 1.000 1.000 1.000 1.000 1.000 1.000 1.000 1.000<br />
Average 1.007 1.000 1.000 1.000 1.000 1.000 0.997 1.000 0.997<br />
*Excludes Paid Alloc<strong>at</strong>ed Expense<br />
Loss Development Factors 15 to 123 months = 1.001<br />
27 to 123 months = 0.994<br />
39 to 123 months = 0.994<br />
51 to 123 months = 0.994<br />
ALLSTATE INDEMNITY COMPANY<br />
DELAWARE<br />
Calcul<strong>at</strong>ion of Loss Development Factors<br />
COMPREHENSIVE
Bulletin 23<br />
Page 10<br />
Accident<br />
Incurred Loss Including Alloc<strong>at</strong>ed Expense*<br />
Year Ending Mar. 15 Months 27 Months 39 Months 51 Months 63 Months 75 Months 87 Months 99 Months 111 Months 123 Months<br />
1998 1,286,391 1,788,848 1,970,905 2,235,397 2,291,102 2,293,984 2,295,107 2,295,107 2,295,107 2,295,107<br />
1999 1,120,736 1,508,731 1,816,832 1,878,098 1,921,938 1,928,532 1,942,643 1,942,643 1,942,643 1,942,643<br />
2000 1,185,272 1,292,640 1,469,484 1,648,173 1,695,092 1,682,635 1,698,675 1,698,675 1,698,675 1,698,675<br />
2001 615,304 722,633 819,540 876,761 879,084 876,969 877,969 877,969 877,969 877,969<br />
2002 436,827 563,562 730,157 737,348 753,008 753,008 753,008 753,008 753,008<br />
2003 160,413 256,470 262,195 274,430 274,430 274,430 274,430 274,430<br />
2004 140,120 170,842 163,292 168,837 168,124 168,124 168,124<br />
2005 77,815 112,769 111,573 111,573 111,573 111,573<br />
2006 37,822 35,546 36,546 36,546 36,546<br />
2007 107,672 107,814 140,192 135,066<br />
2008 50,907 82,578 70,876<br />
2009 313,478 320,311<br />
2010 275,794<br />
LOSS DEVELOPMENT FACTORS<br />
Development 15 to 27 27 to 39 39 to 51 51 to 63 63 to 75 75 to 87 87 to 99 99 to 111 111 to 123<br />
3rd Prior 0.940 0.989 1.034 1.000 1.000 1.001 1.000 1.000 1.000<br />
2nd Prior 1.001 1.028 1.000 0.996 1.000 1.000 1.000 1.000 1.000<br />
1st Prior 1.622 1.300 1.000 1.000 1.000 1.000 1.000 1.000 1.000<br />
L<strong>at</strong>est 1.022 0.858 0.963 1.000 1.000 1.000 1.000 1.000 1.000<br />
Average 1.146 1.044 0.999 0.999 1.000 1.000 1.000 1.000 1.000<br />
*Includes Supplemental Reserves<br />
Loss Development Factors 15 to 159 months = 1.195<br />
27 to 159 months = 1.043<br />
39 to 159 months = 0.999<br />
51 to 159 months = 0.999<br />
ALLSTATE INDEMNITY COMPANY<br />
DELAWARE<br />
Calcul<strong>at</strong>ion of Loss Development Factors<br />
BODILY INJURY
Bulletin 23<br />
Page 11<br />
Accident<br />
Incurred Loss Including Alloc<strong>at</strong>ed Expense*<br />
Year Ending Mar. 15 Months 27 Months 39 Months 51 Months 63 Months 75 Months 87 Months 99 Months 111 Months 123 Months<br />
1998 931,634 1,017,760 1,069,121 1,046,290 1,054,269 1,054,269 1,054,269 1,054,269 1,054,269 1,054,269<br />
1999 1,001,992 1,058,159 1,101,518 1,105,860 1,105,860 1,105,860 1,105,860 1,105,860 1,105,860 1,105,860<br />
2000 848,516 930,350 961,178 941,197 941,197 946,197 946,197 946,197 946,197 946,197<br />
2001 435,805 471,489 488,739 481,915 481,915 481,915 481,915 481,915 481,915 481,915<br />
2002 398,675 421,277 432,273 434,220 434,220 434,220 434,220 434,220 434,220<br />
2003 187,571 218,712 218,712 218,712 218,712 218,712 218,712 218,712<br />
2004 98,334 109,195 110,146 110,146 110,146 110,146 110,146<br />
2005 131,342 141,531 141,531 141,531 141,531 141,531<br />
2006 54,791 54,791 54,791 54,791 54,791<br />
2007 118,460 121,942 122,564 122,564<br />
2008 95,450 92,243 92,243<br />
2009 195,427 255,675<br />
2010 308,194<br />
LOSS DEVELOPMENT FACTORS<br />
Development 15 to 27 27 to 39 39 to 51 51 to 63 63 to 75 75 to 87 87 to 99 99 to 111 111 to 123<br />
3rd Prior 1.000 1.000 1.000 1.000 1.000 1.000 1.000 1.000 1.000<br />
2nd Prior 1.029 1.000 1.000 1.000 1.000 1.000 1.000 1.000 1.000<br />
1st Prior 0.966 1.005 1.000 1.000 1.000 1.000 1.000 1.000 1.000<br />
L<strong>at</strong>est 1.308 1.000 1.000 1.000 1.000 1.000 1.000 1.000 1.000<br />
Average 1.076 1.001 1.000 1.000 1.000 1.000 1.000 1.000 1.000<br />
*Includes Supplemental Reserves<br />
Loss Development Factors 15 to 123 months = 1.077<br />
27 to 123 months = 1.001<br />
39 to 123 months = 1.000<br />
51 to 123 months = 1.000<br />
ALLSTATE INDEMNITY COMPANY<br />
DELAWARE<br />
Calcul<strong>at</strong>ion of Loss Development Factors<br />
PROPERTY DAMAGE
Bulletin 23<br />
Page 12<br />
Accident<br />
Incurred Loss Including Alloc<strong>at</strong>ed Expense*<br />
Year Ending Mar. 15 Months 27 Months 39 Months 51 Months 63 Months 75 Months 87 Months 99 Months 111 Months 123 Months<br />
1998 2,294,976 2,063,331 1,923,271 1,888,515 1,875,575 1,880,075 1,880,046 1,880,046 1,880,046 1,885,116<br />
1999 2,018,649 1,975,799 1,699,053 1,624,720 1,614,769 1,584,688 1,584,688 1,584,688 1,584,688 1,584,688<br />
2000 1,687,387 1,340,752 1,130,576 1,058,637 1,045,801 1,047,101 1,047,101 1,047,101 1,047,620 1,047,620<br />
2001 787,333 723,125 722,449 675,318 663,100 666,246 666,599 666,599 666,599 666,599<br />
2002 485,365 434,253 397,579 371,559 371,916 371,916 371,916 371,916 371,916<br />
2003 223,189 244,240 229,139 206,446 180,458 180,458 180,458 173,337<br />
2004 206,834 211,414 208,559 201,059 201,059 201,059 201,059<br />
2005 103,898 108,220 78,213 66,426 66,426 66,426<br />
2006 42,618 40,065 38,532 19,625 20,983<br />
2007 123,916 115,617 79,861 83,102<br />
2008 41,721 17,732 16,303<br />
2009 343,495 310,010<br />
2010 374,175<br />
LOSS DEVELOPMENT FACTORS<br />
Development 15 to 27 27 to 39 39 to 51 51 to 63 63 to 75 75 to 87 87 to 99 99 to 111 111 to 123<br />
3rd Prior 0.940 0.723 0.964 0.874 1.000 1.001 1.000 1.000 1.003<br />
2nd Prior 0.933 0.962 0.849 1.000 1.000 1.000 1.000 1.000 1.000<br />
1st Prior 0.425 0.691 0.509 1.000 1.000 1.000 1.000 1.000 1.000<br />
L<strong>at</strong>est 0.903 0.919 1.041 1.069 1.000 1.000 0.961 1.000 1.000<br />
Average 0.800 0.824 0.841 0.986 1.000 1.000 0.990 1.000 1.001<br />
*Includes Supplemental Reserves<br />
Loss Development Factors 15 to 123 months = 0.541<br />
27 to 123 months = 0.677<br />
39 to 123 months = 0.821<br />
51 to 123 months = 0.977<br />
ALLSTATE INDEMNITY COMPANY<br />
DELAWARE<br />
Calcul<strong>at</strong>ion of Loss Development Factors<br />
PERSONAL INJURY PROTECTION
Bulletin 23<br />
Page 13<br />
Accident<br />
Incurred Loss Including Alloc<strong>at</strong>ed Expense*<br />
Year Ending Mar. 15 Months 27 Months 39 Months 51 Months 63 Months 75 Months 87 Months 99 Months 111 Months 123 Months<br />
1998 262,015 314,066 353,545 366,875 359,690 350,401 350,401 350,401 350,401 350,401<br />
1999 276,622 339,078 413,066 419,029 425,586 406,732 406,732 406,732 406,732 406,732<br />
2000 135,531 184,960 220,021 219,292 219,959 219,959 219,959 219,959 219,959 219,959<br />
2001 111,243 117,039 151,631 158,849 159,014 159,014 160,095 160,095 160,095 160,095<br />
2002 55,069 82,039 93,979 90,446 93,081 93,081 93,081 93,081 93,081<br />
2003 27,703 26,044 26,044 26,044 26,044 26,044 26,044 26,044<br />
2004 23,121 12,421 22,421 22,421 19,386 19,386 19,386<br />
2005 5,930 5,734 5,734 5,734 5,734 5,734<br />
2006 32,688 11,188 11,188 11,188 11,188<br />
2007 7,632 7,632 7,632 7,632<br />
2008 2,196 1,946 1,946<br />
2009 28,052 31,466<br />
2010 20,895<br />
LOSS DEVELOPMENT FACTORS<br />
Development 15 to 27 27 to 39 39 to 51 51 to 63 63 to 75 75 to 87 87 to 99 99 to 111 111 to 123<br />
3rd Prior 0.342 1.000 1.000 1.000 1.000 1.007 1.000 1.000 1.000<br />
2nd Prior 1.000 1.000 1.000 0.865 1.000 1.000 1.000 1.000 1.000<br />
1st Prior 0.886 1.000 1.000 1.000 1.000 1.000 1.000 1.000 1.000<br />
L<strong>at</strong>est 1.122 1.000 1.000 1.000 1.000 1.000 1.000 1.000 1.000<br />
Average 0.838 1.000 1.000 0.966 1.000 1.002 1.000 1.000 1.000<br />
*Includes Supplemental Reserves<br />
Loss Development Factors 15 to 123 months = 0.811<br />
27 to 123 months = 0.968<br />
39 to 123 months = 0.968<br />
51 to 123 months = 0.968<br />
ALLSTATE INDEMNITY COMPANY<br />
DELAWARE<br />
Calcul<strong>at</strong>ion of Loss Development Factors<br />
UNINSURED / UNDERINSURED MOTORISTS
Bulletin 23<br />
Page 14<br />
Accident<br />
Incurred Loss Including Alloc<strong>at</strong>ed Expense*<br />
Year Ending Mar. 15 Months 27 Months 39 Months 51 Months 63 Months 75 Months 87 Months 99 Months 111 Months 123 Months<br />
1998 1,219,119 1,149,919 1,143,054 1,136,501 1,136,501 1,136,501 1,136,501 1,136,501 1,136,501 1,136,501<br />
1999 1,210,791 1,165,700 1,169,058 1,169,574 1,169,574 1,169,574 1,169,574 1,169,819 1,170,139 1,168,952<br />
2000 935,167 905,852 903,073 903,073 903,084 903,094 902,729 902,794 902,239 901,699<br />
2001 684,988 663,909 666,830 668,630 668,675 668,675 668,675 668,675 668,675 668,675<br />
2002 546,308 527,086 527,108 527,108 527,108 527,108 527,108 527,108 527,108<br />
2003 359,432 340,297 341,608 341,608 341,608 341,608 341,608 341,608<br />
2004 197,565 191,029 191,104 189,656 189,656 189,656 189,656<br />
2005 136,519 118,709 118,709 118,709 118,709 118,709<br />
2006 86,375 86,375 86,378 86,378 86,378<br />
2007 76,177 75,576 75,576 75,576<br />
2008 60,637 55,973 56,622<br />
2009 133,785 135,930<br />
2010 190,719<br />
LOSS DEVELOPMENT FACTORS<br />
Development 15 to 27 27 to 39 39 to 51 51 to 63 63 to 75 75 to 87 87 to 99 99 to 111 111 to 123<br />
3rd Prior 1.000 1.000 0.992 1.000 1.000 1.000 1.000 1.000 1.000<br />
2nd Prior 0.992 1.000 1.000 1.000 1.000 1.000 1.000 0.999 0.999<br />
1st Prior 0.923 1.000 1.000 1.000 1.000 1.000 1.000 1.000 0.999<br />
L<strong>at</strong>est 1.016 1.012 1.000 1.000 1.000 1.000 1.000 1.000 1.000<br />
Average 0.983 1.003 0.998 1.000 1.000 1.000 1.000 1.000 1.000<br />
*Includes Supplemental Reserves<br />
Loss Development Factors 15 to 123 months = 0.983<br />
27 to 123 months = 1.001<br />
39 to 123 months = 0.998<br />
51 to 123 months = 1.000<br />
ALLSTATE INDEMNITY COMPANY<br />
DELAWARE<br />
Calcul<strong>at</strong>ion of Loss Development Factors<br />
COLLISION
Bulletin 23<br />
Page 15<br />
Accident<br />
Incurred Loss Including Alloc<strong>at</strong>ed Expense*<br />
Year Ending Mar. 15 Months 27 Months 39 Months 51 Months 63 Months 75 Months 87 Months 99 Months 111 Months 123 Months<br />
1998 385,907 399,948 399,958 399,958 399,958 399,958 399,958 399,958 399,958 399,958<br />
1999 455,119 460,485 460,438 459,578 458,698 458,062 458,062 458,062 458,062 452,665<br />
2000 261,592 260,146 256,886 256,871 256,871 256,571 256,571 253,121 253,121 253,121<br />
2001 201,647 204,283 204,388 204,388 204,388 204,388 204,388 204,388 204,388 204,388<br />
2002 144,501 140,347 140,656 140,656 140,656 140,656 140,656 140,656 140,656<br />
2003 74,238 74,128 74,128 74,128 74,128 74,128 74,128 74,128<br />
2004 34,728 34,578 34,578 34,578 34,578 34,578 34,578<br />
2005 26,272 26,269 26,269 26,269 26,269 26,269<br />
2006 27,635 28,617 28,617 28,617 28,617<br />
2007 23,686 23,686 23,686 23,686<br />
2008 13,368 13,293 13,293<br />
2009 29,730 29,730<br />
2010 15,947<br />
LOSS DEVELOPMENT FACTORS<br />
Development 15 to 27 27 to 39 39 to 51 51 to 63 63 to 75 75 to 87 87 to 99 99 to 111 111 to 123<br />
3rd Prior 1.036 1.000 1.000 1.000 1.000 1.000 0.987 1.000 1.000<br />
2nd Prior 1.000 1.000 1.000 1.000 1.000 1.000 1.000 1.000 0.988<br />
1st Prior 0.994 1.000 1.000 1.000 1.000 1.000 1.000 1.000 1.000<br />
L<strong>at</strong>est 1.000 1.000 1.000 1.000 1.000 1.000 1.000 1.000 1.000<br />
Average 1.007 1.000 1.000 1.000 1.000 1.000 0.997 1.000 0.997<br />
*Includes Supplemental Reserves<br />
Loss Development Factors 15 to 123 months = 1.001<br />
27 to 123 months = 0.994<br />
39 to 123 months = 0.994<br />
51 to 123 months = 0.994<br />
ALLSTATE INDEMNITY COMPANY<br />
DELAWARE<br />
Calcul<strong>at</strong>ion of Loss Development Factors<br />
COMPREHENSIVE
Bulletin 23<br />
Page 16<br />
Accident Year<br />
Paid Alloc<strong>at</strong>ed Expense<br />
Ending Mar. 15 Months 27 Months 39 Months 51 Months 63 Months 75 Months 87 Months 99 Months 111 Months 123 Months<br />
1998 17,753 57,020 126,209 236,209 249,991 251,987 253,109 253,109 253,109 253,109<br />
1999 19,203 46,292 132,455 189,261 231,891 233,619 240,580 240,580 240,580 240,580<br />
2000 9,803 39,148 127,904 196,861 215,873 237,099 238,209 238,209 238,209 238,209<br />
2001 3,742 26,730 53,183 65,844 68,257 68,257 69,257 69,257 69,257 69,257<br />
2002 4,143 21,478 51,757 75,089 77,249 77,249 77,249 77,249 77,249<br />
2003 37 253 526 556 556 556 556 556<br />
2004 95 3,471 12,145 15,010 16,597 16,597 16,597<br />
2005 146 2,405 5,014 5,014 5,014 5,014<br />
2006 121 121 121 121 121<br />
2007 2,560 4,428 7,253 7,286<br />
2008 320 340 340<br />
2009 4,100 8,422<br />
2010 255<br />
LOSS DEVELOPMENT FACTORS<br />
Development 15 to 27 27 to 39 39 to 51 51 to 63 63 to 75 75 to 87 87 to 99 99 to 111 111 to 123<br />
3rd Prior 1.000 2.085 1.236 1.000 1.000 1.015 1.000 1.000 1.000<br />
2nd Prior 1.730 1.000 1.000 1.106 1.000 1.000 1.000 1.000 1.000<br />
1st Prior 1.062 1.638 1.000 1.000 1.000 1.000 1.000 1.000 1.000<br />
L<strong>at</strong>est 2.054 1.000 1.005 1.000 1.000 1.000 1.000 1.000 1.000<br />
Average 1.462 1.431 1.060 1.026 1.000 1.004 1.000 1.000 1.000<br />
Loss Development Factors 15 to 159 months = 2.284<br />
27 to 159 months = 1.563<br />
39 to 159 months = 1.092<br />
51 to 159 months = 1.030<br />
ALLSTATE INDEMNITY COMPANY<br />
DELAWARE<br />
Calcul<strong>at</strong>ion of Loss Development Factors<br />
BODILY INJURY
Bulletin 23<br />
Page 17<br />
Accident Year<br />
Paid Alloc<strong>at</strong>ed Expense<br />
Ending Mar. 15 Months 27 Months 39 Months 51 Months 63 Months 75 Months 87 Months 99 Months 111 Months 123 Months<br />
1998 8,322 11,071 11,071 12,146 12,146 12,146 12,146 12,146 12,146 12,146<br />
1999 6,370 6,863 6,863 6,863 6,863 6,863 6,863 6,863 6,863 6,863<br />
2000 6,547 6,969 9,072 9,090 9,090 9,090 9,090 9,090 9,090 9,090<br />
2001 1,808 1,808 4,457 7,633 7,633 7,633 7,633 7,633 7,633 7,633<br />
2002 9,659 9,659 9,659 9,659 9,659 9,659 9,659 9,659 9,659<br />
2003 357 456 456 456 456 456 456 456<br />
2004 749 749 980 980 980 980 980<br />
2005 259 259 259 259 259 259<br />
2006 741 741 741 741 741<br />
2007 661 661 661 661<br />
2008 162 162 162<br />
2009 1,263 1,616<br />
2010 696<br />
LOSS DEVELOPMENT FACTORS<br />
Development 15 to 27 27 to 39 39 to 51 51 to 63 63 to 75 75 to 87 87 to 99 99 to 111 111 to 123<br />
3rd Prior 1.000 1.000 1.000 1.000 1.000 1.000 1.000 1.000 1.000<br />
2nd Prior 1.000 1.000 1.000 1.000 1.000 1.000 1.000 1.000 1.000<br />
1st Prior 1.000 1.000 1.000 1.000 1.000 1.000 1.000 1.000 1.000<br />
L<strong>at</strong>est 1.280 1.000 1.000 1.000 1.000 1.000 1.000 1.000 1.000<br />
Average 1.070 1.000 1.000 1.000 1.000 1.000 1.000 1.000 1.000<br />
Loss Development Factors 15 to 123 months = 1.070<br />
27 to 123 months = 1.000<br />
39 to 123 months = 1.000<br />
51 to 123 months = 1.000<br />
ALLSTATE INDEMNITY COMPANY<br />
DELAWARE<br />
Calcul<strong>at</strong>ion of Loss Development Factors<br />
PROPERTY DAMAGE
Bulletin 23<br />
Page 18<br />
Accident Year<br />
Paid Alloc<strong>at</strong>ed Expense<br />
Ending Mar. 15 Months 27 Months 39 Months 51 Months 63 Months 75 Months 87 Months 99 Months 111 Months 123 Months<br />
1998 42,236 64,681 68,846 71,269 72,794 73,244 73,244 73,244 73,244 73,349<br />
1999 40,053 48,620 51,983 52,023 52,053 52,053 52,053 52,053 52,053 52,053<br />
2000 3,082 15,375 16,656 19,321 21,157 22,457 22,457 22,457 22,457 22,457<br />
2001 8,137 21,582 26,529 30,903 34,871 38,017 38,017 38,017 38,017 38,017<br />
2002 6,448 13,375 25,263 32,252 33,613 33,613 33,613 33,613 33,613<br />
2003 2,141 7,433 7,433 7,658 13,326 13,326 13,326 13,326<br />
2004 3,190 5,095 5,636 5,636 5,636 5,636 5,636<br />
2005 1,980 6,100 8,143 8,143 8,143 8,143<br />
2006 25 25 25 25 25<br />
2007 695 1,790 1,790 1,790<br />
2008 0 850 850<br />
2009 8,194 12,669<br />
2010 5,794<br />
LOSS DEVELOPMENT FACTORS<br />
Development 15 to 27 27 to 39 39 to 51 51 to 63 63 to 75 75 to 87 87 to 99 99 to 111 111 to 123<br />
3rd Prior 1.000 1.335 1.000 1.740 1.000 1.000 1.000 1.000 1.001<br />
2nd Prior 2.576 1.000 1.000 1.000 1.000 1.000 1.000 1.000 1.000<br />
1st Prior 1.000 1.000 1.000 1.000 1.000 1.000 1.000 1.000 1.000<br />
L<strong>at</strong>est 1.546 1.000 1.000 1.000 1.000 1.000 1.000 1.000 1.000<br />
Average 1.530 1.084 1.000 1.185 1.000 1.000 1.000 1.000 1.000<br />
Loss Development Factors 15 to 123 months = 1.966<br />
27 to 123 months = 1.285<br />
39 to 123 months = 1.185<br />
51 to 123 months = 1.185<br />
ALLSTATE INDEMNITY COMPANY<br />
DELAWARE<br />
Calcul<strong>at</strong>ion of Loss Development Factors<br />
PERSONAL INJURY PROTECTION
Bulletin 23<br />
Page 19<br />
Accident Year<br />
Paid Alloc<strong>at</strong>ed Expense<br />
Ending Mar. 15 Months 27 Months 39 Months 51 Months 63 Months 75 Months 87 Months 99 Months 111 Months 123 Months<br />
1998 1,585 7,450 15,892 22,574 26,920 26,943 26,943 26,943 26,943 26,943<br />
1999 5,435 10,197 34,321 39,985 40,927 42,884 42,884 42,884 42,884 42,884<br />
2000 2,439 3,142 27,967 30,064 30,731 30,731 30,731 30,731 30,731 30,731<br />
2001 656 1,073 5,672 15,836 16,001 16,001 17,082 17,082 17,082 17,082<br />
2002 19 286 286 3,951 6,586 6,586 6,586 6,586 6,586<br />
2003 37 37 37 37 37 37 37 37<br />
2004 0 0 3,425 3,752 5,465 5,465 5,465<br />
2005 25 25 25 25 25 25<br />
2006 0 0 0 0 0<br />
2007 19 19 19 19<br />
2008 0 0 0<br />
2009 0 3,538<br />
2010 0<br />
LOSS DEVELOPMENT FACTORS<br />
Development 15 to 27 27 to 39 39 to 51 51 to 63 63 to 75 75 to 87 87 to 99 99 to 111 111 to 123<br />
3rd Prior 1.000 1.000 1.095 1.000 1.000 1.068 1.000 1.000 1.000<br />
2nd Prior 1.000 1.000 1.000 1.457 1.000 1.000 1.000 1.000 1.000<br />
1st Prior 1.000 1.000 1.000 1.000 1.000 1.000 1.000 1.000 1.000<br />
L<strong>at</strong>est 1.000 1.000 1.000 1.000 1.000 1.000 1.000 1.000 1.000<br />
Average 1.000 1.000 1.024 1.114 1.000 1.017 1.000 1.000 1.000<br />
Loss Development Factors 15 to 123 months = 1.160<br />
27 to 123 months = 1.160<br />
39 to 123 months = 1.160<br />
51 to 123 months = 1.133<br />
ALLSTATE INDEMNITY COMPANY<br />
DELAWARE<br />
Calcul<strong>at</strong>ion of Loss Development Factors<br />
UNINSURED / UNDERINSURED MOTORISTS
Bulletin 23<br />
Page 20<br />
Accident Year<br />
Paid Alloc<strong>at</strong>ed Expense<br />
Ending Mar. 15 Months 27 Months 39 Months 51 Months 63 Months 75 Months 87 Months 99 Months 111 Months 123 Months<br />
1998 9,271 11,291 11,408 12,521 12,521 12,521 12,521 12,521 12,521 12,521<br />
1999 6,845 7,346 7,443 7,443 7,443 7,443 7,443 7,453 7,773 8,148<br />
2000 21,600 22,173 22,193 22,193 22,193 22,193 22,203 22,203 22,203 22,203<br />
2001 2,509 2,547 2,547 2,547 2,547 2,547 2,547 2,547 2,547 2,547<br />
2002 3,686 4,504 4,526 4,526 4,526 4,526 4,526 4,526 4,526<br />
2003 1,332 1,307 1,307 1,307 1,307 1,307 1,307 1,307<br />
2004 442 442 517 612 612 612 612<br />
2005 239 1,629 1,629 1,629 1,629 1,629<br />
2006 204 204 206 206 206<br />
2007 655 655 655 655<br />
2008 45 45 694<br />
2009 2,372 2,372<br />
2010 40<br />
LOSS DEVELOPMENT FACTORS<br />
Development 15 to 27 27 to 39 39 to 51 51 to 63 63 to 75 75 to 87 87 to 99 99 to 111 111 to 123<br />
3rd Prior 1.000 1.000 1.184 1.000 1.000 1.000 1.000 1.043 1.000<br />
2nd Prior 1.000 1.013 1.000 1.000 1.000 1.000 1.000 1.000 1.048<br />
1st Prior 1.000 1.000 1.000 1.000 1.000 1.000 1.000 1.000 1.000<br />
L<strong>at</strong>est 1.000 15.417 1.000 1.000 1.000 1.000 1.000 1.000 1.000<br />
Average 1.000 4.607 1.046 1.000 1.000 1.000 1.000 1.011 1.012<br />
Loss Development Factors 15 to 123 months = 4.930<br />
27 to 123 months = 4.930<br />
39 to 123 months = 1.070<br />
51 to 123 months = 1.023<br />
ALLSTATE INDEMNITY COMPANY<br />
DELAWARE<br />
Calcul<strong>at</strong>ion of Loss Development Factors<br />
COLLISION
Bulletin 23<br />
Page 21<br />
Accident Year<br />
Paid Alloc<strong>at</strong>ed Expense<br />
Ending Mar. 15 Months 27 Months 39 Months 51 Months 63 Months 75 Months 87 Months 99 Months 111 Months 123 Months<br />
1998 6,519 10,525 10,560 10,560 10,560 10,560 10,560 10,560 10,560 10,560<br />
1999 6,104 7,490 8,468 8,468 8,468 8,468 8,468 8,468 8,468 8,468<br />
2000 1,059 1,059 1,059 1,059 1,059 1,059 1,059 1,059 1,059 1,059<br />
2001 792 789 789 789 789 789 789 789 789 789<br />
2002 277 258 567 567 567 567 567 567 567<br />
2003 55 55 55 55 55 55 55 55<br />
2004 25 25 25 25 25 25 25<br />
2005 57 57 57 57 57 57<br />
2006 20 20 20 20 20<br />
2007 0 0 0 0<br />
2008 0 0 0<br />
2009 19 19<br />
2010 0<br />
LOSS DEVELOPMENT FACTORS<br />
Development 15 to 27 27 to 39 39 to 51 51 to 63 63 to 75 75 to 87 87 to 99 99 to 111 111 to 123<br />
3rd Prior 1.000 1.000 1.000 1.000 1.000 1.000 1.000 1.000 1.000<br />
2nd Prior 1.000 1.000 1.000 1.000 1.000 1.000 1.000 1.000 1.000<br />
1st Prior 1.000 1.000 1.000 1.000 1.000 1.000 1.000 1.000 1.000<br />
L<strong>at</strong>est 1.000 1.000 1.000 1.000 1.000 1.000 1.000 1.000 1.000<br />
Average 1.000 1.000 1.000 1.000 1.000 1.000 1.000 1.000 1.000<br />
Loss Development Factors 15 to 123 months = 1.000<br />
27 to 123 months = 1.000<br />
39 to 123 months = 1.000<br />
51 to 123 months = 1.000<br />
ALLSTATE INDEMNITY COMPANY<br />
DELAWARE<br />
Calcul<strong>at</strong>ion of Loss Development Factors<br />
COMPREHENSIVE
Bulletin 23<br />
Page 22<br />
Accident<br />
Paid Loss*<br />
Year Ending Mar. 15 Months 27 Months 39 Months 51 Months 63 Months 75 Months 87 Months 99 Months 111 Months 123 Months<br />
1998 98,911,181 197,127,130 246,358,359 275,442,987 290,302,717 295,541,641 297,709,150 299,044,256 299,315,950 299,472,023<br />
1999 114,300,748 216,093,351 273,532,958 301,877,565 317,908,207 323,682,799 325,811,550 326,672,672 326,966,207 327,145,285<br />
2000 116,191,562 222,557,011 277,254,083 304,517,290 316,423,376 321,276,735 323,173,221 324,187,807 324,437,992 325,614,634<br />
2001 94,011,008 184,979,021 227,998,353 247,608,726 255,528,110 259,707,168 262,352,440 263,209,987 263,564,221 263,685,164<br />
2002 83,230,953 153,138,412 187,085,476 202,638,075 209,992,510 213,212,950 214,201,964 214,807,548 215,125,850<br />
2003 69,425,019 126,153,407 152,325,286 165,717,926 171,804,055 174,232,164 175,333,367 175,682,596<br />
2004 56,844,828 105,579,176 127,953,803 139,389,926 144,535,068 146,574,814 147,855,578<br />
2005 48,432,077 89,164,039 110,200,913 121,061,387 126,781,271 128,643,799<br />
2006 42,083,995 79,209,967 96,861,535 105,633,202 109,945,333<br />
2007 36,853,547 71,154,256 90,522,661 99,419,179<br />
2008 31,912,050 62,713,503 76,359,561<br />
2009 37,596,802 70,900,344<br />
2010 40,703,525<br />
LOSS DEVELOPMENT FACTORS<br />
Development 15 to 27 27 to 39 39 to 51 51 to 63 63 to 75 75 to 87 87 to 99 99 to 111 111 to 123<br />
3rd Prior 1.882 1.236 1.089 1.037 1.015 1.010 1.003 1.001 1.001<br />
2nd Prior 1.931 1.223 1.099 1.037 1.014 1.005 1.003 1.001 1.001<br />
1st Prior 1.965 1.272 1.091 1.047 1.014 1.006 1.003 1.001 1.004<br />
L<strong>at</strong>est 1.886 1.218 1.098 1.041 1.015 1.009 1.002 1.001 1.000<br />
Average 1.916 1.237 1.094 1.040 1.015 1.007 1.003 1.001 1.001<br />
*Excludes Paid Alloc<strong>at</strong>ed Expense<br />
Loss Development Factors 15 to 123 months = 2.773<br />
27 to 123 months = 1.447<br />
39 to 123 months = 1.170<br />
51 to 123 months = 1.069<br />
Countrywide - Tort St<strong>at</strong>es** Indemnity<br />
Calcul<strong>at</strong>ion of Loss Development Factors<br />
BODILY INJURY
Bulletin 23<br />
Page 23<br />
Accident<br />
Paid Loss*<br />
Year Ending Mar. 15 Months 27 Months 39 Months 51 Months 63 Months 75 Months 87 Months 99 Months 111 Months 123 Months<br />
1998 233,220,239 252,959,119 257,108,263 258,454,983 258,744,468 258,904,262 258,944,741 258,975,083 258,988,892 259,011,339<br />
1999 259,867,710 279,655,984 283,792,036 285,060,404 285,437,594 285,527,754 285,613,709 285,617,841 285,627,534 285,626,731<br />
2000 271,718,569 296,977,061 301,150,398 302,370,494 302,673,448 302,798,132 302,818,613 302,835,746 302,845,100 302,850,304<br />
2001 222,893,926 245,353,263 249,121,719 249,885,724 250,157,533 250,251,069 250,296,573 250,327,550 250,335,666 250,338,800<br />
2002 187,515,620 205,066,175 207,486,130 208,124,834 208,280,147 208,359,296 208,366,873 208,412,330 208,416,488<br />
2003 154,691,096 166,972,982 168,771,626 169,205,761 169,391,125 169,425,388 169,442,904 169,444,254<br />
2004 134,090,776 144,933,930 146,240,948 146,510,291 146,682,172 146,721,001 146,735,220<br />
2005 120,972,939 130,780,765 132,151,818 132,460,463 132,545,118 132,611,376<br />
2006 105,021,101 113,444,967 114,563,172 114,907,814 115,017,779<br />
2007 91,185,202 99,387,082 100,395,111 100,742,955<br />
2008 78,722,185 86,369,465 87,197,367<br />
2009 79,000,487 84,870,754<br />
2010 77,339,523<br />
LOSS DEVELOPMENT FACTORS<br />
Development 15 to 27 27 to 39 39 to 51 51 to 63 63 to 75 75 to 87 87 to 99 99 to 111 111 to 123<br />
3rd Prior 1.080 1.010 1.002 1.001 1.000 1.000 1.000 1.000 1.000<br />
2nd Prior 1.090 1.010 1.002 1.001 1.000 1.000 1.000 1.000 1.000<br />
1st Prior 1.097 1.010 1.003 1.001 1.000 1.000 1.000 1.000 1.000<br />
L<strong>at</strong>est 1.074 1.010 1.003 1.001 1.000 1.000 1.000 1.000 1.000<br />
Average 1.085 1.010 1.003 1.001 1.000 1.000 1.000 1.000 1.000<br />
*Excludes Paid Alloc<strong>at</strong>ed Expense<br />
Loss Development Factors 15 to 123 months = 1.101<br />
27 to 123 months = 1.014<br />
39 to 123 months = 1.004<br />
51 to 123 months = 1.002<br />
Countrywide - Tort St<strong>at</strong>es** Indemnity<br />
Calcul<strong>at</strong>ion of Loss Development Factors<br />
PROPERTY DAMAGE
Bulletin 23<br />
Page 24<br />
Accident<br />
Paid Loss*<br />
Year Ending Mar. 15 Months 27 Months 39 Months 51 Months 63 Months 75 Months 87 Months 99 Months 111 Months 123 Months<br />
1998 19,092,559 21,651,422 21,361,768 21,190,557 21,151,277 21,319,578 21,329,983 21,326,270 21,326,395 21,331,727<br />
1999 18,786,745 21,236,212 20,821,964 20,519,239 20,452,520 20,411,431 20,394,349 20,403,403 20,406,522 20,406,522<br />
2000 17,196,848 19,538,660 18,896,766 18,521,885 18,362,137 18,328,118 18,342,338 18,333,529 18,336,548 18,336,335<br />
2001 12,303,852 13,454,499 12,924,068 12,652,447 12,592,325 12,550,234 12,560,317 12,560,317 12,560,004 12,560,091<br />
2002 10,287,323 11,151,007 10,566,971 10,290,111 10,196,683 10,178,657 10,178,384 10,180,449 10,184,040<br />
2003 6,646,196 7,266,192 7,156,874 7,041,460 6,990,579 7,007,739 7,007,264 7,003,664<br />
2004 5,749,921 6,088,010 5,839,293 5,737,512 5,706,949 5,703,978 5,700,189<br />
2005 4,623,117 5,014,098 4,793,684 4,660,034 4,629,748 4,629,979<br />
2006 3,697,968 3,975,587 3,813,048 3,679,670 3,650,011<br />
2007 3,024,997 3,455,352 3,309,519 3,274,782<br />
2008 2,856,803 2,895,942 2,783,255<br />
2009 3,479,467 3,562,014<br />
2010 3,765,773<br />
LOSS DEVELOPMENT FACTORS<br />
Development 15 to 27 27 to 39 39 to 51 51 to 63 63 to 75 75 to 87 87 to 99 99 to 111 111 to 123<br />
3rd Prior 1.075 0.956 0.983 0.993 0.998 1.001 1.000 1.000 1.000<br />
2nd Prior 1.142 0.959 0.972 0.995 1.002 1.000 1.000 1.000 1.000<br />
1st Prior 1.014 0.958 0.965 0.994 0.999 1.000 1.000 1.000 1.000<br />
L<strong>at</strong>est 1.024 0.961 0.990 0.992 1.000 0.999 0.999 1.000 1.000<br />
Average 1.064 0.959 0.977 0.993 1.000 1.000 1.000 1.000 1.000<br />
*Excludes Paid Alloc<strong>at</strong>ed Expense<br />
Loss Development Factors 15 to 123 months = 0.990<br />
27 to 123 months = 0.930<br />
39 to 123 months = 0.971<br />
51 to 123 months = 0.993<br />
Countrywide - Tort St<strong>at</strong>es** Indemnity<br />
Calcul<strong>at</strong>ion of Loss Development Factors<br />
PERSONAL INJURY PROTECTION
Bulletin 23<br />
Page 25<br />
Accident<br />
Paid Loss*<br />
Year Ending Mar. 15 Months 27 Months 39 Months 51 Months 63 Months 75 Months 87 Months 99 Months 111 Months 123 Months<br />
1998 31,075,764 46,755,492 54,914,753 59,511,265 61,813,901 62,812,981 63,659,697 63,795,262 63,960,337 63,959,487<br />
1999 33,327,011 49,438,601 57,305,295 62,243,872 64,821,386 65,663,711 65,854,808 66,108,003 66,154,480 66,178,053<br />
2000 34,893,903 52,227,932 60,309,201 63,840,002 65,474,480 67,304,568 67,848,235 67,937,086 68,118,351 68,108,173<br />
2001 29,358,949 43,117,742 50,036,520 52,663,020 54,327,530 54,655,673 54,929,221 55,127,867 55,307,172 55,336,744<br />
2002 24,212,707 35,592,951 40,809,629 43,380,273 44,631,905 45,264,060 45,542,084 45,643,653 45,685,577<br />
2003 20,019,100 28,442,026 33,192,020 35,406,677 36,480,607 36,954,372 37,156,256 37,365,507<br />
2004 17,314,089 24,667,868 28,030,248 29,705,519 30,520,078 30,758,279 31,122,694<br />
2005 14,314,284 20,388,509 23,333,702 24,591,883 25,300,704 26,046,945<br />
2006 13,043,102 19,071,661 21,772,889 22,853,893 23,745,347<br />
2007 10,822,316 15,553,634 18,224,813 19,425,113<br />
2008 9,073,796 13,418,272 15,705,804<br />
2009 9,683,300 15,249,026<br />
2010 10,434,607<br />
LOSS DEVELOPMENT FACTORS<br />
Development 15 to 27 27 to 39 39 to 51 51 to 63 63 to 75 75 to 87 87 to 99 99 to 111 111 to 123<br />
3rd Prior 1.462 1.144 1.060 1.030 1.014 1.005 1.001 1.001 1.000<br />
2nd Prior 1.437 1.142 1.054 1.027 1.013 1.006 1.004 1.003 1.000<br />
1st Prior 1.479 1.172 1.050 1.029 1.008 1.005 1.002 1.003 1.000<br />
L<strong>at</strong>est 1.575 1.170 1.066 1.039 1.029 1.012 1.006 1.001 1.001<br />
Average 1.488 1.157 1.057 1.031 1.016 1.007 1.003 1.002 1.000<br />
*Excludes Paid Alloc<strong>at</strong>ed Expense<br />
Loss Development Factors 15 to 123 months = 1.932<br />
27 to 123 months = 1.298<br />
39 to 123 months = 1.122<br />
51 to 123 months = 1.061<br />
Countrywide - Tort St<strong>at</strong>es** Indemnity<br />
Calcul<strong>at</strong>ion of Loss Development Factors<br />
UNINSURED / UNDERINSURED MOTORISTS
Bulletin 23<br />
Page 26<br />
Accident<br />
Paid Loss*<br />
Year Ending Mar. 15 Months 27 Months 39 Months 51 Months 63 Months 75 Months 87 Months 99 Months 111 Months 123 Months<br />
1998 315,833,560 309,498,221 308,475,163 307,597,199 307,518,038 307,720,414 307,725,033 307,708,058 307,696,085 307,690,084<br />
1999 336,858,939 328,751,856 327,307,896 326,973,981 327,054,629 327,006,893 327,004,984 327,004,745 327,003,195 326,996,184<br />
2000 367,648,692 360,002,083 359,044,203 358,834,617 358,697,566 358,683,113 358,678,789 358,673,043 358,660,350 358,654,423<br />
2001 294,272,803 288,478,925 287,725,518 287,569,432 287,506,648 287,471,124 287,477,046 287,494,365 287,493,423 287,496,335<br />
2002 237,374,092 233,282,485 232,882,174 232,896,792 232,851,896 232,831,308 232,829,383 232,824,798 232,812,085<br />
2003 189,392,183 185,934,350 185,700,466 185,615,009 185,568,813 185,535,222 185,519,619 185,510,347<br />
2004 160,077,514 157,157,985 156,756,979 156,712,371 156,670,349 156,671,277 156,650,095<br />
2005 140,457,383 138,181,458 138,079,454 138,043,906 137,994,410 137,972,028<br />
2006 118,297,943 116,255,315 116,179,891 116,172,727 116,137,840<br />
2007 102,410,080 101,146,871 101,046,768 101,058,863<br />
2008 85,472,331 83,514,859 83,380,651<br />
2009 70,572,529 69,407,246<br />
2010 60,284,670<br />
LOSS DEVELOPMENT FACTORS<br />
Development 15 to 27 27 to 39 39 to 51 51 to 63 63 to 75 75 to 87 87 to 99 99 to 111 111 to 123<br />
3rd Prior 0.983 0.999 1.000 1.000 1.000 1.000 1.000 1.000 1.000<br />
2nd Prior 0.988 0.999 1.000 1.000 1.000 1.000 1.000 1.000 1.000<br />
1st Prior 0.977 0.999 1.000 1.000 1.000 1.000 1.000 1.000 1.000<br />
L<strong>at</strong>est 0.983 0.998 1.000 1.000 1.000 1.000 1.000 1.000 1.000<br />
Average 0.983 0.999 1.000 1.000 1.000 1.000 1.000 1.000 1.000<br />
*Excludes Paid Alloc<strong>at</strong>ed Expense<br />
Loss Development Factors 15 to 123 months = 0.981<br />
27 to 123 months = 0.998<br />
39 to 123 months = 0.999<br />
51 to 123 months = 1.000<br />
Countrywide - Tort St<strong>at</strong>es** Indemnity<br />
Calcul<strong>at</strong>ion of Loss Development Factors<br />
COLLISION
Bulletin 23<br />
Page 27<br />
Accident<br />
Paid Loss*<br />
Year Ending Mar. 15 Months 27 Months 39 Months 51 Months 63 Months 75 Months 87 Months 99 Months 111 Months 123 Months<br />
1998 127,979,954 128,023,592 127,924,771 127,868,188 127,858,121 128,239,939 128,236,021 128,229,002 128,217,652 128,212,931<br />
1999 132,176,504 132,579,161 132,452,811 132,433,645 132,474,745 132,446,876 132,399,364 132,392,863 132,391,105 132,395,641<br />
2000 145,559,450 146,477,619 146,556,218 146,488,600 146,428,336 146,418,380 146,412,838 146,404,252 146,379,010 146,369,951<br />
2001 119,894,862 120,739,812 120,638,306 120,629,849 120,596,048 120,585,352 120,572,929 120,573,783 120,569,187 120,568,768<br />
2002 93,138,842 94,043,623 94,044,449 94,039,382 94,060,248 94,076,860 94,071,665 94,072,767 94,069,769<br />
2003 70,411,611 70,798,563 70,757,258 70,787,827 70,791,147 70,797,335 70,782,380 70,773,204<br />
2004 55,299,585 55,356,217 55,397,466 55,357,734 55,332,040 55,341,331 55,355,879<br />
2005 45,759,419 46,148,020 46,161,873 46,141,589 46,114,917 46,102,644<br />
2006 38,980,052 39,467,551 39,485,802 39,487,864 39,464,191<br />
2007 33,313,149 33,847,392 33,839,631 33,824,397<br />
2008 29,148,167 29,694,448 29,807,274<br />
2009 24,622,148 24,821,228<br />
2010 21,522,198<br />
LOSS DEVELOPMENT FACTORS<br />
Development 15 to 27 27 to 39 39 to 51 51 to 63 63 to 75 75 to 87 87 to 99 99 to 111 111 to 123<br />
3rd Prior 1.013 1.000 0.999 1.000 1.000 1.000 1.000 1.000 1.000<br />
2nd Prior 1.016 1.000 1.000 1.000 1.000 1.000 1.000 1.000 1.000<br />
1st Prior 1.019 1.000 1.000 0.999 1.000 1.000 1.000 1.000 1.000<br />
L<strong>at</strong>est 1.008 1.004 1.000 0.999 1.000 1.000 1.000 1.000 1.000<br />
Average 1.014 1.001 1.000 1.000 1.000 1.000 1.000 1.000 1.000<br />
*Excludes Paid Alloc<strong>at</strong>ed Expense<br />
Loss Development Factors 15 to 123 months = 1.014<br />
27 to 123 months = 1.000<br />
39 to 123 months = 0.999<br />
51 to 123 months = 0.999<br />
Countrywide - Tort St<strong>at</strong>es** Indemnity<br />
Calcul<strong>at</strong>ion of Loss Development Factors<br />
COMPREHENSIVE
Bulletin 23<br />
Page 28<br />
Accident<br />
Incurred Loss Including Alloc<strong>at</strong>ed Expense*<br />
Year Ending Mar. 15 Months 27 Months 39 Months 51 Months 63 Months 75 Months 87 Months 99 Months 111 Months 123 Months<br />
1998 211,555,341 278,366,774 311,405,788 334,245,491 340,031,037 343,383,642 344,567,288 345,617,933 345,984,820 346,619,805<br />
1999 234,466,670 300,354,661 337,452,267 356,014,463 363,386,868 365,678,249 366,662,524 367,276,028 367,414,953 367,526,803<br />
2000 240,714,340 304,886,741 336,596,594 349,948,091 355,369,658 357,559,945 358,786,375 359,559,707 359,956,496 361,590,223<br />
2001 193,678,638 248,787,387 274,004,889 282,679,541 286,447,781 288,864,380 290,536,381 290,882,508 291,160,144 291,370,252<br />
2002 165,420,307 205,137,860 223,858,872 230,757,766 234,257,054 235,665,737 236,325,376 236,766,765 236,934,524<br />
2003 137,302,430 169,741,748 183,754,086 189,165,465 191,729,315 192,859,110 193,389,528 193,508,755<br />
2004 119,820,415 143,667,012 154,970,002 160,370,648 162,616,578 163,319,199 163,831,668<br />
2005 103,597,530 124,674,415 134,126,490 139,480,011 142,342,445 143,508,872<br />
2006 90,973,277 107,616,017 116,943,506 120,818,879 122,714,650<br />
2007 81,254,983 98,554,582 108,147,023 113,224,625<br />
2008 71,321,437 86,285,674 90,539,910<br />
2009 81,306,611 95,428,311<br />
2010 83,575,363<br />
LOSS DEVELOPMENT FACTORS<br />
Development 15 to 27 27 to 39 39 to 51 51 to 63 63 to 75 75 to 87 87 to 99 99 to 111 111 to 123<br />
3rd Prior 1.183 1.076 1.035 1.014 1.006 1.006 1.002 1.000 1.002<br />
2nd Prior 1.213 1.087 1.040 1.014 1.006 1.003 1.001 1.001 1.000<br />
1st Prior 1.210 1.097 1.033 1.021 1.004 1.003 1.002 1.001 1.005<br />
L<strong>at</strong>est 1.174 1.049 1.047 1.016 1.008 1.003 1.001 1.001 1.001<br />
Average 1.195 1.077 1.039 1.016 1.006 1.004 1.001 1.001 1.002<br />
*Includes Supplemental Reserves<br />
Loss Development Factors 15 to 159 months = 1.377<br />
27 to 159 months = 1.153<br />
39 to 159 months = 1.070<br />
51 to 159 months = 1.030<br />
Countrywide - Tort St<strong>at</strong>es** Indemnity<br />
Calcul<strong>at</strong>ion of Loss Development Factors<br />
BODILY INJURY
Bulletin 23<br />
Page 29<br />
Accident<br />
Incurred Loss Including Alloc<strong>at</strong>ed Expense*<br />
Year Ending Mar. 15 Months 27 Months 39 Months 51 Months 63 Months 75 Months 87 Months 99 Months 111 Months 123 Months<br />
1998 254,516,389 258,778,134 260,582,648 261,356,227 261,385,850 261,367,601 261,366,801 261,391,756 261,380,994 261,403,441<br />
1999 284,449,974 284,336,826 287,763,619 287,788,451 288,028,979 288,000,800 287,941,069 287,899,788 287,911,780 287,993,847<br />
2000 295,752,114 301,900,603 304,362,647 305,026,158 304,878,879 304,796,414 304,840,111 304,831,129 304,803,319 304,780,323<br />
2001 244,440,421 249,513,090 252,351,998 252,147,967 251,965,053 251,920,131 251,904,845 251,918,708 251,966,348 251,949,406<br />
2002 205,629,952 209,879,471 209,987,896 210,029,787 209,779,694 209,801,277 209,794,892 209,788,556 209,755,916<br />
2003 168,267,122 169,572,758 170,791,916 170,671,128 170,619,066 170,584,103 170,608,392 170,561,679<br />
2004 144,199,731 147,103,898 148,144,588 147,870,454 147,910,154 147,844,911 147,806,162<br />
2005 129,603,761 133,065,936 133,912,049 133,853,617 133,824,607 133,742,530<br />
2006 114,051,939 114,965,418 115,777,217 116,014,170 115,905,850<br />
2007 101,487,358 101,254,318 101,521,688 101,585,070<br />
2008 86,572,282 88,674,313 88,504,849<br />
2009 86,331,297 86,334,789<br />
2010 82,305,768<br />
LOSS DEVELOPMENT FACTORS<br />
Development 15 to 27 27 to 39 39 to 51 51 to 63 63 to 75 75 to 87 87 to 99 99 to 111 111 to 123<br />
3rd Prior 1.008 1.006 0.998 1.000 1.000 1.000 1.000 1.000 1.000<br />
2nd Prior 0.998 1.007 1.000 1.000 1.000 1.000 1.000 1.000 1.000<br />
1st Prior 1.024 1.003 1.002 1.000 1.000 1.000 1.000 1.000 1.000<br />
L<strong>at</strong>est 1.000 0.998 1.001 0.999 0.999 1.000 1.000 1.000 1.000<br />
Average 1.008 1.004 1.000 1.000 1.000 1.000 1.000 1.000 1.000<br />
*Includes Supplemental Reserves<br />
Loss Development Factors 15 to 123 months = 1.011<br />
27 to 123 months = 1.003<br />
39 to 123 months = 0.999<br />
51 to 123 months = 0.999<br />
Countrywide - Tort St<strong>at</strong>es** Indemnity<br />
Calcul<strong>at</strong>ion of Loss Development Factors<br />
PROPERTY DAMAGE
Bulletin 23<br />
Page 30<br />
Accident<br />
Incurred Loss Including Alloc<strong>at</strong>ed Expense*<br />
Year Ending Mar. 15 Months 27 Months 39 Months 51 Months 63 Months 75 Months 87 Months 99 Months 111 Months 123 Months<br />
1998 24,205,739 22,712,173 22,338,406 22,059,403 22,074,282 22,232,042 22,272,411 22,271,512 22,267,311 22,272,748<br />
1999 23,267,602 22,451,629 21,573,981 21,240,023 21,190,316 21,109,665 21,095,141 21,104,431 21,104,999 21,104,999<br />
2000 21,132,579 20,337,881 21,122,791 19,233,754 19,037,867 18,962,711 18,976,682 18,967,872 18,970,891 18,970,678<br />
2001 14,740,563 13,957,703 13,351,692 13,045,843 12,988,985 12,946,278 12,956,362 12,956,362 12,955,999 12,956,086<br />
2002 12,294,165 11,499,101 10,871,849 10,574,498 10,484,349 10,465,462 10,465,189 10,467,855 10,471,445<br />
2003 7,900,292 7,561,837 7,630,421 7,508,487 7,461,873 7,476,576 7,476,601 7,473,001<br />
2004 6,645,756 6,278,652 5,998,568 5,901,068 5,875,406 5,873,435 5,868,876<br />
2005 5,508,139 5,204,877 5,000,189 4,851,988 4,817,786 4,818,314<br />
2006 4,370,813 4,185,433 3,928,896 3,803,747 3,784,241<br />
2007 3,903,985 3,616,648 3,466,023 3,516,438<br />
2008 3,155,974 2,953,918 2,830,428<br />
2009 3,792,322 3,655,888<br />
2010 4,174,545<br />
LOSS DEVELOPMENT FACTORS<br />
Development 15 to 27 27 to 39 39 to 51 51 to 63 63 to 75 75 to 87 87 to 99 99 to 111 111 to 123<br />
3rd Prior 0.958 0.961 0.984 0.994 0.998 1.001 1.000 1.000 1.000<br />
2nd Prior 0.926 0.939 0.970 0.996 1.002 1.000 1.000 1.000 1.000<br />
1st Prior 0.936 0.958 0.968 0.993 1.000 1.000 1.000 1.000 1.000<br />
L<strong>at</strong>est 0.964 0.958 1.015 0.995 1.000 0.999 1.000 1.000 1.000<br />
Average 0.946 0.954 0.984 0.994 1.000 1.000 1.000 1.000 1.000<br />
*Includes Supplemental Reserves<br />
Loss Development Factors 15 to 123 months = 0.883<br />
27 to 123 months = 0.934<br />
39 to 123 months = 0.979<br />
51 to 123 months = 0.994<br />
Countrywide - Tort St<strong>at</strong>es** Indemnity<br />
Calcul<strong>at</strong>ion of Loss Development Factors<br />
PERSONAL INJURY PROTECTION
Bulletin 23<br />
Page 31<br />
Accident<br />
Incurred Loss Including Alloc<strong>at</strong>ed Expense*<br />
Year Ending Mar. 15 Months 27 Months 39 Months 51 Months 63 Months 75 Months 87 Months 99 Months 111 Months 123 Months<br />
1998 45,273,080 57,390,307 64,326,415 67,815,430 69,427,740 70,273,217 70,605,062 70,668,997 70,768,545 70,777,118<br />
1999 48,887,905 60,424,404 67,323,204 70,373,601 72,685,259 73,200,968 73,315,319 73,379,034 73,359,512 73,414,630<br />
2000 50,519,771 62,819,586 68,417,467 70,180,818 71,228,081 72,826,017 73,401,456 73,421,859 73,616,243 73,655,397<br />
2001 41,893,855 51,382,284 55,860,428 57,534,875 58,652,625 58,898,835 59,064,761 59,165,090 59,410,971 59,483,193<br />
2002 35,294,992 42,423,520 45,638,230 47,755,089 48,518,916 49,000,875 49,011,480 49,100,496 49,118,416<br />
2003 28,713,984 34,128,828 37,558,195 39,008,133 39,911,321 40,253,921 40,278,376 40,465,022<br />
2004 24,446,610 29,159,169 31,282,596 32,317,753 32,579,270 32,735,035 32,909,861<br />
2005 20,577,819 24,369,959 25,984,138 26,787,313 27,522,583 28,065,875<br />
2006 19,138,936 22,733,193 24,386,806 25,157,560 25,701,478<br />
2007 16,238,179 19,044,346 20,865,015 21,580,160<br />
2008 12,746,414 16,606,115 17,701,351<br />
2009 15,564,643 18,823,003<br />
2010 15,717,675<br />
LOSS DEVELOPMENT FACTORS<br />
Development 15 to 27 27 to 39 39 to 51 51 to 63 63 to 75 75 to 87 87 to 99 99 to 111 111 to 123<br />
3rd Prior 1.188 1.066 1.033 1.023 1.010 1.003 1.000 1.000 1.000<br />
2nd Prior 1.173 1.073 1.031 1.008 1.009 1.000 1.002 1.003 1.001<br />
1st Prior 1.303 1.096 1.032 1.027 1.005 1.001 1.002 1.004 1.001<br />
L<strong>at</strong>est 1.209 1.066 1.034 1.022 1.020 1.005 1.005 1.000 1.001<br />
Average 1.218 1.075 1.032 1.020 1.011 1.002 1.002 1.002 1.001<br />
*Includes Supplemental Reserves<br />
Loss Development Factors 15 to 123 months = 1.404<br />
27 to 123 months = 1.152<br />
39 to 123 months = 1.072<br />
51 to 123 months = 1.038<br />
Countrywide - Tort St<strong>at</strong>es** Indemnity<br />
Calcul<strong>at</strong>ion of Loss Development Factors<br />
UNINSURED / UNDERINSURED MOTORISTS
Bulletin 23<br />
Page 32<br />
Accident<br />
Incurred Loss Including Alloc<strong>at</strong>ed Expense*<br />
Year Ending Mar. 15 Months 27 Months 39 Months 51 Months 63 Months 75 Months 87 Months 99 Months 111 Months 123 Months<br />
1998 322,286,278 311,367,777 310,268,659 309,391,467 309,350,523 309,621,753 309,582,405 309,635,915 309,658,015 309,655,243<br />
1999 344,504,748 330,375,062 328,479,096 328,138,321 328,332,683 328,171,736 328,186,160 328,184,857 328,183,580 328,178,610<br />
2000 377,725,090 361,280,925 360,054,797 359,813,944 359,553,532 359,585,328 359,629,111 359,582,074 359,577,212 359,571,550<br />
2001 296,325,397 289,326,771 288,620,730 288,380,056 288,288,482 288,180,635 288,186,738 288,205,201 288,165,118 288,168,229<br />
2002 241,870,688 234,107,453 233,489,814 233,442,191 233,461,924 233,404,656 233,410,221 233,402,458 233,390,431<br />
2003 194,434,236 186,636,141 186,234,745 186,186,164 186,141,449 186,110,839 186,096,885 186,087,957<br />
2004 164,085,249 157,637,018 157,139,297 157,113,056 157,076,774 157,080,847 157,060,828<br />
2005 142,948,586 138,929,947 138,863,565 138,817,740 138,741,498 138,728,388<br />
2006 121,756,163 117,154,646 117,122,981 117,003,446 116,825,548<br />
2007 105,043,258 101,605,894 101,528,615 101,534,369<br />
2008 87,460,879 84,190,859 83,816,438<br />
2009 73,277,278 69,906,649<br />
2010 61,899,396<br />
LOSS DEVELOPMENT FACTORS<br />
Development 15 to 27 27 to 39 39 to 51 51 to 63 63 to 75 75 to 87 87 to 99 99 to 111 111 to 123<br />
3rd Prior 0.962 1.000 1.000 1.000 1.000 1.000 1.000 1.000 1.000<br />
2nd Prior 0.967 1.000 1.000 1.000 1.000 1.000 1.000 1.000 1.000<br />
1st Prior 0.963 0.999 0.999 0.999 1.000 1.000 1.000 1.000 1.000<br />
L<strong>at</strong>est 0.954 0.996 1.000 0.998 1.000 1.000 1.000 1.000 1.000<br />
Average 0.962 0.999 1.000 0.999 1.000 1.000 1.000 1.000 1.000<br />
*Includes Supplemental Reserves<br />
Loss Development Factors 15 to 123 months = 0.959<br />
27 to 123 months = 0.997<br />
39 to 123 months = 0.999<br />
51 to 123 months = 0.999<br />
Countrywide - Tort St<strong>at</strong>es** Indemnity<br />
Calcul<strong>at</strong>ion of Loss Development Factors<br />
COLLISION
Bulletin 23<br />
Page 33<br />
Accident<br />
Incurred Loss Including Alloc<strong>at</strong>ed Expense*<br />
Year Ending Mar. 15 Months 27 Months 39 Months 51 Months 63 Months 75 Months 87 Months 99 Months 111 Months 123 Months<br />
1998 134,516,884 130,922,059 130,490,512 130,112,114 130,079,568 130,479,243 130,405,840 130,390,257 130,379,509 130,376,935<br />
1999 135,861,460 135,308,660 134,884,454 134,642,847 134,599,145 134,591,835 134,537,023 134,522,233 134,519,931 134,524,449<br />
2000 148,937,789 148,330,101 148,274,093 148,179,919 148,079,527 148,023,833 148,035,968 148,000,967 147,975,506 147,966,275<br />
2001 122,458,790 122,208,030 122,042,122 121,884,368 121,842,123 121,836,009 121,825,163 121,785,362 121,765,153 121,741,576<br />
2002 94,883,702 95,363,405 95,351,107 95,204,523 95,258,977 95,353,304 95,368,495 95,384,600 95,335,285<br />
2003 72,691,623 71,730,266 71,949,070 71,966,635 71,956,800 71,921,217 71,910,170 71,900,994<br />
2004 56,956,586 56,142,889 56,014,966 55,960,741 55,931,407 55,915,824 55,930,377<br />
2005 46,414,106 47,085,942 46,737,272 46,681,838 46,628,233 46,572,236<br />
2006 39,959,569 40,071,165 40,032,193 40,000,346 39,917,452<br />
2007 34,918,704 34,322,775 34,302,511 34,280,002<br />
2008 30,501,712 30,276,835 30,291,644<br />
2009 26,859,580 25,337,575<br />
2010 22,769,689<br />
LOSS DEVELOPMENT FACTORS<br />
Development 15 to 27 27 to 39 39 to 51 51 to 63 63 to 75 75 to 87 87 to 99 99 to 111 111 to 123<br />
3rd Prior 1.003 0.993 0.999 1.000 1.001 1.000 1.000 1.000 1.000<br />
2nd Prior 0.983 0.999 0.999 0.999 1.000 1.000 1.000 1.000 1.000<br />
1st Prior 0.993 0.999 0.999 0.999 1.000 1.000 1.000 1.000 1.000<br />
L<strong>at</strong>est 0.943 1.000 0.999 0.998 0.999 1.000 1.000 0.999 1.000<br />
Average 0.980 0.998 0.999 0.999 1.000 1.000 1.000 1.000 1.000<br />
*Includes Supplemental Reserves<br />
Loss Development Factors 15 to 123 months = 0.976<br />
27 to 123 months = 0.995<br />
39 to 123 months = 0.998<br />
51 to 123 months = 0.998<br />
Countrywide - Tort St<strong>at</strong>es** Indemnity<br />
Calcul<strong>at</strong>ion of Loss Development Factors<br />
COMPREHENSIVE
Bulletin 23<br />
Page 34<br />
Accident Year<br />
Paid Alloc<strong>at</strong>ed Expense<br />
Ending Mar. 15 Months 27 Months 39 Months 51 Months 63 Months 75 Months 87 Months 99 Months 111 Months 123 Months<br />
1998 4,046,254 14,830,773 27,506,623 37,557,516 42,416,990 44,588,560 45,351,448 45,826,086 46,078,841 46,393,305<br />
1999 3,986,804 12,916,186 24,984,308 33,320,192 37,269,468 38,871,646 39,528,312 39,962,161 40,106,099 40,155,322<br />
2000 3,010,888 11,919,578 22,015,001 28,783,716 31,936,893 33,432,065 34,178,823 34,638,018 35,087,455 35,478,579<br />
2001 2,779,606 9,843,233 17,547,728 22,604,833 25,147,078 26,468,610 26,928,352 27,268,793 27,419,368 27,533,572<br />
2002 2,256,063 7,499,275 13,566,905 17,722,152 19,972,804 20,936,052 21,321,417 21,502,360 21,595,842<br />
2003 1,982,872 6,134,175 10,906,130 14,526,538 16,514,345 17,295,021 17,631,420 17,764,581<br />
2004 1,970,867 5,639,884 9,990,148 13,214,933 14,597,264 15,232,987 15,489,416<br />
2005 1,616,509 4,749,620 8,523,248 11,364,206 12,993,636 13,877,581<br />
2006 1,313,576 4,005,461 7,308,975 9,525,926 10,466,314<br />
2007 1,280,800 3,531,675 6,333,732 8,719,240<br />
2008 972,025 3,189,234 5,411,209<br />
2009 1,188,596 3,704,542<br />
2010 1,014,100<br />
LOSS DEVELOPMENT FACTORS<br />
Development 15 to 27 27 to 39 39 to 51 51 to 63 63 to 75 75 to 87 87 to 99 99 to 111 111 to 123<br />
3rd Prior 3.049 1.795 1.323 1.137 1.048 1.017 1.013 1.004 1.007<br />
2nd Prior 2.757 1.825 1.333 1.105 1.047 1.018 1.013 1.013 1.001<br />
1st Prior 3.281 1.793 1.303 1.143 1.044 1.019 1.008 1.006 1.011<br />
L<strong>at</strong>est 3.117 1.697 1.377 1.099 1.068 1.017 1.008 1.004 1.004<br />
Average 3.051 1.777 1.334 1.121 1.052 1.018 1.011 1.007 1.006<br />
Loss Development Factors 15 to 159 months = 8.883<br />
27 to 159 months = 2.911<br />
39 to 159 months = 1.638<br />
51 to 159 months = 1.228<br />
Countrywide - Tort St<strong>at</strong>es** Indemnity<br />
Calcul<strong>at</strong>ion of Loss Development Factors<br />
BODILY INJURY
Bulletin 23<br />
Page 35<br />
Accident Year<br />
Paid Alloc<strong>at</strong>ed Expense<br />
Ending Mar. 15 Months 27 Months 39 Months 51 Months 63 Months 75 Months 87 Months 99 Months 111 Months 123 Months<br />
1998 1,580,098 1,976,318 2,168,800 2,295,355 2,349,277 2,364,534 2,369,115 2,382,868 2,383,297 2,383,297<br />
1999 1,381,435 1,727,758 1,964,951 2,087,899 2,149,009 2,185,045 2,194,658 2,195,347 2,197,647 2,197,647<br />
2000 1,028,061 1,437,161 1,684,479 1,811,636 1,857,618 1,872,342 1,877,654 1,926,252 1,926,252 1,928,052<br />
2001 927,349 1,242,097 1,397,217 1,451,109 1,493,877 1,511,981 1,516,191 1,515,929 1,515,929 1,515,929<br />
2002 829,681 1,082,300 1,224,059 1,293,186 1,315,056 1,329,357 1,335,917 1,337,868 1,338,065<br />
2003 696,406 898,164 1,005,316 1,046,392 1,070,876 1,069,783 1,076,556 1,076,581<br />
2004 592,098 792,285 889,992 930,948 952,580 963,522 964,537<br />
2005 508,487 706,365 975,425 1,012,855 1,034,798 1,048,912<br />
2006 557,742 689,265 736,903 761,897 778,123<br />
2007 547,462 657,440 721,618 745,306<br />
2008 419,895 566,761 645,488<br />
2009 283,056 410,458<br />
2010 323,953<br />
LOSS DEVELOPMENT FACTORS<br />
Development 15 to 27 27 to 39 39 to 51 51 to 63 63 to 75 75 to 87 87 to 99 99 to 111 111 to 123<br />
3rd Prior 1.236 1.381 1.046 1.023 1.011 1.003 1.026 1.001 1.000<br />
2nd Prior 1.201 1.069 1.038 1.023 0.999 1.005 1.000 1.000 1.000<br />
1st Prior 1.350 1.098 1.034 1.022 1.011 1.006 1.001 1.000 1.001<br />
L<strong>at</strong>est 1.450 1.139 1.033 1.021 1.014 1.001 1.000 1.000 1.000<br />
Average 1.309 1.172 1.038 1.022 1.009 1.004 1.007 1.000 1.000<br />
Loss Development Factors 15 to 123 months = 1.660<br />
27 to 123 months = 1.268<br />
39 to 123 months = 1.082<br />
51 to 123 months = 1.043<br />
Countrywide - Tort St<strong>at</strong>es** Indemnity<br />
Calcul<strong>at</strong>ion of Loss Development Factors<br />
PROPERTY DAMAGE<br />
**Alabama, Alaska, Arizona, Arkansas, California, Colorado, Connecticut, <strong>Delaware</strong>, D.C., Georgia, Idaho, Illinois, Indiana, Iowa, Louisiana, Maine,<br />
Mississippi, Missouri, Montana, Nebraska, Nevada, New Hampshire, New Mexico, North Carolina, Ohio, Oklahoma, Oregon, Rhode Island,<br />
South Carolina, South Dakota, Tennessee, Texas, Vermont, Virginia, Washington, West Virginia, Wisconsin, Wyoming
Bulletin 23<br />
Page 36<br />
Accident Year<br />
Paid Alloc<strong>at</strong>ed Expense<br />
Ending Mar. 15 Months 27 Months 39 Months 51 Months 63 Months 75 Months 87 Months 99 Months 111 Months 123 Months<br />
1998 360,347 736,045 843,350 853,184 867,336 906,462 928,182 939,252 940,915 941,020<br />
1999 395,922 620,850 677,894 689,115 696,008 698,183 698,242 698,477 698,477 698,477<br />
2000 286,278 511,308 603,939 615,478 633,043 634,343 634,343 634,343 634,343 634,343<br />
2001 196,194 337,775 371,795 387,675 392,354 396,044 396,044 396,044 395,994 395,994<br />
2002 125,221 229,405 259,923 281,383 285,666 286,806 286,806 287,406 287,406<br />
2003 78,448 162,594 204,926 238,135 245,322 245,623 246,123 246,123<br />
2004 50,875 135,249 152,122 159,787 164,457 165,457 166,117<br />
2005 58,158 126,081 187,669 188,038 188,038 188,335<br />
2006 48,532 104,225 111,606 119,835 129,988<br />
2007 48,892 81,061 140,349 241,657<br />
2008 11,763 31,912 36,849<br />
2009 35,885 69,076<br />
2010 78,253<br />
LOSS DEVELOPMENT FACTORS<br />
Development 15 to 27 27 to 39 39 to 51 51 to 63 63 to 75 75 to 87 87 to 99 99 to 111 111 to 123<br />
3rd Prior 2.148 1.488 1.050 1.030 1.004 1.000 1.000 1.000 1.000<br />
2nd Prior 1.658 1.071 1.002 1.029 1.001 1.000 1.000 1.000 1.000<br />
1st Prior 2.713 1.731 1.074 1.000 1.006 1.002 1.002 1.000 1.000<br />
L<strong>at</strong>est 1.925 1.155 1.722 1.085 1.002 1.004 1.000 1.000 1.000<br />
Average 2.111 1.361 1.212 1.036 1.003 1.002 1.001 1.000 1.000<br />
Loss Development Factors 15 to 123 months = 3.627<br />
27 to 123 months = 1.718<br />
39 to 123 months = 1.262<br />
51 to 123 months = 1.041<br />
Countrywide - Tort St<strong>at</strong>es** Indemnity<br />
Calcul<strong>at</strong>ion of Loss Development Factors<br />
PERSONAL INJURY PROTECTION<br />
**Alabama, Alaska, Arizona, Arkansas, California, Colorado, Connecticut, <strong>Delaware</strong>, D.C., Georgia, Idaho, Illinois, Indiana, Iowa, Louisiana, Maine,<br />
Mississippi, Missouri, Montana, Nebraska, Nevada, New Hampshire, New Mexico, North Carolina, Ohio, Oklahoma, Oregon, Rhode Island,<br />
South Carolina, South Dakota, Tennessee, Texas, Vermont, Virginia, Washington, West Virginia, Wisconsin, Wyoming
Bulletin 23<br />
Page 37<br />
Accident Year<br />
Paid Alloc<strong>at</strong>ed Expense<br />
Ending Mar. 15 Months 27 Months 39 Months 51 Months 63 Months 75 Months 87 Months 99 Months 111 Months 123 Months<br />
1998 672,182 2,288,626 4,119,141 5,235,288 5,853,894 6,409,291 6,633,207 6,703,152 6,713,295 6,717,245<br />
1999 598,284 1,955,777 3,699,843 5,286,350 6,559,197 6,929,023 7,039,732 7,094,937 7,106,896 7,113,331<br />
2000 382,038 1,620,539 2,983,363 3,799,306 4,363,183 5,083,811 5,304,959 5,430,872 5,483,362 5,503,963<br />
2001 366,930 1,248,073 2,282,003 3,014,682 3,464,835 3,645,338 3,754,929 3,843,023 3,971,444 3,984,893<br />
2002 320,173 1,035,192 1,918,986 2,693,013 3,042,393 3,248,297 3,308,425 3,337,553 3,391,078<br />
2003 251,144 978,908 1,744,961 2,308,597 2,661,131 2,846,292 2,914,292 2,960,643<br />
2004 206,585 666,075 1,185,519 1,492,662 1,646,677 1,724,928 1,734,995<br />
2005 176,229 620,893 1,054,737 1,328,913 1,546,642 1,736,555<br />
2006 158,757 487,916 983,874 1,330,110 1,489,616<br />
2007 157,271 484,507 820,959 1,156,470<br />
2008 106,890 401,646 656,980<br />
2009 147,508 415,946<br />
2010 117,997<br />
LOSS DEVELOPMENT FACTORS<br />
Development 15 to 27 27 to 39 39 to 51 51 to 63 63 to 75 75 to 87 87 to 99 99 to 111 111 to 123<br />
3rd Prior 3.073 1.699 1.259 1.153 1.068 1.030 1.024 1.002 1.001<br />
2nd Prior 3.081 2.016 1.260 1.103 1.070 1.019 1.023 1.010 1.001<br />
1st Prior 3.758 1.694 1.352 1.164 1.048 1.024 1.009 1.033 1.004<br />
L<strong>at</strong>est 2.820 1.636 1.409 1.120 1.123 1.006 1.016 1.016 1.003<br />
Average 3.183 1.761 1.320 1.135 1.077 1.020 1.018 1.015 1.002<br />
Loss Development Factors 15 to 123 months = 9.550<br />
27 to 123 months = 3.000<br />
39 to 123 months = 1.703<br />
51 to 123 months = 1.291<br />
Countrywide - Tort St<strong>at</strong>es** Indemnity<br />
Calcul<strong>at</strong>ion of Loss Development Factors<br />
UNINSURED / UNDERINSURED MOTORISTS<br />
**Alabama, Alaska, Arizona, Arkansas, California, Colorado, Connecticut, <strong>Delaware</strong>, D.C., Georgia, Idaho, Illinois, Indiana, Iowa, Louisiana, Maine,<br />
Mississippi, Missouri, Montana, Nebraska, Nevada, New Hampshire, New Mexico, North Carolina, Ohio, Oklahoma, Oregon, Rhode Island,<br />
South Carolina, South Dakota, Tennessee, Texas, Vermont, Virginia, Washington, West Virginia, Wisconsin, Wyoming
Bulletin 23<br />
Page 38<br />
Accident Year<br />
Paid Alloc<strong>at</strong>ed Expense<br />
Ending Mar. 15 Months 27 Months 39 Months 51 Months 63 Months 75 Months 87 Months 99 Months 111 Months 123 Months<br />
1998 1,166,610 1,356,626 1,517,359 1,669,882 1,772,485 1,821,338 1,857,372 1,927,857 1,961,930 1,965,159<br />
1999 845,040 1,008,133 1,051,836 1,086,547 1,158,054 1,164,843 1,177,970 1,180,111 1,180,385 1,182,426<br />
2000 634,971 769,207 829,193 852,658 855,966 859,009 870,322 909,031 916,862 917,128<br />
2001 504,562 603,683 638,994 650,624 661,834 669,511 669,692 670,836 671,695 671,895<br />
2002 372,597 475,907 524,771 545,400 570,028 573,348 575,237 577,659 578,346<br />
2003 317,503 396,475 454,279 531,155 572,636 575,617 577,266 577,609<br />
2004 204,700 261,988 382,318 397,960 406,426 409,569 410,733<br />
2005 228,125 469,913 642,074 693,834 707,088 716,361<br />
2006 248,220 505,046 603,103 630,719 647,708<br />
2007 193,758 334,275 393,646 431,793<br />
2008 148,078 287,341 353,732<br />
2009 135,158 244,550<br />
2010 112,837<br />
LOSS DEVELOPMENT FACTORS<br />
Development 15 to 27 27 to 39 39 to 51 51 to 63 63 to 75 75 to 87 87 to 99 99 to 111 111 to 123<br />
3rd Prior 2.035 1.366 1.041 1.078 1.006 1.000 1.044 1.000 1.002<br />
2nd Prior 1.725 1.194 1.081 1.021 1.005 1.003 1.002 1.009 1.002<br />
1st Prior 1.940 1.178 1.046 1.019 1.008 1.003 1.004 1.001 1.000<br />
L<strong>at</strong>est 1.809 1.231 1.097 1.027 1.013 1.003 1.001 1.001 1.000<br />
Average 1.877 1.242 1.066 1.036 1.008 1.002 1.013 1.003 1.001<br />
Loss Development Factors 15 to 123 months = 2.647<br />
27 to 123 months = 1.410<br />
39 to 123 months = 1.135<br />
51 to 123 months = 1.064<br />
Countrywide - Tort St<strong>at</strong>es** Indemnity<br />
Calcul<strong>at</strong>ion of Loss Development Factors<br />
COLLISION<br />
**Alabama, Alaska, Arizona, Arkansas, California, Colorado, Connecticut, <strong>Delaware</strong>, D.C., Georgia, Idaho, Illinois, Indiana, Iowa, Louisiana, Maine,<br />
Mississippi, Missouri, Montana, Nebraska, Nevada, New Hampshire, New Mexico, North Carolina, Ohio, Oklahoma, Oregon, Rhode Island,<br />
South Carolina, South Dakota, Tennessee, Texas, Vermont, Virginia, Washington, West Virginia, Wisconsin, Wyoming
Bulletin 23<br />
Page 39<br />
Accident Year<br />
Paid Alloc<strong>at</strong>ed Expense<br />
Ending Mar. 15 Months 27 Months 39 Months 51 Months 63 Months 75 Months 87 Months 99 Months 111 Months 123 Months<br />
1998 1,520,146 1,889,513 2,016,474 2,094,265 2,141,447 2,169,829 2,169,819 2,161,255 2,161,857 2,164,003<br />
1999 1,649,577 1,986,506 2,088,167 2,102,467 2,124,399 2,121,801 2,114,501 2,129,369 2,128,826 2,128,808<br />
2000 1,140,212 1,411,172 1,517,874 1,552,372 1,583,605 1,572,059 1,583,130 1,596,715 1,596,496 1,596,324<br />
2001 909,957 1,069,949 1,123,084 1,155,178 1,160,959 1,165,541 1,167,118 1,172,779 1,172,808 1,172,808<br />
2002 685,830 927,325 1,003,794 1,069,252 1,136,771 1,230,128 1,246,516 1,265,516 1,265,516<br />
2003 538,097 653,419 912,005 1,109,581 1,119,337 1,123,883 1,127,791 1,127,791<br />
2004 391,324 462,794 515,370 534,271 553,443 574,494 574,499<br />
2005 335,535 413,240 444,235 434,121 434,098 436,198<br />
2006 275,455 349,321 363,095 375,010 384,524<br />
2007 259,343 356,386 369,392 380,453<br />
2008 272,292 380,172 438,371<br />
2009 314,790 395,195<br />
2010 259,304<br />
LOSS DEVELOPMENT FACTORS<br />
Development 15 to 27 27 to 39 39 to 51 51 to 63 63 to 75 75 to 87 87 to 99 99 to 111 111 to 123<br />
3rd Prior 1.268 1.075 1.037 1.009 1.082 1.001 1.009 1.000 1.001<br />
2nd Prior 1.374 1.039 0.977 1.036 1.004 1.013 1.005 1.000 1.000<br />
1st Prior 1.396 1.036 1.033 1.000 1.038 1.003 1.015 1.000 1.000<br />
L<strong>at</strong>est 1.255 1.153 1.030 1.025 1.005 1.000 1.000 1.000 1.000<br />
Average 1.323 1.076 1.019 1.017 1.032 1.005 1.007 1.000 1.000<br />
Loss Development Factors 15 to 123 months = 1.543<br />
27 to 123 months = 1.165<br />
39 to 123 months = 1.083<br />
51 to 123 months = 1.063<br />
Countrywide - Tort St<strong>at</strong>es** Indemnity<br />
Calcul<strong>at</strong>ion of Loss Development Factors<br />
COMPREHENSIVE<br />
**Alabama, Alaska, Arizona, Arkansas, California, Colorado, Connecticut, <strong>Delaware</strong>, D.C., Georgia, Idaho, Illinois, Indiana, Iowa, Louisiana, Maine,<br />
Mississippi, Missouri, Montana, Nebraska, Nevada, New Hampshire, New Mexico, North Carolina, Ohio, Oklahoma, Oregon, Rhode Island,<br />
South Carolina, South Dakota, Tennessee, Texas, Vermont, Virginia, Washington, West Virginia, Wisconsin, Wyoming
Automobile Liability <strong>Insurance</strong><br />
Other Taxes Prem & Fire Tax<br />
2007 2008 2009 2009<br />
1. Direct Premiums Written $719,891 $666,686 $1,195,601 $1,195,601<br />
2. Taxes* $2,408 $1,732 $2,128 $24,629<br />
3. R<strong>at</strong>io (2) / (1) 0.00335 0.00260 0.00178 0.02060<br />
4. Three Year Total 0.00257 0.02060<br />
5. Proposed Provision 2.32%<br />
Automobile Physical Damage <strong>Insurance</strong><br />
Other Taxes Prem & Fire Tax<br />
2007 2008 2009 2009<br />
1. Direct Premiums Written $310,082 $297,536 $419,600 $419,600<br />
2. Taxes* $367 $244 $267 $8,644<br />
3. R<strong>at</strong>io (2) / (1) 0.00118 0.00082 0.00064 0.021<br />
4. Three Year Total 0.00088 0.021<br />
5. Proposed Provision 2.15%<br />
*Does not include Federal Income Taxes<br />
ALLSTATE INDEMNITY COMPANY<br />
PRIVATE PASSENGER AUTOMOBILE INSURANCE<br />
DELAWARE TAXES<br />
2007, 2008, 2009<br />
Bulletin 23<br />
Page 40
ALLSTATE INDEMNITY COMPANY<br />
PRIVATE PASSENGER AUTOMOBILE INSURANCE<br />
DELAWARE LICENSES & FEES<br />
2007, 2008, 2009<br />
Automobile Liability <strong>Insurance</strong><br />
2007 2008 2009<br />
1. Direct Premiums Written $666,686 $1,195,601 $1,544,642<br />
2. Licenses & Fees $985 $1,609 $2,611<br />
3. R<strong>at</strong>io (2) / (1) 0.00148 0.00135 0.00169<br />
4. Three Year Total 0.00150<br />
5. Proposed Provision 0.15%<br />
Automobile Physical Damage <strong>Insurance</strong><br />
2007 2008 2009<br />
1. Direct Premiums Written $297,536 $419,600 $524,544<br />
2. Licenses & Fees $439 $550 $886<br />
3. R<strong>at</strong>io (2) / (1) 0.00148 0.00131 0.00169<br />
4. Three Year Total 0.00149<br />
5. Proposed Provision 0.15%<br />
Bulletin 23<br />
Page 41
ALLSTATE INDEMNITY COMPANY<br />
PRIVATE PASSENGER AUTOMOBILE<br />
DELAWARE<br />
DERIVATION OF COMMISSION & BROKERAGE EXPENSE PROVISION<br />
(1) 2009 Written Premium<br />
Allst<strong>at</strong>e Indemnity Company $1,615,202<br />
(2) 2009 Commission & Brokerage Expense of the Annual St<strong>at</strong>ement<br />
Allst<strong>at</strong>e Indemnity Company $122,024<br />
(3) 2009 Commission & Brokerage Expense Provision 7.6%<br />
(2)/(1)<br />
(4) Overall Commission & Brokerage Expense Provision 7.6%<br />
for <strong>Delaware</strong><br />
Bulletin 23<br />
Page 42
ALLSTATE INDEMNITY COMPANY<br />
PRIVATE PASSENGER AUTOMOBILE<br />
DELAWARE<br />
DEVELOPMENT OF EXPECTED LOSSES AND LOSS ADJUSTMENT RATIO<br />
Liability Collision Comprehensive<br />
Commissions & Brokerage 7.6 % 7.6 % 7.6 %<br />
Other Acquisition Expense 4.7 4.7 4.7<br />
<strong>General</strong> Expense 4.8 4.8 4.8<br />
Taxes, Licenses and Fees* 2.4 2.3 2.3<br />
Underwriting Profit Provision 9.3 10.4 10.4<br />
Debt Provision 1.3 1.3 1.3<br />
Subtotal 30.1 31.1 31.1<br />
Loss and Loss Adjustment 69.9 68.9 68.9<br />
Total 100.0 100.0 100.0<br />
*St<strong>at</strong>e Taxes - Does not include Federal Income Tax<br />
Bulletin 23<br />
Page 43