legally speaking - Justice Institute of British Columbia
legally speaking - Justice Institute of British Columbia
legally speaking - Justice Institute of British Columbia

Create successful ePaper yourself
Turn your PDF publications into a flip-book with our unique Google optimized e-Paper software.
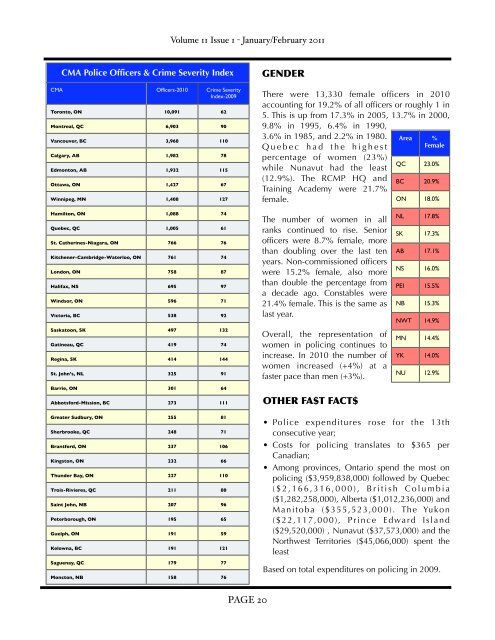
CMA Police Officers & Crime Severity Index<br />
CMA Officers-2010 Crime Severity<br />
Index-2009<br />
Toronto, ON 10,091 62<br />
Montreal, QC 6,903 90<br />
Vancouver, BC 3,968 110<br />
Calgary, AB 1,982 78<br />
Edmonton, AB 1,932 115<br />
Ottawa, ON 1,427 67<br />
Winnipeg, MN 1,408 127<br />
Hamilton, ON 1,088 74<br />
Quebec, QC 1,005 61<br />
St. Catherines-Niagara, ON 766 76<br />
Kitchener-Cambridge-Waterloo, ON 761 74<br />
London, ON 758 87<br />
Halifax, NS 695 97<br />
Windsor, ON 596 71<br />
Victoria, BC 538 92<br />
Saskatoon, SK 497 132<br />
Gatineau, QC 419 74<br />
Regina, SK 414 144<br />
St. John’s, NL 325 91<br />
Barrie, ON 301 64<br />
Abbotsford-Mission, BC 273 111<br />
Greater Sudbury, ON 255 81<br />
Sherbrooke, QC 248 71<br />
Brantford, ON 237 106<br />
Kingston, ON 232 66<br />
Thunder Bay, ON 227 110<br />
Trois-Rivieres, QC 211 80<br />
Saint John, NB 207 96<br />
Peterborough, ON 195 65<br />
Guelph, ON 191 59<br />
Kelowna, BC 191 121<br />
Saguenay, QC 179 77<br />
Moncton, NB 158 76<br />
Volume 11 Issue 1 - January/February 2011<br />
PAGE 20<br />
GENDER<br />
There were 13,330 female <strong>of</strong>ficers in 2010<br />
accounting for 19.2% <strong>of</strong> all <strong>of</strong>ficers or roughly 1 in<br />
5. This is up from 17.3% in 2005, 13.7% in 2000,<br />
9.8% in 1995, 6.4% in 1990,<br />
3.6% in 1985, and 2.2% in 1980.<br />
Q u e b e c h a d t h e h i g h e s t<br />
percentage <strong>of</strong> women (23%)<br />
while Nunavut had the least<br />
(12.9%). The RCMP HQ and<br />
Training Academy were 21.7%<br />
female.<br />
The number <strong>of</strong> women in all<br />
ranks continued to rise. Senior<br />
<strong>of</strong>ficers were 8.7% female, more<br />
than doubling over the last ten<br />
years. Non-commissioned <strong>of</strong>ficers<br />
were 15.2% female, also more<br />
than double the percentage from<br />
a decade ago. Constables were<br />
21.4% female. This is the same as<br />
last year.<br />
Overall, the representation <strong>of</strong><br />
women in policing continues to<br />
increase. In 2010 the number <strong>of</strong><br />
women increased (+4%) at a<br />
faster pace than men (+3%).<br />
OTHER FA$T FACT$<br />
Area %<br />
Female<br />
QC 23.0%<br />
BC 20.9%<br />
ON 18.0%<br />
NL 17.8%<br />
SK 17.3%<br />
AB 17.1%<br />
NS 16.0%<br />
PEI 15.5%<br />
NB 15.3%<br />
NWT 14.9%<br />
MN 14.4%<br />
YK 14.0%<br />
NU 12.9%<br />
• Police expenditures rose for the 13th<br />
consecutive year;<br />
• Costs for policing translates to $365 per<br />
Canadian;<br />
• Among provinces, Ontario spend the most on<br />
policing ($3,959,838,000) followed by Quebec<br />
( $ 2 , 1 6 6 , 3 1 6 , 0 0 0 ) , B r i t i s h C o l u m b i a<br />
($1,282,258,000), Alberta ($1,012,236,000) and<br />
Manitoba ($355,523,000). The Yukon<br />
($22,117,000), Prince Edward Island<br />
($29,520,000) , Nunavut ($37,573,000) and the<br />
Northwest Territories ($45,066,000) spent the<br />
least<br />
Based on total expenditures on policing in 2009.