Alaska University Transportation Center PROJECT - Institute of ...
Alaska University Transportation Center PROJECT - Institute of ...
Alaska University Transportation Center PROJECT - Institute of ...

You also want an ePaper? Increase the reach of your titles
YUMPU automatically turns print PDFs into web optimized ePapers that Google loves.
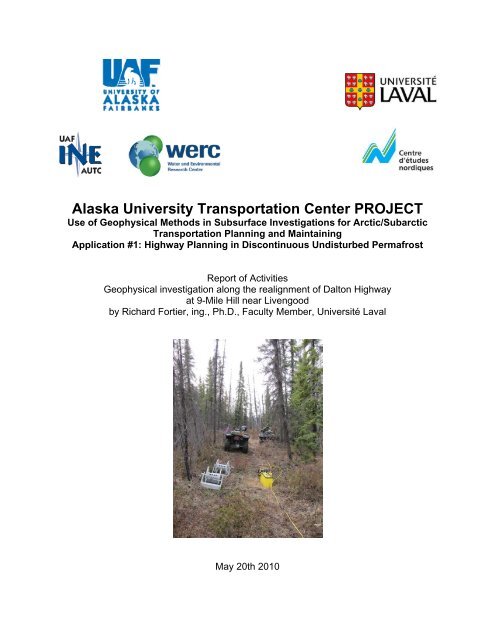
<strong>Alaska</strong> <strong>University</strong> <strong>Transportation</strong> <strong>Center</strong> <strong>PROJECT</strong><br />
Use <strong>of</strong> Geophysical Methods in Subsurface Investigations for Arctic/Subarctic<br />
<strong>Transportation</strong> Planning and Maintaining<br />
Application #1: Highway Planning in Discontinuous Undisturbed Permafrost<br />
Report <strong>of</strong> Activities<br />
Geophysical investigation along the realignment <strong>of</strong> Dalton Highway<br />
at 9-Mile Hill near Livengood<br />
by Richard Fortier, ing., Ph.D., Faculty Member, Université Laval<br />
May 20th 2010
Cover photograph<br />
Electrical resistivity tomography in progress along the survey line at 9-Mile Hill<br />
study site, Dalton Highway.
Report <strong>of</strong> activities – Geophysical investigation at 9-Mile Hill study site 1<br />
<strong>Alaska</strong> <strong>University</strong> <strong>Transportation</strong> <strong>Center</strong> <strong>PROJECT</strong><br />
Use <strong>of</strong> Geophysical Methods in Subsurface Investigations for Arctic/Subarctic<br />
<strong>Transportation</strong> Planning and Maintaining<br />
Application #1: Highway Planning in Discontinuous Undisturbed Permafrost<br />
Introduction<br />
Report <strong>of</strong> Activities<br />
Geophysical investigation along the realignment <strong>of</strong> Dalton Highway<br />
at 9-Mile Hill near Livengood<br />
This report <strong>of</strong> activities presents the preliminary results <strong>of</strong> a geophysical<br />
investigation undertaken along the realignment <strong>of</strong> Dalton Highway at 9-Mile Hill near<br />
Livengood. The principal goal <strong>of</strong> this investigation is to assess the spatial distribution <strong>of</strong><br />
permafrost conditions along the realignment based on the interpretation <strong>of</strong> geophysical<br />
surveys including the information from boreholes.<br />
The <strong>Alaska</strong> Department <strong>of</strong> <strong>Transportation</strong> and Public Facilities (ADOT&PF) is<br />
investigating the reconstruction <strong>of</strong> approximately 4 miles <strong>of</strong> the Dalton Highway between<br />
the mile post (MP) 8 and 12 (Figure 1) to current design standards for providing safer<br />
alignments, grades, and a new asphalt surface. The project area is located about<br />
10 miles east <strong>of</strong> Livengood and 80 miles north <strong>of</strong> Fairbanks. The Trans-<strong>Alaska</strong> Pipeline<br />
parallels the Dalton Highway and is located approximately 1.5 miles to the east <strong>of</strong> the<br />
project location. The three mile long realignment is sloping gently to the north-west.<br />
According to Péwé (1975) and Jorgenson et al. (2008), the study area is in the<br />
discontinuous permafrost zone. The bedrock is made <strong>of</strong> highly deformed and weathered<br />
sedimentary rocks, and overlain by colluvial and fluvial gravelly soils, and silt (loess).<br />
Permafrost formed syngenetically during the late Pleistocene is ice-rich with high<br />
occurrence <strong>of</strong> ice wedges.<br />
Over the last 20 years, the Northern Region Materials Section (NRMS)<br />
conducted four separate geotechnical investigation <strong>of</strong> the project area including several<br />
boreholes (Schlichting et al., 2006). In 2008, 8 boreholes were drilled for permafrost<br />
sampling to allow the detailed description <strong>of</strong> cryostructure (Shur and Kanevskiy, 2010).<br />
The ground-truth coming from these boreholes <strong>of</strong>fers a unique opportunity to verify the<br />
capabilities <strong>of</strong> geophysical methods for permafrost investigation along linear man-made<br />
infrastructures with well-documented borehole data.
Report <strong>of</strong> activities – Geophysical investigation at 9-Mile Hill study site 2<br />
Figure 1: Projected realignment <strong>of</strong> the Dalton Highway between the MP 8 and 12.<br />
Reconnaissance missions and geophysical investigation program<br />
Before carrying out the geophysical investigation along the realignment <strong>of</strong> Dalton<br />
Highway at 9-Mile Hill near Livengood, the study site was visited twice for<br />
reconnaissance purpose.<br />
During the first mission on April 20 th 2010, Richard Fortier and Mikhail Kanevskiy<br />
put markers at regular 25-m interval along the survey line (Figure 2). The borehole<br />
UAF-4 was selected as the reference position at 0+000 m. The distance along the<br />
survey line increases going north. The snow cover about 1-foot thick was rapidly
Report <strong>of</strong> activities – Geophysical investigation at 9-Mile Hill study site 3<br />
decaying at that time (Figure 3). It was decided to postpone the geophysical<br />
investigation in the coming weeks after the snow melting.<br />
Figure 2: Projected realignment <strong>of</strong> the Dalton Highway between the MP 8 and 12.
Report <strong>of</strong> activities – Geophysical investigation at 9-Mile Hill study site 4<br />
Figure 3: Snow cover during the first reconnaissance mission on April 20 th 2010.<br />
The second mission took place two weeks later on May 5 th 2010. Richard Fortier<br />
and Mikhail Kanevskiy walked the survey line and measured the ground temperatures<br />
along thermistor cables in the boreholes 08-040, 08-046 and 08-053 (Figures 4 and 5).<br />
The ground temperature at a depth <strong>of</strong> 10 m is -1.5, -0.5 and -1.7 °C in the boreholes<br />
08-040, 08-046 and 08-053 respectively. The permafrost temperature is colder in the<br />
bottom hill near the Dalton Highway and at the top <strong>of</strong> the hill than at the middle hill. They<br />
measured also the contact resistance between two electrodes driven 2-m apart at<br />
several locations along the survey line in the active layer using an ohmmeter. In<br />
average, the resistance contact was 10.1 kohm. The thawing front was only few<br />
centimeters deep and most <strong>of</strong> the active layer was still frozen on May 5 th 2010. Even if<br />
this contact resistance was judged a little bite too high for the measurement <strong>of</strong> electrical<br />
resistivity using galvanic contacts, it was decided that the geophysical surveys would be<br />
carried out in the coming days.
Report <strong>of</strong> activities – Geophysical investigation at 9-Mile Hill study site 5<br />
Figure 4: Thermistor cable in borehole 08-053 (see Figure 2 for its location). Note the<br />
absence <strong>of</strong> snow cover on May 5 th 2010.<br />
Figure 5: Ground temperatures measured along the thermistor cables in<br />
boreholes 08-040, 08-046 and 08-053 (see Figure 2 for their location) on<br />
August 11 th 1998 and May 5 th 2010.
Report <strong>of</strong> activities – Geophysical investigation at 9-Mile Hill study site 6<br />
The geophysical investigation along the realignment <strong>of</strong> Dalton Highway at 9-Mile<br />
Hill near Livengood was performed from May 7 th to May 10 th and on May 20 th 2010.<br />
Electrical resistivity tomography (ERT) and ground penetrating radar (GPR) pr<strong>of</strong>iling<br />
were carried out in the field. Two types <strong>of</strong> ERT were conducted: 1) direct-current<br />
resistivity (the standard method), and 2) capacitive-coupled resistivity (CCR)<br />
measurements. These geophysical tools used along the same survey line are<br />
complementary methods (De Pascale et al., 2008; Fortier and Bolduc, 2008; Fortier and<br />
Savard, submitted). While ERT is effective for characterizing the state <strong>of</strong> the permafrost,<br />
it does not define well the subsurface stratigraphic contacts. GPR, on the other hand,<br />
defines accurately the stratigraphy contacts, but does not provide as much information<br />
with respect to the state <strong>of</strong> the permafrost. The combined interpretation <strong>of</strong> the ERT and<br />
GPR can therefore lead to a high resolution cross-section <strong>of</strong> permafrost conditions.<br />
They were successively used to map massive ice, ice wedges, thermokarst, and basic<br />
stratigraphic relationships (De Pascale et al., 2008) and permafrost conditions<br />
underneath a road embankment (Fortier and Bolduc, 2008) and an airfield (Fortier and<br />
Savard, submitted). The galvanic contact ERT was carried out by Richard Fortier and<br />
William Lee from May 7 th to May 9 th while the CCR-ERT was conducted by Kevin Bjella<br />
from the CRREL, Richard Fortier and William Schnabel. Richard Fortier and<br />
Erin Trochim were in charge <strong>of</strong> the GPR pr<strong>of</strong>iling.<br />
Among the available near-surface geophysical methods, electrical resistivity<br />
tomography (ERT) is a powerful tool for permafrost investigation because the electrical<br />
resistivity <strong>of</strong> a medium is highly sensitive to the transition from unfrozen to frozen state.<br />
Values <strong>of</strong> apparent electrical resistivity for the galvanic contact ERT were<br />
measured using an Earth Resistivity/IP Meter SUPER STING R1 IP (Figure 6) from AGI<br />
Advanced Geosciences Inc. (http://www.agiusa.com). This earth resistivity meter is<br />
made <strong>of</strong> 4 cables <strong>of</strong> 21 connectors 2-m apart each for a total <strong>of</strong> 84 electrodes driven<br />
into the ground for galvanic contacts. A Wenner array with 2-m spacing between the<br />
electrodes was used to perform the ERT with a theoretical depth <strong>of</strong> investigation from 1<br />
to about 25 m. The electrodes were aligned along the survey line. The electrodes<br />
selection for direct injection <strong>of</strong> electrical current into the ground and measurement <strong>of</strong><br />
induced electrical potential was made automatically by the earth resistivity meter<br />
according to a previous array programming downloaded in the SUPER STING R1 IP.<br />
Once the 84 electrodes were scanned by the earth resistivity meter, one cable <strong>of</strong><br />
21 connectors at the beginning <strong>of</strong> the ERT was moved at the other end to perform a “roll<br />
along” and increase the ERT length. In total, 11 “roll alongs” were performed for a total<br />
ERT length <strong>of</strong> 640 m. The location <strong>of</strong> the ERT ends is given in Figure 7. The galvanic<br />
contact ERT was carried out from north to south.<br />
The data set <strong>of</strong> apparent electrical resistivity measured with the SUPER STING<br />
R1 IP is presented in Figure 8 under the form <strong>of</strong> a pseudo-section <strong>of</strong> measured<br />
apparent electrical resistivity. This data set was also inverted using a quasi-Newton<br />
method (Loke and Barker 1996) and the s<strong>of</strong>tware packages RES2DINV (Loke 1996) to<br />
produce a model <strong>of</strong> electrical resistivity (Figure 8). This preliminary model does not take<br />
into account the topography effect along the survey line. The root–mean–square error
Report <strong>of</strong> activities – Geophysical investigation at 9-Mile Hill study site 7<br />
(RMS error) between the calculated and measured values <strong>of</strong> apparent electrical<br />
resistivity is 10.6% after 3 iterations. The downhill section <strong>of</strong> the ERT survey is more<br />
resistive than the uphill section (Figure 8). The contrast in electrical resistivity between<br />
these two sections is located at a distance 0+630 m along the survey line. The ERT<br />
survey covers in part the sections 1 and 2 (Figures 1 and 7) as identified by Shur and<br />
Kanevskiy (2010). The permafrost in section 1 is ice-rich with a high occurrence <strong>of</strong> ice<br />
wedges while the one in section 2 is ice-poor. Based on the analysis <strong>of</strong> boreholes, Shur<br />
and Kanevskiy (2010) located the limit between these two sections at a distance <strong>of</strong><br />
0+300 m relative the reference location at UAF-4 (Figures 1, 2, and 7).<br />
Figure 6: Earth Resistivity/IP Meter SUPER STING R1 IP (Figure 6) from AGI<br />
Advanced Geosciences Inc. Electrical resistivity tomography performed<br />
along the survey line at 9-Mile Hill study site, Dalton Highway.
Report <strong>of</strong> activities – Geophysical investigation at 9-Mile Hill study site 8<br />
Figure 7: Location <strong>of</strong> the geophysical surveys carried out along the realignment <strong>of</strong><br />
Dalton Highway at 9-Mile Hill near Livengood.<br />
Figure 8: Results <strong>of</strong> galvanic contact ERT (see Figure 7 for location). Pseudo-sections<br />
<strong>of</strong> measured and calculated apparent electrical resistivity, and model <strong>of</strong><br />
electrical resistivity along the realignment <strong>of</strong> Dalton Highway at 9-Mile Hill<br />
near Livengood. The north direction is on the left.
Report <strong>of</strong> activities – Geophysical investigation at 9-Mile Hill study site 9<br />
The CCR system is made <strong>of</strong> one transmitter and one up to five receivers to<br />
achieve a dipole-dipole configuration (Figure 9). The transmitter and receivers are<br />
coaxial cables lying on the ground as antennas to couple an AC signal into the ground<br />
and measure the induced AC signal respectively. The conductor in the coaxial cable<br />
acts as one plate <strong>of</strong> a capacitor and the ground acts as the other plate while the<br />
insulating sheath <strong>of</strong> the coaxial cable is the capacitor’s insulator. The AC current in the<br />
transmitter cable can pass into the ground similarly to an AC signal through a capacitor.<br />
The capacitance <strong>of</strong> the receiver cable is similarly charged, allowing the measurement <strong>of</strong><br />
an induced AC voltage in the receiver proportional to the electrical resistivity <strong>of</strong> the<br />
ground. This provides an AC equivalent <strong>of</strong> a standard DC resistivity measurement<br />
without the galvanic contacts needed for the standard method (for more details on the<br />
theory behind CCR, see Tim<strong>of</strong>eev et al. 1994 and Kuras et al 2006). This is a major<br />
advantage since it can be hard to drive electrodes in frozen active layer or man-made<br />
infrastructures such as a pad <strong>of</strong> highly compacted crushed rocks <strong>of</strong> an embankment.<br />
Moreover, since the system does not depend on surface contact, it can be towed on the<br />
ground surface while collecting data for fast investigation along a linear infrastructure<br />
such as road or planned realignment <strong>of</strong> a road. According to Kuras et al. (2006), the DC<br />
resistivity measurement is emulated through CCR when the ground resistivity is high<br />
such as the dry surface <strong>of</strong> an embankment. The CCR is therefore a geophysical tool<br />
well suited to permafrost investigation.<br />
The apparent electrical resistivities along the realignment <strong>of</strong> Dalton Highway at<br />
9-Mile Hill near Livengood were also measured using an OhmMapper TR5 system with<br />
one transmitter and five receivers operating at a frequency <strong>of</strong> about 16.5 kHz made by<br />
GEometrics. The OhmMapper is owned by the Cold Regions and Research Engineering<br />
Laboratory (CRREL). The location <strong>of</strong> the ends <strong>of</strong> the CCR-ERT survey line is given in<br />
Figure 7. The CCR-ERT survey line is longer than the one <strong>of</strong> the galvanic contact ERT<br />
since the production rate in terms <strong>of</strong> meter per day is much higher for the CCR-ETR<br />
than the galvanic contact ERT. Only one day was needed to achieve a longer ERT<br />
survey line with the CCR system in comparison to three days for the shorter one with<br />
the earth resistivity meter. Markers at regular 25-m intervals put along the survey lines<br />
allowed the location <strong>of</strong> the resistivity measurements relative to the reference position at<br />
borehole UAF-4 (Figures 2 and 7). Four runs with different dipole length and spacing<br />
between the dipoles were performed along the survey line (Table 1). The variation in<br />
spacing between the dipoles changes the depth <strong>of</strong> investigation for producing pseudosections<br />
<strong>of</strong> observed apparent electrical resistivity along the survey lines. The apparent<br />
electrical resistivities measured along the survey line for the four runs are given in<br />
Figure 10. The data have been despiked. The pseudo-sections <strong>of</strong> measured apparent<br />
electrical resistivity appear in Figure 11. The north end is more resistive than the south<br />
end. These preliminary pseudo-sections do not take into account the topography effect<br />
along the survey line. The merge <strong>of</strong> the data files <strong>of</strong> the four runs and the inversion <strong>of</strong><br />
measured apparent electrical resistivity are not completed yet.
Report <strong>of</strong> activities – Geophysical investigation at 9-Mile Hill study site 10<br />
Figure 9: Capacitive-coupled resistivity (CCR) system: the OhmMapper TR5 made by<br />
Geometrics and owned by the CRREL.<br />
Table 1: Electrode cable and dipole lengths, spacing and n factor between the dipoles,<br />
and theoretical depth <strong>of</strong> investigation for each run <strong>of</strong> the CCR-ERT survey.<br />
Run Electrode<br />
cable length<br />
(m)<br />
Dipole<br />
length<br />
(m)<br />
Spacing between the<br />
transmitter dipole and<br />
the 5 receiver dipoles<br />
(receiver number)<br />
(m)<br />
n factor<br />
between<br />
the dipoles<br />
Theoretical depth<br />
<strong>of</strong> investigation<br />
#1 2.5 5 5 (#1) 1 2.1<br />
7.5 (#2) 1.5 2.8<br />
10 (#3) 2 3.5<br />
12.5 (#4) 2.5 4.2<br />
15 (#5) 3 4.9<br />
#2 5 10 5 (#1) 0.5 3.5<br />
10 (#2) 1 4.9<br />
15 (#3) 1.5 6.3<br />
20 (#4) 2 7.7<br />
25 (#5) 2.5 9.1<br />
#3 5 10 25 (#1) 2.5 9.0<br />
30 (#2) 3 11.0<br />
35 (#3) 3.5 13.0<br />
40 (#4) 4 15.0<br />
45 (#5) 4.5 17.0<br />
#4 5 10 50 (#1) 5 14.0<br />
55 (#2) 5.5 16.0<br />
60 (#3) 6 18.0<br />
65 (#4) 6.5 20.0<br />
70 (#5) 7 22.0<br />
(m)
Report <strong>of</strong> activities – Geophysical investigation at 9-Mile Hill study site 11<br />
A)<br />
B)<br />
C)<br />
D)<br />
Figure 10: Results <strong>of</strong> OhmMapper survey (see Figure 7 for location). Variations in<br />
measured apparent electrical resistivity along the realignment <strong>of</strong> Dalton<br />
Highway at 9-Mile Hill near Livengood (the receivers #1 to #5 are the red,<br />
blue, green, purple and yellow curves respectively). A to D) Run #1 to #4<br />
(see Table 1). The north direction is on the right.
Report <strong>of</strong> activities – Geophysical investigation at 9-Mile Hill study site 12<br />
A)<br />
B)<br />
C)<br />
D)<br />
Figure 11: Results <strong>of</strong> OhmMapper survey (see Figure 7 for location). Pseudo-sections<br />
<strong>of</strong> measured apparent electrical resistivity along the realignment <strong>of</strong> Dalton<br />
Highway at 9-Mile Hill near Livengood. A to D) Run #1 to #4 (see Table 1).<br />
The north direction is on the right.
Report <strong>of</strong> activities – Geophysical investigation at 9-Mile Hill study site 13<br />
The ground penetrating radar (GPR) is used for a wide range <strong>of</strong> subsurface<br />
mapping applications to characterize the structure and stratigraphy <strong>of</strong> near-surface<br />
geology. This geophysical tool is made <strong>of</strong> a pair <strong>of</strong> transmitting-receiving antennas lying<br />
on the ground surface (Figure 12). At each position <strong>of</strong> the antennas along a survey line,<br />
few short electromagnetic impulses at a given nominal frequency are transmitted from<br />
the transmitting antenna in the ground and recorded and stacked for amplification by the<br />
receiving antenna over a given time period. The radar signal amplitude <strong>of</strong> each<br />
recorded trace is then plotted, one trace against the other, on a travel time pr<strong>of</strong>ile<br />
(Figure 13). High amplitude on the pr<strong>of</strong>ile corresponds to a reflection <strong>of</strong> the radar signal<br />
back to the surface on ground interfaces such as the water table and thawing front<br />
characterized by a contrast <strong>of</strong> dielectric permittivity.<br />
A Sensors & S<strong>of</strong>tware pulseEKKO Pro with antennas <strong>of</strong> 100 MHz was used in<br />
the present geophysical investigation to perform two survey types: 1) fixed–<strong>of</strong>fset<br />
reflection pr<strong>of</strong>ile for stratigraphic mapping and 2) common mid–point (CMP) sounding<br />
for assessing the velocity <strong>of</strong> the radar signal in the ground. The GPR pr<strong>of</strong>ile along the<br />
survey line is given in Figure 13 without and with the correction <strong>of</strong> the topography while<br />
one <strong>of</strong> the two GPR-CMP soundings performed along the survey line near the borehole<br />
UAF-9 at 0+960 m and its analysis are given in Figure 14. The analysis <strong>of</strong> a CMP<br />
sounding consists in stacking the data traces corrected in time for many different<br />
velocities to produce a travel time–velocity graph. When the corrected traces are<br />
stacked at an incorrect velocity, they tend to interfere destructively and to produce low<br />
amplitudes on the graph. When they are stacked at a correct velocity, they add together<br />
constructively and produce high amplitudes. The highest amplitudes on the travel-timevelocity<br />
graph are then associated with a velocity value. For instance, according to the<br />
analysis <strong>of</strong> the GPR-CMP sounding carried out along the survey line (Figure 14), the<br />
velocity <strong>of</strong> the radar signal varies between 0.09 and 0.13 m/ns for maximum value <strong>of</strong><br />
about 0.1 m/ns. This value was used to transform the GPR travel time pr<strong>of</strong>ile into a<br />
depth pr<strong>of</strong>ile for assessing the depth <strong>of</strong> the reflectors (Figure 13).
Report <strong>of</strong> activities – Geophysical investigation at 9-Mile Hill study site 14<br />
Figure 12: Ground penetrating radar (GPR) pulseEKKO Pro with antennas <strong>of</strong> 100 MHz<br />
made by Sensors & S<strong>of</strong>tware inc.
Report <strong>of</strong> activities – Geophysical investigation at 9-Mile Hill study site 15<br />
A)<br />
B)<br />
Figure 13: GPR reflection pr<strong>of</strong>ile (see Figure 7 for location) along the realignment <strong>of</strong><br />
Dalton Highway at 9-Mile Hill near Livengood. A) Without and B) with the<br />
correction <strong>of</strong> the topography. The north direction is on the right.
Report <strong>of</strong> activities – Geophysical investigation at 9-Mile Hill study site 16<br />
A)<br />
B)<br />
Figure 14: A) GPR-CMP sounding (see Figure 7 for location) along the realignment <strong>of</strong><br />
Dalton Highway at 9-Mile Hill near Livengood. B) Analysis <strong>of</strong> the GPR-CMP<br />
sounding is given on the right.
Report <strong>of</strong> activities – Geophysical investigation at 9-Mile Hill study site 17<br />
Processing and interpretation <strong>of</strong> geophysical surveys<br />
The preliminary results <strong>of</strong> the geophysical investigation undertaken along the<br />
realignment <strong>of</strong> Dalton Highway at 9-Mile Hill near Livengood are given herein in this<br />
report <strong>of</strong> activities. The following steps remain to complete this geophysical<br />
investigation:<br />
1) merge the data files <strong>of</strong> the four runs <strong>of</strong> the OhmMapper along the survey line,<br />
2) produce the pseudo-sections <strong>of</strong> apparent electrical resistivity measured during the<br />
galvanic contact ERT and the CCR-ERT taking into the topography effect,<br />
3) take into account the topography effect in the inversion <strong>of</strong> the pseudo-section <strong>of</strong><br />
apparent electrical resistivity measured during the galvanic contact ERT and the<br />
CCR-ERT,<br />
4) produce models <strong>of</strong> electrical resistivity from the inversion <strong>of</strong> the pseudo-section <strong>of</strong><br />
apparent electrical resistivity measured during the galvanic contact ERT and the<br />
CCR-ERT,<br />
5) compare the two models <strong>of</strong> electrical resistivity,<br />
6) identify the permafrost conditions in the models <strong>of</strong> electrical resistivity,<br />
7) correct the topography effect in the GPR reflection pr<strong>of</strong>ile,<br />
8) identify the cryostratigraphic contacts in the GPR reflection pr<strong>of</strong>ile,<br />
9) produce a cross-section <strong>of</strong> permafrost conditions and cryostratigraphic contacts<br />
along the survey line by combining the interpretation <strong>of</strong> the ERT and GPR surveys,<br />
10) include the ground-truth information coming from the boreholes in the previous<br />
steps,<br />
11) identify the zones vulnerable to permafrost degradation along the survey line,<br />
12) write a final report, and<br />
13) submit a manuscript on the results to a scientific journal.
Report <strong>of</strong> activities – Geophysical investigation at 9-Mile Hill study site<br />
References<br />
De Pascale, G.P., Pollard, W.H. and Williams, K.K. 2008. Geophysical mapping <strong>of</strong><br />
ground ice using a combination <strong>of</strong> capacitive coupled resistivity and groundpenetrating<br />
radar, Northwest Territories, Canada. Journal <strong>of</strong> Geophysical<br />
Research, 113, F02S90, doi:10.1029/2006JF000585.<br />
Fortier, R. and Bolduc, M. 2008. Thaw Settlement <strong>of</strong> Degrading Permafrost: a<br />
Geohazard Affecting the Performance <strong>of</strong> Man-Made Infrastructures at Umiujaq in<br />
Nunavik (Québec). Fourth Canadian Conference on Geohazards, Québec (QC),<br />
Canada, Québec (Québec), Canada, pp. 279-286.<br />
Fortier, R. and Savard, C. (submitted). Engineering geophysical investigation <strong>of</strong><br />
permafrost conditions underneath airfield embankments in Northern Quebec<br />
(Canada). Proceedings, Sixth Canadian Permafrost Conference, Calgary,<br />
Alberta, Canada.<br />
Jorgenson, T., Yoshikawa, K., Kanevskiy, M., Shur, Y., Romanovsky, V., Marchenko,<br />
S., Grosse, G., Brown, J. and Jones, B. 2008. Permafrost Characteristics <strong>of</strong><br />
<strong>Alaska</strong>. Proceedings, Ninth International Conference on Permafrost, extended<br />
abstracts. June 29 – July 3, 2008, Fairbanks, <strong>Alaska</strong>. Kane, D.L. & Hinkel, K.M.<br />
(eds). <strong>Institute</strong> <strong>of</strong> Northern Engineering, <strong>University</strong> <strong>of</strong> <strong>Alaska</strong> Fairbanks, pp. 121-<br />
122.<br />
Kuras, O., Beamish, D., Meldrum, P.I. and Ogilvy, R.D. 2006. Fundamentals <strong>of</strong> the<br />
capacitive resistivity technique. Geophysics, 71, pp. 135–152.<br />
Loke, M.H. 1996. Tutorial: 2D and 3D electrical resistivity surveys. Lecture notes,<br />
Geotomo S<strong>of</strong>tware, Penang, Malaysia.<br />
Loke, M.H. and Barker R. 1996. Rapid least-squares inversion <strong>of</strong> apparent resistivity<br />
pseudo-sections using a quasi-Newton method. Geophysical Prospecting, 44,<br />
pp. 131-152.<br />
Péwé, T. L. 1966. Ice wedges in <strong>Alaska</strong> – classification, distribution and climatic<br />
significance. Proceedings, International Conference on Permafrost, National<br />
Research Council <strong>of</strong> Canada - National Academy <strong>of</strong> Sciences, Washington, DC,<br />
Publication 1287, pp. 76-81.<br />
Schlichting, S.J., Darrow, M.M. and Masterman, S. (2006). Geotechnical Report. Dalton<br />
Highway 9 Mile Hill North. Federal project no. NH-F-065-2(3), State Project no.<br />
64899, Northern Region, Department <strong>of</strong> <strong>Transportation</strong> and Public Facilities,<br />
State <strong>of</strong> <strong>Alaska</strong>, 96 p.<br />
Shur, Y., and Kanevskiy, M. (2010). Geotechnical Investigations for the Dalton Highway<br />
Innovation Project as a Case Study <strong>of</strong> the Ice-Rich Syngenetic Permafrost.<br />
<strong>Alaska</strong> <strong>University</strong> <strong>Transportation</strong> <strong>Center</strong>, 153 p.<br />
Tim<strong>of</strong>eev, V.M., Rogozinski, A.W., Hunter, J.A. and Douma, M. 1994. A new ground<br />
resistivity method for engineering and environmental geophysics. Proceedings <strong>of</strong><br />
the Symposium on the Application <strong>of</strong> Geophysics to Engineering and<br />
Environmental Problems, EEGS, pp. 701-15.<br />
18