Alaska University Transportation Center PROJECT - Institute of ...
Alaska University Transportation Center PROJECT - Institute of ...
Alaska University Transportation Center PROJECT - Institute of ...

Create successful ePaper yourself
Turn your PDF publications into a flip-book with our unique Google optimized e-Paper software.
Report <strong>of</strong> activities – Geophysical investigation at 9-Mile Hill study site 6<br />
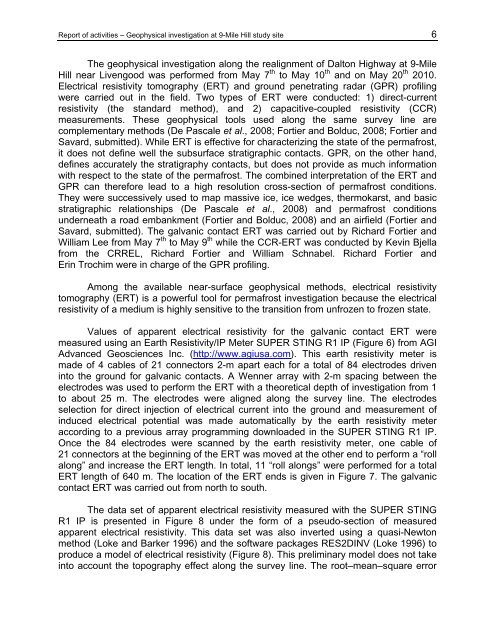
The geophysical investigation along the realignment <strong>of</strong> Dalton Highway at 9-Mile<br />
Hill near Livengood was performed from May 7 th to May 10 th and on May 20 th 2010.<br />
Electrical resistivity tomography (ERT) and ground penetrating radar (GPR) pr<strong>of</strong>iling<br />
were carried out in the field. Two types <strong>of</strong> ERT were conducted: 1) direct-current<br />
resistivity (the standard method), and 2) capacitive-coupled resistivity (CCR)<br />
measurements. These geophysical tools used along the same survey line are<br />
complementary methods (De Pascale et al., 2008; Fortier and Bolduc, 2008; Fortier and<br />
Savard, submitted). While ERT is effective for characterizing the state <strong>of</strong> the permafrost,<br />
it does not define well the subsurface stratigraphic contacts. GPR, on the other hand,<br />
defines accurately the stratigraphy contacts, but does not provide as much information<br />
with respect to the state <strong>of</strong> the permafrost. The combined interpretation <strong>of</strong> the ERT and<br />
GPR can therefore lead to a high resolution cross-section <strong>of</strong> permafrost conditions.<br />
They were successively used to map massive ice, ice wedges, thermokarst, and basic<br />
stratigraphic relationships (De Pascale et al., 2008) and permafrost conditions<br />
underneath a road embankment (Fortier and Bolduc, 2008) and an airfield (Fortier and<br />
Savard, submitted). The galvanic contact ERT was carried out by Richard Fortier and<br />
William Lee from May 7 th to May 9 th while the CCR-ERT was conducted by Kevin Bjella<br />
from the CRREL, Richard Fortier and William Schnabel. Richard Fortier and<br />
Erin Trochim were in charge <strong>of</strong> the GPR pr<strong>of</strong>iling.<br />
Among the available near-surface geophysical methods, electrical resistivity<br />
tomography (ERT) is a powerful tool for permafrost investigation because the electrical<br />
resistivity <strong>of</strong> a medium is highly sensitive to the transition from unfrozen to frozen state.<br />
Values <strong>of</strong> apparent electrical resistivity for the galvanic contact ERT were<br />
measured using an Earth Resistivity/IP Meter SUPER STING R1 IP (Figure 6) from AGI<br />
Advanced Geosciences Inc. (http://www.agiusa.com). This earth resistivity meter is<br />
made <strong>of</strong> 4 cables <strong>of</strong> 21 connectors 2-m apart each for a total <strong>of</strong> 84 electrodes driven<br />
into the ground for galvanic contacts. A Wenner array with 2-m spacing between the<br />
electrodes was used to perform the ERT with a theoretical depth <strong>of</strong> investigation from 1<br />
to about 25 m. The electrodes were aligned along the survey line. The electrodes<br />
selection for direct injection <strong>of</strong> electrical current into the ground and measurement <strong>of</strong><br />
induced electrical potential was made automatically by the earth resistivity meter<br />
according to a previous array programming downloaded in the SUPER STING R1 IP.<br />
Once the 84 electrodes were scanned by the earth resistivity meter, one cable <strong>of</strong><br />
21 connectors at the beginning <strong>of</strong> the ERT was moved at the other end to perform a “roll<br />
along” and increase the ERT length. In total, 11 “roll alongs” were performed for a total<br />
ERT length <strong>of</strong> 640 m. The location <strong>of</strong> the ERT ends is given in Figure 7. The galvanic<br />
contact ERT was carried out from north to south.<br />
The data set <strong>of</strong> apparent electrical resistivity measured with the SUPER STING<br />
R1 IP is presented in Figure 8 under the form <strong>of</strong> a pseudo-section <strong>of</strong> measured<br />
apparent electrical resistivity. This data set was also inverted using a quasi-Newton<br />
method (Loke and Barker 1996) and the s<strong>of</strong>tware packages RES2DINV (Loke 1996) to<br />
produce a model <strong>of</strong> electrical resistivity (Figure 8). This preliminary model does not take<br />
into account the topography effect along the survey line. The root–mean–square error