
Create successful ePaper yourself
Turn your PDF publications into a flip-book with our unique Google optimized e-Paper software.
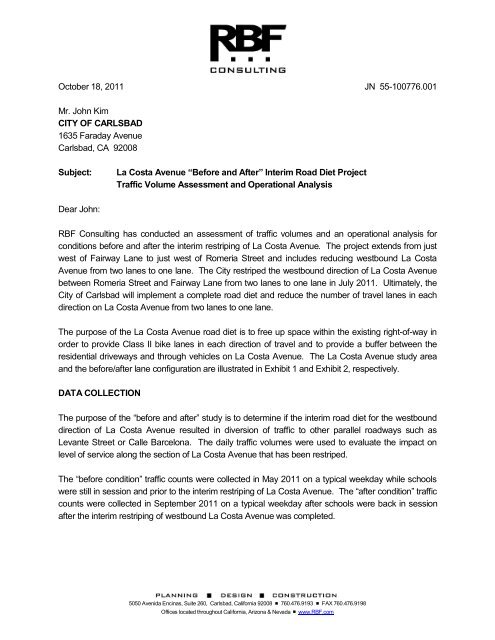
October 18, 2011 JN 55-100776.001<br />
Mr. John Kim<br />
CITY OF CARLSBAD<br />
1635 Faraday <strong>Avenue</strong><br />
<strong>Carlsbad</strong>, CA 92008<br />
Subject: <strong>La</strong> <strong>Costa</strong> <strong>Avenue</strong> “Before and After” Interim Road Diet Project<br />
Traffic Volume Assessment and Operational Analysis<br />
Dear John:<br />
RBF Consulting has conducted an assessment <strong>of</strong> traffic volumes and an operational analysis for<br />
conditions before and after the interim restriping <strong>of</strong> <strong>La</strong> <strong>Costa</strong> <strong>Avenue</strong>. The project extends from just<br />
west <strong>of</strong> Fairway <strong>La</strong>ne to just west <strong>of</strong> Romeria Street and includes reducing westbound <strong>La</strong> <strong>Costa</strong><br />
<strong>Avenue</strong> from two lanes to one lane. The <strong>City</strong> restriped the westbound direction <strong>of</strong> <strong>La</strong> <strong>Costa</strong> <strong>Avenue</strong><br />
between Romeria Street and Fairway <strong>La</strong>ne from two lanes to one lane in July 2011. Ultimately, the<br />
<strong>City</strong> <strong>of</strong> <strong>Carlsbad</strong> will implement a complete road diet and reduce the number <strong>of</strong> travel lanes in each<br />
direction on <strong>La</strong> <strong>Costa</strong> <strong>Avenue</strong> from two lanes to one lane.<br />
The purpose <strong>of</strong> the <strong>La</strong> <strong>Costa</strong> <strong>Avenue</strong> road diet is to free up space within the existing right-<strong>of</strong>-way in<br />
order to provide Class II bike lanes in each direction <strong>of</strong> travel and to provide a buffer between the<br />
residential driveways and through vehicles on <strong>La</strong> <strong>Costa</strong> <strong>Avenue</strong>. The <strong>La</strong> <strong>Costa</strong> <strong>Avenue</strong> study area<br />
and the before/after lane configuration are illustrated in Exhibit 1 and Exhibit 2, respectively.<br />
DATA COLLECTION<br />
The purpose <strong>of</strong> the “before and after” study is to determine if the interim road diet for the westbound<br />
direction <strong>of</strong> <strong>La</strong> <strong>Costa</strong> <strong>Avenue</strong> resulted in diversion <strong>of</strong> traffic to other parallel roadways such as<br />
Levante Street or Calle Barcelona. The daily traffic volumes were used to evaluate the impact on<br />
level <strong>of</strong> service along the section <strong>of</strong> <strong>La</strong> <strong>Costa</strong> <strong>Avenue</strong> that has been restriped.<br />
The “before condition” traffic counts were collected in May 2011 on a typical weekday while schools<br />
were still in session and prior to the interim restriping <strong>of</strong> <strong>La</strong> <strong>Costa</strong> <strong>Avenue</strong>. The “after condition” traffic<br />
counts were collected in September 2011 on a typical weekday after schools were back in session<br />
after the interim restriping <strong>of</strong> westbound <strong>La</strong> <strong>Costa</strong> <strong>Avenue</strong> was completed.<br />
5050 Avenida Encinas, Suite 260, <strong>Carlsbad</strong>, California 92008 # 760.476.9193 # FAX 760.476.9198<br />
Offices located throughout California, Arizona & Nevada ■ www.RBF.com
Mr. John Kim JN: 55-100776.001<br />
October 18, 2011<br />
Page 2<br />
Traffic counts were collected over a 24-hour period for the following mid-block locations for both the<br />
“before” condition (May 2011) and the “after” condition (September 2011):<br />
1. <strong>La</strong> <strong>Costa</strong> <strong>Avenue</strong>, from <strong>La</strong> <strong>Costa</strong> Town Center Access to Fairway <strong>La</strong>ne<br />
2. <strong>La</strong> <strong>Costa</strong> <strong>Avenue</strong>, from Quinta Street to Cadencia Street<br />
3. Levante Street, from Torrejon Place to Sacada Circle<br />
4. Levante Street, from Galleon Way to Romeria Street<br />
5. Calle Barcelona, from Paseo Aliso to Paseo Avellano<br />
6. Rancho Santa Fe Road, from Calle Barcelona to Camino De <strong>La</strong>s Coches<br />
Morning (7:00 – 9:00 a.m.) and afternoon (4:00 – 6:00 p.m.) peak period intersection counts were<br />
also collected at <strong>La</strong> <strong>Costa</strong> <strong>Avenue</strong> / Vieja Castilla Way, the only signalized intersection along the<br />
section <strong>of</strong> <strong>La</strong> <strong>Costa</strong> <strong>Avenue</strong> where the interim road diet has been implemented.<br />
The daily mid-block traffic counts collected before and after the interim road diet on <strong>La</strong> <strong>Costa</strong> <strong>Avenue</strong><br />
are illustrated in Exhibit 3. The peak hour mid-block and intersection counts collected before and<br />
after the interim road diet are shown in Exhibit 4. The raw traffic count data is provided in the<br />
technical appendix following this report.<br />
BEFORE AND AFTER TRAFFIC VOLUME ASSESSMENT<br />
The traffic count data collected before and after the interim restriping <strong>of</strong> <strong>La</strong> <strong>Costa</strong> <strong>Avenue</strong> was closely<br />
evaluated to determine if the interim road diet for westbound <strong>La</strong> <strong>Costa</strong> <strong>Avenue</strong> resulted in some<br />
diversion <strong>of</strong> traffic to other parallel roadways such as Levante Street or Calle Barcelona. The before<br />
and after counts for the parallel roadway corridors were grouped into two screenlines and the<br />
changes in the volumes were evaluated as a percentage <strong>of</strong> the total screenline volumes. By using<br />
the screenline methodology, the analysis factors out some <strong>of</strong> the variability in traffic volumes that<br />
typically occurs from day to day.<br />
One screenline was established for the west sides <strong>of</strong> the parallel roadway corridors and the other on<br />
the east sides. The screenline analysis includes daily and peak hour counts for the following<br />
roadway segments:<br />
Screenline #1 (West Side)<br />
A. <strong>La</strong> <strong>Costa</strong> <strong>Avenue</strong> from <strong>La</strong> <strong>Costa</strong> Town Center to Fairway <strong>La</strong>ne<br />
C. Levante Street from Torrejon Place to Sacada Circle<br />
E. Calle Barcelona from Paseo Aliso to Paseo Avellano<br />
Screenline #2 (East Side)<br />
B. <strong>La</strong> <strong>Costa</strong> <strong>Avenue</strong> from Quinta Street to Cadencia Street<br />
D. Levante Street from Galleon Way to Romeria Street<br />
E. Calle Barcelona from Paseo Aliso to Paseo Avellano
Mr. John Kim JN: 55-100776.001<br />
October 18, 2011<br />
Page 3<br />
Counts were collected in only one location on Calle Barcelona; therefore, these counts are used for<br />
both screenlines. The two screenlines as described above are also shown graphically in Exhibit 5.<br />
Table 1 presents the comparison <strong>of</strong> the daily mid-block traffic counts both before and after the <strong>La</strong><br />
<strong>Costa</strong> <strong>Avenue</strong> interim road diet using the screenline method. This screenline comparison method is<br />
also shown in Exhibit 6 in a pie chart format.<br />
A<br />
Table 1<br />
Comparison <strong>of</strong> Daily Traffic Volumes<br />
Before and After <strong>La</strong> <strong>Costa</strong> <strong>Avenue</strong> Interim Road Diet<br />
Roadway Segment Direction<br />
<strong>La</strong> <strong>Costa</strong><br />
<strong>Avenue</strong><br />
C Levante St<br />
E<br />
Calle<br />
Barcelona<br />
<strong>La</strong> <strong>Costa</strong> Town Ctr<br />
to Fairway Ln<br />
Torrejon Pl to<br />
Sacada Cir<br />
Paseo Aliso to<br />
Paseo Avellano<br />
Before Condition After Condition<br />
ADT<br />
Screenline 1 Comparison<br />
% <strong>of</strong><br />
Screenline<br />
ADT<br />
ADT<br />
% <strong>of</strong><br />
Screenline<br />
ADT<br />
EB 8,703 61.4% 8,579 61.1%<br />
WB 8,460 60.3% 8,682 61.8%<br />
Total 17,163 60.9% 17,261 61.4%<br />
EB 591 4.2% 680 4.8%<br />
WB 713 5.1% 774 5.5%<br />
Total 1,304 4.6% 1,454 5.2%<br />
EB 4,876 34.4% 4,778 34.0%<br />
WB 4,858 34.6% 4,599 32.7%<br />
Total 9,734 34.5% 9,377 33.4%<br />
Total (Screenline) A-C-E Eastbound ADT Volumes 14,170 50.2% 14,037 50.0%<br />
Total (Screenline) A-C-E Westbound ADT Volumes 14,031 49.8% 14,055 50.0%<br />
B<br />
Total (Screenline) A-C-E ADT Volumes 28,201 100.0% 28,092 100.0%<br />
<strong>La</strong> <strong>Costa</strong><br />
<strong>Avenue</strong><br />
D Levante St<br />
E<br />
Calle<br />
Barcelona<br />
Quinta St to<br />
Cadencia St<br />
Galleon Way to<br />
Romeria St<br />
Paseo Aliso to<br />
Paseo Avellano<br />
Screenline 2 Comparison<br />
EB 6,448 51.5% 6,413 52.1%<br />
WB 6,260 51.1% 5,643 49.4%<br />
Total 12,708 51.3% 12,056 50.8%<br />
EB 1,187 9.5% 1,128 9.2%<br />
WB 1,142 9.3% 1,179 10.3%<br />
Total 2,329 9.4% 2,307 9.7%<br />
EB 4,876 39.0% 4,778 38.8%<br />
WB 4,858 39.6% 4,599 40.3%<br />
Total 9,734 39.3% 9,377 39.5%<br />
Total (Screenline) B-D-E Eastbound ADT Volumes 12,511 50.5% 12,319 51.9%<br />
Total (Screenline) B-D-E Westbound ADT Volumes 12,260 49.5% 11,421 48.1%<br />
Total (Screenline) B-D-E ADT Volumes 24,771 100.0% 23,740 100.0%<br />
Note: Volumes shaded in gray and shown in bold indicate the direction (westbound) where the interim road diet on <strong>La</strong> <strong>Costa</strong> <strong>Avenue</strong> was<br />
implemented.
Mr. John Kim JN: 55-100776.001<br />
October 18, 2011<br />
Page 4<br />
As shown in Table 1, the changes in daily traffic volumes expressed as percentages <strong>of</strong> total<br />
screenline ADT varies by less than two percent for all <strong>of</strong> the roadway segments before and after the<br />
interim road diet. Daily fluctuations <strong>of</strong> up to 10 percent are considered normal for traffic volumes from<br />
one day to another on parallel roadway corridors. Therefore, variations that exceed 10 percent from<br />
one day to another can be considered a significant change in the traffic patterns on the parallel<br />
roadway corridors.<br />
While the comparison <strong>of</strong> the before and after traffic volumes using the screenline method does factor<br />
out some <strong>of</strong> the day-to-day variability, variation <strong>of</strong> less than two percent in the proportion <strong>of</strong> individual<br />
segment ADT to total screenline ADT is not considered significant and is within the range <strong>of</strong> daily<br />
traffic fluctuations that is considered normal. Therefore, based on the assessment <strong>of</strong> daily traffic<br />
volumes before and after the <strong>La</strong> <strong>Costa</strong> <strong>Avenue</strong> interim road diet, it does not appear that there is<br />
significant diversion <strong>of</strong> daily traffic to Levante Street or Calle Barcelona.<br />
Table 2 presents the comparison <strong>of</strong> the peak hour mid-block traffic counts both before and after the<br />
<strong>La</strong> <strong>Costa</strong> <strong>Avenue</strong> interim road diet using the screenline method.<br />
As shown in Table 2, the changes in peak hour volumes expressed as percentages <strong>of</strong> total<br />
screenline peak hour volumes varies from zero to approximately five percent. Although the before<br />
and after comparison does show slightly more fluctuation in the peak hour volumes than in the daily<br />
volumes, the variation is still low enough to be considered within the range <strong>of</strong> normal fluctuations in<br />
traffic from one day to another. Therefore, based on the assessment <strong>of</strong> peak hour traffic volumes<br />
before and after the <strong>La</strong> <strong>Costa</strong> <strong>Avenue</strong> interim road diet, it does not appear that there is a significant<br />
diversion <strong>of</strong> peak hour traffic to Levante Street or Calle Barcelona.
Mr. John Kim JN: 55-100776.001<br />
October 18, 2011<br />
Page 5<br />
A<br />
C<br />
E<br />
Roadway Segment Direction<br />
<strong>La</strong> <strong>Costa</strong><br />
<strong>Avenue</strong><br />
Levante<br />
St<br />
Calle<br />
Barcelona<br />
<strong>La</strong> <strong>Costa</strong> Town<br />
Ctr to Fairway Ln<br />
Torrejon Pl to Sacada Cir<br />
Paseo Aliso to Paseo<br />
Avellano<br />
Table 2<br />
Comparison <strong>of</strong> Peak Hour Traffic Volumes<br />
Before and After <strong>La</strong> <strong>Costa</strong> <strong>Avenue</strong> Interim Road Diet<br />
Before Condition<br />
Peak Hour Volumes<br />
% <strong>of</strong> Screenline<br />
Peak Hour Volumes<br />
After Condition<br />
Peak Hour Volumes<br />
% <strong>of</strong> Screenline<br />
Peak Hour Volumes<br />
AM Peak PM Peak AM Peak PM Peak AM Peak PM Peak AM Peak PM Peak<br />
Screenline 1 Comparison<br />
EB 432 900 57.8% 59.5% 396 951 57.8% 62.0%<br />
WB 970 590 56.0% 56.2% 981 571 56.3% 55.9%<br />
Total 1,402 1,490 56.6% 58.1% 1,377 1,522 56.7% 59.6%<br />
EB 64 48 8.6% 3.2% 59 59 8.6% 3.8%<br />
WB 67 65 3.9% 6.2% 72 77 4.1% 7.5%<br />
Total 131 113 5.3% 4.4% 131 136 5.4% 5.3%<br />
EB 251 565 33.6% 37.3% 230 523 33.6% 34.1%<br />
WB 694 395 40.1% 37.6% 690 373 39.6% 36.5%<br />
Total 945 960 38.1% 37.5% 920 896 37.9% 35.1%<br />
Total (Screenline) A-C-E Eastbound Peak Hour Volumes 747 1,513 30.1% 59.0% 685 1,533 28.2% 60.0%<br />
Total (Screenline) A-C-E Westbound Peak Hour Volumes 1,731 1,050 69.9% 41.0% 1,743 1,021 71.8% 40.0%<br />
B<br />
D<br />
E<br />
Total (Screenline) A-C-E Peak Hour Volumes 2,478 2,563 100.0% 100.0% 2,428 2,554 100.0% 100.0%<br />
<strong>La</strong> <strong>Costa</strong><br />
<strong>Avenue</strong><br />
Levante<br />
St<br />
Calle<br />
Barcelona<br />
Quinta St to Cadencia St<br />
Galleon Way to Romeria St<br />
Paseo Aliso to Paseo<br />
Avellano<br />
Screenline 2 Comparison<br />
EB 445 629 51.9% 48.5% 409 666 55.3% 51.3%<br />
WB 677 458 46.0% 48.1% 619 397 42.5% 45.2%<br />
Total 1,122 1,087 48.2% 48.4% 1,028 1,063 46.8% 48.9%<br />
EB 161 102 18.8% 7.9% 101 108 13.6% 8.3%<br />
WB 101 99 6.9% 10.4% 148 109 10.2% 12.4%<br />
Total 262 201 11.2% 8.9% 249 217 11.3% 10.0%<br />
EB 251 565 29.3% 43.6% 230 523 31.1% 40.3%<br />
WB 694 395 47.1% 41.5% 690 373 47.4% 42.4%<br />
Total 945 960 40.6% 42.7% 920 896 41.9% 41.2%<br />
Total (Screenline) B-D-E Eastbound Peak Hour Volumes 857 1,296 36.8% 57.7% 740 1,297 33.7% 59.6%<br />
Total (Screenline) B-D-E Westbound Peak Hour Volumes 1,472 952 63.2% 42.3% 1,457 879 66.3% 40.4%<br />
Total (Screenline) B-D-E Peak Hour Volumes 2,329 2,248 100.0% 100.0% 2,197 2,176 100.0% 100.0%<br />
Note: Volumes shaded in gray and shown in bold indicate the direction (westbound) where the interim road diet on <strong>La</strong> <strong>Costa</strong> <strong>Avenue</strong> was implemented.
Mr. John Kim JN: 55-100776.001<br />
October 18, 2011<br />
Page 6<br />
LEVEL OF SERVICE OPERATIONAL ANALYSIS<br />
Peak Hour Intersection Operations<br />
Peak hour level <strong>of</strong> service operations before and after the <strong>La</strong> <strong>Costa</strong> <strong>Avenue</strong> interim road diet was<br />
evaluated at the intersection <strong>of</strong> <strong>La</strong> <strong>Costa</strong> <strong>Avenue</strong> / Viejo Castilla Way, which is the only signalized<br />
intersection along the section <strong>of</strong> <strong>La</strong> <strong>Costa</strong> <strong>Avenue</strong> where the interim restriping has been<br />
implemented.<br />
Consistent with the <strong>City</strong> <strong>of</strong> <strong>Carlsbad</strong> Growth Management Program, the Intersection Capacity<br />
Utilization (ICU) method was used to determine intersection Level <strong>of</strong> Service (LOS). The <strong>City</strong> <strong>of</strong><br />
<strong>Carlsbad</strong> Growth Management Program circulation standards allow LOS D or better operations for<br />
intersections during peak hours. Additionally, if an intersection operates at LOS E or F without the<br />
project, a significant project impact will occur if the project increases the V/C ratio at an intersection<br />
by more than 0.020.<br />
Table 3 summarizes the results <strong>of</strong> the peak hour LOS analysis at the intersection <strong>of</strong> <strong>La</strong> <strong>Costa</strong><br />
<strong>Avenue</strong> / Viejo Castilla Way, before and after the completion <strong>of</strong> the <strong>La</strong> <strong>Costa</strong> <strong>Avenue</strong> interim road<br />
diet. ICU worksheets are provided in the technical appendix following this report.<br />
Intersection<br />
<strong>La</strong> <strong>Costa</strong> <strong>Avenue</strong> /<br />
Viejo Castilla Way<br />
Table 3<br />
Existing Before and After Conditions<br />
Peak Hour Intersection Operational Analysis<br />
Conditions Before<br />
A.M. Peak P.M. Peak<br />
Conditions After<br />
A.M. Peak P.M. Peak<br />
AM<br />
Change<br />
in V/C<br />
PM<br />
Change<br />
in V/C<br />
V/C LOS V/C LOS V/C LOS V/C LOS<br />
0.490 A 0.401 A 0.768 C 0.578 A<br />
0.278 0.177<br />
As shown in Table 3, the study intersections operate at acceptable levels <strong>of</strong> service (LOS D or better)<br />
during the peak hours both before and after the interim restriping <strong>of</strong> <strong>La</strong> <strong>Costa</strong> <strong>Avenue</strong>. Therefore, the<br />
reduction in capacity at the westbound approach <strong>of</strong> the intersection <strong>of</strong> <strong>La</strong> <strong>Costa</strong> <strong>Avenue</strong> / Viejo<br />
Castilla Way does not result in a significant traffic impact.<br />
Peak Hour Roadway Segment Operations<br />
A peak hour analysis was performed for conditions before and after the <strong>La</strong> <strong>Costa</strong> <strong>Avenue</strong> interim<br />
road diet on the roadway segments where the interim restriping has occurred on <strong>La</strong> <strong>Costa</strong> <strong>Avenue</strong>.<br />
Peak hour segment LOS is determined by taking the average one-way traffic volume in either<br />
direction and dividing that volume by the segment peak hour capacity to yield the segment V/C ratio.<br />
A maximum capacity <strong>of</strong> 1,800 vehicles per hour per lane (VPHPL) was used. The peak hour<br />
roadway segment analysis methodology that is used is consistent with the <strong>City</strong> <strong>of</strong> <strong>Carlsbad</strong> Growth<br />
Management Program.
Mr. John Kim JN: 55-100776.001<br />
October 18, 2011<br />
Page 7<br />
The <strong>City</strong> <strong>of</strong> <strong>Carlsbad</strong> Growth Management Program circulation standards allow LOS D or better<br />
operations for street segments during peak hours. Additionally if an intersection operates at LOS E<br />
or F without the project, a significant project impact will occur if the project increases the V/C ratio on<br />
a roadway segment by more than 0.020.<br />
The peak hour roadway segment analysis was performed for the following roadway segments:<br />
· <strong>La</strong> <strong>Costa</strong> <strong>Avenue</strong> from Fairway <strong>La</strong>ne to Vieja Castilla Way (west side <strong>of</strong> road diet section)<br />
· <strong>La</strong> <strong>Costa</strong> <strong>Avenue</strong> from Vieja Castilla Way to Romeria Street (east side <strong>of</strong> road diet section)<br />
Traffic counts were only collected on segments <strong>of</strong> <strong>La</strong> <strong>Costa</strong> <strong>Avenue</strong> that are beyond the limits <strong>of</strong> the<br />
interim road diet section (Fairway <strong>La</strong>ne to Romeria Street). Therefore, in order to perform the peak<br />
hour segment analysis, the traffic counts collected between <strong>La</strong> <strong>Costa</strong> Town Center and Fairway <strong>La</strong>ne<br />
were applied to the analysis <strong>of</strong> the segment between Fairway <strong>La</strong>ne and Vieja Castilla Way. On the<br />
east side <strong>of</strong> the study area, the traffic counts collected between Quinta Street and Cadencia Street<br />
were applied to the analysis <strong>of</strong> the segment between Vieja Castilla Way and Romeria Street. The<br />
traffic counts collected on the west side are probably slightly higher than the volume on the<br />
corresponding west study segment, while the traffic counts collected on the east side are probably<br />
slightly lower than the volume on the corresponding east study segment. It is our pr<strong>of</strong>essional<br />
opinion that the slight differences between the count and study locations do not affect the findings <strong>of</strong><br />
the analysis.<br />
Table 4 summarizes the results <strong>of</strong> the peak hour roadway segment analysis for the two study<br />
roadway segments along the section <strong>of</strong> <strong>La</strong> <strong>Costa</strong> <strong>Avenue</strong> where the interim road diet has occurred.<br />
As shown in Table 4, the study roadway segments operate at LOS A during the peak hours both<br />
before and after the interim restriping <strong>of</strong> <strong>La</strong> <strong>Costa</strong> <strong>Avenue</strong>. Therefore, the reduction in capacity on<br />
westbound <strong>La</strong> <strong>Costa</strong> <strong>Avenue</strong> as a result <strong>of</strong> the interim road diet does not result in a significant traffic<br />
impact.
Segment <strong>of</strong><br />
<strong>La</strong> <strong>Costa</strong><br />
<strong>Avenue</strong><br />
Fairway<br />
<strong>La</strong>ne to Vieja<br />
Castilla Way<br />
Vieja Castilla<br />
Way to<br />
Romeria<br />
Street<br />
Mr. John Kim JN: 55-100776.001<br />
October 18, 2011<br />
Page 8<br />
Direction<br />
(<strong>La</strong>nes)<br />
Capacity<br />
Table 4<br />
Before and After Conditions<br />
Peak Hour Roadway Segment Operational Analysis<br />
Conditions Before Interim Road Diet Conditions After Interim Road Diet<br />
AM Peak Hour PM Peak Hour<br />
AM Peak Hour PM Peak Hour<br />
Direction<br />
Capacity<br />
(<strong>La</strong>nes)<br />
Vol. V/C LOS Vol. V/C LOS Vol. V/C LOS Vol. V/C LOS<br />
AM<br />
Change<br />
in V/C<br />
EB (2) 3,600 432 0.120 A 900 0.250 A EB (2) 3,600 396 0.110 A 951 0.264 A -0.010 0.014<br />
WB (2) 3,600 970 0.269 A 590 0.164 A WB (1) 1,800 981 0.545 A 571 0.317 A 0.276 0.153<br />
EB (2) 3,600 445 0.124 A 629 0.175 A EB (2) 3,600 409 0.114 A 666 0.185 A -0.010 0.010<br />
WB (2) 3,600 677 0.188 A 458 0.127 A WB (1) 1,800 619 0.344 A 397 0.221 A 0.156 0.093<br />
PM<br />
Change<br />
in V/C
Mr. John Kim<br />
October 18, 2011<br />
Page 9<br />
SUMMARY AND CONCULSIONS<br />
The traffic count data collected before and after the interim restriping <strong>of</strong> <strong>La</strong> <strong>Costa</strong> <strong>Avenue</strong> was closely<br />
evaluated to determine if the interim road diet for westbound <strong>La</strong> <strong>Costa</strong> <strong>Avenue</strong> resulted in diversion <strong>of</strong><br />
traffic to other parallel roadways such as Levante Street or Calle Barcelona. The results <strong>of</strong> the traffic<br />
volumes assessment before and after the <strong>La</strong> <strong>Costa</strong> interim road diet show that the variations in the<br />
before and after traffic volumes are not significant enough to indicate that any diversion <strong>of</strong> traffic has<br />
occurred.<br />
The results <strong>of</strong> the level <strong>of</strong> service operational analysis show that the study intersection and study<br />
roadway segments operate at acceptable levels <strong>of</strong> service both before and after the <strong>La</strong> <strong>Costa</strong><br />
<strong>Avenue</strong> interim road diet. Therefore, the reduction in capacity on westbound <strong>La</strong> <strong>Costa</strong> <strong>Avenue</strong><br />
following the completion <strong>of</strong> the interim road diet does not result in significant traffic impacts on the<br />
study intersection or roadway segments.<br />
If you should have any questions regarding this analysis, please call me at (760) 603-6246.<br />
Sincerely,<br />
Dawn L. Wilson, P.E., T.E., PTOE<br />
Senior Associate<br />
Transportation Services