current business statistics - Bureau of Economic Analysis
current business statistics - Bureau of Economic Analysis
current business statistics - Bureau of Economic Analysis
You also want an ePaper? Increase the reach of your titles
YUMPU automatically turns print PDFs into web optimized ePapers that Google loves.
ment rate and the rates for major<br />
groups were unaffected by the adjustments.<br />
The adjustment thus affects the<br />
changes in labor force data from December<br />
to January but not in any other<br />
months. The adjustments make the<br />
January gains in labor force and employment<br />
look very large, and this must<br />
be taken into account when the month<br />
is compared with other months. As<br />
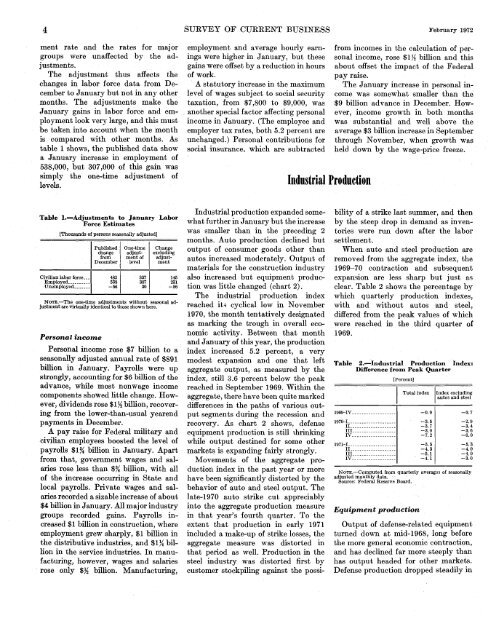
table 1 shows, the published data show<br />
a January increase in employment <strong>of</strong><br />
538,000, but 307,000 <strong>of</strong> this gain was<br />
simply the one-time adjustment <strong>of</strong><br />
levels.<br />
Table 1.—Adjustments to January Labor<br />
Force Estimates<br />
[Thousands <strong>of</strong> persons seasonally adjusted]<br />
Civilian labor force...<br />
Employed<br />
Unemployed. _ _<br />
Published<br />
change<br />
from<br />
December<br />
482<br />
538<br />
-56<br />
One-time<br />
adjustment<br />
<strong>of</strong><br />
level<br />
337<br />
307<br />
30<br />
Change<br />
excluding<br />
adjustment<br />
145<br />
231<br />
-86<br />
NOTE.—The one-time adjustments without seasonal adjustment<br />
are virtually identical to those shown here.<br />
Personal income<br />
Personal income rose $7 billion to a<br />
seasonally adjusted annual rate <strong>of</strong> $891<br />
billion in January. Payrolls were up<br />
strongly, accounting for $6 billion <strong>of</strong> the<br />
advance, while most nonwage income<br />
components showed little change. However,<br />
dividends rose $1% billion, recovering<br />
from the lower-than-usual yearend<br />
payments in December.<br />
A pay raise for Federal military and<br />
civilian employees boosted the level <strong>of</strong><br />
payrolls $1% billion in January. Apart<br />
from that, government wages and salaries<br />
rose less than $% billion, with all<br />
<strong>of</strong> the increase occurring in State and<br />
local payrolls. Private wages and salaries<br />
recorded a sizable increase <strong>of</strong> about<br />
$4 billion in January. All major industry<br />
groups recorded gains. Payrolls increased<br />
$1 billion in construction, where<br />
employment grew sharply, $1 billion in<br />
the distributive industries, and $1% billion<br />
in the service industries. In manufacturing,<br />
however, wages and salaries<br />
rose only $% billion. Manufacturing,<br />
SURVEY OF CURRENT BUSINESS February 1972<br />
employment and average hourly earnings<br />
were higher in January, but these<br />
gains were <strong>of</strong>fset by a reduction in hours<br />
<strong>of</strong> work.<br />
A statutory increase in the maximum<br />
level <strong>of</strong> wages subject to social security<br />
taxation, from $7,800 to $9,000, was<br />
another special factor affecting personal<br />
income in January. (The employee and<br />
employer tax rates, both 5.2 percent are<br />
unchanged.) Personal contributions for<br />
social insurance, which are subtracted<br />
Industrial production expanded somewhat<br />
further in January but the increase<br />
was smaller than in the preceding 2<br />
months. Auto production declined but<br />
output <strong>of</strong> consumer goods other than<br />
autos increased moderately. Output <strong>of</strong><br />
materials for the construction industry<br />
also increased but equipment production<br />
was little changed (chart 2).<br />
The industrial production index<br />
reached its cyclical low in November<br />
1970, the month tentatively designated<br />
as marking the trough in overall economic<br />
activity. Between that month<br />
and January <strong>of</strong> this year, the production<br />
index increased 5.2 percent, a very<br />
modest expansion and one that left<br />
aggregate output, as measured by the<br />
index, still 3.6 percent below the peak<br />
reached in September 1969. Within the<br />
aggregate, there have been quite marked<br />
differences in the paths <strong>of</strong> various output<br />
segments during the recession and<br />
recovery. As chart 2 shows, defense<br />
equipment production is still shrinking<br />
while output destined for some other<br />
markets is expanding fairly strongly.<br />
Movements <strong>of</strong> the aggregate production<br />
index in the past year or more<br />
have been significantly distorted by the<br />
behavior <strong>of</strong> auto and steel output. The<br />
late-1970 auto strike cut appreciably<br />
into the aggregate production measure<br />
in that year's fourth quarter. To the<br />
extent that production in early 1971<br />
included a make-up <strong>of</strong> strike losses, the<br />
aggregate measure was distorted in<br />
that period as well. Production in the<br />
steel industry was distorted first by<br />
customer stockpiling against the possi-<br />
Industrial Production<br />
from incomes in the calculation <strong>of</strong> personal<br />
income, rose $1% billion and this<br />
about <strong>of</strong>fset the impact <strong>of</strong> the Federal<br />
pay raise.<br />
The January increase in personal income<br />
was somewhat smaller than the<br />
$9 billion advance in December. However,<br />
income growth in both months<br />
was substantial and well above the<br />
average $3 billion increase in September<br />
through November, when growth was<br />
held down by the wage-price freeze.<br />
bility <strong>of</strong> a strike last summer, and then<br />
by the steep drop in demand as inventories<br />
were run down after the labor<br />
settlement.<br />
When auto and steel production are<br />
removed from the aggregate index, the<br />
1969-70 contraction and subsequent<br />
expansion are less sharp but just as<br />
clear. Table 2 shows the percentage by<br />
which quarterly production indexes,<br />
with and without autos and steel,<br />
differed from the peak values <strong>of</strong> which<br />
were reached in the third quarter <strong>of</strong><br />
1969.<br />
Table 2.—Industrial Production Index:<br />
Difference from Peak Quarter<br />
1969-IV<br />
1970-1 _ _<br />
II<br />
III ._<br />
IV<br />
1971-1. . _ ..<br />
H_______._-_-— _______<br />
III<br />
IV<br />
[Percent]<br />
Total index<br />
-0.9<br />
-3.5<br />
-3.7<br />
—3.9<br />
-7.2<br />
-5.5<br />
-4.3<br />
-5.1<br />
-4.1<br />
Index excluding<br />
autos and steel<br />
-0.7<br />
-2.9<br />
-3.4<br />
-3.6<br />
-6.0<br />
-5.3<br />
-4.0<br />
-4.0<br />
-3.0<br />
NOTE.—Computed from quarterly averages <strong>of</strong> seasonally<br />
adjusted monthly data.<br />
Source: Federal Reserve Board.<br />
Equipment production<br />
Output <strong>of</strong> defense-related equipment<br />
turned down at mid-1968, long before<br />
the more general economic contraction,<br />
and has declined far more steeply than<br />
has output headed for other markets.<br />
Defense production dropped steadily in


