Bollinger Band as support and resistance - ChartNexus
Bollinger Band as support and resistance - ChartNexus
Bollinger Band as support and resistance - ChartNexus

You also want an ePaper? Increase the reach of your titles
YUMPU automatically turns print PDFs into web optimized ePapers that Google loves.
<strong>Bollinger</strong> <strong>B<strong>and</strong></strong> <strong>as</strong> <strong>support</strong> <strong>and</strong> <strong>resistance</strong><br />
XPertTrader Library Series<br />
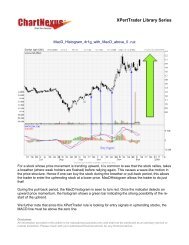
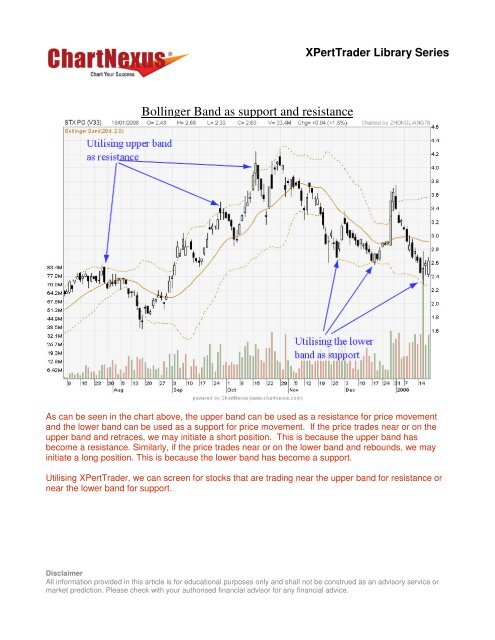
As can be seen in the chart above, the upper b<strong>and</strong> can be used <strong>as</strong> a <strong>resistance</strong> for price movement<br />
<strong>and</strong> the lower b<strong>and</strong> can be used <strong>as</strong> a <strong>support</strong> for price movement. If the price trades near or on the<br />
upper b<strong>and</strong> <strong>and</strong> retraces, we may initiate a short position. This is because the upper b<strong>and</strong> h<strong>as</strong><br />
become a <strong>resistance</strong>. Similarly, if the price trades near or on the lower b<strong>and</strong> <strong>and</strong> rebounds, we may<br />
initiate a long position. This is because the lower b<strong>and</strong> h<strong>as</strong> become a <strong>support</strong>.<br />
Utilising XPertTrader, we can screen for stocks that are trading near the upper b<strong>and</strong> for <strong>resistance</strong> or<br />
near the lower b<strong>and</strong> for <strong>support</strong>.<br />
Disclaimer<br />
All information provided in this article is for educational purposes only <strong>and</strong> shall not be construed <strong>as</strong> an advisory service or<br />
market prediction. Ple<strong>as</strong>e check with your authorised financial advisor for any financial advice.
XPertTrader Library Series<br />
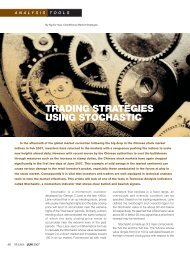
Click the “+” icon beside the Boilinger b<strong>and</strong> header <strong>and</strong> this rule can be located at the tree view list <strong>as</strong><br />
highlighted in above diagram.<br />
To add the rule, click on it once <strong>and</strong> then click “ADD >>>>” button <strong>and</strong> the rule will be added <strong>as</strong> shown<br />
below.<br />
Disclaimer<br />
All information provided in this article is for educational purposes only <strong>and</strong> shall not be construed <strong>as</strong> an advisory service or<br />
market prediction. Ple<strong>as</strong>e check with your authorised financial advisor for any financial advice.
XPertTrader Library Series<br />
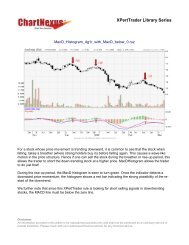
The x(%) parameter h<strong>as</strong> to be set to at le<strong>as</strong>t 1.0 in order to allow the rule to screen for stocks<br />
effectively.<br />
After the rule <strong>and</strong> parameter is set, the rule can be saved <strong>as</strong> shown above<br />
Disclaimer<br />
All information provided in this article is for educational purposes only <strong>and</strong> shall not be construed <strong>as</strong> an advisory service or<br />
market prediction. Ple<strong>as</strong>e check with your authorised financial advisor for any financial advice.
XPertTrader Library Series<br />
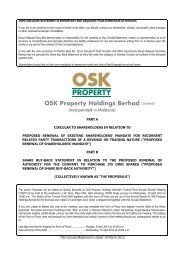
For this example, we will save the rule <strong>as</strong> “<strong>Bollinger</strong> Upper <strong>and</strong> Lower <strong>B<strong>and</strong></strong> <strong>as</strong> <strong>support</strong> or <strong>resistance</strong>”.<br />
You may refer to the XPertTrader Quick Start Manual to learn more about the settings <strong>and</strong><br />
configurations. Otherwise, you may view our tutorial video at<br />
http://www.chartnexus.com/<strong>support</strong>/tutorials/xperttrader/<br />
Click Buy signal to find stocks that are <strong>support</strong>ed by Lower <strong>B<strong>and</strong></strong>.<br />
Click Sell signal to find stocks that are resisted by Upper <strong>B<strong>and</strong></strong>.<br />
Download your FREE professional charting software or find out how to automate your stock<br />
selection.<br />
Disclaimer<br />
All information provided in this article is for educational purposes only <strong>and</strong> shall not be construed <strong>as</strong> an advisory service or<br />
market prediction. Ple<strong>as</strong>e check with your authorised financial advisor for any financial advice.