Mythology, traditions and history - The Clan Macfie Society
Mythology, traditions and history - The Clan Macfie Society
Mythology, traditions and history - The Clan Macfie Society

You also want an ePaper? Increase the reach of your titles
YUMPU automatically turns print PDFs into web optimized ePapers that Google loves.
- 8 -<br />
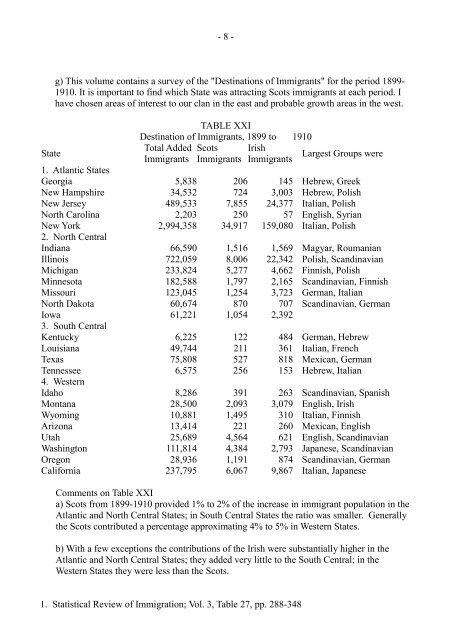
g) This volume contains a survey of the "Destinations of Immigrants" for the period 1899-<br />
1910. It is important to find which State was attracting Scots immigrants at each period. I<br />
have chosen areas of interest to our clan in the east <strong>and</strong> probable growth areas in the west.<br />
TABLE XXI<br />
Destination of Immigrants, 1899 to 1910<br />
State<br />
1. Atlantic States<br />
Total Added Scots<br />
Immigrants Immigrants<br />
Irish<br />
Immigrants<br />
Largest Groups were<br />
Georgia 5,838 206 145 Hebrew, Greek<br />
New Hampshire 34,532 724 3,003 Hebrew, Polish<br />
New Jersey 489,533 7,855 24,377 Italian, Polish<br />
North Carolina 2,203 250 57 English, Syrian<br />
New York<br />
2. North Central<br />
2,994,358 34,917 159,080 Italian, Polish<br />
Indiana 66,590 1,516 1,569 Magyar, Roumanian<br />
Illinois 722,059 8,006 22,342 Polish, Sc<strong>and</strong>inavian<br />
Michigan 233,824 5,277 4,662 Finnish, Polish<br />
Minnesota 182,588 1,797 2,165 Sc<strong>and</strong>inavian, Finnish<br />
Missouri 123,045 1,254 3,723 German, Italian<br />
North Dakota 60,674 870 707 Sc<strong>and</strong>inavian, German<br />
Iowa<br />
3. South Central<br />
61,221 1,054 2,392<br />
Kentucky 6,225 122 484 German, Hebrew<br />
Louisiana 49,744 211 361 Italian, French<br />
Texas 75,808 527 818 Mexican, German<br />
Tennessee<br />
4. Western<br />
6,575 256 153 Hebrew, Italian<br />
Idaho 8,286 391 263 Sc<strong>and</strong>inavian, Spanish<br />
Montana 28,500 2,093 3,079 English, Irish<br />
Wyoming 10,881 1,495 310 Italian, Finnish<br />
Arizona 13,414 221 260 Mexican, English<br />
Utah 25,689 4,564 621 English, Sc<strong>and</strong>inavian<br />
Washington 111,814 4,384 2,793 Japanese, Sc<strong>and</strong>inavian<br />
Oregon 28,936 1,191 874 Sc<strong>and</strong>inavian, German<br />
California 237,795 6,067 9,867 Italian, Japanese<br />
Comments on Table XXI<br />
a) Scots from 1899-1910 provided 1% to 2% of the increase in immigrant population in the<br />
Atlantic <strong>and</strong> North Central States; in South Central States the ratio was smaller. Generally<br />
the Scots contributed a percentage approximating 4% to 5% in Western States.<br />
b) With a few exceptions the contributions of the Irish were substantially higher in the<br />
Atlantic <strong>and</strong> North Central States; they added very little to the South Central; in the<br />
Western States they were less than the Scots.<br />
1. Statistical Review of Immigration; Vol. 3, Table 27, pp. 288-348