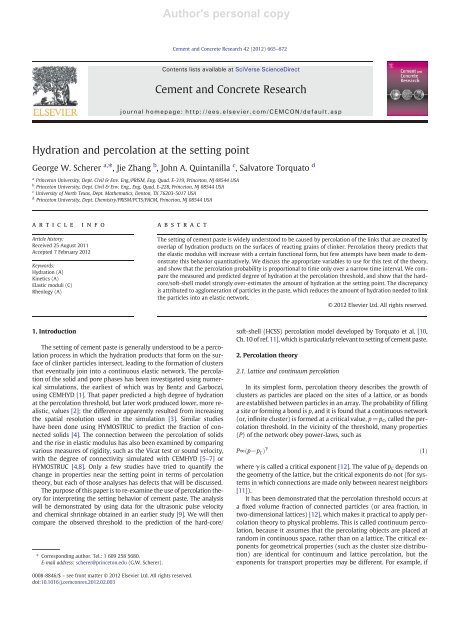
Hydration and percolation at the setting point - Complex Materials ...
Hydration and percolation at the setting point - Complex Materials ...
Hydration and percolation at the setting point - Complex Materials ...

You also want an ePaper? Increase the reach of your titles
YUMPU automatically turns print PDFs into web optimized ePapers that Google loves.
Author's personal copy<br />
<strong>Hydr<strong>at</strong>ion</strong> <strong>and</strong> <strong>percol<strong>at</strong>ion</strong> <strong>at</strong> <strong>the</strong> <strong>setting</strong> <strong>point</strong><br />
George W. Scherer a, ⁎, Jie Zhang b , John A. Quintanilla c , Salv<strong>at</strong>ore Torqu<strong>at</strong>o d<br />
a Princeton University, Dept. Civil & Env. Eng./PRISM, Eng. Quad. E-319, Princeton, NJ 08544 USA<br />
b Princeton University, Dept. Civil & Env. Eng., Eng. Quad. E-228, Princeton, NJ 08544 USA<br />
c University of North Texas, Dept. M<strong>at</strong>hem<strong>at</strong>ics, Denton, TX 76203-5017 USA<br />
d Princeton University, Dept. Chemistry/PRISM/PCTS/PACM, Princeton, NJ 08544 USA<br />
article info<br />
Article history:<br />
Received 25 August 2011<br />
Accepted 7 February 2012<br />
Keywords:<br />
<strong>Hydr<strong>at</strong>ion</strong> (A)<br />
Kinetics (A)<br />
Elastic moduli (C)<br />
Rheology (A)<br />
1. Introduction<br />
abstract<br />
The <strong>setting</strong> of cement paste is generally understood to be a <strong>percol<strong>at</strong>ion</strong><br />
process in which <strong>the</strong> hydr<strong>at</strong>ion products th<strong>at</strong> form on <strong>the</strong> surface<br />
of clinker particles intersect, leading to <strong>the</strong> form<strong>at</strong>ion of clusters<br />
th<strong>at</strong> eventually join into a continuous elastic network. The <strong>percol<strong>at</strong>ion</strong><br />
of <strong>the</strong> solid <strong>and</strong> pore phases has been investig<strong>at</strong>ed using numerical<br />
simul<strong>at</strong>ions, <strong>the</strong> earliest of which was by Bentz <strong>and</strong> Garboczi,<br />
using CEMHYD [1]. Th<strong>at</strong> paper predicted a high degree of hydr<strong>at</strong>ion<br />
<strong>at</strong> <strong>the</strong> <strong>percol<strong>at</strong>ion</strong> threshold, but l<strong>at</strong>er work produced lower, more realistic,<br />
values [2]; <strong>the</strong> difference apparently resulted from increasing<br />
<strong>the</strong> sp<strong>at</strong>ial resolution used in <strong>the</strong> simul<strong>at</strong>ion [3]. Similar studies<br />
have been done using HYMOSTRUC to predict <strong>the</strong> fraction of connected<br />
solids [4]. The connection between <strong>the</strong> <strong>percol<strong>at</strong>ion</strong> of solids<br />
<strong>and</strong> <strong>the</strong> rise in elastic modulus has also been examined by comparing<br />
various measures of rigidity, such as <strong>the</strong> Vic<strong>at</strong> test or sound velocity,<br />
with <strong>the</strong> degree of connectivity simul<strong>at</strong>ed with CEMHYD [5–7] or<br />
HYMOSTRUC [4,8]. Only a few studies have tried to quantify <strong>the</strong><br />
change in properties near <strong>the</strong> <strong>setting</strong> <strong>point</strong> in terms of <strong>percol<strong>at</strong>ion</strong><br />
<strong>the</strong>ory, but each of those analyses has defects th<strong>at</strong> will be discussed.<br />
The purpose of this paper is to re-examine <strong>the</strong> use of <strong>percol<strong>at</strong>ion</strong> <strong>the</strong>ory<br />
for interpreting <strong>the</strong> <strong>setting</strong> behavior of cement paste. The analysis<br />
will be demonstr<strong>at</strong>ed by using d<strong>at</strong>a for <strong>the</strong> ultrasonic pulse velocity<br />
<strong>and</strong> chemical shrinkage obtained in an earlier study [9]. We will <strong>the</strong>n<br />
compare <strong>the</strong> observed threshold to <strong>the</strong> prediction of <strong>the</strong> hard-core/<br />
⁎ Corresponding author. Tel.: 1 609 258 5680.<br />
E-mail address: scherer@princeton.edu (G.W. Scherer).<br />
0008-8846/$ – see front m<strong>at</strong>ter © 2012 Elsevier Ltd. All rights reserved.<br />
doi:10.1016/j.cemconres.2012.02.003<br />
Cement <strong>and</strong> Concrete Research 42 (2012) 665–672<br />
Contents lists available <strong>at</strong> SciVerse ScienceDirect<br />
Cement <strong>and</strong> Concrete Research<br />
journal homepage: http://ees.elsevier.com/CEMCON/default.asp<br />
The <strong>setting</strong> of cement paste is widely understood to be caused by <strong>percol<strong>at</strong>ion</strong> of <strong>the</strong> links th<strong>at</strong> are cre<strong>at</strong>ed by<br />
overlap of hydr<strong>at</strong>ion products on <strong>the</strong> surfaces of reacting grains of clinker. Percol<strong>at</strong>ion <strong>the</strong>ory predicts th<strong>at</strong><br />
<strong>the</strong> elastic modulus will increase with a certain functional form, but few <strong>at</strong>tempts have been made to demonstr<strong>at</strong>e<br />
this behavior quantit<strong>at</strong>ively. We discuss <strong>the</strong> appropri<strong>at</strong>e variables to use for this test of <strong>the</strong> <strong>the</strong>ory,<br />
<strong>and</strong> show th<strong>at</strong> <strong>the</strong> <strong>percol<strong>at</strong>ion</strong> probability is proportional to time only over a narrow time interval. We compare<br />
<strong>the</strong> measured <strong>and</strong> predicted degree of hydr<strong>at</strong>ion <strong>at</strong> <strong>the</strong> <strong>percol<strong>at</strong>ion</strong> threshold, <strong>and</strong> show th<strong>at</strong> <strong>the</strong> hardcore/soft-shell<br />
model strongly over-estim<strong>at</strong>es <strong>the</strong> amount of hydr<strong>at</strong>ion <strong>at</strong> <strong>the</strong> <strong>setting</strong> <strong>point</strong>. The discrepancy<br />
is <strong>at</strong>tributed to agglomer<strong>at</strong>ion of particles in <strong>the</strong> paste, which reduces <strong>the</strong> amount of hydr<strong>at</strong>ion needed to link<br />
<strong>the</strong> particles into an elastic network.<br />
© 2012 Elsevier Ltd. All rights reserved.<br />
soft-shell (HCSS) <strong>percol<strong>at</strong>ion</strong> model developed by Torqu<strong>at</strong>o et al. [10,<br />
Ch. 10 of ref. 11], which is particularly relevant to <strong>setting</strong> of cement paste.<br />
2. Percol<strong>at</strong>ion <strong>the</strong>ory<br />
2.1. L<strong>at</strong>tice <strong>and</strong> continuum <strong>percol<strong>at</strong>ion</strong><br />
In its simplest form, <strong>percol<strong>at</strong>ion</strong> <strong>the</strong>ory describes <strong>the</strong> growth of<br />
clusters as particles are placed on <strong>the</strong> sites of a l<strong>at</strong>tice, or as bonds<br />
are established between particles in an array. The probability of filling<br />
a site or forming a bond is p, <strong>and</strong> it is found th<strong>at</strong> a continuous network<br />
(or, infinite cluster) is formed <strong>at</strong> a critical value, p=pC, called <strong>the</strong> <strong>percol<strong>at</strong>ion</strong><br />
threshold. In <strong>the</strong> vicinity of <strong>the</strong> threshold, many properties<br />
(P) of <strong>the</strong> network obey power-laws, such as<br />
P∝ðp−pCÞ γ<br />
where γ is called a critical exponent [12]. The value of pC depends on<br />
<strong>the</strong> geometry of <strong>the</strong> l<strong>at</strong>tice, but <strong>the</strong> critical exponents do not (for systems<br />
in which connections are made only between nearest neighbors<br />
[11]).<br />
It has been demonstr<strong>at</strong>ed th<strong>at</strong> <strong>the</strong> <strong>percol<strong>at</strong>ion</strong> threshold occurs <strong>at</strong><br />
a fixed volume fraction of connected particles (or area fraction, in<br />
two-dimensional l<strong>at</strong>tices) [12], which makes it practical to apply <strong>percol<strong>at</strong>ion</strong><br />
<strong>the</strong>ory to physical problems. This is called continuum <strong>percol<strong>at</strong>ion</strong>,<br />
because it assumes th<strong>at</strong> <strong>the</strong> percol<strong>at</strong>ing objects are placed <strong>at</strong><br />
r<strong>and</strong>om in continuous space, r<strong>at</strong>her than on a l<strong>at</strong>tice. The critical exponents<br />
for geometrical properties (such as <strong>the</strong> cluster size distribution)<br />
are identical for continuum <strong>and</strong> l<strong>at</strong>tice <strong>percol<strong>at</strong>ion</strong>, but <strong>the</strong><br />
exponents for transport properties may be different. For example, if<br />
ð1Þ
equal-sized balls of glass <strong>and</strong> aluminum are r<strong>and</strong>omly mixed, <strong>the</strong>n<br />
<strong>the</strong> mixture will become electrically conducting when <strong>the</strong> volume<br />
fraction of aluminum particles, ϕ, exceeds ϕC≈16 vol.%, which is<br />
<strong>the</strong> <strong>percol<strong>at</strong>ion</strong> threshold in 3-d [12]. In this case, <strong>the</strong> conductivity,<br />
σ, would vary as<br />
σ∝ðϕ−ϕCÞ τ<br />
Author's personal copy<br />
666 G.W. Scherer et al. / Cement <strong>and</strong> Concrete Research 42 (2012) 665–672<br />
where <strong>the</strong> exponent τ ≈1.6–2 in 3-d (with more recent analyses favoring<br />
<strong>the</strong> higher value) (Ch. 9 of ref. 11[12]). In this example, <strong>the</strong><br />
percol<strong>at</strong>ing objects are non-overlapping spheres, <strong>and</strong> <strong>the</strong>y exhibit<br />
<strong>the</strong> same exponent as a l<strong>at</strong>tice model. Feng et al. [13] showed th<strong>at</strong><br />
<strong>the</strong> conductivity exponent for overlapping spheres (wh<strong>at</strong> <strong>the</strong>y call<br />
<strong>the</strong> “inverse Swiss-cheese model”) is also <strong>the</strong> same as τ for a l<strong>at</strong>tice<br />
model; however, if r<strong>and</strong>om spherical voids are placed in a conducting<br />
continuum, <strong>the</strong>n <strong>the</strong> exponent rises by 0.5. The change in τ is <strong>at</strong>tributed<br />
to <strong>the</strong> influence of very tenuous links th<strong>at</strong> are cre<strong>at</strong>ed when<br />
two voids are close toge<strong>the</strong>r; in contrast, all of <strong>the</strong> links in a l<strong>at</strong>tice<br />
model have equal conductivity.<br />
Models for <strong>the</strong> elastic behavior of percol<strong>at</strong>ing systems show a<br />
broad range of critical behavior. For a system described by an isotropic<br />
Born potential, in which rel<strong>at</strong>ive displacements of particles in any<br />
direction gener<strong>at</strong>e <strong>the</strong> same force (a situ<strong>at</strong>ion called scalar, orisotropic,<br />
elasticity), <strong>the</strong> shear modulus is expected to exhibit <strong>the</strong> same critical<br />
exponent as σ [14,15]; however, under purely central forces, a<br />
higher exponent (on <strong>the</strong> order of 3.4–4.4 [16]) <strong>and</strong> a higher <strong>percol<strong>at</strong>ion</strong><br />
threshold are predicted to apply [14]. The Born potential is not<br />
rot<strong>at</strong>ionally invariant (i.e., it indic<strong>at</strong>es th<strong>at</strong> interparticle forces result<br />
from a rot<strong>at</strong>ion of <strong>the</strong> whole body), so it is not clear th<strong>at</strong> it provides<br />
a correct represent<strong>at</strong>ion for any physical system. L<strong>at</strong>tice models in<br />
which bonds resist both stretching <strong>and</strong> bending yield a critical exponent<br />
of γ≈4 for <strong>the</strong> elastic modulus [13], <strong>and</strong> continuum models<br />
with overlapping spheres are predicted to have γ≈4.5 in 3dimensions.<br />
Some experimental studies show <strong>the</strong> higher exponents, <strong>and</strong> some<br />
seem to indic<strong>at</strong>e th<strong>at</strong> <strong>the</strong>re is a crossover from lower to higher values<br />
as <strong>the</strong> degree of connectivity increases [16]. On <strong>the</strong> o<strong>the</strong>r h<strong>and</strong>, studies<br />
of gel<strong>at</strong>ion of polymers usually indic<strong>at</strong>e an exponent near 2 (e.g.,<br />
[17]), as do studies of <strong>the</strong> <strong>setting</strong> of cement [18]. In general, <strong>the</strong><br />
form of Eq. (1) applies only in <strong>the</strong> immedi<strong>at</strong>e vicinity of <strong>the</strong> <strong>percol<strong>at</strong>ion</strong><br />
threshold, because it is only one term in a series expansion, <strong>and</strong><br />
<strong>the</strong>re is no way to anticip<strong>at</strong>e its range of applicability a priori. It is<br />
possible th<strong>at</strong> <strong>the</strong> <strong>the</strong>oretically predicted exponents only apply in a<br />
very narrow range of p–pC th<strong>at</strong> is not captured by <strong>the</strong> experiments.<br />
Well beyond <strong>the</strong> threshold, conventional composite models will<br />
apply, <strong>and</strong> <strong>the</strong>se predict a nearly parabolic dependence on <strong>the</strong> volume<br />
fraction of solids [19,20]. A fur<strong>the</strong>r complic<strong>at</strong>ion is th<strong>at</strong> hard spheres<br />
exhibit highly nonlinear elastic behavior, as <strong>the</strong>y oppose being<br />
pushed toge<strong>the</strong>r, but not being pulled apart [21]. In <strong>the</strong> case of an<br />
HCSS particle, <strong>the</strong> r<strong>at</strong>io of resistance to compression versus tension<br />
depends on <strong>the</strong> thickness of <strong>the</strong> shell <strong>and</strong> <strong>the</strong> magnitude of <strong>the</strong> strain.<br />
The development of <strong>the</strong> modulus during <strong>setting</strong> of cement paste<br />
has been measured by rheometry e.g., [22] <strong>and</strong> acoustic methods<br />
[22–30]. In most cases, <strong>the</strong> increase in stiffness was correl<strong>at</strong>ed with<br />
<strong>the</strong> degree of connectivity calcul<strong>at</strong>ed from a numerical simul<strong>at</strong>ion<br />
[4,5,8,27,31]. In one case [31], <strong>the</strong> calcul<strong>at</strong>ed amount of connected<br />
solids was used toge<strong>the</strong>r with an assumed critical exponent of<br />
γ =1.53 to find <strong>the</strong> constant of proportionality in Eq. (2); however,<br />
<strong>the</strong> modulus d<strong>at</strong>a were compromised by entrapped air in <strong>the</strong> sample,<br />
as explained in <strong>the</strong> next section. Ano<strong>the</strong>r study [8] used a similar procedure,<br />
but applied Eq. (2) to d<strong>at</strong>a very far from <strong>the</strong> <strong>percol<strong>at</strong>ion</strong><br />
threshold (>36 h of hydr<strong>at</strong>ion), where <strong>the</strong> <strong>the</strong>ory is not expected to<br />
apply. Boumiz et al. [18] analyzed acoustic d<strong>at</strong>a in terms of <strong>percol<strong>at</strong>ion</strong><br />
<strong>the</strong>ory by assuming th<strong>at</strong> <strong>the</strong> progress of <strong>the</strong> <strong>percol<strong>at</strong>ion</strong> process<br />
could be approxim<strong>at</strong>ed by replacing p–p C with <strong>the</strong> elapsed time, t–<br />
tC. This is valid if <strong>the</strong> r<strong>at</strong>e of <strong>the</strong> process is constant in time, but th<strong>at</strong><br />
ð2Þ<br />
is an assumption th<strong>at</strong> needs to be verified. We will demonstr<strong>at</strong>e in<br />
Section 3 th<strong>at</strong> it only applies in a very small time interval near <strong>the</strong><br />
<strong>percol<strong>at</strong>ion</strong> threshold.<br />
2.2. HCSS <strong>percol<strong>at</strong>ion</strong><br />
The st<strong>and</strong>ard version of continuum <strong>percol<strong>at</strong>ion</strong> <strong>the</strong>ory clearly<br />
does not describe <strong>the</strong> <strong>setting</strong> of cement, where <strong>the</strong> volume fraction<br />
of solids is initially well above 16%. The particles in cement are not<br />
loc<strong>at</strong>ed r<strong>and</strong>omly in space: <strong>the</strong>y are dispersed in a liquid <strong>and</strong>, in <strong>the</strong><br />
absence of aggreg<strong>at</strong>ion, 1 it would be possible to put more than<br />
60 vol.% particles into a slurry without forming a network. In <strong>the</strong><br />
paste, <strong>the</strong> network forms as a result of <strong>the</strong> growth of hydr<strong>at</strong>ion<br />
products on <strong>the</strong> surfaces of <strong>the</strong> clinker particles, so <strong>the</strong> quantity p–<br />
p C must be rel<strong>at</strong>ed to <strong>the</strong> degree of hydr<strong>at</strong>ion. This process is described<br />
by <strong>the</strong> HCSS model [11], where <strong>the</strong> hard core represents<br />
<strong>the</strong> unhydr<strong>at</strong>ed clinker <strong>and</strong> <strong>the</strong> soft shell represents <strong>the</strong> layer of hydr<strong>at</strong>ion<br />
products. The shells overlap to link <strong>the</strong> particles into increasingly<br />
large clusters, leading to <strong>percol<strong>at</strong>ion</strong>. Although <strong>the</strong><br />
geometry of this model is different from conventional continuum<br />
<strong>percol<strong>at</strong>ion</strong>, <strong>the</strong> same critical exponents apply [32]. The comparison<br />
of <strong>the</strong> HCSS model with d<strong>at</strong>a for Class H cement will be shown in<br />
Section 4.<br />
3. Acoustic transmission<br />
3.1. Slurries <strong>and</strong> networks<br />
The velocity, V, of a longitudinal wave in a suspension is given approxim<strong>at</strong>ely<br />
by [33]<br />
K M ¼ ρ M V 2<br />
where ρM <strong>and</strong> KM are <strong>the</strong> mean density <strong>and</strong> bulk modulus of <strong>the</strong> suspension,<br />
which are defined by<br />
ρM ¼ ϕρS þ ð1−ϕÞρF ð4Þ<br />
<strong>and</strong><br />
1<br />
K M<br />
¼ ϕ<br />
þ<br />
KS 1−ϕ<br />
KF where ρS <strong>and</strong> ρF are <strong>the</strong> densities, <strong>and</strong> KS <strong>and</strong> KF are <strong>the</strong> bulk moduli,<br />
of <strong>the</strong> suspended particles <strong>and</strong> <strong>the</strong> fluid medium, respectively; <strong>the</strong><br />
mean density of a cement paste with w/c=0.35 is ρM≈2023 kg/m 3 .<br />
A more rigorous expression, which takes account of <strong>the</strong> frequency<br />
of <strong>the</strong> sound <strong>and</strong> <strong>the</strong> size of <strong>the</strong> suspended particles, was derived by<br />
Harker <strong>and</strong> Temple [33], <strong>and</strong> is discussed in Appendix 1. The effect<br />
of air on <strong>the</strong> velocity is shown in Fig. 1, where V drops below <strong>the</strong><br />
speed of sound in air (~300 m/s) when <strong>the</strong> volume fraction of air exceeds<br />
~0.1%; very similar results are obtained using Eq. (3). The impact<br />
of entrapped air was emphasized by Ke<strong>at</strong>ing et al. [22], <strong>and</strong> <strong>the</strong><br />
effect is clearly illustr<strong>at</strong>ed in Fig. 5 of Sant et al. [30]. In contrast, cement<br />
particles suspended in w<strong>at</strong>er are predicted to have a minor effect<br />
on V, as shown in Fig. 2. The particles cause some <strong>at</strong>tenu<strong>at</strong>ion of<br />
<strong>the</strong> wave, but <strong>the</strong> effect is very small compared to th<strong>at</strong> of air, as<br />
shown in Fig. 3.<br />
1 Throughout this paper, we use <strong>the</strong> term “aggreg<strong>at</strong>ion” <strong>and</strong> “aggreg<strong>at</strong>e” to describe<br />
loose clusters of cement particles in <strong>the</strong> paste th<strong>at</strong> have floccul<strong>at</strong>ed as a result of <strong>at</strong>tractive<br />
van der Waals forces. These aggreg<strong>at</strong>es are to be distinguished from <strong>the</strong> rigid links<br />
cre<strong>at</strong>ed by overlapping hydr<strong>at</strong>ion products, which lead to form<strong>at</strong>ion of an elastic network<br />
<strong>at</strong> <strong>the</strong> <strong>percol<strong>at</strong>ion</strong> threshold.<br />
ð3Þ<br />
ð5Þ
Fig. 1. Velocity of a longitudinal sound wave in w<strong>at</strong>er as a function of <strong>the</strong> volume fraction<br />
of air, ϕ, calcul<strong>at</strong>ed using Eq. (14) with <strong>the</strong> property values given in Appendix 1.<br />
When <strong>the</strong> particles are connected into a network, <strong>the</strong> propag<strong>at</strong>ion<br />
of sound is described by <strong>the</strong> <strong>the</strong>ory developed by Biot [34,35]. When a<br />
cement paste sets, Sayers <strong>and</strong> Grenfell [36] argue th<strong>at</strong> Biot's lowfrequency<br />
limit applies:<br />
ρ MV 2 ¼ M ð6Þ<br />
where<br />
M ¼ K þ 4<br />
KF ðK G þ<br />
S−KÞ<br />
3 2<br />
KF ðKS−KÞþKSðKS−KFÞð1−ϕÞ In Eq. (7), G <strong>and</strong> K are <strong>the</strong> drained shear <strong>and</strong> bulk moduli of <strong>the</strong><br />
solid network, <strong>and</strong> ϕ is <strong>the</strong> volume fraction occupied by <strong>the</strong> network<br />
(which increases as hydr<strong>at</strong>ion proceeds). In <strong>the</strong> limit when <strong>the</strong> network<br />
is extremely tenuous (K <strong>and</strong> Gbb K F or K S), Eq. (7) reduces to<br />
1<br />
M≈<br />
¼ KM ϕ=KS þ ð1−ϕÞ=KF Thus, Eq. (6) becomes identical to Eq. (3) near <strong>the</strong> <strong>percol<strong>at</strong>ion</strong><br />
threshold. To identify <strong>the</strong> <strong>point</strong> <strong>at</strong> which <strong>the</strong> network begins to<br />
form, we need to subtract those two equ<strong>at</strong>ions. If we define <strong>the</strong> velocity<br />
in <strong>the</strong> suspension before <strong>percol<strong>at</strong>ion</strong> as V 0 ¼ ffiffiffiffiffiffiffiffiffiffiffiffiffiffiffi p<br />
, <strong>the</strong>n<br />
Author's personal copy<br />
KM=ρ M<br />
ρM V 2 −V 2<br />
0 ¼ K þ 4<br />
G ≡ H ð8Þ<br />
3<br />
where we introduce <strong>the</strong> longitudinal modulus of <strong>the</strong> network, H (also<br />
known as <strong>the</strong> oedometric modulus [37] or <strong>the</strong> stiffness c 11 [38]).<br />
The <strong>the</strong>ory indic<strong>at</strong>es th<strong>at</strong> we should expect a longitudinal wave in<br />
a cement slurry to behave as shown in Fig. 4, beginning <strong>at</strong> about<br />
1500 m/s <strong>and</strong> rising to a value typical of hardened cement as <strong>setting</strong><br />
occurs; <strong>the</strong> increase begins <strong>at</strong> <strong>the</strong> <strong>percol<strong>at</strong>ion</strong> threshold when G <strong>and</strong><br />
K take on finite values. The acoustic velocity d<strong>at</strong>a in Fig. 4 were<br />
Fig. 2. Velocity of a longitudinal sound wave in w<strong>at</strong>er as a function of <strong>the</strong> volume fraction<br />
of cement particles in suspension, ϕ, calcul<strong>at</strong>ed using Eq. (14) with <strong>the</strong> property<br />
values given in Appendix 1.<br />
G.W. Scherer et al. / Cement <strong>and</strong> Concrete Research 42 (2012) 665–672<br />
ð7Þ<br />
ð8Þ<br />
Fig. 3. Attenu<strong>at</strong>ion of a longitudinal wave as a function of <strong>the</strong> volume fraction, ϕ of air<br />
(solid curve) or cement particles (dashed curve), calcul<strong>at</strong>ed using Eq. (15) with <strong>the</strong><br />
property values given in Appendix 1.<br />
obtained as part of a study reported earlier [9], where <strong>the</strong> procedure<br />
is described in detail. The plot shows <strong>the</strong> results of three runs, indic<strong>at</strong>ing<br />
th<strong>at</strong> <strong>the</strong> reproducibility is excellent, so we will test <strong>the</strong> fit of <strong>percol<strong>at</strong>ion</strong><br />
<strong>the</strong>ory to <strong>the</strong>se d<strong>at</strong>a.<br />
It has been shown th<strong>at</strong> colloids exhibit a rigidity threshold when<br />
<strong>the</strong> period of <strong>the</strong> acoustic wave is short compared to <strong>the</strong> lifetime of<br />
transient percol<strong>at</strong>ing clusters th<strong>at</strong> form <strong>and</strong> disintegr<strong>at</strong>e under <strong>the</strong> influence<br />
of Brownian agit<strong>at</strong>ion [39]. Clinker particles are too large to<br />
undergo Brownian diffusion [45], so <strong>the</strong> lifetime of aggreg<strong>at</strong>es is<br />
quite long compared to <strong>the</strong> period of <strong>the</strong> ultrasonic waves used in<br />
our experiments, but <strong>the</strong>re is not enough mobility to cause transient<br />
<strong>percol<strong>at</strong>ion</strong>. The presence of agglomer<strong>at</strong>ion may contribute to <strong>the</strong> initial<br />
velocity measured in <strong>the</strong> slurry, but <strong>the</strong> rise in stiffness near <strong>the</strong><br />
<strong>setting</strong> <strong>point</strong> is caused by <strong>the</strong> form<strong>at</strong>ion of elastic networks, which<br />
are also detected by low-frequency rheological measurements.<br />
3.2. Percol<strong>at</strong>ion analysis of acoustic d<strong>at</strong>a<br />
It is <strong>the</strong> modulus of <strong>the</strong> network th<strong>at</strong> forms after <strong>percol<strong>at</strong>ion</strong> th<strong>at</strong><br />
is described by <strong>the</strong> power law, so we use Eqs. (1) <strong>and</strong> (8) to write<br />
H ¼ ρM V 2 −V 2<br />
0 ∝ðp−pCÞ γ<br />
Sayers <strong>and</strong> Grenfell [36] found th<strong>at</strong> <strong>the</strong> moduli were proportional<br />
to each o<strong>the</strong>r after <strong>the</strong> <strong>percol<strong>at</strong>ion</strong> threshold, so G, K, <strong>and</strong> H must scale<br />
with <strong>the</strong> same exponent. We want to determine <strong>the</strong> critical exponent,<br />
γ, <strong>and</strong> <strong>percol<strong>at</strong>ion</strong> threshold, p C. In <strong>the</strong> study by Boumiz et al. [18],<br />
<strong>the</strong>y assumed th<strong>at</strong> <strong>the</strong> r<strong>at</strong>e of hydr<strong>at</strong>ion was proportional to time,<br />
so th<strong>at</strong> p–p C could be replaced by <strong>the</strong> elapsed time after <strong>the</strong> threshold,<br />
Fig. 4. Left ordin<strong>at</strong>e: Measured velocity of longitudinal wave in Class H cement with<br />
w<strong>at</strong>er/cement r<strong>at</strong>io =0.35, measured <strong>at</strong> 25 °C, as a function of time since contact<br />
with w<strong>at</strong>er; three runs over 2 weeks. Right ordin<strong>at</strong>e: Chemical shrinkage of <strong>the</strong> same<br />
type of paste; three runs over 4 months.<br />
D<strong>at</strong>a from ref. [9].<br />
667<br />
ð9Þ
t–tC. We can test this assumption by making use of <strong>the</strong> shrinkage d<strong>at</strong>a<br />
th<strong>at</strong> were collected for identical pastes, by <strong>the</strong> technique described in<br />
Ref. [9]. The chemical shrinkage strain, ε, is shown in Fig. 4. One might<br />
argue th<strong>at</strong> chemical shrinkage is an indirect measure of <strong>the</strong> extent of<br />
reaction, but <strong>the</strong> shrinkage is linearly proportional to <strong>the</strong> degree of<br />
hydr<strong>at</strong>ion, h, as shown in Fig. 5; <strong>the</strong> slope is s=ε/h=−0.0764 mL/<br />
(g clinker). The advantage of using ε is th<strong>at</strong> it is recorded continuously<br />
with high resolution in time, as is <strong>the</strong> pulse velocity.<br />
The velocity d<strong>at</strong>a were fit to <strong>the</strong> power law, using <strong>the</strong> absolute<br />
value of <strong>the</strong> chemical shrinkage to represent <strong>the</strong> parameter p, with<br />
c, |εC|, <strong>and</strong> γ as free parameters:<br />
V 2 −V 2<br />
0 ¼ cðjj− ε jεCjÞ γ<br />
Author's personal copy<br />
668 G.W. Scherer et al. / Cement <strong>and</strong> Concrete Research 42 (2012) 665–672<br />
ð10Þ<br />
The fit, shown in Fig. 6, is very good; <strong>the</strong> power-law region extends<br />
up to about 20 h of hydr<strong>at</strong>ion time, which is much l<strong>at</strong>er than<br />
<strong>the</strong> final <strong>setting</strong> time (~7–8 h) found from <strong>the</strong> Vic<strong>at</strong> needle test. The<br />
exponent is γ=1.59, which is lower than <strong>the</strong> value expected for scalar<br />
elasticity. Over this time interval, <strong>the</strong> longitudinal modulus has<br />
risen to about 10 GPa; after 90 h, <strong>the</strong> velocity reaches ~3100 m/s<br />
(not shown), which corresponds to H≈19.4 GPa. Thus, <strong>the</strong> powerlaw<br />
applies while <strong>the</strong> modulus rises to about half of its final value.<br />
The velocity d<strong>at</strong>a are also fit quite well by an equ<strong>at</strong>ion of <strong>the</strong> form<br />
V 2 −V 2<br />
0 ¼ ct−t ð CÞ<br />
γ<br />
ð11Þ<br />
but only over a range from about 4 to 9 h. After th<strong>at</strong>, <strong>the</strong> curv<strong>at</strong>ure reverses<br />
(becoming concave down toward <strong>the</strong> time axis). In th<strong>at</strong> small<br />
interval, a good fit is obtained with γ≈2.0 (not shown), as was found<br />
by Boumiz et al. [18]. If <strong>the</strong> fit toEq.(10) is limited to th<strong>at</strong> time interval,<br />
<strong>the</strong> exponent is also found to be about 2, indic<strong>at</strong>ing th<strong>at</strong> ε is linearly<br />
proportional to time over th<strong>at</strong> period; however, <strong>the</strong> range of<br />
d<strong>at</strong>a is r<strong>at</strong>her small for fixing 3 parameters. Never<strong>the</strong>less, since <strong>the</strong><br />
exponent found for <strong>the</strong> wider range of time is lower than predicted<br />
by any <strong>percol<strong>at</strong>ion</strong> model, it is reasonable to conclude th<strong>at</strong> a powerlaw<br />
fit to <strong>the</strong> smaller interval is most appropri<strong>at</strong>e, in which case we<br />
can use ei<strong>the</strong>r variable to represent p–pC, <strong>and</strong> <strong>the</strong> critical exponent<br />
is very nearly γ≈2.<br />
From <strong>the</strong> fit to Eq. (10), <strong>the</strong> chemical shrinkage <strong>at</strong> <strong>the</strong> <strong>percol<strong>at</strong>ion</strong><br />
threshold is found to be |εC|=0.00198 mL/g, which occurs <strong>at</strong> about<br />
3.9 h of hydr<strong>at</strong>ion; <strong>the</strong> fit to Eq. (11) yields tC≈4.1 h. Both times are<br />
significantly shorter than <strong>the</strong> time of initial set found by <strong>the</strong> Vic<strong>at</strong><br />
Fig. 5. Absolute value of <strong>the</strong> chemical shrinkage of Class H cement paste, |ε|, versus degree<br />
of hydr<strong>at</strong>ion (lower abscissa) <strong>and</strong> time (upper abscissa). A linear fitof|ε| as a function<br />
of h yields a slope of 0.0764 mL/g; <strong>the</strong> dependence of |ε| on time is highly<br />
nonlinear over <strong>the</strong> same interval.<br />
D<strong>at</strong>a from ref. [9].<br />
Fig. 6. Longitudinal velocity (symbols) plotted versus <strong>the</strong> absolute value of <strong>the</strong> chemical<br />
shrinkage, |ε| (lower abscissa), <strong>and</strong> versus <strong>the</strong> time of hydr<strong>at</strong>ion, t (upper abscissa).<br />
Solid curve is a fit to Eq. (10), which yields a critical exponent of γ=1.59; d<strong>at</strong>a from<br />
Fig. 4. Right ordin<strong>at</strong>e is longitudinal modulus, calcul<strong>at</strong>ed from acoustic velocity using<br />
Eq. (8) with ρM=2023 kg/m 3 .<br />
test, which was 5.5 h for this paste [9]. This disparity, which has<br />
also been observed in comparisons of <strong>the</strong> Vic<strong>at</strong> <strong>setting</strong> <strong>point</strong> with oscill<strong>at</strong>ory<br />
rheology [40], occurs because <strong>the</strong> modulus <strong>at</strong> <strong>the</strong> <strong>percol<strong>at</strong>ion</strong><br />
threshold is very much smaller than <strong>the</strong> yield stress (around 40 kPa<br />
[41]) detected by <strong>the</strong> Vic<strong>at</strong> needle.<br />
If no d<strong>at</strong>a on chemical shrinkage or degree of hydr<strong>at</strong>ion are available,<br />
a reasonably accur<strong>at</strong>e estim<strong>at</strong>e of <strong>the</strong> time of <strong>percol<strong>at</strong>ion</strong> can be<br />
obtained using time as a variable, as suggested by Boumiz et al. [18].<br />
One can assume th<strong>at</strong> γ=2 in Eq. (11), <strong>and</strong> fit <strong>the</strong> following equ<strong>at</strong>ion<br />
to <strong>the</strong> d<strong>at</strong>a:<br />
ffiffiffiffiffiffiffiffiffiffiffiffiffiffiffiffi<br />
V 2−V 2 q<br />
0 ¼ c ′ ðt−tCÞ ð12Þ<br />
This is only valid if <strong>the</strong>re is no entrapped air, so th<strong>at</strong> V0 is ~1500 m/<br />
s, <strong>and</strong> it can only be expected to work in a small time interval around<br />
tC, where <strong>the</strong> plot is linear. An example of such a fit is shown in Fig. 7<br />
for <strong>the</strong> same d<strong>at</strong>a as in Fig. 6.<br />
When comparing <strong>the</strong> acoustic <strong>and</strong> shrinkage measurements, it is<br />
important to recognize th<strong>at</strong> <strong>the</strong> paste in <strong>the</strong> shrinkage experiment<br />
is covered with w<strong>at</strong>er, <strong>and</strong> <strong>the</strong> sample is rel<strong>at</strong>ively small, so <strong>the</strong>re is<br />
not likely to be any self-desicc<strong>at</strong>ion during <strong>the</strong> test. In contrast, <strong>the</strong><br />
acoustic sample is covered with oil, so it is possible th<strong>at</strong> hydr<strong>at</strong>ion<br />
would be more limited than for <strong>the</strong> shrinkage sample after <strong>setting</strong><br />
occurs. In <strong>the</strong> present case, this is unlikely, because <strong>the</strong> Class H cement<br />
is rel<strong>at</strong>ively coarse, <strong>and</strong> shows severe bleeding <strong>at</strong> w/c as low<br />
Fig. 7. Approxim<strong>at</strong>e <strong>percol<strong>at</strong>ion</strong> fit to acoustic d<strong>at</strong>a using Eq. (12); velocity d<strong>at</strong>a are <strong>the</strong><br />
same as in Fig. 6.
as 0.4, which is why our tests were run <strong>at</strong> w/c=0.35. However, for<br />
ordinary cement pastes, <strong>the</strong> degree of hydr<strong>at</strong>ion <strong>at</strong> low w/c might<br />
be different in shrinkage <strong>and</strong> acoustic experiments after <strong>setting</strong> occurs.<br />
The difference could be mitig<strong>at</strong>ed by putting a layer of w<strong>at</strong>er<br />
over <strong>the</strong> acoustic sample, <strong>and</strong> covering th<strong>at</strong> with oil to suppress evapor<strong>at</strong>ion,<br />
or by covering <strong>the</strong> shrinkage sample with oil, instead of<br />
w<strong>at</strong>er.<br />
The present d<strong>at</strong>a, as well as <strong>the</strong> results of simul<strong>at</strong>ions <strong>and</strong> experiments<br />
reported in <strong>the</strong> liter<strong>at</strong>ure, are consistent with <strong>the</strong> idea th<strong>at</strong> <strong>setting</strong><br />
of cement paste results from <strong>percol<strong>at</strong>ion</strong> of <strong>the</strong> particles. This<br />
means th<strong>at</strong> <strong>setting</strong> is a geometrical phenomenon: for a given initial<br />
volume fraction of clinker, <strong>setting</strong> will occur <strong>at</strong> a fixed degree of hydr<strong>at</strong>ion,<br />
independent of temper<strong>at</strong>ure, pressure, or <strong>the</strong> use of acceler<strong>at</strong>ors<br />
or retarders (as long as those factors do not change <strong>the</strong> n<strong>at</strong>ure<br />
of <strong>the</strong> hydr<strong>at</strong>ion product). These expect<strong>at</strong>ions are borne out experimentally<br />
[9,42]. We should, <strong>the</strong>refore, be able to use <strong>percol<strong>at</strong>ion</strong> <strong>the</strong>ory<br />
to predict <strong>the</strong> degree of hydr<strong>at</strong>ion <strong>at</strong> which <strong>setting</strong> of a paste will<br />
begin for a given w<strong>at</strong>er/cement r<strong>at</strong>io <strong>and</strong> particle size distribution.<br />
We will <strong>at</strong>tempt to do this by applic<strong>at</strong>ion of <strong>the</strong> HCSS model.<br />
4. Percol<strong>at</strong>ion <strong>and</strong> <strong>setting</strong><br />
If equally sized non-overlapping spheres are placed <strong>at</strong> r<strong>and</strong>om in a<br />
box, <strong>the</strong>y will percol<strong>at</strong>e <strong>at</strong> a volume fraction of about 16%, so ano<strong>the</strong>r<br />
approach is needed to reach <strong>the</strong> high solids loadings of cement paste.<br />
The HCSS simul<strong>at</strong>ion begins by arranging particles in a box on a l<strong>at</strong>tice,<br />
<strong>and</strong> <strong>the</strong>n shifting <strong>the</strong>ir positions with a Metropolis algorithm to<br />
achieve a r<strong>and</strong>om distribution. If one were to try to shift <strong>the</strong> particles<br />
so as to minimize <strong>the</strong>ir energy of interaction, crystalliz<strong>at</strong>ion would<br />
occur for any solids loading exceeding ~49 vol.% [43,44]. This does<br />
not happen in a real cement paste, because <strong>the</strong> particles are polydisperse,<br />
<strong>and</strong> <strong>the</strong>y are too large to undergo Brownian diffusion [45]. In<br />
<strong>the</strong> simul<strong>at</strong>ion, however, <strong>the</strong> rearrangement must be stopped <strong>at</strong><br />
some stage prior to crystalliz<strong>at</strong>ion, when <strong>the</strong> particles are in a metastable<br />
arrangement in which <strong>the</strong>y are as widely separ<strong>at</strong>ed as possible.<br />
This is an important fe<strong>at</strong>ure of this model, because <strong>the</strong> initial arrangement<br />
is well dispersed, whereas cement paste shows some degree of<br />
agglomer<strong>at</strong>ion [46], even when dispersants are used [47]. The consequences<br />
of this will become apparent.<br />
Once <strong>the</strong> hard cores of <strong>the</strong> particles are in place, each can be exp<strong>and</strong>ed<br />
by an amount th<strong>at</strong> corresponds to <strong>the</strong> thickness of <strong>the</strong> soft<br />
shell. The r<strong>at</strong>io of <strong>the</strong> diameter of <strong>the</strong> core, DC, to th<strong>at</strong> of <strong>the</strong> shell of<br />
<strong>the</strong> particle, D P, is <strong>the</strong> “impenetrability parameter”, λ =D C/D P. The<br />
volume fraction <strong>at</strong> which <strong>the</strong> shells percol<strong>at</strong>e, ϕC, is shown as a function<br />
of λ in Fig. 8. We need to rel<strong>at</strong>e λ to <strong>the</strong> degree of hydr<strong>at</strong>ion, h,of<br />
Fig. 8. Volume fraction of monodisperse hard-core/soft-shell particles (accounting for<br />
overlap of <strong>the</strong> shells) <strong>at</strong> <strong>the</strong> <strong>percol<strong>at</strong>ion</strong> threshold, as a function of <strong>the</strong> impenetrability<br />
parameter, λ. Curve is an empirical fit given in Eq. (22).<br />
D<strong>at</strong>a from Fig. 10.8 of ref. [11].<br />
Author's personal copy<br />
G.W. Scherer et al. / Cement <strong>and</strong> Concrete Research 42 (2012) 665–672<br />
<strong>the</strong> clinker, so th<strong>at</strong> we can use this <strong>the</strong>ory to predict <strong>the</strong> <strong>percol<strong>at</strong>ion</strong><br />
threshold for cement. The details of <strong>the</strong> calcul<strong>at</strong>ion are explained in<br />
Appendix 2.<br />
Based on <strong>the</strong> analysis in Appendix 2, we can rel<strong>at</strong>e <strong>the</strong> impenetrability<br />
parameter, λ, to <strong>the</strong> degree of hydr<strong>at</strong>ion (DOH) of a hypo<strong>the</strong>tical<br />
cement with uniform particle size. In Fig. 9, <strong>the</strong> predictions of <strong>the</strong><br />
HCSS model are compared to values measured in Ref. [9]. The predicted<br />
DOH is much gre<strong>at</strong>er than <strong>the</strong> measured value, <strong>and</strong> <strong>the</strong> discrepancy<br />
increases with <strong>the</strong> w<strong>at</strong>er/cement r<strong>at</strong>io. The measured<br />
values correspond to <strong>the</strong> initial set found by <strong>the</strong> Vic<strong>at</strong> needle test,<br />
which occurs well after <strong>percol<strong>at</strong>ion</strong>, so <strong>the</strong> predicted DOH values<br />
should fall below <strong>the</strong> measurements. One might argue th<strong>at</strong> <strong>the</strong> problem<br />
with <strong>the</strong> model is th<strong>at</strong> it applies to monodisperse particles,<br />
whereas <strong>the</strong> particle size distribution in <strong>the</strong> actual cement ranges<br />
from about 0.5 to 90 μm [48]. To investig<strong>at</strong>e <strong>the</strong> significance of this<br />
factor, four series of simul<strong>at</strong>ions were done in which several particle<br />
sizes from <strong>the</strong> measured distribution were included, with <strong>the</strong> r<strong>at</strong>io<br />
of <strong>the</strong> largest to smallest being 3:1 (with 10 sizes ranging from<br />
0.239 to 0.717 μm), 6.25:1 (with 15 sizes, up to 1.49 μm), 10.2:1 (20<br />
sizes, up to 2.43 μm), <strong>and</strong> 18.7:1 (25 sizes, up to 4.47 μm). The absolute<br />
sizes are small, but th<strong>at</strong> does not m<strong>at</strong>ter, because only <strong>the</strong> rel<strong>at</strong>ive<br />
sizes affect <strong>the</strong> <strong>percol<strong>at</strong>ion</strong> threshold. The particles, which<br />
represent <strong>the</strong> hard cores, were placed into <strong>the</strong> box, <strong>the</strong>n a layer of<br />
uniform thickness was placed around each particle; th<strong>at</strong> is, <strong>the</strong><br />
depth of hydr<strong>at</strong>ion was <strong>the</strong> same on particles of all sizes. For <strong>the</strong>se<br />
simul<strong>at</strong>ions, a low density of particle cores was used, so <strong>the</strong> Metropolis<br />
algorithm was not applied; th<strong>at</strong> is, <strong>the</strong> distribution achieved by<br />
r<strong>and</strong>om sequential addition of particles is st<strong>at</strong>istically equivalent to<br />
<strong>the</strong> equilibrium distribution when <strong>the</strong> packing density is low. The<br />
layer thickness was increased until <strong>percol<strong>at</strong>ion</strong> occurred, with <strong>the</strong> results<br />
shown in Fig. 10; <strong>the</strong> calcul<strong>at</strong>ed <strong>point</strong>s are averages from <strong>at</strong> least<br />
100, <strong>and</strong> usually ~1000 initial configur<strong>at</strong>ions. A short extrapol<strong>at</strong>ion of<br />
<strong>the</strong> simul<strong>at</strong>ed values is necessary to overlap with <strong>the</strong> w/c range of <strong>the</strong><br />
d<strong>at</strong>a, but <strong>the</strong> values fall on very straight lines, so this is not expected<br />
to introduce a significant error. Again, <strong>the</strong> predictions are higher than<br />
<strong>the</strong> measured values, <strong>and</strong> <strong>the</strong> error increases with w/c; moreover, <strong>the</strong><br />
discrepancy increases with <strong>the</strong> breadth of <strong>the</strong> particle size distribution<br />
in <strong>the</strong> simul<strong>at</strong>ion. This is probably a reflection of <strong>the</strong> fact th<strong>at</strong> <strong>the</strong><br />
smallest particles can hydr<strong>at</strong>e completely without coming into contact<br />
with <strong>the</strong>ir neighbors, so <strong>the</strong>y contribute to <strong>the</strong> DOH, but not to<br />
<strong>the</strong> form<strong>at</strong>ion of a network. We conclude th<strong>at</strong> <strong>the</strong> failure of <strong>the</strong><br />
model to capture <strong>the</strong> measured behavior is not rel<strong>at</strong>ed to <strong>the</strong> assumed<br />
particle size distribution.<br />
The most likely cause of <strong>the</strong> discrepancy is <strong>the</strong> high degree of dispersion<br />
produced <strong>at</strong> <strong>the</strong> start of <strong>the</strong> simul<strong>at</strong>ion. This means th<strong>at</strong> a high<br />
DOH is needed to produce a reaction layer thick enough to bring <strong>the</strong><br />
Fig. 9. Measured degree of hydr<strong>at</strong>ion <strong>at</strong> <strong>the</strong> initial <strong>setting</strong> <strong>point</strong> found from <strong>the</strong> Vic<strong>at</strong><br />
needle test (Initial Set) <strong>and</strong> calcul<strong>at</strong>ed degree of hydr<strong>at</strong>ion <strong>at</strong> <strong>the</strong> <strong>percol<strong>at</strong>ion</strong> threshold<br />
for equal-sized spheres (HCSS Monodisperse).<br />
D<strong>at</strong>a from ref. [9].<br />
669
particles into contact. In contrast, real cement pastes contain large<br />
clusters of particles th<strong>at</strong> are initially touching [46,47], so <strong>the</strong>y can be<br />
bonded by <strong>the</strong> form<strong>at</strong>ion of a small amount of hydr<strong>at</strong>ion product.<br />
This idea has been tested in a study in which <strong>the</strong> initial extent of agglomer<strong>at</strong>ion<br />
of <strong>the</strong> particles was system<strong>at</strong>ically varied [49]; as<br />
expected, realistic predictions of DOH can be obtained with reasonable<br />
degrees of agglomer<strong>at</strong>ion. Several o<strong>the</strong>r simul<strong>at</strong>ion studies<br />
have predicted r<strong>at</strong>her low DOH <strong>at</strong> <strong>the</strong> <strong>percol<strong>at</strong>ion</strong> threshold (e.g.,<br />
[2,27]), but <strong>the</strong>y did not optimize <strong>the</strong> particle spacing <strong>at</strong> <strong>the</strong> start of<br />
<strong>the</strong> process. Evidently, <strong>the</strong> methods used for r<strong>and</strong>om placement of<br />
particles into <strong>the</strong> box in those studies resulted in many of <strong>the</strong> particles<br />
being in very close proximity. Unfortun<strong>at</strong>ely, it is difficult to<br />
quantify <strong>the</strong> initial st<strong>at</strong>e of agglomer<strong>at</strong>ion of a paste, <strong>and</strong> without<br />
th<strong>at</strong> inform<strong>at</strong>ion one cannot predict <strong>the</strong> DOH <strong>at</strong> <strong>the</strong> <strong>percol<strong>at</strong>ion</strong><br />
threshold.<br />
The critical exponent for <strong>the</strong> elastic modulus of a percol<strong>at</strong>ing HCSS<br />
system is expected to be much higher than wh<strong>at</strong> we observe [11,13].<br />
The physical origin of <strong>the</strong> high exponent is <strong>the</strong> very broad range of<br />
stiffness of <strong>the</strong> linkages cre<strong>at</strong>ed by overlapping particles: deep interpenetr<strong>at</strong>ion<br />
of particles cre<strong>at</strong>es very stiff links, while tangency cre<strong>at</strong>es<br />
flexible ones. The thinner <strong>the</strong> soft shell, <strong>the</strong> smaller <strong>the</strong> range of vari<strong>at</strong>ion<br />
in stiffness will be, since overlapping is limited to <strong>the</strong> depth of<br />
<strong>the</strong> shell. Moreover, <strong>the</strong> aggreg<strong>at</strong>ion of particles th<strong>at</strong> occurs in a paste<br />
enhances <strong>the</strong> number of strong links, since <strong>the</strong> hydr<strong>at</strong>ion products are<br />
depositing on particles already in contact, <strong>and</strong> th<strong>at</strong> must alter <strong>the</strong> distribution<br />
of stiffnesses anticip<strong>at</strong>ed by <strong>the</strong> <strong>the</strong>ory. These factors contribute<br />
to a reduction in <strong>the</strong> critical exponent from <strong>the</strong> high value<br />
(γ ≈4.1–4.5) predicted for freely overlapping spheres. Since <strong>the</strong> initial<br />
<strong>setting</strong> of cement occurs <strong>at</strong> a low DOH (~4% for w/c=0.35 [9]),<br />
<strong>the</strong> shell of hydr<strong>at</strong>ion products is very thin <strong>at</strong> <strong>the</strong> <strong>setting</strong> <strong>point</strong>, so<br />
<strong>the</strong> elasticity of <strong>the</strong> cement system should approach <strong>the</strong> behavior of<br />
a hard-sphere model, <strong>and</strong> become subject to <strong>the</strong> nonlinearity mentioned<br />
earlier [21]. To our knowledge, <strong>the</strong> critical exponent for such<br />
a system has not been established <strong>the</strong>oretically.<br />
5. Conclusions<br />
When measurements of <strong>the</strong> acoustic velocity in hydr<strong>at</strong>ing cement<br />
paste are analyzed in terms of <strong>percol<strong>at</strong>ion</strong> <strong>the</strong>ory, <strong>the</strong> expected power<br />
law behavior is observed for <strong>the</strong> elastic modulus, but <strong>the</strong> observed exponent<br />
is difficult to r<strong>at</strong>ionalize. If <strong>the</strong> degree of reaction is assumed<br />
to be linearly proportional to time, <strong>the</strong> fit is good over a narrow window<br />
in time (~4 to 9 h), <strong>and</strong> it yields a critical exponent of ~2.0. However,<br />
if <strong>the</strong> degree of reaction is represented by <strong>the</strong> chemical<br />
shrinkage, <strong>the</strong>n <strong>the</strong> power-law applies over a much broader range<br />
Author's personal copy<br />
670 G.W. Scherer et al. / Cement <strong>and</strong> Concrete Research 42 (2012) 665–672<br />
Fig. 10. Measured degree of hydr<strong>at</strong>ion <strong>at</strong> <strong>the</strong> initial <strong>setting</strong> <strong>point</strong> found from <strong>the</strong> Vic<strong>at</strong><br />
needle test (Initial set) <strong>and</strong> calcul<strong>at</strong>ed degree of hydr<strong>at</strong>ion <strong>at</strong> <strong>the</strong> <strong>percol<strong>at</strong>ion</strong> threshold<br />
for <strong>the</strong> HCSS model with polydisperse spheres with <strong>the</strong> indic<strong>at</strong>ed range of sizes.<br />
D<strong>at</strong>a from ref. [9].<br />
of time (up to ~20 h), <strong>and</strong> <strong>the</strong> exponent is ~1.6. The l<strong>at</strong>ter is lower<br />
than <strong>the</strong> value predicted for systems exhibiting scalar elasticity, so fitting<br />
over <strong>the</strong> smaller time interval is more appropri<strong>at</strong>e. A critical exponent<br />
of 2 is consistent with scalar elasticity, <strong>and</strong> is similar to<br />
values reported for gel<strong>at</strong>ion of polymers, but is much lower than<br />
<strong>the</strong> prediction for overlapping spheres. We conclude th<strong>at</strong> <strong>setting</strong> is a<br />
<strong>percol<strong>at</strong>ion</strong> process, although <strong>the</strong> details of <strong>the</strong> process (viz., <strong>the</strong> evolution<br />
of <strong>the</strong> elastic properties) are not correctly captured by existing<br />
hard-core/soft-shell <strong>percol<strong>at</strong>ion</strong> models. The <strong>percol<strong>at</strong>ion</strong> threshold is<br />
reached well before <strong>the</strong> initial <strong>setting</strong> <strong>point</strong> defined by <strong>the</strong> Vic<strong>at</strong> needle<br />
test.<br />
It would be convenient to have an analytical model to predict <strong>the</strong><br />
degree of hydr<strong>at</strong>ion <strong>at</strong> <strong>the</strong> <strong>setting</strong> <strong>point</strong> on <strong>the</strong> basis of <strong>the</strong> w<strong>at</strong>er/<br />
cement r<strong>at</strong>io <strong>and</strong> particle size distribution, so we tested <strong>the</strong> hardcore/soft-shell<br />
model. The model predictions were much higher<br />
than <strong>the</strong> measured DOH values, evidently because <strong>the</strong> simul<strong>at</strong>ions assume<br />
perfect dispersion of <strong>the</strong> particles, whereas actual pastes contain<br />
clusters of particles whose proximity allows <strong>the</strong>m to become<br />
bonded by very thin reaction layers. Unfortun<strong>at</strong>ely, this means th<strong>at</strong><br />
<strong>the</strong> initial st<strong>at</strong>e of agglomer<strong>at</strong>ion must be known in order to predict<br />
<strong>the</strong> DOH <strong>at</strong> <strong>the</strong> <strong>percol<strong>at</strong>ion</strong> threshold.<br />
Acknowledgments<br />
The authors are indebted to Dale Bentz (NIST) for helpful discussions.<br />
S.T. was supported by <strong>the</strong> U.S. Department of Energy, Office of<br />
Basic Energy Sciences, Division of M<strong>at</strong>erials Sciences <strong>and</strong> Engineering<br />
under Award DE-FG02-04-ER46108.<br />
Appendix 1. Sound velocity in a suspension<br />
Harker <strong>and</strong> Temple [33] derived <strong>the</strong> following expression (<strong>the</strong>ir<br />
equ<strong>at</strong>ion 2.25) to describe <strong>the</strong> propag<strong>at</strong>ion of a longitudinal sound<br />
wave in a suspension:<br />
β 2<br />
ω 2 ¼ ρ F<br />
K M<br />
ρSð1−ϕþϕSÞþρFSð1−ϕÞ ρSð1−ϕÞ2þρFðSþϕð1−ϕÞÞ ð13Þ<br />
where β is <strong>the</strong> wave vector, ω is <strong>the</strong> radial frequency, K M is defined in<br />
Eq. (5), <strong>and</strong> S is a complex quantity given by<br />
S ¼ 1<br />
2<br />
1 þ 2ϕ<br />
1−ϕ<br />
þ 9<br />
4<br />
δ<br />
a<br />
þ i 9<br />
4<br />
δ δ2<br />
þ<br />
a a2 !<br />
ð14Þ<br />
where a is <strong>the</strong> radius of <strong>the</strong> suspended particle <strong>and</strong> δ is <strong>the</strong> “skin<br />
depth” defined by<br />
sffiffiffiffiffiffiffiffiffi<br />
2ηF δ ¼<br />
ωρ F<br />
ð14Þ<br />
<strong>and</strong> ηF is <strong>the</strong> viscosity of <strong>the</strong> fluid. The velocity of <strong>the</strong> longitudinal<br />
wave, V, is rel<strong>at</strong>ed to <strong>the</strong> real part of <strong>the</strong> wave vector,<br />
V ¼ Re ω<br />
β<br />
<strong>and</strong> <strong>the</strong> <strong>at</strong>tenu<strong>at</strong>ion of <strong>the</strong> wave, α, is equal to its imaginary part:<br />
ð14Þ<br />
α ¼ ImðβÞ ð15Þ<br />
The values in Fig. 1–Fig. 3 were calcul<strong>at</strong>ed using <strong>the</strong> following<br />
values: ω =2π×10 5 Hz; (for w<strong>at</strong>er) ηF=0.001 Pa·s, ρF=1000 kg/<br />
m 3 , K F=2.2 GPa; (for clinker) ρ S=3100 kg/m 3 , K S=117 GPa [50],<br />
a=10 μm; (for air) ρS=1.2 kg/m 3 , KS=10 5 Pa, a=1 μm.
Appendix 2. HCSS model<br />
The parameters of <strong>the</strong> HCSS model described in Ref. [11] (hereafter,<br />
RHM) can be rel<strong>at</strong>ed to <strong>the</strong> properties of a partially hydr<strong>at</strong>ed cement<br />
particle as follows. If <strong>the</strong> initial diameter of <strong>the</strong> clinker particle<br />
is D 0 <strong>and</strong> <strong>the</strong> diameter of <strong>the</strong> unhydr<strong>at</strong>ed core is D C, <strong>the</strong>n <strong>the</strong> degree<br />
of hydr<strong>at</strong>ion is<br />
h ¼ 1− D C<br />
D 0<br />
3<br />
Author's personal copy<br />
ð16Þ<br />
If <strong>the</strong> densities of <strong>the</strong> clinker <strong>and</strong> <strong>the</strong> hydr<strong>at</strong>ion products are ρC<br />
<strong>and</strong> ρ H, respectively, <strong>the</strong>n <strong>the</strong> volumetric expansion, e, upon hydr<strong>at</strong>ion<br />
is e=ρC/ρH; given ρC≈3150 kg/m 3 <strong>and</strong> ρH≈2000 kg/m 3 ,we<br />
have e≈1.58. The volume of <strong>the</strong> partially hydr<strong>at</strong>ed particle, with diameter<br />
DP, is<br />
vP ¼ π<br />
6 D3<br />
π<br />
P ¼<br />
6 D3C<br />
þ e D30−D3<br />
h i<br />
C ¼ π<br />
6 D30<br />
ð1−hþheÞ ð17Þ<br />
The RHM parameter ρ is <strong>the</strong> number density of particle cores <strong>and</strong><br />
N=ρ L 3 is <strong>the</strong> number of particles in <strong>the</strong> system. The initial volume<br />
fraction of clinker particles is<br />
Nðπ=6ÞD30 ϕ0 ¼<br />
L 3 0<br />
¼ π<br />
6 D30ρ<br />
0 ¼<br />
1<br />
1 þ RwcρC=ρW ð17Þ<br />
The final equality in Eq. (17) rel<strong>at</strong>es <strong>the</strong> volume fraction to <strong>the</strong><br />
w<strong>at</strong>er/cement r<strong>at</strong>io, Rwc; ρW is <strong>the</strong> density of w<strong>at</strong>er (=1000 kg/m 3 ).<br />
The subscripts on L 0 <strong>and</strong> ρ 0 are needed, because <strong>the</strong> volume of <strong>the</strong><br />
system contracts during hydr<strong>at</strong>ion, owing to chemical shrinkage.<br />
The change in volume of <strong>the</strong> system per particle is<br />
ΔV H ¼ ερ C<br />
π<br />
6 D3<br />
0 ¼ shρ C<br />
π<br />
6 D30<br />
ð17Þ<br />
where ε is <strong>the</strong> chemical shrinkage (in mL/g of clinker) <strong>and</strong> s (b0) is<br />
<strong>the</strong> r<strong>at</strong>io of ε to <strong>the</strong> degree of hydr<strong>at</strong>ion, h (i.e., <strong>the</strong> neg<strong>at</strong>ive of <strong>the</strong><br />
slope of Fig. 5). The volume of <strong>the</strong> box <strong>at</strong> any stage of hydr<strong>at</strong>ion is<br />
L 3 ¼ N π<br />
6 D30<br />
ð1þshρCÞ ð18Þ<br />
so<br />
ρ 0<br />
ρ ¼<br />
1 þ shρC ð19Þ<br />
From Fig. 5, s=−0.0764 mL/g, so when hydr<strong>at</strong>ion is complete<br />
(h=1), Eq. (19) indic<strong>at</strong>es th<strong>at</strong> ρ/ρ ≈1.317.<br />
The RHM parameter η represents <strong>the</strong> extended volume fraction of<br />
solid phase (cores plus hydr<strong>at</strong>ed layer, ignoring overlap of <strong>the</strong> shells):<br />
η ¼ ρv P ¼ ϕ 0<br />
1−h þ he<br />
1 þ shρ C<br />
1−h þ he<br />
¼<br />
ð1þRwcρC=ρW Þð1þshρCÞ ð20Þ<br />
The RHM parameter λ is <strong>the</strong> r<strong>at</strong>io of <strong>the</strong> diameter of <strong>the</strong> hard core,<br />
D C, to th<strong>at</strong> of <strong>the</strong> whole particle, D P:<br />
λ ¼ DC ¼<br />
DP 1−h<br />
1−h þ he<br />
ð20Þ<br />
According to eq. (5.119) on p. 155 of RHM, <strong>the</strong> volume fraction of<br />
solid phase (cores plus hydr<strong>at</strong>e, taking account of overlap) is<br />
2<br />
ϕ ¼ 1− 1−ηλ 3 exp4− 1−λ 3 3<br />
η<br />
5Aðη; λÞ<br />
ð21Þ<br />
1−ηλ 3 3<br />
G.W. Scherer et al. / Cement <strong>and</strong> Concrete Research 42 (2012) 665–672<br />
where<br />
Aðη; λÞ<br />
¼ exp − η2λ 3 ðλ−1Þ 3 3<br />
21−ηλ<br />
7λ 2 þ 7λ−2 −2ηλ 3 7λ 2 −5λ þ 1 þ η 2 λ 6 5λ 2 2<br />
6<br />
4<br />
−7λ þ 2<br />
ð22Þ<br />
The value of <strong>the</strong> volume fraction <strong>at</strong> which <strong>percol<strong>at</strong>ion</strong> of <strong>the</strong> soft<br />
shells occurs, ϕC, is shown in Fig. 8. The curve is an empirical fit to<br />
<strong>the</strong> <strong>point</strong>s, which is given by<br />
ϕ C≈0:29 þ 0:35λ7<br />
2−λ 7<br />
ð22Þ<br />
The degree of hydr<strong>at</strong>ion <strong>at</strong> <strong>the</strong> <strong>percol<strong>at</strong>ion</strong> threshold, h C, is<br />
found by <strong>setting</strong> Eq. (21) equal to Eq. (22), <strong>and</strong> solving numerically<br />
for h for given values of R wc, s, <strong>and</strong> e. This was done using<br />
M<strong>at</strong>hem<strong>at</strong>ica® [51].<br />
References<br />
[1] D.P. Bentz, E.J. Garboczi, Percol<strong>at</strong>ion of phases in a three-dimensional cement<br />
paste microstructural model, Cement Concr. Res. 21 (1991) 325–344.<br />
[2] D.P. Bentz, P.V. Coveney, E.J. Garboczi, M.F. Kleyn, P.E. Stutzman, Cellular autom<strong>at</strong>on<br />
simul<strong>at</strong>ions of cement hydr<strong>at</strong>ion <strong>and</strong> microstructure development, Modelling<br />
Simul M<strong>at</strong>er. Sd. Eng. 2 (1994) 783–808.<br />
[3] E.J. Garboczi, D.P. Bentz, The effect of st<strong>at</strong>istical fluctu<strong>at</strong>ion, finite size error, <strong>and</strong><br />
digital resolution on <strong>the</strong> phase <strong>percol<strong>at</strong>ion</strong> <strong>and</strong> transport properties of <strong>the</strong> NIST<br />
cement hydr<strong>at</strong>ion model, Cement Concr. Res. 31 (2001) 1501–1514.<br />
[4] G. Ye, K. van Breugel, A.L.A. Fraaij, Three-dimensional microstructure analysis of<br />
numerically simul<strong>at</strong>ed cementitious m<strong>at</strong>erials, Cement Concr. Res. 33 (2003)<br />
215–222.<br />
[5] A. Princigallo, P. Lura, K. van Breugel, G. Levita, Early development of properties in<br />
a cement paste: a numerical <strong>and</strong> experimental study, Cement Concr. Res. 33<br />
(2003) 1013–1020.<br />
[6] J.W. Bullard, M. D'Ambrosia, Z. Grasley, W. Hansen, N. Kidner, D. Lange, P. Lura,<br />
T.O. Mason, J. Moon, F. Rajabipour, G. Sant, S. Shah, Z. Sun, T. Voigt, S. Wansom,<br />
J. Weiss, L. Woo, in: J. March<strong>and</strong>, B. Bissonnette, R. Gagne, M. Jolin, F. Paradis<br />
(Eds.), 2nd Int. RILEM Symp. Advances in Concrete through Science <strong>and</strong> Engineering,<br />
September 2006, p. 307, Quebec, Canada.<br />
[7] D.P. Bentz, A review of early-age properties of cement-based m<strong>at</strong>erials, Cement<br />
Concr. Res. 38 (2008) 196–204.<br />
[8] Z. Sun, G. Ye, S.P. Shah, Microstructure <strong>and</strong> early-age properties of Portl<strong>and</strong> cement<br />
paste—effects of connectivity of solid phases, ACI M<strong>at</strong>er. J. (2005)<br />
122–129 ([March-April] Title no. 102-M15).<br />
[9] J. Zhang, E.A. Weissinger, S. Peethamparan, G.W. Scherer, Early hydr<strong>at</strong>ion <strong>and</strong> <strong>setting</strong><br />
of oil well cement, Cement Concr. Res. 40 (2010) 1023–1033.<br />
[10] S.B. Lee, S. Torqu<strong>at</strong>o, Pair connectedness <strong>and</strong> mean cluster size for continuum<strong>percol<strong>at</strong>ion</strong><br />
models: computer-simul<strong>at</strong>ion results, J. Chem. Phys. 89 (10) (1988)<br />
6427–6433.<br />
[11] S. Torqu<strong>at</strong>o, R<strong>and</strong>om Heterogeneous Media, Springer, New York, 2002.<br />
[12] R. Zallen, The Physics of Amorphous Solids, Wiley, New York, 1983 (Ch. 4).<br />
[13] S. Feng, B.I. Halperin, P.N. Sen, Transport properties of continuum systems near<br />
<strong>the</strong> <strong>percol<strong>at</strong>ion</strong> threshold, Phys. Rev. B 35 (1) (1987) 197–214.<br />
[14] S. Feng, P.N. Sen, Percol<strong>at</strong>ion on elastic networks: new exponent <strong>and</strong> threshold,<br />
Phys. Rev. Lett. 52 (3) (1984) 216–219.<br />
[15] P.G. de Gennes, On a rel<strong>at</strong>ion between <strong>percol<strong>at</strong>ion</strong> <strong>the</strong>ory <strong>and</strong> <strong>the</strong> elasticity of<br />
gels, J. Phys. (Letters) 37 (1976) L1–L2 [Jan.].<br />
[16] C.J. Brinker, G.W. Scherer, Sol–Gel Science, Academic Press, New York, 1990 (Ch.<br />
5).<br />
[17] T. Fujii, T. Yano, H. Kumagai, O. Miyawaki, Scaling analysis on elasticity of agarose<br />
gel near <strong>the</strong> sol–gel transition temper<strong>at</strong>ure, Food Hydrocolloids 14 (2000)<br />
359–363.<br />
[18] A. Boumiz, C. Vernet, F. Cohen Tenoudji, Mechanical properties of cement pastes<br />
<strong>and</strong> mortars <strong>at</strong> early ages, Adv. Cement-Based M<strong>at</strong>er. 3 (1996) 94–106.<br />
[19] R.K. Bordia, G.W. Scherer, On constrained sintering: II. Comparison of constitutive<br />
models, Acta Metall. 36 (9) (1988) 2399–2409.<br />
[20] L.J. Gibson, M.F. Ashby, Cellular Solids, Structure & Properties, Pergamon Press,<br />
New York, 1988.<br />
[21] S. Torqu<strong>at</strong>o, A. Donev, F.H. Stillinger, Breakdown of elasticity <strong>the</strong>ory for jammed<br />
hard-particle packings: conical nonlinear constitutive <strong>the</strong>ory, Int. J. Solids Struct.<br />
40 (2003) 7143–7153.<br />
[22] J. Ke<strong>at</strong>ing, D.J. Hannant, A.P. Hibbert, Comparison of shear modulus <strong>and</strong> pulse velocity<br />
techniques to measure <strong>the</strong> build-up of structure in fresh cement pastes<br />
used in oil well cementing, Cement Concr. Res. 19 (1989) 554–566.<br />
[23] J. Ke<strong>at</strong>ing, D.J. Hannant, A.P. Hibbert, Correl<strong>at</strong>ion between cube strength, ultrasonic<br />
pulse velocity <strong>and</strong> volume change for oil well cement slurries, Cement<br />
Concr. Res. 19 (1989) 715–726.<br />
671<br />
3<br />
7<br />
5
[24] R. D'Angelo, T.J. Plona, L.M. Schwartz, P. Coveney, Ultrasonic measurements on<br />
hydr<strong>at</strong>ing cement slurries onset of shear wave propag<strong>at</strong>ion, Advn. Cem. Based<br />
M<strong>at</strong>er. 2 (1995) 8–14.<br />
[25] A. Feylessoufi, F. Cohen Tenoudji, V. Morin, P. Richard, Early ages shrinkage mechanisms<br />
of ultra-high-performance cement-based m<strong>at</strong>erials, Cem. Concr. Res. 31<br />
(2001) 1573–1579.<br />
[26] G. Ye, K. van Breugel, A.L.A. Fraaij, Experimental study <strong>and</strong> numerical simul<strong>at</strong>ion<br />
on <strong>the</strong> form<strong>at</strong>ion of microstructure in cementitious m<strong>at</strong>erials <strong>at</strong> early age, Cem.<br />
Concr. Res. 33 (2003) 233–239.<br />
[27] G. Ye, P. Lura, K. van Breugel, A.L.A. Fraaij, Study on <strong>the</strong> development of <strong>the</strong> microstructure<br />
in cement-based m<strong>at</strong>erials by means of numerical simul<strong>at</strong>ion <strong>and</strong> ultrasonic<br />
pulse velocity measurement, Cem. Concr. Compos. 26 (2004) 491–497.<br />
[28] N. De Belie, C.U. Grosse, J. Kurz, H.-W. Reinhardt, Ultrasound monitoring of <strong>the</strong> influence<br />
of different acceler<strong>at</strong>ing admixtures <strong>and</strong> cement types for shotcrete on<br />
<strong>setting</strong> <strong>and</strong> hardening behaviour, Cem. Concr. Res. 35 (2005) 2087–2094.<br />
[29] G. Trtnik, G. Turk, F. Kavčič, V.B. Bosiljkov, Possibilities of using <strong>the</strong> ultrasonic<br />
wave transmission method to estim<strong>at</strong>e initial <strong>setting</strong> time of cement paste, Cement<br />
Concr. Res. 38 (11) (2008) 1336–1342.<br />
[30] G. Sant, M. Dehadrai, D. Bentz, P. Lura, C.F. Ferraris, J.W. Bullard, J. Weiss, Detecting<br />
<strong>the</strong> fluid-to-solid transition in cement pastes, Concrete intern<strong>at</strong>ional, June<br />
2009, pp. 53–58, (+21 pages of supplementary inform<strong>at</strong>ion).<br />
[31] G. Ye, Z. Sun, T. Voigt, K. van Breugel, S.P. Shah, A micromechanic model for characteriz<strong>at</strong>ion<br />
of cement paste <strong>at</strong> early age valid<strong>at</strong>ed with experiments, Proc. RILEM<br />
Int. Symp. Advances in Concrete through Science <strong>and</strong> Engineering, Evanston, Ill,<br />
2004, (CD-ROM) 11 pp.<br />
[32] S.B. Lee, S. Torqu<strong>at</strong>o, Monte Carlo study of correl<strong>at</strong>ed continuum <strong>percol<strong>at</strong>ion</strong>: universality<br />
<strong>and</strong> <strong>percol<strong>at</strong>ion</strong> thresholds, Physical Review A 41 (10) (1990)<br />
5338–5344.<br />
[33] A.H. Harker, J.A.G. Temple, Velocity <strong>and</strong> <strong>at</strong>tenu<strong>at</strong>ion of ultrasound in suspensions<br />
of particles in fluids, J. Phys. D: Appl. Phys. 21 (1988) 1576–1588.<br />
[34] M.A. Biot, Theory of propag<strong>at</strong>ion of elastic waves in a fluid-s<strong>at</strong>ur<strong>at</strong>ed porous solid.<br />
I. Low-frequency range, J. Acoustical Soc. of Am. 28 (2) (1956) 168–178.<br />
[35] M.A. Biot, Theory of propag<strong>at</strong>ion of elastic waves in a fluid-s<strong>at</strong>ur<strong>at</strong>ed porous solid.<br />
II. Higher frequency range, J. Acoustical Soc. of Am. 28 (2) (1956) 179–191.<br />
[36] C.M. Sayers, R.L. Grenfell, Ultrasonic propag<strong>at</strong>ion through hydr<strong>at</strong>ing cements, Ultrasonics<br />
31 (3) (1993) 147–153.<br />
Author's personal copy<br />
672 G.W. Scherer et al. / Cement <strong>and</strong> Concrete Research 42 (2012) 665–672<br />
[37] O. Coussy, Poromechanics, Wiley, West Sussex, Engl<strong>and</strong>, 2004.<br />
[38] J.F. Nye, Physical Properties of Crystals: Their Represent<strong>at</strong>ion by Tensors <strong>and</strong> M<strong>at</strong>rices,<br />
Clarendon Press, Oxford, 1985.<br />
[39] L. Ye, J. Liu, P. Sheng, J.S. Huang, D.A. Weitz, Sound propag<strong>at</strong>ion in colloidal systems,<br />
J. de Physique IV, Colloque C1, supplement au J. Physique II 3 (1993)<br />
183–196 [Mai].<br />
[40] G. Sant, C.F. Ferraris, J. Weiss, Rheological properties of cement pastes: a discussion<br />
of structure form<strong>at</strong>ion <strong>and</strong> mechanical property development, Cem. Concr.<br />
Res. 38 (2008) 1286–1296.<br />
[41] D. Lootens, P. Jousset, L. Martinie, N. Roussel, R.J. Fl<strong>at</strong>t, Yield stress during <strong>setting</strong><br />
of cement pastes from penetr<strong>at</strong>ion tests, Cem. Concr. Res. 39 (5) (2009) 401–408.<br />
[42] G.W. Scherer, G.P. Funkhouser, S. Peethamparan, Effect of pressure on early hydr<strong>at</strong>ion<br />
of class H <strong>and</strong> white cement, Cement Concr. Res. 40 (2010) 845–850.<br />
[43] M.D. Rintoul, S. Torqu<strong>at</strong>o, Metastability <strong>and</strong> crystalliz<strong>at</strong>ion in hard-sphere systems,<br />
Phys. Rev. Lett. 77 (1996) 4198–4201.<br />
[44] M. Hermes, E.C.M. Vermolen, M.E. Leunissen, D.L.J. Vossen, P.D.J. van Oostrum, M.<br />
Dijkstra, A. van Blaaderen, Nucle<strong>at</strong>ion of colloidal crystals on configurable seed<br />
structures, Soft M<strong>at</strong>ter 7 (2011) 4623–4628.<br />
[45] N. Roussel, A. Lemaître, R.J. Fl<strong>at</strong>t, P. Coussot, Steady st<strong>at</strong>e flow of cement suspensions:<br />
a micromechanical st<strong>at</strong>e of <strong>the</strong> art, Cem. Concr. Res. 40 (2010) 77–84.<br />
[46] A. Chougnet, T. Palermo, A. Audibert, M. Moan, Rheological behaviour of cement<br />
<strong>and</strong> silica suspensions: particle aggreg<strong>at</strong>ion modelling, Cem. Concr. Res. 38<br />
(2008) 1297–1301.<br />
[47] E. Sakai, T. Kasuga, T. Sugiyama, K. Asaga, M. Daimon, Influence of superplasticizers<br />
on <strong>the</strong> hydr<strong>at</strong>ion of cement <strong>and</strong> <strong>the</strong> pore structure of hardened cement,<br />
Cem. Concr. Res. 36 (2006) 2049–2053.<br />
[48] S. Peethamparan, E. Weissinger, J. Voc<strong>at</strong>uro, J. Zhang, G.W. Scherer, Monitoring<br />
chemical shrinkage using pressure sensors, ACI Special Proceedings in CD on Advances<br />
in <strong>the</strong> M<strong>at</strong>erial Science of Concrete, SP-270, 2010, pp. 77–88.<br />
[49] J. Zheng, J. Zhang, G.W. Scherer, Prediction of <strong>the</strong> degree of hydr<strong>at</strong>ion <strong>at</strong> initial<br />
<strong>setting</strong> time of cement paste with particle agglomer<strong>at</strong>ion, Cem. Concr. Res. (submitted<br />
for public<strong>at</strong>ion).<br />
[50] G. Constantinides, F.-J. Ulm, The effect of two types of C-S-H on <strong>the</strong> elasticity of<br />
cement-based m<strong>at</strong>erials: results from nanoindent<strong>at</strong>ion <strong>and</strong> micromechanical<br />
modeling, Cem. Concr. Res. 34 (2004) 67–80.<br />
[51] Inc Wolfram Research, M<strong>at</strong>hem<strong>at</strong>ica, Version 8.0, , 2010 (Champaign, IL).