li_wen~1.pdf
li_wen~1.pdf
li_wen~1.pdf

Create successful ePaper yourself
Turn your PDF publications into a flip-book with our unique Google optimized e-Paper software.
Ž .<br />
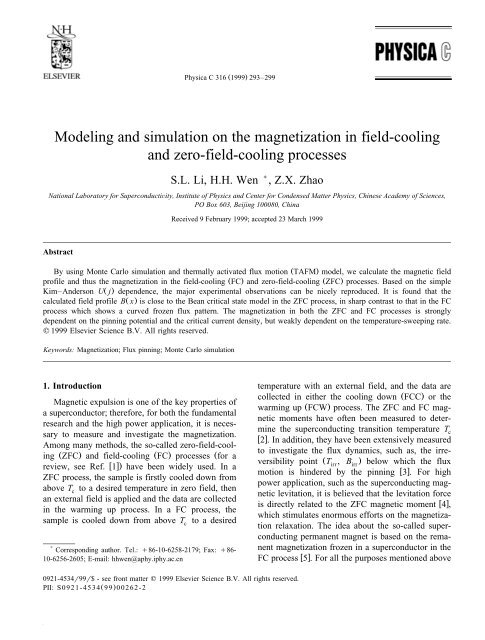
Physica C 316 1999 293–299<br />
Mode<strong>li</strong>ng and simulation on the magnetization in field-coo<strong>li</strong>ng<br />
and zero-field-coo<strong>li</strong>ng processes<br />
S.L. Li, H.H. Wen ) , Z.X. Zhao<br />
National Laboratory for SuperconductiÕity, Institute of Physics and Center for Condensed Matter Physics, Chinese Academy of Sciences,<br />
PO Box 603, Beijing 100080, China<br />
Abstract<br />
Received 9 February 1999; accepted 23 March 1999<br />
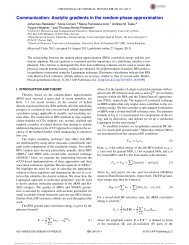
By using Monte Carlo simulation and thermally activated flux motion Ž TAFM. model, we calculate the magnetic field<br />
profile and thus the magnetization in the field-coo<strong>li</strong>ng Ž FC. and zero-field-coo<strong>li</strong>ng Ž ZFC. processes. Based on the simple<br />
Kim–Anderson UŽ j. dependence, the major experimental observations can be nicely reproduced. It is found that the<br />
calculated field profile BŽ x. is close to the Bean critical state model in the ZFC process, in sharp contrast to that in the FC<br />
process which shows a curved frozen flux pattern. The magnetization in both the ZFC and FC processes is strongly<br />
dependent on the pinning potential and the critical current density, but weakly dependent on the temperature-sweeping rate.<br />
q 1999 Elsevier Science B.V. All rights reserved.<br />
Keywords: Magnetization; Flux pinning; Monte Carlo simulation<br />
1. Introduction<br />
Magnetic expulsion is one of the key properties of<br />
a superconductor; therefore, for both the fundamental<br />
research and the high power app<strong>li</strong>cation, it is necessary<br />
to measure and investigate the magnetization.<br />
Among many methods, the so-called zero-field-coo<strong>li</strong>ng<br />
Ž ZFC. and field-coo<strong>li</strong>ng Ž FC. processes Žfor<br />
a<br />
review, see Ref. wx. 1 have been widely used. In a<br />
ZFC process, the sample is firstly cooled down from<br />
above Tc to a desired temperature in zero field, then<br />
an external field is app<strong>li</strong>ed and the data are collected<br />
in the warming up process. In a FC process, the<br />
sample is cooled down from above Tc to a desired<br />
) Corresponding author. Tel.: q86-10-6258-2179; Fax: q86-<br />
10-6256-2605; E-mail: hhwen@aphy.iphy.ac.cn<br />
0921-4534r99r$ - see front matter q 1999 Elsevier Science B.V. All rights reserved.<br />
Ž .<br />
PII: S0921-4534 99 00262-2<br />
temperature with an external field, and the data are<br />
collected in either the coo<strong>li</strong>ng down Ž FCC. or the<br />
warming up Ž FCW. process. The ZFC and FC magnetic<br />
moments have often been measured to determine<br />
the superconducting transition temperature Tc wx 2 . In addition, they have been extensively measured<br />
to investigate the flux dynamics, such as, the irreversibi<strong>li</strong>ty<br />
point Ž T , B .<br />
irr irr below which the flux<br />
motion is hindered by the pinning wx 3 . For high<br />
power app<strong>li</strong>cation, such as the superconducting magnetic<br />
levitation, it is be<strong>li</strong>eved that the levitation force<br />
is directly related to the ZFC magnetic moment wx 4 ,<br />
which stimulates enormous efforts on the magnetization<br />
relaxation. The idea about the so-called superconducting<br />
permanent magnet is based on the remanent<br />
magnetization frozen in a superconductor in the<br />
FC process wx 5 . For all the purposes mentioned above
294<br />
a detailed investigation and better understanding on<br />
the FC and ZFC magnetization is strongly needed.<br />
In this paper, by performing the Monte Carlo<br />
simulation, we calculate the magnetic field profile<br />
and thus the magnetization in the FC and ZFC<br />
processes based on the thermally activated flux motion<br />
Ž TAFM. model. We will illustrate the major<br />
experimental observations, such as the hysteresis<br />
loops, the temperature dependence of the magnetization<br />
and their relations with the pinning potential and<br />
critical current density.<br />
2. Mode<strong>li</strong>ng<br />
Before presenting our simulation results, we first<br />
show one typical example of the temperature dependence<br />
of the ZFC and FC magnetic moments for a<br />
more 3D-<strong>li</strong>ke sample YBa 2Cu 3O 7.<br />
As shown in Fig.<br />
1, in both the ZFC and FC processes, the MT Ž .<br />
curve keeps flat at temperatures up to about 85 K,<br />
then the curve rises up rapidly and turns flat again at<br />
T . As shown below the flatness of the ZFC MT Ž .<br />
c<br />
and the FC MT Ž . have very different physical origin.<br />
Shown in Fig. 2 are the schematic field profiles in<br />
the ZFC, FCC and FCW processes, respectively. If<br />
we apply a small field Ž H -H .<br />
0 c1 to a zero-fieldcooled<br />
sample, the Meissner shielding current will<br />
prevent the flux from entering, leading to a perfect<br />
diamagnetic state Žcorresponding<br />
to the status 1 in<br />
Fig. 2Ž.. a . As the temperature increases, the H Ž T.<br />
Ž . Ž .<br />
Fig. 1. The FC filled circles and ZFC open circles magnetic<br />
moment of an Y-123 single crystal measured in an external field<br />
of 20 Oe.<br />
( )<br />
S.L. Li et al.rPhysica C 316 1999 293–299<br />
c1<br />
drops, eventually the flux starts to penetrate into the<br />
sample as soon as H Ž T. c1 sH 0.<br />
Due to the external<br />
magnetic pressure, the flux will quickly move into<br />
the interior. The moving speed and the local field<br />
gradient d BŽ x. rd x are determined by the flux motion<br />
properties which can be simulated by using the<br />
Monte Carlo method instead of using a pre-assumed<br />
Bean critical state model Ž status 2 to 5 . . When the<br />
temperature is further increased, the pinning becomes<br />
very weak de<strong>li</strong>vering a simultaneously uniform<br />
distribution of the flux <strong>li</strong>nes within the sample<br />
Ž status 6 and 7 . . The threshold for this uniform<br />
distribution can be understood as the irreversibi<strong>li</strong>ty<br />
point T irr. Between Tirr and T c,<br />
the magnetization is<br />
reversible for all the ZFC, FCC and FCW processes.<br />
In the FCC process, the sample is cooled down<br />
with a field Žstatus 7 to 1 in Fig. 2Ž b .. . In the<br />
temperature range between Tirr and T c,<br />
the flux is<br />
very easy to move out of the sample Ž status 7 to 6 . .<br />
Once the pinning is estab<strong>li</strong>shed, the flux in the deep<br />
interior cannot escape easily. Again the moving speed<br />
and the local field gradient d BŽ x. rd x is determined<br />
by the flux dynamics which can be carried out by<br />
Monte Carlo simulation Ž status 5 to 1 . . In the low<br />
temperature region, this flux pattern will be frozen<br />
showing a flat temperature dependence of the magnetization.<br />
In the FCW process, this frozen pattern<br />
will be gradually ‘melted’ when the temperature is<br />
high enough and eventually leading to the free motion<br />
in the irreversible region. The schematic temperature<br />
dependences of the magnetization in the ZFC<br />
and FCW processes are shown in Fig. 2Ž. d with the<br />
corresponding field profiles as depicted in Fig. 2Ž. a<br />
to Ž. c .<br />
3. Simulation<br />
The sample considered here is a infinitely large<br />
slab with thickness 2a along the x-direction and<br />
<strong>li</strong>mited by infinite planes at xsya and xsa. At<br />
the surface of the sample, it is assumed that the<br />
magnetic induction B is equal to the externally<br />
app<strong>li</strong>ed field, BŽ xs"a. sm H Ž t . 0 0 . However, because<br />
of the Meissner shielding current within the<br />
penetration depth l, the induction B should sharply<br />
drop from m H to m wHyH x;<br />
therefore, for the<br />
0 0 0 0 c1
( )<br />
S.L. Li et al.rPhysica C 316 1999 293–299 295<br />
Ž. Ž. Ž. Ž.<br />
Fig. 2. The schematic field profiles in a ZFC, b FCC and c FCW processes; d is the schematic temperature dependence of the<br />
magnetization in the ZFC and FCW processes.<br />
convenience of our simulation and considering that<br />
l
296<br />
Fig. 3. The magnetic hysteresis loop obtained from our calculation.<br />
The values of parameters are chosen as follows: U Ž. 0 0 rkBT Ž. 11 2 y6<br />
s16.5, J 0 s10 Arm ,as0.1 mm, x s2.5=10 m.<br />
c 0<br />
tion method is the same as that used by Schnack et<br />
al. wx 6 and van der Beek et al. wx 7 . The probabi<strong>li</strong>ty of<br />
a vortex jump is given by<br />
UŽ j.<br />
Psexp y , Ž 1.<br />
k T<br />
ž / B<br />
where UŽ j. is the activation energy and taken the<br />
form of the Kim–Anderson model, UT, Ž J . s<br />
U Ž T.w1"JrJ Ž T .x<br />
0 c , where ‘q’ means the uphill<br />
jump and ‘y’ the downhill jump. The local current<br />
density J is determined by using the Maxwell’s<br />
equation, JŽ x. syŽ 1rm . 0 d Brd x. In all the calculation,<br />
we presumably use the relation U Ž T. sU Ž 0.<br />
0 0<br />
w Ž . 2 x3r2 Ž . Ž .w Ž . 2 x2 = 1y TrT , J T sJ 0 1yTrT wx<br />
c c c c 8.<br />
The magnetization M is calculated by<br />
1 a<br />
Ms H m0H0yBŽ x. d x. Ž 2.<br />
2 a ya<br />
To check our simulation method, a hysteresis loop<br />
is obtained and shown in Fig. 3. As a result, it<br />
resembles the experimental data. The parameters<br />
Ž. Ž. 11<br />
chosen here are U0 0 rkBTs16.5, Jc 0 s10<br />
Arm2 . If not specially mentioned, in the coming<br />
part of the paper we will take other parameters as<br />
y6 follows: as0.1 mm, x s2.5=10 m Ž<br />
0<br />
with 40<br />
pinning sites across the sample . , the microscopic<br />
7 attempting frequency v s10 Hz, m H Ž. 0 s0.1<br />
0 0 c1<br />
T, the external field m0H0s0.05 T.<br />
4. Results and discussion<br />
Fig. 4 shows the temperature dependence of the<br />
Ž. 5<br />
ZFC and FC susceptibi<strong>li</strong>ties with U 0 s10 K and<br />
0<br />
( )<br />
S.L. Li et al.rPhysica C 316 1999 293–299<br />
Fig. 4. The temperature dependence of ZFC and FC susceptibi<strong>li</strong>-<br />
Ž. 5 Ž. 11 2<br />
ties with U0 0 s10 K and Jc 0 s10 Arm . The open symbols<br />
denote the ZFC process and the symbols represent the FC<br />
process.<br />
Ž. 11 2<br />
c c<br />
J 0 s10 Arm ,T s90 K. As we can see, these<br />
curves look quite similar to the experimental data as<br />
shown in Fig. 1. One may argue, however, that the<br />
U Ž. 0 is too large compared to the experimental<br />
0<br />
Ž. Ž. Ž.<br />
Fig. 5. The magnetic field profiles of a ZFC b FCC and c<br />
FCW in our simulation. The parameters used here are the same as<br />
in Fig. 3.
Fig. 6. The susceptibi<strong>li</strong>ties with different U Ž. 0 of Ž. a ZFC and Ž.<br />
0<br />
b<br />
FC. The open symbol in the FC process denotes the FCW process<br />
and the so<strong>li</strong>d one represents the FCC process. A small difference<br />
has been found between FCC and FCW near the irreversibi<strong>li</strong>ty<br />
temperature, which is induced by the different field profiles near<br />
the edge in these two processes.<br />
value U Ž.Ž 0 100–1000 K.wx c<br />
9 . We give answers to<br />
this argument as follows. The real distance between<br />
two neighboring pinning sites is about 10 nm for<br />
high temperature superconductors, that is, there are<br />
more than 1000 pinning sites between our two virtual<br />
pinning sites. If the number of real pinning sites<br />
between two virtual sites is n, a vortex should pass n<br />
real sites to jump between two virtual sites; therefore,<br />
the nominal pinning energy in our formula Eq.<br />
Ž. 1 should be much higher than that for a single<br />
jump between two real pinning sites. A simple estimation<br />
can be made by assuming that the vortex<br />
jumps downhill only and the probabi<strong>li</strong>ty of the vortex<br />
jump between our virtual pinning sites is<br />
n<br />
r u Ž j.<br />
Ps exp y<br />
kT<br />
Ł ž /<br />
i s 1<br />
Ł<br />
is1 ž ž / / c<br />
nUc Ž T . J<br />
ž kT ž J / / c<br />
n UcŽ T. J<br />
s exp y 1y<br />
kT J<br />
sexp y 1y . Ž 3.<br />
( )<br />
S.L. Li et al.rPhysica C 316 1999 293–299 297<br />
Compared with Eq. Ž. 1 , the value of the nominal<br />
pinning energy U Ž. 0 0 in the present calculation is n<br />
times the real value U Ž. c 0 f100–1000 K. If taking<br />
the reverse hopping into account in the above estimation,<br />
Eq. Ž. 3 will become very comp<strong>li</strong>cated but with<br />
an unchanged conclusion that the pinning energy in<br />
our calculation should be much larger than the experimental<br />
real value U Ž. c 0 for a single real hopping.<br />
The calculated flux density profiles of ZFC, FCW<br />
and FCC corresponding to Fig. 2 are shown from<br />
Fig. 5Ž. a to Ž. c , respectively. The upper part of the<br />
field patterns, as expected, represent the reversible<br />
region in which the inner magnetic fields are uniform<br />
and change synchronously with the surface<br />
field, thus the properties of flux dynamics in this<br />
area are all the same for every processes. A striking<br />
difference between the ZFC and FC cases is the field<br />
profile in the low temperature region where, for the<br />
ZFC process, BŽ x. shows a behavior close to the<br />
Bean critical model even in the non-fully-penetrated<br />
state, while that for the FC process shows an extremely<br />
curved field pattern. From these results, we<br />
Fig. 7. The susceptibi<strong>li</strong>ties with different J Ž. 0 of Ž. a ZFC and Ž.<br />
c<br />
b<br />
FC. The open symbol in FC process denotes the FCW process and<br />
the so<strong>li</strong>d one represents the FCC process.
298<br />
know that the flatness of the MT Ž . curves measured<br />
in the ZFC and FC processes in the low-temperature<br />
region Ž as shown in Fig. 1. have very different<br />
origins: in the ZFC process, it is due to the Meissner<br />
shielding while in the FC process it is due to the<br />
freezing of the flux pattern. The profiles of FCW and<br />
FCC are very similar to each other: the vortices are<br />
confined in the sample at a low temperature, and<br />
eventually it enters the reversible region. A close<br />
inspection finds, however, a difference just before<br />
entering the reversible region: near the surface of the<br />
sample, BŽ x. in the FCC process shows a straight<br />
<strong>li</strong>ne but in the FCW process shows a V-shape.<br />
Now, the influence of changing parameters on<br />
ZFC and FC curves will be discussed. At first, the<br />
ZFC and FC susceptibi<strong>li</strong>ties with different U Ž. 0 0 are<br />
shown in Fig. 6Ž. a and Fig. 6Ž. b , respectively. In Fig.<br />
6Ž. a the curves overlap each other in the low-temperature<br />
region, while in Fig. 6Ž. b the magnitude of the<br />
plateau changes with the pinning potential dramatically.<br />
This difference is induced by the different<br />
origins of the plateau part in ZFC and FC processes.<br />
In the ZFC process, the plateau is due to the complete<br />
Meissner shielding which is certainly not dependent<br />
on the pinning potential. In the FC process,<br />
the plateau a result of the frozen flux pattern which<br />
depends strongly on the pinning strength. In the ZFC<br />
process, one can see that the MT Ž . curve shifts to<br />
higher temperature which is due to more damped<br />
motion with a stronger U Ž. 0 0 . For the same reason,<br />
the absolute values of susceptibi<strong>li</strong>ty in Fig. 6Ž. b<br />
become smaller with larger U Ž. 0 0 . A similar behavior<br />
can be observed for changing the critical current<br />
density. As shown in Fig. 7Ž. a and Ž. b , with the<br />
increase of J Ž. c 0 , the ZFC curve becomes sharper<br />
and FC curves move upward.<br />
There is another parameter that will affect the<br />
MT Ž . curves in the ZFC and FC processes, that is,<br />
the rate of increasing or decreasing the temperature.<br />
As shown in Fig. 8Ž. a and Ž. b , if the rate is smaller,<br />
the magnetization will relax more due to flux motion.<br />
From our data, it is found that the temperature<br />
sweeping rate dTrdt does not alter the MT Ž . curves<br />
greatly, although it is changed for two orders of<br />
magnitude. This may manifest that in achieving a<br />
certain magnetized state, the temperature-sweeping<br />
rate plays a minor role. It should be mentioned here<br />
that the temperature-sweeping rate in Fig. 8 is a<br />
( )<br />
S.L. Li et al.rPhysica C 316 1999 293–299<br />
Fig. 8. The susceptibi<strong>li</strong>ties with different temperature-sweeping<br />
rate of Ž. a ZFC Ž. b FC. The open symbol in the FC process<br />
denotes the FCW process and the so<strong>li</strong>d one represents the FCC<br />
process.<br />
relative value and it should be considered with the<br />
microscopic attempting frequency v .<br />
0<br />
In summary, Monte Carlo simulations on the<br />
magnetization in the ZFC and FC processes have<br />
been carried out based on TAFM model. The major<br />
experimental observations have been nicely repro-<br />
duced. It is found that the calculated field profile<br />
BŽ x. is close to the Bean critical state model in the<br />
ZFC process, in sharp contrast to that in the FC<br />
process which shows a curved frozen flux pattern.<br />
The magnetization in both the ZFC and FC processes<br />
is strongly dependent on the pinning potential and<br />
the critical current density, but weakly dependent on<br />
the temperature sweeping rate.<br />
References<br />
wx 1 Y. Yeshurun, A.P. Malozemoff, A. Shaulov, Rev. Mod. Phys.<br />
68 Ž 1996. 911.<br />
wx 2 U. Welp, W.K. Kwok, G.W. Crabtree, K.G. van der Voort,<br />
J.Z. Liu, Phys. Rev. Lett. 62 Ž 1989. 1908.<br />
wx 3 I. Chong, Z. Hiroi, M. Izumi, J. Shimoyama, Y. Nakayama,
K. Kishio, T. Terashima, Y. Bando, M. Takano, Science 276<br />
Ž 1997. 770.<br />
wx 4 Y. Iwasa, H.G. Lee, Cryogenics 37 Ž 1997. 807.<br />
wx 5 H.H.P. Watson, I. Younas, Supercond. Sci. Technol. 10 Ž 1997.<br />
944.<br />
wx 6 H.G. Schnack, R. Griessen, J.G. Lensink, C.J. van der Beek,<br />
P.H. Kes, Physica C 197 Ž 1992. 337.<br />
( )<br />
S.L. Li et al.rPhysica C 316 1999 293–299 299<br />
wx 7 C.J. van der Beek, G.J. Nieuwenhuys, P.H. Kes, H.G. Schnack,<br />
R. Griessen, Physica C 197 Ž 1992. 320.<br />
wx 8 J.R. Thompson, Y.R. Sun et al., Phys. Rev. B 46 Ž 1993.<br />
14440.<br />
wx 9 H.H. Wen, H.G. Schnack, R. Griessen, B. Dam, J. Rector,<br />
Physica C 241 Ž 1995. 353.