STATE OF THE WORLD'S CITIES 2012/2013 Prosperity
STATE OF THE WORLD'S CITIES 2012/2013 Prosperity
STATE OF THE WORLD'S CITIES 2012/2013 Prosperity

Create successful ePaper yourself
Turn your PDF publications into a flip-book with our unique Google optimized e-Paper software.
PRODUCTIVITY<br />
ENVIRONMENTAL SUSTAINABILITY<br />
PROSPERITY<br />
INFRASTRUCTURE<br />
EQUITY AND SOCIAL INCLUSION<br />
<strong>STATE</strong> <strong>OF</strong> <strong>THE</strong><br />
WORLD’S <strong>CITIES</strong><br />
<strong>2012</strong>/<strong>2013</strong><br />
<strong>Prosperity</strong> of Cities<br />
QUALITY <strong>OF</strong> LIFE<br />
World Urban<br />
Forum Edition
<strong>STATE</strong> <strong>OF</strong> <strong>THE</strong><br />
WORLD’S <strong>CITIES</strong><br />
<strong>2012</strong>/<strong>2013</strong><br />
<strong>Prosperity</strong> of Cities
Copyright © United Nations Human Settlements Programme, <strong>2012</strong>.<br />
All rights reserved<br />
United Nations Human Settlements Programme (UN-HABITAT)<br />
P.O. Box 30030, Nairobi, Kenya<br />
Tel: +254 20 7621 234<br />
Fax: +254 20 7624 266/7<br />
Website: www.unhabitat.org<br />
DISCLAIMER<br />
This is a World Urban Forum edition of the State of the World’s<br />
Cities Report <strong>2012</strong>/<strong>2013</strong>: <strong>Prosperity</strong> of Cities. The final edition<br />
will include the foreword by the Secretary General of the United<br />
Nations, maps, bibliography, index and all illustrative text boxes.<br />
The designations employed and the presentation of the material in<br />
this report do not imply the expression of any opinion whatsoever<br />
on the part of the Secretariat of the United Nations concerning<br />
the legal status of any country, territory, city or area, or of its<br />
authorities, or concerning delimitation of its frontiers or boundaries,<br />
or regarding its economic system or degree of development. The<br />
analysis, conclusions and recommendations of this reports do<br />
not necessarily reflect the views of the United Nations Human<br />
Settlements Programme or its Governing Council.<br />
The Report is produced with official data provided by governments<br />
and additional information gathered by the Global Urban<br />
Observatory. Cities and countries are invited to update data relevant<br />
to them. It is important to acknowledge that data varies according<br />
to definition and sources. While UN-HABITAT checks data provided<br />
to the fullest extent possible, the responsibility for the accuracy<br />
of the information lies with the original providers of the data.<br />
Information contained in this Report is provided without warranty<br />
of any kind, either express or implied, including, without limitation,<br />
warranties of merchantability, fitness for a particular purpose and<br />
noninfringement. UN-HABITAT specifically does not make any<br />
warranties or representations as to the accuracy or completeness<br />
of any such data. Under no circumstances shall UN-HABITAT be<br />
liable for any loss, damage, liability or expense incurred or suffered<br />
that is claimed to have resulted from the use of this Report,<br />
including, without limitation, any fault, error, omission with respect<br />
thereto. The use of this Report is at the User’s sole risk. Under no<br />
circumstances, including, but not limited to negligence, shall UN-<br />
HABITAT or its affiliates be liable for any direct, indirect, incidental,<br />
special or consequential damages, even if UN-HABITAT has been<br />
advised of the possibility of such damages.<br />
Design and layout by Bounford.com, Cambridge, UK.<br />
Printed and bound in Malta by Progress Press Ltd.<br />
The paper used for this book is FSC-certified. FSC (the Forest<br />
Stewardship Council) is an international network to promote<br />
responsible management of the world’s forests.<br />
Front cover pictures<br />
Equity and Social Inclusion: © Meunierd/Shutterstock.com<br />
Quality of Life: © <strong>2012</strong> Peter Herbert/fotoLIBRA.com<br />
Infrastructure: © Paul Smith/Panos Pictures<br />
Productivity: © Atul Loke/Panos Pictures<br />
Environmental Sustainability: © Anne-Britt Svinnset/Shutterstock.com<br />
Back cover picture<br />
© Claudio Zaccherini/Shutterstock.com<br />
Part One pictures<br />
Page 8: © Ragma Images/Shutterstock.com<br />
Page 10: © Denis Mironov/Shutterstock.com<br />
Page 25: © Christian Als/Panos Pictures<br />
Part Two pictures<br />
Page 34: © Joyfull/Shutterstock.com<br />
Page 36: © Claudio Zaccherini/Shutterstock.com<br />
Page 48: © Philip Lange/Shutterstock.com<br />
Page 59: © Philip Lange/Shutterstock.com<br />
Page 68: © Clive Shirley/Panos Pictures<br />
Page 78: © Edwina Sassoon/fotoLIBRA.com<br />
Part Three pictures<br />
Page 88: © Steve Forrest/Panos Pictures<br />
Page 90: © Denis Mironov/Shutterstock.com<br />
Page 103: © Chris Stowers/Panos Pictures
Contents<br />
Foreword iv<br />
Introduction v<br />
Acknowledgements vi<br />
Part One: <strong>Prosperity</strong> and Urban Trends 8<br />
Conceptualizing Urban <strong>Prosperity</strong> 10<br />
Urban and Regional Trends 25<br />
Urban Change in Developed Countries 25<br />
Urban Change in Developing Countries 28<br />
Part Two: <strong>Prosperity</strong> of Cities 34<br />
Productivity and the <strong>Prosperity</strong> of Cities 36<br />
Urban Infrastructure: Bedrock of <strong>Prosperity</strong> 48<br />
Quality of Life and Urban <strong>Prosperity</strong> 59<br />
Equity and the <strong>Prosperity</strong> Of Cities 68<br />
Environmental Sustainability and the <strong>Prosperity</strong> of Cities 78<br />
Part Three: Policies for Prosperous Cities 88<br />
From Comparative Advantage to Urban <strong>Prosperity</strong> 90<br />
Policy-Related Factors Underlying the <strong>Prosperity</strong> of Cities 92<br />
Innovating to Support the Transition to the City of the 21st Century 103<br />
Urban <strong>Prosperity</strong> Through Planning and Design 108<br />
Empowering Laws and Institutions for Urban <strong>Prosperity</strong> 114<br />
Statistical Annex 122<br />
iii
Foreword<br />
This is a time of crises. This<br />
is also a time for solutions.<br />
Indeed, the world is<br />
currently engulfed in waves<br />
of financial, economic,<br />
environmental, social and<br />
political crises. Amidst<br />
the turmoil, however, we<br />
are also witnessing valiant<br />
and creative attempts at<br />
different levels and by different actors to seek for solutions.<br />
The State of the World’s Cities Report <strong>2012</strong> presents,<br />
with compelling evidence, some of the underlying factors<br />
behind these crises that have strongly impacted on cities.<br />
It shows that a lopsided focus on purely financial prosperity<br />
has led to growing inequalities between rich and poor,<br />
generated serious distortions in the form and functionality<br />
of cities, also causing serious damage to the environment –<br />
not to mention the unleashing of precarious financial<br />
systems that could not be sustained in the long run.<br />
The Report proposes a fresh approach to prosperity,<br />
one that is holistic and integrated and which is essential for<br />
the promotion of a collective well-being and fulfilment of<br />
all. This new approach does not only respond to the crises<br />
by providing safeguards against new risks, but it also helps<br />
cities to steer the world towards economically, socially,<br />
politically and environmentally prosperous urban futures.<br />
In order to measure present and future progress of cities<br />
towards the prosperity path, the Report introduces a new<br />
tool – the City <strong>Prosperity</strong> Index – together with a conceptual<br />
matrix, the Wheel of <strong>Prosperity</strong>, both of which are meant to<br />
assist decision makers to design clear policy interventions.<br />
To varying degrees of intensity, cities have been hit by<br />
different crises. However, this Report tells us that cities can<br />
also be a remedy to the regional and global crises. When<br />
supported by different tiers of government, and in the quest<br />
to generate holistic prosperity, cities can become flexible<br />
and creative platforms to address these crises in a pragmatic<br />
and efficient manner. <strong>Prosperity</strong>, in this sense, can be<br />
seen as a Pharmakon – both a cause of the problem and a<br />
remedy. As per this ancient Greek construct, when used<br />
properly, it can help decision-makers to steer cities towards<br />
well-balanced and harmonious development.<br />
iv<br />
In this Report, UN-Habitat advocates for a new type of<br />
city – the city of the 21st century – that is a ‘good’, peoplecentred<br />
city, one that is capable of integrating the tangible<br />
and more intangible aspects of prosperity, and in the process<br />
shedding off the inefficient, unsustainable forms and<br />
functionalities of the city of the previous century. By doing<br />
this, UN-Habitat plays a pivotal role in ensuring that urban<br />
planning, legal, regulatory and institutional frameworks<br />
become an instrument of prosperity and well-being.<br />
This is a time of solutions to the numerous challenges<br />
that confront today’s cities. If we are to take measures that<br />
will make a difference to the lives of the billions of people in<br />
the world’s cities, and to future generations, we need sound<br />
and solid knowledge and information. This Report provides<br />
some of these crucial ingredients. I am confident that it will<br />
serve as a useful tool in the necessary redefinition of the<br />
urban policy agenda at local, national and regional levels.<br />
I do believe also that it will provide valuable insights in the<br />
search for urban prosperity and related policy changes in<br />
the years ahead.<br />
The Report is a bridge between research and policy,<br />
with inputs from more than 50 cities, individual scientists<br />
and institutions, particularly the Directorate-General for<br />
Regional Policy from the European Commission, and other<br />
partner institutions around the world that participated<br />
actively in the preparation of this study. I would like to thank<br />
them for their immense contribution. I would also like to<br />
thank the Government of Norway for its financial support.<br />
The partnerships that have evolved during the<br />
preparation of this report are part and parcel of, as well as<br />
critically essential in, creating the building blocks of a more<br />
sustainable prosperity, one that is shared by all. UN-Habitat<br />
is determined to sustain and consolidate such partnerships<br />
as we collectively chart a better future.<br />
Joan Clos<br />
Under-Secretary-General,<br />
United Nations Executive Director, UN-Habitat
Introduction<br />
As the world moves into the urban age, the dynamism and<br />
intense vitality of cities become even more prominent.<br />
A fresh future is taking shape, with urban areas around<br />
the world becoming not just the dominant form of habitat<br />
for humankind, but also the engine-rooms of human<br />
development as a whole.<br />
This ongoing evolution can be seen as yet another<br />
assertion, albeit on a larger scale, of the time-honoured role<br />
of cities as centres of prosperity. In the 21st as in much earlier<br />
centuries, people congregate in cities to realize aspirations and<br />
dreams, fulfil needs and turn ideas into realities.<br />
<strong>Prosperity</strong> in this broader, organic sense transcends<br />
narrow economic success to encompass a socially broadbased,<br />
balanced and resilient type of development that<br />
combines tangible and more intangible aspects. Taken in<br />
this multi-dimensional sense, urban prosperity tightens the<br />
links between individuals and society with their everyday<br />
environment, i.e., the city itself. Amidst multiple challenges<br />
facing cities today, a focus on poverty reduction and/or<br />
responses to the economic crisis is gradually shifting to a<br />
broader and more general understanding of the need to<br />
harness the transformative dynamics and potentials which, to<br />
varying degrees, characterize any city anywhere in the world.<br />
How to rekindle momentum, optimize regenerating<br />
potential, enhance strategic position in the international<br />
business sphere, polishing both image and appeal – in other<br />
words, how to foster prosperity – has become the main<br />
thrust behind urban development. In this endeavour, every<br />
city will inevitably find itself on its own specific and unique<br />
historic course. Still, a common set of conditions can be<br />
found prevailing in all cities, which enable human beings to<br />
flourish, feel fulfilled and healthy, and where business can<br />
thrive, develop and generate more wealth. These conditions<br />
mark out the city as the privileged locus of prosperity, where<br />
advancement and progress come to materialize.<br />
This Report focuses on the notion of prosperity and<br />
its realisation in urban areas. More specifically, this Report<br />
advocates a shift in attention around the world in favour of a<br />
more robust notion of development – one that looks beyond<br />
the narrow domain of economic growth that has dominated<br />
ill-balanced policy agendas over the last decades.<br />
The gist of this Report is the need for transformative<br />
change towards people-centred, sustainable urban<br />
development, and this is what a revised notion of prosperity<br />
can provide. This focus on prosperity comes as institutional<br />
and policy backgrounds are in a state of flux around the<br />
v<br />
world. <strong>Prosperity</strong> may appear to be a misplaced concern<br />
in the midst of multiple crises –financial, economic,<br />
environmental, social or political – that afflict the world<br />
today. It may appear as a luxury in the current economic<br />
predicament. However, what this Report shows with<br />
compelling evidence is that the current understanding<br />
of prosperity needs to be revised, and with it the policies<br />
and actions deployed by public authorities. UN-Habitat<br />
suggests a fresh approach to prosperity, one that reaches<br />
beyond the sole economic dimension to take in other vital<br />
dimensions such as quality of life, infrastructures, equity and<br />
environmental sustainability. The Report introduces a new<br />
statistical instrument, the City <strong>Prosperity</strong> Index, measuring<br />
the prosperity factors at work in an individual city, together<br />
with a general matrix, the Wheel of Urban <strong>Prosperity</strong>, which<br />
suggests areas for policy intervention.<br />
As the privileged locus of prosperity, the city remains best<br />
placed to deal pragmatically with some of the new, postcrisis<br />
challenges. With adequate backing from higher tiers of<br />
government, the city appears as a flexible, operational, creative<br />
platform for the development of collaborative agendas and<br />
strategies for local responses to the global crisis.<br />
Cities can offer remedies to the worldwide crises – if<br />
only we put them in better positions to respond to the<br />
challenges of our age, optimizing resources and harnessing the<br />
potentialities of the future. This is the ‘good’, people-centred<br />
city, one that is capable of integrating the tangible and more<br />
intangible aspects of prosperity- in the process shedding the<br />
inefficient, unsustainable forms and functionalities of the<br />
previous century or so – the city of the 21st century.<br />
This Report comes at a transitional juncture in the<br />
international agenda: in the wake of the ‘Rio + 20’ conference<br />
on the environment and development, and ahead of a fresh,<br />
updated Habitat Agenda due in 2016 (Habitat III). Against<br />
this background, this UN-Habitat Report calls on countries<br />
and cities to engage with a fresher notion of prosperity in their<br />
respective agendas. <strong>Prosperity</strong> involves a degree of confidence<br />
in the foreseeable future. As the world recovers from one of<br />
its worst-ever economic crises and a variety of interrelated<br />
predicaments, we must find a new sense of balance and<br />
safeguard against risks of further turmoil. With dominant<br />
roles in economic, political and social life cities remain critical<br />
to setting our nations on a more inclusive, productive, creative<br />
and sustainable course.
Acknowledgements<br />
CORE TEAM<br />
Director: Oyebanji O. Oyeyinka<br />
Coordinator: Eduardo López Moreno<br />
Task Manager: Ben C. Arimah<br />
Statistical Adviser: Gora Mboup<br />
Principal Authors: Eduardo López Moreno,<br />
Ben C. Arimah, Gora Mboup, Mohamed Halfani, Oyebanji O. Oyeyinka<br />
Research: Raymond Otieno Otieno, Gianluca Crispi, Anne Amin<br />
City <strong>Prosperity</strong> Index: Gora Mboup, Wandia Riunga, John Obure<br />
Editor: Thierry Naudin<br />
UN-HABITAT ADvISORy AND TECHNICAL SUPPORT<br />
Elkin Velasquez, Laura Petrella, José Chong, Claudio Acioly, John Hogan,<br />
Raf Tuts, Ana Moreno, Alioune Badiane, Mariam Yunusa, Roi Chiti, Axumite<br />
Gebre-Egziabher, Kibe Muigai.<br />
INTERNATIONAL ADvISORy BOARD<br />
Patricia Annez; Mark Redwood; Billy Cobbett; Lamia Kamal-Chaoui; Edgar<br />
Pieterse; Amin Y. Kamete; Smita Srinivas; Alfonso Iracheta; Yu Zhu; Dina K.<br />
Shehayeb, Inga Klevby, Maha Yahya, Javier Sanchez-Reaza<br />
FINANCIAL SUPPORT<br />
Government of Norway<br />
SPECIAL TECHNICAL CONTRIBUTION<br />
Directorate-General for Regional Policy from the European Commission<br />
various background documents from: Corinne.Hermant, Zoé BUYLE-BODIN,<br />
Christian.SVANFELDT, Antonio G. Calafati, Celine Rozenblat, Moritz Lennert,<br />
Gilles Van Hamme, Uwe Neumann Birgit Georgi<br />
ADDITIONAL CONTRIBUTIONS:<br />
Thematic Background Papers:<br />
Brian H. Roberts; Pengfei Ni; Robert M. Buckley and Achilles Kallergis;<br />
David Simon, Michail Fragkias, Robin Leichenko, Roberto Sánchez-<br />
Rodríguez, Karen Seto and Bill Solecki, Susan Parnell and Matthew Sharp;<br />
Ivan Turok.<br />
City Reports for policy analysis:<br />
Latin America and the Caribbean: Francisco Perez Arellano<br />
(Guadalajara);Ana Raquel Flores (Ciudad Del Este); Vladimir Morales<br />
Gonzalez (Valparaíso);Flávio José Nery Conde Malta (Santos); Ibarra Rolando<br />
Mendoza (Panama City); Oscar Bragos (Rosario); Tito Alejandro Alegría<br />
Olazábal (Tijuana); Grethel Castellanos (Santo Domingo); Haydée Beltrán<br />
Urán (Medellín); Isabel Viana (Montevideo); Miguel Coyula (Havana);<br />
Carlos Foronda (La Paz); Alberto José Tobío (Guarenas); Luis Delgado<br />
Galimberti (Lima); Alain Philippe Yerro (Fort-De-France)<br />
vi<br />
SUPPORT TEAM<br />
Contributors: Wandia Seaforth, Obas John Ebohon,<br />
Cecilia M. Zanetta, Kaushalesh Lal, Dina K. Shehayeb,<br />
Olumuyiwa Alaba, Sai Balakrishnan, Maria Buhigas,<br />
Christopher Horwood<br />
Statistics: Omondi Odhiambo, Joel Jere, Julius Majale,<br />
Wandia Riunga, John Obure, Anne Kibe, Wladimir Ray, Kaushalesh Lal<br />
Maps: Maharufa Hossain, Jane Arimah<br />
Administrative Support Team: Beatrice Bazanye, Anne Idukitta,<br />
Elizabeth Kahwae, Jacqueline Macha, Mary Dibo<br />
Africa: Femi Olokesusi (Accra, Ibadan and Lagos);Yeraswork Admassie<br />
(Addis Ababa); Hany M. Ayad (Alexandria); Madani Safar Zitoun (Algiers);<br />
Albino Mazembe (Beira); Aldo Lupala (Dar es Salaam); Faustin Tirwirukwa<br />
Kalabamu (Gaborone); Rosemary Awuor Hayanga (Johannesburg);<br />
Allan Cain (Luanda); Godfrey Hampwaye and Wilma Nchito (Lusaka);<br />
Alfred Omenya (Nairobi); C. Fernandez (Praia)<br />
Asia and Arab States: Saswati G. Belliapa (Bangalore); Francisco<br />
L. Fernandez (Cebu); Yanping Liu and Yuehan Wang (Chongqing);<br />
Amelita Atillo (Davao); Pelin F. Kurtul (Gaziantep); Dung D. Dzung (Ho Chi<br />
Minh City); Satyanarayana Vejella (Hyderabad); Syed Shabih ul Hassan<br />
Zaidi. (Lahore); Lan Jin and Yanping Liu. (Shenzen); Centre for Livable<br />
Cities (Singapore); Omar Khattab (Kuwait City); Ali Shabou, Nashwa Soboh,<br />
Kamal Jalouka, Deema Abu Thaib, (Aqaba and Amman); Sinan Shakir A.<br />
Karim (Basra); Mona Fawaz and Nisrene Baghdadi (Beirut); Ahmedou Mena<br />
(Doha); Darim. Al-Bassam and Jalal Mouris (Dubai); Dara al Yaqubi (Erbil);<br />
Falah Al- Kubaisy (Muharrak); Rana Hassan and Ismae’l Sheikh Hassan<br />
(Saida).<br />
Input to boxes:<br />
Cilla Ng, Inga Klevby, José Chong, Zeltia Gonzales, Estefania Villalobos,<br />
Laura Petrella; Alexy Romero Garcia C.; Francisco Perez Arellano,<br />
Design and page layout:<br />
Bounford.com (UK)
Part One<br />
<strong>Prosperity</strong> and<br />
Urban Trends
Chapter 1.1<br />
Conceptualizing Urban<br />
<strong>Prosperity</strong><br />
<strong>THE</strong> CITy IS <strong>THE</strong> HOME <strong>OF</strong> PROSPERITy<br />
Cities are where human beings find satisfaction of basic<br />
needs and essential public goods. Where various products<br />
can be found in sufficiency and their utility enjoyed. Cities<br />
are also where ambitions,<br />
aspirations and other<br />
It is in every<br />
immaterial aspects of life<br />
POLICy city’s interest to are realized, providing<br />
adopt organically integrated contentment and happiness<br />
types of development and and increasing the<br />
prosperity that transcend<br />
prospects of individual and<br />
the narrow confines of an<br />
accumulation-driven model<br />
collective well-being.<br />
that benefits only a few to<br />
However, when<br />
the detriment of the majority. prosperity is absent or<br />
restricted to some groups,<br />
when it is only enjoyed in<br />
some parts of the city, when it is used to pursue specific<br />
interests, or when it is a justification for financial gains for<br />
the few to the detriment of the majority, the city becomes<br />
the locus where the right to shared prosperity is claimed<br />
and fought for.<br />
PROSPERITy: A MISPLACED CONCERN IN<br />
<strong>THE</strong> MIDST <strong>OF</strong> CRISES?<br />
Never before had humankind as a whole faced cascading<br />
crises of all types as have affected it since 2008, from<br />
financial to economic to environmental to social to<br />
political. Soaring unemployment, food shortages and<br />
attendant price rises, strains on financial institutions,<br />
insecurity and political instability, among other crises,<br />
10<br />
might well on their own call into question the relevance<br />
and even the viability of a Report on prosperity.<br />
This proliferation of risks might even challenge the<br />
conventional notion of “Cities as the Home of <strong>Prosperity</strong>”,<br />
i.e. where, by definition, “successful, flourishing, or<br />
thriving conditions” prevail.<br />
As people in the latter part of 2011 gathered in Cairo’s<br />
Tahrir Square or Madrid’s Puerta del Sol, in front of<br />
London’s St Paul’s cathedral or in New York’s Zuccotti<br />
Park, they were not only demanding more equality and<br />
inclusion; they were also expressing solidarity with fellow<br />
citizens that belong with the“99 per cent” (the vast<br />
majority) as opposed to the “one per cent” (those with<br />
vastly disproportionate shares of wealth and decisionmaking<br />
capacity). These movements highlighted the<br />
inherent risks of ill-balanced growth or development<br />
policies, and their failure to safeguard prosperity for all.<br />
Throughout history, cities as seats of power have served<br />
as stages for protests and the recent social movements<br />
are no exception. Demographic concentrations in dense<br />
urban spaces allow critical masses of protestors to<br />
congregate and air new ideas, highlighting cities’ role<br />
as sounding boards for<br />
positive social change. This<br />
points to another of the<br />
At best,<br />
FACT prosperity<br />
promises of a prosperous<br />
as conventionally<br />
city – not just a more<br />
understood seems to be<br />
productive socio-economic an unnecessary luxury<br />
use of space and the built in a time of crisis. At<br />
environment, but also one worst, prosperity can<br />
that safeguards the city’s be seen as a harbinger<br />
of yet another single-<br />
role as a public forum<br />
minded pursuit of purely<br />
where plans and policies<br />
economic prosperity<br />
can be discussed and<br />
that might bring the<br />
challenged for the sake of a global economy to the<br />
more prosperous society. brink again.
Box 1.1.1<br />
Crises, Cities and <strong>Prosperity</strong><br />
The financial crisis: Borrowing, borrowing, borrowing<br />
Prominent scholars such as Joseph Stiglitz ascribe the 2008<br />
financial crisis to rising income inequalities in countries<br />
around the world. In the face of stagnating real earnings, those<br />
households in the lower- and middle-income brackets were<br />
forced into more and more borrowing in order to maintain or<br />
improve living standards. With financiers experimenting with risky<br />
schemes at the other end of the credit chain, this situation led to<br />
a spate of defaults and, ultimately, the financial crash of 2008.<br />
The double irony of this crisis is that it originated in the efforts of<br />
a supposedly sophisticated financial system to give low-income<br />
categories a much-desired access to housing finance – and a<br />
foothold in prosperity.<br />
The democratic crisis: “We are the 99 per cent!”<br />
The recent crisis is more than just an economic one. More<br />
fundamentally, it has exposed a number of risks to social justice,<br />
fairness, participation and, ultimately, democracy. Systematic<br />
decision-making in favour of those better-off is, in itself, a form of<br />
democratic deficit, and one that has led to popular movements like<br />
New York’s Occupy Wall Street. The movement “calls for a society<br />
organized around the needs, desires, dreams, of the 99 per cent,<br />
not the one per cent.” The other major uprisings of 2011 – the<br />
Arab Spring in North Africa and the Middle East, and Spain’s<br />
own Indignados – were also motivated by similar demands for<br />
better and deeper democracy as essential for overall prosperity.<br />
<strong>CITIES</strong>: REMEDy TO <strong>THE</strong> GLOBAL CRISES<br />
If anything, the recent crises have demonstrated that cities<br />
around the world are, to varying degrees of intensity,<br />
exposed at least as much to the destructive as to the more<br />
beneficial effects of international markets, including social<br />
and political repercussions. In this sense, these crises<br />
did more than expose systemic market failures: they also<br />
highlighted major imbalances at the core of economic<br />
policy-making. 2<br />
When responding to such crises, national<br />
macroeconomic policies definitely have a major role to play<br />
through countercyclical public expenditure, strengthening<br />
bank supervision and financial regulations, introducing<br />
progressive income taxation, and reinforcing worldwide<br />
financial governance mechanisms, among other solutions.<br />
However, responses to global crises must also allow for<br />
a vigorous role for cities. So far, cities have been perceived<br />
as the ‘engines’ of national economies and there is no<br />
reason to depart from that view. Indeed, urban authorities<br />
find themselves, at least notionally, in a position to boost<br />
production in the real sector of the economy at local level,<br />
11<br />
Conceptualizing Urban <strong>Prosperity</strong><br />
These protests highlighted the fact that economic growth was a<br />
necessary condition for prosperity, though insufficient on its own:<br />
social and political inclusion is vital for prosperity.<br />
The environmental crisis: The convergence of climate change<br />
and urbanisation<br />
The current pattern of urbanization both in developed and<br />
developing countries converges on one and the same model: low<br />
density-based suburbanisation. Land speculation is associated<br />
with indiscriminate conversion of rural land to urban uses in the<br />
peripheries; this phenomenon combines with a growing reliance on<br />
individual motor vehicles and new-fangled middle-class lifestyles<br />
to expand urban areas way beyond formal city boundaries. A<br />
variety of economic agents can typically be found behind this<br />
trend, including real estate developers, home- and road-builders,<br />
national and international chain stores, among others, more often<br />
than not with support from banks and finance houses. Wasteful<br />
expansion of cities in endless peripheries is a major factor behind<br />
climate change. Beyond the physical threats from climate change,<br />
some cities stand to face an array of additional risks related to<br />
the provision of basic services and public goods (water supply,<br />
physical infrastructure, transport, energy, etc.), affecting industrial<br />
production, local economies, assets and livelihoods. Climate<br />
change may have ripple effects across many sectors of urban<br />
life, affecting the potential for prosperity of the more vulnerable<br />
populations: women, youth, children and ethnic minorities. 1<br />
with attendant employment and income generation. If<br />
urban responses to economic crises are to be effective on a<br />
local scale with positive regional or national repercussions<br />
(‘multiplier effects’), then efficient, multi-way institutional,<br />
policy and budget linkages are required between all relevant<br />
FACT<br />
Cities are a remedy to the global crises. They provide<br />
ready, flexible and creative platforms that can mitigate<br />
the effects of regional and global crises in a pragmatic, balanced<br />
and efficient way. Cities can act as the fora where the linkages,<br />
trust, respect and inclusiveness that are part of any remedy<br />
to the crisis can be built. Acting locally in different areas and<br />
spaces, urban responses to the crisis can be structured and<br />
included in national agendas for more efficiency, with better<br />
chances of flexible responses and more beneficial effects.<br />
Although not immune to divisive partisanship and ideologies that<br />
can paralyze decision-making, cities find themselves in more<br />
privileged positions than national governments to negotiate and<br />
agree on responses with local stakeholders. They can forge new<br />
partnerships and local social pacts which, in turn, can strengthen<br />
national governments in the face of global challenges.
State of the World’s Cities <strong>2012</strong>/<strong>2013</strong><br />
POLICy<br />
Cities can devise a number of safeguards against a<br />
variety of socioeconomic risks. Municipal authorities<br />
can prioritize expenditures on social security nets, local/regional<br />
infrastructure and other types of development, with a view to<br />
securing longer-term growth while stimulating consumption and/<br />
or employment in the short term.<br />
POLICy<br />
Cities can also deploy safeguards against the risks<br />
international markets may bring to bear on local<br />
socioeconomic conditions, deploying redistributive policies in<br />
close collaboration with central government in order to reduce<br />
income gaps and other local structural problems.<br />
FACT<br />
This edition of the<br />
State of the World’s<br />
Cities Report presents<br />
a fresh perspective on<br />
prosperity based on five<br />
dimensions – productivity,<br />
infrastructures, quality<br />
of life, equity and<br />
environmental sustainability.<br />
China: busy traffic on one of Beijing’s boulevards. Wide avenues such as this bring a sense of space to city centres but increasing wealth has<br />
led to a massive growth in private car use.<br />
© Yu Yang/Shutterstock.com<br />
12
tiers of government. In this respect, proper alignment of<br />
central and local government expenditures at city level can<br />
facilitate transfers and their effective use by urban authorities.<br />
RE-THINkING URBAN PROSPERITy<br />
A poverty-stricken plumber in Hyderabad (India), a<br />
factory worker in Bogotá (Colombia), a middle manager in<br />
Madrid (Spain), a businessman in Fortaleza (Brazil), a car<br />
mechanic in Nairobi (Kenya) − all five will have aspirations<br />
to prosperous lives. However, prosperity means different<br />
things to different people around the world. Whatever the<br />
individual perception, regardless of culture and civilization,<br />
prosperity refers to a sense of general and individual<br />
socioeconomic security for the immediate and foreseeable<br />
future, which comes with the fulfilment of other, nonmaterial<br />
needs and aspirations.<br />
Yet, the prevailing view continues to confine prosperity<br />
to the realm of economics; a limiting view that shuts out<br />
other dimensions that are integral to human well-being<br />
and necessary for individual and collective fulfilment.<br />
If anything, the 2008 financial crisis has amplified the<br />
need to include other, non-economic dimensions in the<br />
understanding and measurement of prosperity.<br />
This Report introduces a new gauge for the degree<br />
of prosperity in the cities of the world. Known as the<br />
City <strong>Prosperity</strong> Index and developed by UN-Habitat,<br />
this new instrument combines the five dimensions of<br />
prosperity as understood in this Report and as subsumed<br />
in measurable indicators. The index pinpoints strengths and<br />
weaknesses, in the process suggesting where policy action<br />
can address imbalances.<br />
Re-thinking prosperity in those terms requires a shift<br />
away from the current dominant perspective, which is<br />
outdated and unsustainable on many grounds with its<br />
combination of cheap fossil fuel, heavy dependence on<br />
the motor car, highly segmented urban forms, socially and<br />
economically segregated spaces, endless urban peripheries<br />
that consume land, resources and in many cases natural<br />
protected areas – and all largely steered by private, not<br />
public interest.<br />
CONCEPTUALIzING PROSPERITy:<br />
<strong>THE</strong> UN-HABITAT APPROACH<br />
<strong>Prosperity</strong> implies success, wealth, thriving conditions, and<br />
wellbeing as well as opportunity. In any urban setting, a<br />
key question will arise: What are the essential conditions<br />
and elements that are required for a city to thrive, or for<br />
an urban area to be described as prosperous, or for the<br />
13<br />
POLICy<br />
Conceptualizing Urban <strong>Prosperity</strong><br />
Shared urban prosperity puts people first, values<br />
the tangible and intangible aspects of development,<br />
promotes inclusive economic growth, protects human rights,<br />
ensures enabling equitable development, cares for the natural<br />
environment, reduces disaster risks and vulnerabilities for the<br />
poor and builds resilience to adverse forces of nature. This new<br />
city – the city of the 21st century –creates harmony between the<br />
five dimensions of prosperity and enhances the prospects for a<br />
better future.<br />
POLICy<br />
The ‘good’, people-centred city of the 21st century<br />
stimulates local job creation, promotes social<br />
diversity, maintains a sustainable environment and recognises<br />
the importance of public spaces. In short, this is a city that comes<br />
with a change of pace, profile and urban functions and provides<br />
the social, political and economic conditions of prosperity – a city<br />
that is all-encompassing and accessible to everyone.<br />
wellbeing of the population? Put differently, what are the<br />
manifestations or outcomes of a prosperous city? In general<br />
terms, a prosperous city offers a profusion of public goods<br />
and develops policies and actions for a sustainable use and<br />
equitable access to ‘commons’. 3 More specifically, several<br />
elements which come to mind guide what constitutes the<br />
UN-Habitat conceptualization of <strong>Prosperity</strong>.<br />
First, a prosperous city contributes to economic<br />
growth through productivity, generating the income and<br />
employment that afford adequate living standards for the<br />
whole population.<br />
Second, a prosperous city deploys the infrastructure,<br />
physical assets and amenities – adequate water,<br />
sanitation, power supply, road network, information and<br />
communications technology etc. – required to sustain both<br />
the population and the economy.<br />
Third, prosperous cities provide the social services –<br />
education, health, recreation, safety and security etc. –<br />
required for improved<br />
living standards, enabling<br />
A fresh<br />
the population to maximize POLICy approach<br />
individual potential and<br />
to prosperity is needed,<br />
lead fulfilling lives.<br />
not just to respond<br />
Fourth, a city is only<br />
to the effects of the<br />
prosperous to the extent<br />
crisis and safeguard<br />
that poverty and inequalities against new risks, but<br />
also to steer the world<br />
are minimal. No city can<br />
towards economically,<br />
claim to be prosperous<br />
socially, politically<br />
when large segments of the and environmentally<br />
population live in abject<br />
prosperous urban<br />
poverty and deprivation.<br />
futures.
State of the World’s Cities <strong>2012</strong>/<strong>2013</strong><br />
Table 1.1.1<br />
Defining a prosperous city<br />
This involves reducing the incidence of slums and new<br />
forms of poverty. Prosperous cities are equitable and socially<br />
inclusive. The benefits and opportunities that come with a<br />
prosperous city are equitably (re)distributed. A prosperous<br />
city ensures gender equality, protects the rights of minority<br />
and vulnerable groups, and ensures civic participation by all<br />
in the social, political and cultural spheres.<br />
Fifth, the creation and (re)distribution of the benefits<br />
of prosperity do not destroy or degrade the environment,<br />
instead the city’s natural assets are preserved for the sake of<br />
sustainable urbanization.<br />
<strong>THE</strong> ‘WHEEL <strong>OF</strong> URBAN PROSPERITy’<br />
<strong>Prosperity</strong>, as defined by UN-Habitat, is a social construct<br />
that materializes in the realm of human actions. It builds<br />
deliberately and conscientiously on the objective conditions<br />
prevailing in a city at any time, wherever located and<br />
however large or small. It is a broader, wide-ranging notion<br />
that has to do with well-balanced, harmonious development<br />
in an environment of fairness and justice.<br />
As described above, prosperity takes in all urban<br />
functions as subsumed in five main categories. Since shared,<br />
balanced development is a crucial feature of prosperity,<br />
none of the dimensions must prevail over the others and<br />
all must be kept roughly ‘equal’ – for the sake of a smooth<br />
‘ride’ on the path of prosperity. In practice, of course, it is<br />
a rare city where the five dimensions will be found equal<br />
at any point in time, and this is where policy interventions<br />
will be called for, as suggested graphically by the profile<br />
of the city’s specific ‘city prosperity index’. For instance,<br />
A prosperous city is one that provides<br />
Productivity Contributes to economic growth and development, generates income, provides decent jobs and equal<br />
opportunities for all by implementing effective economic policies and reforms<br />
Infrastructure<br />
development<br />
Provides adequate infrastructure – water, sanitation, roads, information and communication technology in<br />
order to improve urban living and enhance productivity, mobility and connectivity<br />
Quality of life Enhances the use of public spaces in order to increase community cohesion, civic identity, and guarantees the<br />
safety and security of lives and property<br />
Equity and social<br />
inclusion<br />
Environmental<br />
sustainability<br />
Ensures the equitable distribution and redistribution of the benefits of a prosperous city, reduces poverty and<br />
the incidence of slums, protects the rights of minority and vulnerable groups, enhances gender equality, and<br />
ensures civic participation in the social, political and cultural spheres<br />
Values the protection of the urban environment and natural assets while ensuring growth, and seeking ways<br />
to use energy more efficiently, minimize pressure on surrounding land and natural resources, minimize<br />
environmental losses by generating creative solutions to enhance the quality of the environment<br />
14<br />
infrastructure may be well-advanced, but inaccessible to<br />
large portion of the population, therefore compromising the<br />
notion of equity. In other, frequent situations, a city may be<br />
economically efficient, enhancing job opportunities, but the<br />
natural environment is neglected.<br />
Since socioeconomic conditions keep changing on a<br />
local and a broader scale, they will have an effect on one or<br />
more of the five dimensions of prosperity, and it will be for<br />
policy interventions to restore the balance. In this endeavour,<br />
urban authorities will find that the various interlinkages and<br />
interdependencies between<br />
the five dimensions can<br />
also be of a positive nature.<br />
The ‘hub’<br />
For instance, provision FACT is made<br />
of the local urban<br />
of water and sanitation<br />
power functions, both<br />
in informal settlements<br />
public (municipal and<br />
will improve both equity<br />
other institutions and<br />
and quality of life, and<br />
agencies, laws and<br />
even the environment.<br />
regulations, including<br />
urban planning) and<br />
This points to the<br />
non-public (civil society,<br />
‘natural’ or ‘spontaneous’<br />
business, etc.).they<br />
interdependencies between combine in a variety of<br />
the five dimensions along<br />
ways according to local<br />
the outer rim of the<br />
needs and conditions,<br />
wheel. These can also<br />
with the synergies<br />
between them<br />
be strengthened with a<br />
resulting in innovative<br />
multiplier effect through<br />
institutional or policy<br />
deliberate, well-targeted<br />
practice, all for the sake<br />
interventions through the of the public interest<br />
‘hub’ of the wheel, i.e., the and shared prosperity.
Figure 1.1.1<br />
The Wheel of Urban <strong>Prosperity</strong><br />
URBAN PROSPERITY<br />
spoke interactions<br />
URBAN PROSPERITY<br />
combined power functions at work in the city. For instance,<br />
building a school and a covered market next to a poor area is<br />
likely to have multiplier effects across the five dimensions of<br />
shared prosperity.<br />
This goes to show that far from some new ‘model’ or<br />
‘utopia’ or branding/marketing technique, UN-Habitat’s<br />
‘wheel of prosperity’ symbolises the well-balanced<br />
development of the five dimensions, the current condition<br />
of which is graphically represented in the City <strong>Prosperity</strong><br />
Index (CPI – see below). The ‘outer rim’ absorbs the<br />
cumulative forces transmitted through the ‘spokes’ – the<br />
five dimensions of prosperity. At the centre is the ‘hub’ –<br />
the local urban power functions, with four interrelated<br />
roles: (i) ensuring the prevalence of public over any<br />
other kind of interest); (ii) controlling the direction,<br />
spoke interactions<br />
policy<br />
interactions<br />
Environmental sustainability<br />
policy<br />
interactions<br />
Equity and social inclusion<br />
URBAN PROSPERITY<br />
Productivity<br />
Government<br />
institutions<br />
Laws and<br />
urban planning<br />
spoke interactions<br />
15<br />
policy<br />
interactions<br />
policy<br />
interactions<br />
Quality of life<br />
spoke interactions<br />
URBAN PROSPERITY<br />
Infrastructure<br />
policy<br />
interactions<br />
Conceptualizing Urban <strong>Prosperity</strong><br />
spoke interactions<br />
URBAN PROSPERITY<br />
pace and momentum of the ‘wheel’; (iii) ensuring the<br />
balanced development of the five ‘spokes’ and associated<br />
synergies; and (iv) in a two-way relationship, absorbing<br />
and amortising any ‘shocks’ transmitted by the ‘spokes’.<br />
The ‘hub’ brings together<br />
the power functions<br />
(e.g., laws, regulations<br />
and institutions, urban POLICy<br />
planning, civil society,<br />
trade associations, special<br />
agencies, etc.) associated<br />
with the five ‘spokes’.<br />
In this role the ‘hub’<br />
represents human agency<br />
in all its embodiments.<br />
UN-Habitat<br />
suggest<br />
that the project for the<br />
city of the 21st century<br />
is one of achieving<br />
balanced prosperity,<br />
implying making the<br />
‘wheel’ well rounded<br />
with synergetic spokes<br />
and a dynamic hub.
State of the World’s Cities <strong>2012</strong>/<strong>2013</strong><br />
It holds the five ‘spokes’ together and endeavours to<br />
maintain their balance and symmetry.<br />
MEASURING PROSPERITy: ATTEMPTS,<br />
FAILURES AND PROGRESS<br />
<strong>Prosperity</strong> remains one of humankind’s most enduring<br />
pursuits across time and space. But it is only in the past<br />
few decades that decision-makers, academics, practitioners<br />
and populations have started to measure this important<br />
dimension of human development. This has been a journey<br />
of learning, trial and error. The adage “what gets measured,<br />
gets done” has injected a sense of urgency in the pursuit not<br />
just of prosperity per se, but also of an operational definition<br />
complete with specific indicators.<br />
More than 70 years ago in 1937, the Nobel-winning<br />
metric of gross domestic product (GDP) was purported<br />
to be the ‘mother of all statistics’, capturing the notion of<br />
prosperity through total production of goods and services.<br />
Although GDP spread rapidly and was widely accepted for<br />
decades, it is becoming more and more apparent that this<br />
aggregate is too narrow to provide the accurate measure<br />
of a society’s overall well-being today. In 1972, the king<br />
of Bhutan declared he was interested in measuring ‘Gross<br />
National Happiness’ (GNH). In 1990, US economist<br />
Mahbub ul-Haq convinced future Nobel laureate Amartya<br />
Sen to create “an index as vulgar as GDP but more<br />
relevant to our own lives.” 4 In 2006, China developed its<br />
own “Green GDP Index”, which seriously challenged the<br />
validity of the standard aggregate, once environmental<br />
aspects were factored in. 5 In 2009, Joseph Stiglitz called for<br />
FACT<br />
Conceptually, the<br />
notion of prosperity<br />
still belongs within the realm<br />
of economic growth, but it<br />
has to do with more than<br />
just economic well-being<br />
and material progress. Trying<br />
to integrate other tangible<br />
and less tangible human<br />
dimensions of development,<br />
such as well-being and<br />
prosperity, has been an<br />
ongoing story for more<br />
than 40 years, with efforts<br />
to create new metrics and<br />
approaches that add nuance<br />
to standard GDP.<br />
16<br />
an end to “GDP fetishism” and, one year later, the British<br />
government announced that it would, for the first time,<br />
survey happiness in addition to purely economic measures. 6<br />
<strong>Prosperity</strong> is a more complex notion, one that cannot<br />
be captured through straightforward indices that measure<br />
how much money people earn or how many cars they<br />
own. A ‘prosperous’ life includes other non-material,<br />
non-tangible dimensions, like having a voice in shaping<br />
the future of one’s city, having meaningful relationships,<br />
belonging to supportive communities, and having the<br />
resources and capabilities to transform your dreams into<br />
concrete realities.<br />
Recent efforts have attempted to include these other<br />
dimensions of prosperity for a more accurate representation<br />
of societal progress. Table 1.1.2 presents a summary of these<br />
methods and approaches.<br />
<strong>THE</strong> UN-HABITAT “CITy PROSPERITy INDEx”<br />
Cities can take different paths to prosperity. UN-Habitat<br />
views development as a non-linear, non-sequential and<br />
complex process and recognizes that development paths<br />
are differentiated and unique. 7 Still, actions and policies<br />
implemented by governments to increase prosperity and<br />
the outcomes of these policies can be measured to provide<br />
an indication of how solid or weak are the factors of<br />
prosperity available to any individual urban area.<br />
Fetching water in Debre Zeit city, Ethiopia. Quality of life<br />
and prosperity require an urban growth with commensurate<br />
infrastructure and basic services.<br />
© Eduardo Lopez Moreno
Table 1.1.2<br />
Measuring Progress and <strong>Prosperity</strong><br />
Human Development Index (HDI)<br />
United Nations Development Programme<br />
1990<br />
Genuine Progress Indicator (GPI)<br />
Think-tank Redefining Progress<br />
1994<br />
Measuring Sustainable Development<br />
UNECE, OECD, EUROSTAT<br />
2005<br />
<strong>Prosperity</strong> Index<br />
Regional Research Institute, USA<br />
2006<br />
Commission on the measurement of<br />
economic performance and social<br />
progress, France<br />
2008<br />
Legatum <strong>Prosperity</strong> Index<br />
Legatum Institute, Uk<br />
2008<br />
Redefining <strong>Prosperity</strong><br />
UN Sustainable Development Commission<br />
2009<br />
National Well-Being Accounts Index<br />
New Economics Foundation, Uk<br />
2009<br />
Global City Index (GCI)<br />
Foreign Policy Magazine, kearney &<br />
Chicago Council on Global Affairs<br />
2010<br />
Sustainable Development Index<br />
Department for Environment,<br />
Food and Rural Affairs, Uk<br />
2010<br />
Various sources, compiled by UN-Habitat, <strong>2012</strong>.<br />
UN-Habitat’s “City <strong>Prosperity</strong> Index” (CPI) does<br />
not only provide indices and measurements; it also<br />
enables decision-makers to identify opportunities and<br />
potential areas along the path of prosperity. The CPI<br />
includes various indices and indicators that are relevant<br />
to urban areas, and important for prosperity-oriented<br />
public policy-making.<br />
17<br />
Conceptualizing Urban <strong>Prosperity</strong><br />
HDI combines indicators of life expectancy, educational attainment and income into<br />
a composite human development index. It is a single statistic that serves as a frame<br />
of reference for both social and economic development, ranking countries by level of<br />
“human development”.<br />
GPI was developed as an alternative system to GDP measurement. It is used as a more<br />
inclusive type of economics based on “True Cost” economics, looking how the increased<br />
production of goods, and expanding services have actually resulted in the improvement of<br />
welfare or well-being of the people.<br />
This is structured around the concept of capital, as measured under four main<br />
dimensions – economic, natural, human and social – that all pertain to sustainability.<br />
The idea is to make this concept operational for public policies.<br />
This index measures regional economic prosperity and tracks performance at city level,<br />
assessing competitiveness and identifying opportunities to improve business. Although<br />
based on economic prosperity, the index includes three main components: business,<br />
people and place.<br />
This Commission proposed to shift emphasis from measuring economic production to<br />
measuring people’s well-being, against a background of sustainability. The Commission<br />
concluded that well-being is better assessed on the basis of income and consumption<br />
rather than production.<br />
The index purports to measure national prosperity based on wealth and well-being, using a<br />
composite indicator. It ranks 110 countries based on eight “pillars of prosperity”: economic<br />
conditions, entrepreneurship and opportunity, governance, education, health, safety and<br />
security, personal freedom, and social capital.<br />
<strong>Prosperity</strong> is redefined based on three aspects: a) fulfilment of material needs; b) the social<br />
and psychological dimensions that contribute to an enhanced sense of identity, meaning,<br />
belonging and hope; c) individual capability to flourish in more prosperous environments.<br />
The index measures social progress based on subjective well-being. It combines two types<br />
of data: personal (emotional well-being, satisfying life, vitality, resilience, self-esteem) and<br />
social well-being (supportive relationships, trust and belonging).<br />
The GCI measures the international standing of cities along five dimensions: business<br />
activity, human capital, information exchange, cultural experience and political<br />
engagement. The index results in competitiveness rankings of cities in terms of business<br />
opportunities and economic innovation.<br />
This index combines four sets of data: sustainable consumption and production, climate<br />
change and energy, protecting natural resources and enhancing the environment, and<br />
creating sustainable communities. The index is a composite of a total 68 indicators.<br />
Being based on the UN-Habitat concept of prosperity,<br />
the CPI includes the five dimensions (the ‘spokes’ in the<br />
‘wheel’) of urban prosperity. Each is further disaggregated in<br />
various variables and sub-indices. UN-Habitat has adopted<br />
an incremental approach to the development of this index.<br />
Two of the dimensions – productivity and quality of life –<br />
correspond to components of the Human Development
State of the World’s Cities <strong>2012</strong>/<strong>2013</strong><br />
Box 1.1.2<br />
Cities and Human Development<br />
Cities with high HDI values appear both as engines for positive<br />
change and as beneficiaries of prosperity. In the developing<br />
world, some urban areas are becoming so prosperous that<br />
they have closed the gap with, or even surpassed the HDI of<br />
cities in developed nations. For example, Seoul, South Korea,<br />
features a HDI as high as 0,911, higher than that of many<br />
European cities, particularly the Southern and Eastern regions<br />
where HDI readings, though high, come under 0.900 in cities<br />
such as Lisbon, Athens or Warsaw.<br />
City and National HDI values<br />
HDI Index<br />
1.0<br />
0.9<br />
0.8<br />
0.7<br />
0.6<br />
0.5<br />
0.4<br />
0.3<br />
0.2<br />
Kinshasa<br />
Niamey<br />
Monrovia<br />
Country HDI 2010<br />
Dakar<br />
City HDI<br />
Index (HDI), and have been used to compute the “City<br />
Human Development Index” (CHDI). The three other<br />
dimensions – infrastructure, environmental sustainability<br />
and equity – are made of various key indicators as indicated<br />
in Table 1.1.3. Although more refinement is still needed in<br />
terms of what indicators<br />
are included in the index<br />
and with which respective<br />
weightings, those that have<br />
been selected offer the<br />
possibility of disaggregating<br />
the different dimensions<br />
of prosperity, in the<br />
process identifying policy<br />
intervention areas. 8<br />
The Human<br />
FACT Development Index<br />
(HDI) is typically higher<br />
in cities compared with<br />
relevant national averages.<br />
Indeed, cities are in general<br />
richer than the rest of any<br />
country. However, differences<br />
between City and country<br />
Although in many cases<br />
HDI measures are much<br />
steeper in nations with lower the prosperity of a city will<br />
than those with higher HDI go hand in hand with that<br />
measures.<br />
of the country, significant<br />
variations in CPI measures<br />
Accra<br />
Mumbai<br />
New Delhi<br />
Cairo<br />
18<br />
FACT<br />
UN-Habitat analysis shows that some cities<br />
in the developing world are becoming more<br />
prosperous (with higher HDI values), reflecting very<br />
significant progress on health and education, and at<br />
times even in the absence of sustained economic growth.<br />
Mexico City<br />
Warsaw<br />
Toronto<br />
can be found in cities in the same country, and this goes<br />
to show that national aggregates do not necessarily reflect<br />
what happens in different regions or cities. Most existing<br />
prosperity indices provide estimations for countries only<br />
(see Table 1.1.2). By comparison, the UN-Habitat City<br />
<strong>Prosperity</strong> Index is unique in the world for two reasons: (i)<br />
it focuses on individual cities, as opposed to countries, and<br />
(ii) it is concerned with<br />
prosperity as measured<br />
across five dimensions, of<br />
which the local economy is<br />
only one, as opposed to the<br />
sole business environment.<br />
The resulting CPI values<br />
can be regrouped in six<br />
distinct brackets that range<br />
from cities with ‘very solid’<br />
prosperity factors to those<br />
where those factors are<br />
found to be ‘very weak’. 9<br />
POLICy Despite<br />
their high<br />
production of goods<br />
and services, European<br />
cities are experiencing<br />
many crises –financial,<br />
employment, housing,<br />
among others – and it<br />
is expected that their<br />
respective CPI values<br />
will reflect this in the<br />
near future.<br />
Seoul
Table 1.1.3<br />
The UN-Habitat City <strong>Prosperity</strong> Index<br />
Dimensions Definitions/variables<br />
Cities with very solid prosperity factors (0.900<br />
and above): In the world’s most prosperous cities the<br />
five ‘spokes’ are well-developed overall, with very little<br />
variations among them. Urban power functions such as<br />
good governance, urban planning, laws, regulations and<br />
institutional frameworks ensure that no particular dimension<br />
of prosperity gains prevalence to the detriment of the others.<br />
More specifically, they feature high volumes of goods and<br />
1.0<br />
0.9<br />
0.8<br />
0.7<br />
0.6<br />
0.5<br />
0.4<br />
0.3<br />
0.2<br />
0.1<br />
0<br />
19<br />
Conceptualizing Urban <strong>Prosperity</strong><br />
Productivity The productivity index is measured through the city product, which is composed of variables such<br />
capital investment, formal/informal employment, inflation, trade, savings, export/import and household income/<br />
consumption. The city product represents the total output of goods and services (value added) produced by a<br />
city’s population during a specific year (details of the methodology can be found in the complete Report).<br />
Quality of life This index is a combination of three sub-indices: education, health sub-index and public space.<br />
Infrastructure development This index combines two sub-indices: one for infrastructure proper, and another for housing.<br />
Environmental sustainability This index is made of three sub-indexes: air quality (PM10), CO 2 emissions and indoor pollution.<br />
Equity and social inclusion This index combines statistical measures of inequality of income/consumption, (Gini coefficient) and<br />
inequality of access to services and infrastructure.<br />
Figure 1.1.2<br />
Cities with very solid prosperity factors<br />
CPI Index (with �ve dimensions)<br />
CPI Index (with four dimensions)<br />
Productivity Index<br />
Quality of Life Index<br />
services as well as strong economic fundamentals and high<br />
productivity. Their populations live longer and are well<br />
educated. Infrastructures are available and the environment<br />
is well managed. These cities are well governed and ensure<br />
safe, secure environments. It is clear that the five ‘spokes’ of<br />
urban prosperity are kept together in balance and at a right<br />
pace by a ‘hub’ that has the collective interest as its core.<br />
When the equity index is included in the CPI, the<br />
findings show that urban<br />
equity and prosperity<br />
are closely linked: not<br />
unsurprisingly, cities<br />
that do well on the first<br />
Infrastructure Development Index<br />
Environmental Sustainability Index<br />
Equity Index<br />
Warsaw<br />
Milan<br />
Barcelona<br />
Brussels<br />
Copenhagen<br />
Zurich<br />
Amsterdam<br />
Auckland<br />
Melbourne<br />
Tokyo<br />
Paris<br />
Oslo<br />
Dublin<br />
Helsinki<br />
Stockholm<br />
London<br />
Toronto<br />
New York<br />
Vienna<br />
FACT<br />
In broad terms,<br />
the classification<br />
of cities by CPI values<br />
results in regional brackets<br />
with various cities in the<br />
developed world featuring<br />
solid prosperity factors<br />
(CPI: 0.900 or higher), a<br />
majority of African cities<br />
with a very weak readings,<br />
constituting the last two<br />
groups (CPI: 0.600 or<br />
below). In between a large<br />
number of Asian and Latin<br />
American cities make up the<br />
third and fourth groups (with<br />
CPI values of 0.700–0.799<br />
and 0.600–0.699,<br />
respectively).
State of the World’s Cities <strong>2012</strong>/<strong>2013</strong><br />
FACT<br />
All the cities in this group feature very high Gross<br />
National Incomes (GNI) per capita (from US$ 25,478<br />
for New Zealand to US$ 58,810 for Norway) and they produce a<br />
substantial share of the country’s GDP (e.g., Brussels – admittedly<br />
an exception – contributes as much as 46 per cent of Belgium’s<br />
GDP). The economic power of some of these cities is comparable<br />
to that of many national economies. Estimated GDP equivalents in<br />
Tokyo and New York are similar to those of Canada or Spain, while<br />
London’s GDP is higher than those of Sweden or Switzerland.<br />
four dimensions of prosperity (with very solid prosperity<br />
factors) seem to be more equitable. In most cities of this<br />
group, inequality is relatively low, as reflected in low Gini<br />
coefficients (typically below 0.4, the exception being<br />
New York where inequality is significantly steeper (0.5)).<br />
When the equity dimension is taken into consideration,<br />
the CPI remains high for all cities (i.e., above 0.800),<br />
but only half remain with ‘very solid’ prosperity factors<br />
(i.e., CPI above 0.900).<br />
Cities with solid prosperity factors – first category<br />
Recycling is a vital service in modern city dwelling.<br />
(CPI: 0.800–0.899): Cities in this bracket feature high<br />
CPI values. The five ‘spokes’ of prosperity are connected,<br />
generating a selfreinforcing,<br />
cumulative<br />
© EGD/Shutterstock.com<br />
momentum along the<br />
Figure 1.1.3<br />
path of prosperity. The<br />
minute variations between<br />
Cities with solid prosperity factors – first category<br />
the ‘spokes’ is evidence<br />
CPI Index (with �ve dimensions) Productivity Index Infrastructure Development Index<br />
of the efficiency of the<br />
CPI Index (with four dimensions) Quality of Life Index<br />
’hub’, i.e., relatively<br />
1.0<br />
strong institutions,<br />
responsive legal and<br />
0.9<br />
regulatory frameworks<br />
0.8<br />
and large availability of<br />
0.7<br />
FACT<br />
Cities with solid<br />
prosperity factors<br />
belong to countries with<br />
different stages of economic<br />
development and different<br />
HDIs, with Kazakhstan<br />
featuring the highest (0.884)<br />
and China, Turkey and Brazil<br />
the lowest (0.663, 0.679<br />
and 0.699, respectively).<br />
0.6<br />
0.5<br />
0.4<br />
0.3<br />
0.2<br />
0.1<br />
0<br />
Ankara<br />
Mexico City<br />
Bucharest<br />
Shanghai<br />
20<br />
Almaty<br />
São Paulo<br />
Moscow<br />
Environmental Sustainability Index<br />
Seoul<br />
Prague<br />
Athens<br />
Budapest<br />
Equity Index<br />
Lisbon
public goods. Cities in Southern and Eastern Europe such<br />
as Lisbon, Athens, Warsaw, Budapest, Prague, Bucharest<br />
and Moscow feature in this bracket, along with others in<br />
Latin America and Asia: São Paulo, Mexico City, Almaty<br />
(Kazakhstan), Shanghai, Seoul and Ankara.<br />
However, it is important to note that high inequalities<br />
in Moscow, Mexico City and São Paulo interfere with their<br />
1.0<br />
0.9<br />
0.8<br />
0.7<br />
0.6<br />
0.5<br />
0.4<br />
0.3<br />
0.2<br />
0.1<br />
0<br />
Box 1.1.3<br />
Promising African cities<br />
Among the 20 African cities included in UN-Habitat’s CPI<br />
sample, Cape Town, Johannesburg, Cairo and Casablanca are<br />
the only ones featuring solid prosperity factors. Cairo’s current<br />
political turmoil highlights the need for a more integrated<br />
pathway and more balanced growth with some dimensions<br />
(quality of life and infrastructure) progressing much faster than<br />
others (equity and social inclusion). Morocco, on the contrary,<br />
has embraced political change with a new constitution that<br />
enhances civil liberties and expands the notion of prosperity,<br />
which stand to benefit Casablanca and other cities. South<br />
African cities have experienced significant economic growth,<br />
but in the past two decades life expectancy has declined<br />
substantially, affecting quality of life.<br />
Figure 1.1.4<br />
Cities with solid prosperity factors – second category<br />
CPI Index (with �ve dimensions)<br />
CPI Index (with four dimensions)<br />
Casablanca<br />
Cairo<br />
Manila<br />
Johannesburg<br />
Productivity Index<br />
Quality of Life Index<br />
Jakarta<br />
Cape Town<br />
Beijing<br />
21<br />
Conceptualizing Urban <strong>Prosperity</strong><br />
performance in terms of prosperity. When the equity index<br />
is included in the CPI, both cities score below 0.800. This<br />
suggests that, although prosperity factors remain on the<br />
whole solid, they are somewhat weaker. While inequality is<br />
historically entrenched in most Latin American cities, it is a<br />
recent phenomenon in Russia, in the extended aftermath of<br />
economic liberalization.<br />
Cities with solid prosperity factors – second category<br />
(CPI: 0.700–0.799): This group is heterogeneous, with<br />
some cities showing a ‘less coordinated’, ill-balanced<br />
development in the ‘spokes’. This comes as the result<br />
of institutions, legal and regulatory frameworks and<br />
urban management practices that are being consolidated<br />
and because of this; they cannot hold together all the<br />
elements of the ‘wheel’<br />
to operate with stability.<br />
Heterogeneity is also<br />
related to the stage of<br />
development of the<br />
Equity Index relevant countries.<br />
Measured by HDI<br />
readings, significant<br />
variations occur between<br />
countries like Jordan<br />
(0.884) and Indonesia<br />
(0.600), for instance.<br />
Infrastructure Development Index<br />
Environmental Sustainability Index<br />
Yerevan<br />
Hà Noi<br />
POLICy<br />
Cities in emerging economies such as Brazil or<br />
China combine high economic growth and strong<br />
infrastructure, and are expected to move faster along the path of<br />
prosperity – but then, for the sake of balanced development, they<br />
must tackle inequalities and environmental degradation. They also<br />
must look to improve quality of life through more ample provision<br />
of public goods.<br />
Kyïv<br />
Bangkok<br />
Amman<br />
FACT<br />
Most of the<br />
cities in this<br />
group are located in<br />
Asia: Amman, Bangkok,<br />
Hanoi, Yerevan, Beijing,<br />
Jakarta and Manila.<br />
Four African cities are<br />
feature: Cape Town,<br />
Johannesburg, Cairo<br />
and Casablanca. Kiev in<br />
Ukraine is the only city<br />
in Eastern Europe.
State of the World’s Cities <strong>2012</strong>/<strong>2013</strong><br />
Interestingly, the capital<br />
Figure 1.1.5<br />
cities of these two<br />
countries do not feature<br />
Cities with moderate prosperity factors<br />
such extreme variations<br />
CPI Index (with �ve dimensions) Productivity Index Infrastructure Development Index Equity Index<br />
in their respective HDIs<br />
CPI Index (with four dimensions) Quality of Life Index<br />
(0.810 for Amman and<br />
1.0<br />
0.755 for Jakarta).<br />
0.9<br />
However, it is important<br />
to note that inequality<br />
0.8<br />
is inconsistent with<br />
0.7<br />
prosperity as understood<br />
0.6<br />
in this Report. When the<br />
equity index is included<br />
0.5<br />
in the CPI, Cape Town<br />
0.4<br />
and Johannesburg (which 0.3<br />
both feature very high Gini<br />
coefficients), drop from the<br />
0.2<br />
bracket of cities with ‘solid’<br />
0.1<br />
prosperity factors and join<br />
the group with ‘weak’ or<br />
even ‘very weak’ prosperity<br />
factors, with CPI values of<br />
0.590 and 0.479 respectively.<br />
Cities with moderate<br />
0<br />
prosperity factors (CPI: 0.600–0.699): The difference infrastructure and environment in most of the cities in<br />
between ‘solid’ and ‘moderate’ prosperity factors<br />
this bracket. Production of goods and services is still too<br />
lies in wider discrepancies among the values of the<br />
low, a reflection of underdevelopment. Historic structural<br />
various components. This points to institutional and problems, chronic inequality of opportunities, widespread<br />
structural failures, as the ‘hub’ fails to keep the ‘spokes’ poverty, inadequate capital investment in public goods,<br />
at a relatively same ‘length’. Cities with less balanced and lack of pro-poor social programmes are critical factors<br />
development feature contrasted patterns, with a neat behind such low degrees of prosperity.<br />
divide between rich and poor.<br />
The city product of African cities in this bracket is low,<br />
In Nairobi, prosperity is compromised by steep<br />
inequality (Gini coefficient: 0.59), causing its CPI value to<br />
drop from ‘moderate’ to’ weak’ (0.673 to 0.593).<br />
as are the ratings for quality of life and infrastructure. Most<br />
Cities with weak prosperity factors (CPI: 0.500–0.599):<br />
Box 1.1.4<br />
Much remains to be done there in terms of quality of life, Low production, highly available public goods<br />
FACT<br />
New Delhi<br />
Yaoundé<br />
Most of the cities in this bracket – Tegucigalpa, Nairobi,<br />
Phnom Penh, Ulaanbaatar, Guatemala city, Yaoundé,<br />
Mumbai and New Delhi – feature low HDIs (below 0.62). While<br />
in most cities a moderate CPI value is associated with a low city<br />
product, in the case of the two Indian cities the low CPIs mostly<br />
reflect poor environmental conditions.<br />
FACT<br />
In Nairobi, prosperity is compromised by steep inequality<br />
(Gini coefficient: 0.59), causing its CPI value to drop from<br />
‘moderate’ to’ weak’ (0.673 to 0.593).<br />
Guatemala City<br />
22<br />
Ulaanbaatar<br />
Phnom Penh<br />
Environmental Sustainability Index<br />
Nairobi<br />
Mumbai<br />
Chisinau<br />
Tegucigalapa<br />
Chisinau, the capital of Moldova, features a very low city<br />
product (0.34) that is almost half of those of Mumbai (0.645)<br />
or New Delhi (0.596). Still, this combines with very high<br />
readings for quality of life (0.85), infrastructure (0.895) and<br />
clean environment (0.894), similar to those for much richer<br />
cities like Auckland, Brussels, London or New York. With<br />
a very modest economic base, the city has been able to<br />
deliver sufficient public goods to reach a moderate degree<br />
of prosperity. This goes to show that various dimensions of<br />
urban prosperity can be deployed while economic growth<br />
remains relatively weak.
1.0<br />
0.9<br />
0.8<br />
0.7<br />
0.6<br />
0.5<br />
0.4<br />
0.3<br />
0.2<br />
0.1<br />
0<br />
Figure 1.1.6<br />
Cities with weak prosperity factors<br />
CPI Index (with �ve dimensions)<br />
CPI Index (with four dimensions)<br />
Lusaka<br />
Dar es Salaam<br />
Harare<br />
Dakar<br />
Productivity Index<br />
Quality of Life Index<br />
Addis Ababa<br />
La Paz<br />
of these cities perform better on the environment indicator<br />
(low emissions of fine particles (PM10). Recent progress in<br />
Ghana in the economic and political spheres looks certain<br />
to improve the CPI value for Accra, which at the moment<br />
is low (0.533) due to poor economic performance (0.347).<br />
Addis Ababa features relatively low in all CPI components,<br />
and this relative uniformity reflects a fair balance among<br />
the ‘spokes’ (0.52 on average). The city continues to make<br />
progress, thanks to higher investment in infrastructure and<br />
construction, manufacturing and tertiary activities. This<br />
in turn paves the way for job creation, and it is for central<br />
government to ensure that this economic model, which<br />
involves several dimensions of prosperity, retains both<br />
momentum and good synchronization.<br />
Various cities/countries<br />
from this group have a<br />
The bulk of this recent past marred by<br />
FACT bracket can be conflicts, political instability<br />
found in Africa: Abidjan, or economic crisis. The<br />
Accra, Addis Ababa,<br />
city product of Harare<br />
Dakar, Dar Es Salam,<br />
(0.246), not long ago a<br />
Harare, Kampala,<br />
Lagos and Lusaka. Also very vibrant economic<br />
included are Dhaka, centre, is almost as low as<br />
Kathmandu and La Paz. that of post-conflict cities<br />
Accra<br />
Infrastructure Development Index<br />
Environmental Sustainability Index<br />
Lagos<br />
23<br />
Equity Index<br />
Conceptualizing Urban <strong>Prosperity</strong><br />
like Monrovia (0.048),<br />
Antananarivo (0.171) or<br />
Conakry (0.133). In 2002,<br />
Zimbabwe recorded the<br />
lowest slum prevalence of<br />
the region, and one of the<br />
lowest of all the developing<br />
world (four per cent);<br />
poor governance, political<br />
instability and massive<br />
housing evictions in 2005<br />
have raised that percentage<br />
to 17 per cent, mainly due to overcrowding; and yet, Harare<br />
features high infrastructure development (0.899), similar to<br />
that of emerging economy cities like Ankara, Manila, Mexico<br />
City or Mumbai. Quality of life in Harare is also very low,<br />
Kampala<br />
Dhaka<br />
Kathmundu<br />
Abidjan<br />
POLICy Poor<br />
performance of<br />
the ‘hub’ points to the need<br />
for more effective urban<br />
power functions such as<br />
governance, urban planning,<br />
laws, regulations, and<br />
institutions that can pave<br />
the way for more prosperous<br />
futures for these cities.<br />
El Alto, Bolivia: a large and poorly serviced part of greater La Paz,<br />
where the population is 80% indigenous<br />
© Eduardo Lopez Moreno
State of the World’s Cities <strong>2012</strong>/<strong>2013</strong><br />
reflecting a dramatic<br />
There are only<br />
reduction in life expectancy<br />
FACT five cities with<br />
(to 1970s levels). Similar<br />
very weak prosperity<br />
declines are also observed in<br />
factors (CPI below 0.500)<br />
in UN-Habitat’s worldwide<br />
the Democratic Republic of<br />
sample – Bamako,<br />
Congo, Lesotho, Swaziland<br />
Antananarivo, Monrovia, or Zambia.<br />
Niamey and Conakry. Their<br />
It is important to<br />
common feature is that they note that inequality<br />
have recently experienced<br />
further weakens the CPI<br />
various types of conflict<br />
with various degrees of<br />
values for Lagos, Harare<br />
intensity. In each of them, and Lusaka. When the<br />
production, quality of life equity index is included<br />
and infrastructure indicators in the CPI, all three cities<br />
are very low.<br />
move from ‘weak’ to ‘very<br />
weak’ prosperity factors<br />
(below 0.500).<br />
Cities with very weak prosperity factors (CPI<br />
below 0.500): Cities in this bracket feature contrasted<br />
patterns among the sub-indices in the CPI. For some,<br />
the dispersion of index values across the ‘spokes’ reflects<br />
institutional and structural problems. For others, the five<br />
dimensions of prosperity do converge, only at very low<br />
values, a hallmark of dysfunctional systems, institutional<br />
failures, sluggish economic growth as well as widespread<br />
poverty and destitution.<br />
Box 1.1.5<br />
visualizing the 5 dimensions of the CPI<br />
Equity index Quality of life index<br />
1.0<br />
Environmental index<br />
Productivity index<br />
0.5<br />
0<br />
Infrastructure index<br />
Vienna<br />
Mexico City<br />
Johannesburg<br />
The two pentagons represent the five ‘spokes’ of prosperity<br />
as measured in five cities and the extent to which they are<br />
imbalanced /balanced in relation to each other. The radar-shaped<br />
graphs suggest where policy interventions are required. For<br />
instance, Nairobi (to the right) performs well in terms of the<br />
environment and infrastructure, but less so on equity, productivity<br />
and quality of life. In Cairo, the situation is the reverse, as the<br />
24<br />
1.0<br />
0.9<br />
0.8<br />
0.7<br />
0.6<br />
0.5<br />
0.4<br />
0.3<br />
0.2<br />
0.1<br />
0<br />
Figure 1.1.7<br />
Cities with very weak prosperity factors<br />
CPI Index (with �ve dimensions)<br />
CPI Index (with four dimensions)<br />
Infrastructure Development Index<br />
Environmental Sustainability Index<br />
Monrovia<br />
Conakry<br />
Antananarivo<br />
Productivity index<br />
Productivity Index<br />
Quality of Life Index<br />
Equity Index<br />
Bamako<br />
Niamey<br />
Equity index Quality of life index<br />
1.0<br />
Environmental index<br />
0.5<br />
0<br />
Vienna<br />
Cairo<br />
Nairobi<br />
Infrastructure index<br />
environment appears to be the weaker point in an otherwise<br />
well-balanced pattern of prosperity – although at an overall<br />
lower level compared with Vienna. Similar interpretations can be<br />
derived from the pentagon to the left, which compares the relative<br />
performances of revealing the prosperity patterns for the Mexico<br />
and Johannesburg, again against Vienna’s.
Chapter 1.2<br />
Urban and<br />
Regional Trends<br />
MORE THAN HALF <strong>OF</strong> <strong>THE</strong> WORLD IS NOW URBAN<br />
It is really remarkable that only one century ago, two<br />
out of 10 people in the world were living in urban areas.<br />
In the least developed countries, this proportion was<br />
as low as five per cent, as the overwhelming majority<br />
was living in rural areas. The world has been rapidly<br />
urbanizing since then and, in some countries and regions,<br />
at an unprecedented pace. It was only two years ago that<br />
humankind took a historic step when, for the first time<br />
in history, the urban outnumbered the rural population.<br />
This milestone marked the advent of a new “urban<br />
millennium” and, by the middle of this century, it is<br />
expected that out of every 10 people on the planet, seven<br />
will be living in urban areas.<br />
Interestingly, only 60 years ago or so (1950), the<br />
number of people living in urban centres was slightly<br />
higher in the developed nations (54 per cent, or 442<br />
million) compared with developing countries. Today,<br />
of every 10 urban residents in the world more than<br />
seven are found in developing countries, which are also<br />
hosts to an overwhelming proportion of humankind<br />
(82 per cent of the world’s population). Moreover, it is<br />
estimated that, between 2010 and 2015, some 200,000<br />
people on average will be added to the world’s urban<br />
population each day. Worth noting is that 91 per cent of<br />
this daily increase (or 183,000) is expected to take place in<br />
developing countries.<br />
25<br />
Urban Change in<br />
Developed Countries<br />
URBAN POPULATION GROWTH IS NExT TO<br />
STAGNANT<br />
In the more advanced nations, urban population growth<br />
is next to stagnant (0.67 per cent on an annual average basis<br />
since 2010), which represents an additional six million or<br />
so every year. In Europe, the annual increase is only two<br />
million. By comparison, the aggregate annual population<br />
increase in six major developing-country cities – New Delhi<br />
and Mumbai (India), Dhaka (Bangladesh), Lagos (Nigeria),<br />
Kinshasa (Democratic Republic of Congo) and Karachi<br />
(Pakistan) – is higher than Europe’s entire population.<br />
Population in North American cities was the least slow of<br />
all those in the developed world between 2005 and 2010,<br />
particularly in the United States (one per cent on average).<br />
The Growth, Decline and <strong>Prosperity</strong> of Cities: There<br />
is no clear association between the demographic growth or<br />
decline of cities and their degrees of prosperity. Although<br />
population numbers have declined in a number of cities in<br />
Western Europe, Canada and New Zealand, this did not<br />
affect living standards, which in some cases even improved.<br />
On the other hand, and<br />
as might be expected,<br />
population declines in<br />
a number of cities in<br />
Eastern Europe and the<br />
United States of America<br />
are strongly associated<br />
with economic decay. The<br />
deterioration of inner<br />
city conditions (deserted<br />
FACT<br />
In the last<br />
20 years,<br />
the proportions of<br />
European cities with<br />
demographic growth<br />
rates over one per cent<br />
and of those with<br />
population declines<br />
were comparable.
State of the World’s Cities <strong>2012</strong>/<strong>2013</strong><br />
POLICy<br />
Cities must<br />
create<br />
the conditions (and<br />
record accurate data)<br />
that will enable them<br />
to understand and<br />
anticipate trends,<br />
including the growth or<br />
decline of some areas<br />
or regions, if they are<br />
to be in a position to<br />
develop expansionary<br />
or recovery strategies.<br />
China, Ruili, Yunnan Province. Dai minority threshing rice harvest in fields which are gradually being swallowed by this booming border city.<br />
© Mark Henley/Panos Pictures<br />
26
Figure 1.2.1<br />
Population density in Europe, 2001<br />
Source: ORNL LandScan – cartography DG REGIO, European Commission.<br />
residential areas and crumbling infrastructure) have all gone<br />
hand in hand with population declines.<br />
Growing Cities are Located in Growing Regions.<br />
Cities and the surrounding regions are typically<br />
interdependent economically and tend to share similar<br />
socio-economic and demographic trends. In most North<br />
American cities, surrounding regions tend to predominate<br />
over urban areas. In contrast, in Western Europe the<br />
prosperity of entire regions is largely dependent on a<br />
primate conurbation and the concentration of services<br />
and manufacturing that comes with it.<br />
Cities in the North will<br />
continue to attract migrants.<br />
European urban areas,<br />
POLICy in particular, will continue to<br />
feature low fertility rates and<br />
rapidly aging populations.<br />
These demographic trends<br />
are unmistakable and point<br />
to overall demographic<br />
decline.<br />
Regional<br />
and national<br />
urban planning through<br />
central government<br />
plays a critical role in<br />
creating a system of<br />
cities and in determining<br />
the prosperity and<br />
growth of cities.<br />
27<br />
Urban and Regional Trends<br />
Between 2005 and 2010,<br />
net international migration<br />
counterbalanced the excess<br />
of deaths over births in 11<br />
developed countries, while<br />
contributing twice as much<br />
to population growth in<br />
another nine countries. 11<br />
With the ongoing economic<br />
crisis, the aggregate flow of<br />
immigrants to developed<br />
countries has slowed down<br />
from an annual 2.3 per cent average rate in 2000–05 to<br />
1.7 per cent in 2005–10. Rising unemployment in some of<br />
the host cities/countries may cause governments to impose<br />
restrictions on immigration. 12<br />
In the European<br />
FACT Union, deaths<br />
should outnumber births<br />
from 2015 onwards, putting<br />
an end to population growth<br />
through natural increase.<br />
Positive net migration will<br />
be the only demographic<br />
growth factor until 2035.<br />
It would be in the best interests of European countries/<br />
cities to review immigration policies with a view to<br />
maximizing the benefits and reducing the more negative<br />
aspects of the phenomenon, with inclusionary social and<br />
political mechanisms to bring prosperity to all.<br />
10
State of the World’s Cities <strong>2012</strong>/<strong>2013</strong><br />
Urban Change in<br />
Developing Countries<br />
DIvERGENT URBAN GROWTH PATTERNS<br />
In the last decade, the urban population in the developing<br />
world grew an average 1.2 million people per week, or<br />
slightly less than one full year’s demographic growth in<br />
Europe’s urban areas. Asia dominated the picture, adding<br />
0.88 million new urban dwellers every week. Africa was the<br />
second largest contributor with an additional 0.23 million<br />
per week, dwarfing Latin America and the Caribbean’s<br />
0.15 million weekly increment.<br />
Africa: The urban population is set to outstrip<br />
Europe’s: In what promises to be one of the more<br />
remarkable forthcoming developments in the overall<br />
pattern of urbanization in Africa, the region’s population<br />
is poised to outgrow both Europe’s and Latin America’s,<br />
which was the first region to become predominantly urban<br />
in the developing world. In 2025, the aggregate urban<br />
population of Africa, Europe, Latin America and the<br />
FACT<br />
Urbanization in Africa has not yet brought the economic<br />
development and degree of prosperity that might have<br />
been expected. Inadequate education and physical infrastructure,<br />
combined with poor governance, have constrained the efficient use<br />
of productive resources, and the industrial development that might<br />
have come with it. At the same time, the ongoing urban economic<br />
momentum in Africa is a result of a number of the typical factors of<br />
prosperity at work in other regions of the world, such as economies<br />
of agglomeration, location advantages, and diversification of the<br />
economic base, albeit all in nascent form.<br />
FACT<br />
Asia is also confronted by the same urban paradox as<br />
Africa. Despite high concentrations of population in large<br />
cities, the continent ranks among the least-urbanized regions in<br />
the world (45 per cent urban). The tipping point for ‘urban Asia’ is<br />
expected to happen earlier though (around 2020s).<br />
POLICy<br />
The economic success of many countries/cities goes<br />
hand in hand with urbanization. Cities must give<br />
more attention to rising inequalities and the worrying trend of<br />
environmental degradation.<br />
28<br />
Caribbean is expected to reach 642 million, 566 million<br />
and 560 million, respectively. In an apparent paradox, by<br />
that same year 2025 Africa will still be the least urbanized<br />
region in the world (45 per cent of the population).<br />
Asia: Moving into the “Urban Century”: Half of the<br />
world’s urban population now lives in Asia. This region<br />
has accounted for about 65 per cent of the demographic<br />
expansion of all urban areas across the world since the<br />
beginning of the 21st Century. Undoubtedly, this is the<br />
“Asian Urban Century”. 13 Large population concentrations<br />
in mega-cities are to remain a prominent feature in<br />
urban Asia (today, seven out of the 10 most populous cities<br />
of the world are in this region). In the recent past, Delhi<br />
and Shanghai have joined the league of ‘meta-cities’, those<br />
massive conurbations of more than 20 million people. It is<br />
expected that by 2020, another three Asian cities – Beijing,<br />
Dhaka and Mumbai – will have reached the 20 million mark.<br />
Latin America and the Caribbean: Inter-city migration<br />
predominates: This is the most urbanized region in the<br />
world (80 per cent of the total population, compared with<br />
Europe’s 73 per cent).The urban transition in this region<br />
was achieved in the early 1960s, or about 16 years before<br />
Western Asia (the second sub-region in the developing<br />
world to become predominantly urban), and 30 and 45<br />
years respectively before Southern and North Africa (or, on<br />
current trends, some 70 years before the whole of Africa).<br />
CONvERGENT URBAN GROWTH PATTERNS<br />
Cities are expanding in a discontinuous, scattered and<br />
low-density form that is not sustainable: A defining feature<br />
of cities in the developing<br />
world is an outward<br />
expansion far beyond<br />
formal administrative POLICy<br />
boundaries, largely<br />
propelled by the use<br />
of the automobile and<br />
land speculation. A large<br />
number of cities – whether<br />
in Angola, Egypt, Brazil,<br />
China, or almost any other<br />
country – feature very<br />
land-consuming suburban<br />
sprawling patterns that<br />
often extend even to<br />
farther peripheries. A study<br />
on 120 cities shows that<br />
urban land cover grew,<br />
African<br />
cities must<br />
connect to regional<br />
and global business<br />
networks, enhance<br />
quality of life, improve<br />
basic infrastructure<br />
and communication<br />
networks, address<br />
public transport<br />
deficiencies and<br />
environmental<br />
conditions, and respond<br />
to inequality and<br />
poverty issues, if they<br />
are to turn into real<br />
engines of national<br />
growth and prosperity.
FACT<br />
Urban populations maintain high growth rates in the<br />
developing world, but the pace has slowed down, from<br />
just under three per cent in the year 2000 to 2.4 per cent in<br />
2010, which is still three and a half times higher than the annual<br />
average population growth rate in developed countries.<br />
29<br />
Urban and Regional Trends<br />
La Paz, Bolivia sprawls ever higher up the mountain side. The metropolitan area, formed by the neighbouring cities of La Paz, El Alto and<br />
Viacha, is the most populous area of Bolivia.<br />
© <strong>2012</strong> Robert Gilhooly/fotoLIBRA.com
State of the World’s Cities <strong>2012</strong>/<strong>2013</strong><br />
on average, more than double the growth of the urban<br />
population. Similar urban trends can be observed in other<br />
parts of the world. For instance, in Mexico, the urban<br />
FACT<br />
Latin America and the Caribbean will be nearly 87 per cent<br />
urban in 2050, by which time the annual average pace<br />
of growth in the urban population is expected to slow down to<br />
0.3 per cent. Some cities already see their populations shrinking.<br />
Latin America and the Caribbean stands out as the only region<br />
where migration between urban areas is a significant determinant<br />
of urban population growth, accounting for nearly 50 per cent and<br />
due to several factors, chief among them the pursuit of prosperity.<br />
POLICy<br />
Latin American cities must become more productive<br />
and generate local jobs, improve transport<br />
infrastructure and living conditions, short of which they will face<br />
prospects of population decline due to higher mobility from city<br />
to city. They must reduce entrenched inequalities while improving<br />
quality of life and environmental protection. More prosperous<br />
cities must articulate better their strategic advantages with<br />
national economic policies and enhance their creative capital to<br />
increase prosperity prospects.<br />
POLICy<br />
Even though the region is more urbanized than Europe,<br />
GDP per capita (PPP) was nearly three times lower<br />
than the European Union’s in 2010. The main reasons include<br />
chronic inequalities and mass poverty, insufficient infrastructure,<br />
poor public services, inadequate connectivity, poor governance<br />
and fragile institutions.<br />
POLICy<br />
Against this background, cities must accommodate<br />
demographic and spatial expansions, with a<br />
concomitant development of well-devised urban structures that<br />
would reduce transport and service delivery costs, optimize land<br />
use and support the deployment and/or protection of open spaces.<br />
POLICy<br />
Better connectivity, mobility and accessibility and wellplanned<br />
integration of land-use, density and transport<br />
have the potential to reduce energy consumption drastically,<br />
making cities more sustainable.<br />
FACT<br />
Most urban plans and regulatory regimes in the developing<br />
world have been incapable of preventing the conversion<br />
of rural land to urban use in city peripheries. as a result, the<br />
reclassification of settlements from ‘rural’ to ‘urban’ has become<br />
the second most significant determinant of urban population growth<br />
and expansion in the developing world today.<br />
30<br />
physical expansion of all urban areas over the last 30 years<br />
was estimated to be at around 7.4 per cent on an annual<br />
average basis, outstripping population growth by a multiple<br />
of nearly four. 14<br />
Cities are becoming endless expanses, with high<br />
degrees of fragmentation of the urban fabric that<br />
result in vast interstitial open spaces. At the periphery,<br />
residential neighbourhoods are characterized by lowdensity<br />
developments which, along with under-used<br />
spaces and fragmented built-up areas in the intermediate<br />
city-rings, are contributing to dramatic reductions in<br />
residential densities.<br />
NOvEL URBAN/REGIONAL CONFIGURATIONS AND<br />
PROSPERITy<br />
Cities large or small have increasingly come to merge<br />
together to form new spatial configurations that typically<br />
take three principal forms: mega-regions, urban corridors<br />
and city-regions. Each on its own spatial scale, these<br />
three forms seem to act as nodes where global and<br />
regional flows of people, capital, goods and information<br />
combine and commingle, resulting in faster growth, both<br />
demographic and economic, than that of the countries<br />
Box 1.2.1<br />
Novel configurations: A typology<br />
Mega-regions surpass mega- and meta-cities by population<br />
and economic output, combining large markets, skilled labour<br />
and innovation and amalgamating several cities within the<br />
orbit of the overall region.<br />
Example: Japan’s Tokyo-Nagoya-Osaka-Kyoto-Kobe region,<br />
with a population close to 60 million.<br />
Urban corridors, a number of urban centres of various<br />
sizes are connected along transportation routes in linear<br />
development axes that are often linked to a number of megacities,<br />
encompassing hinterlands. New developments in some<br />
fringe areas experience the fastest growth rates and the most<br />
rapid urban transformation. Example: in Malaysia, the Kuala<br />
Lumpur-Klang corridor along the Klang Valley.<br />
City-regions take on a larger scale than large cities,<br />
expanding beyond formal administrative boundaries to engulf<br />
smaller ones as well as semi-urban and rural hinterlands,<br />
and even merge with other intermediate cities, creating large<br />
conurbations that eventually form city-regions.<br />
Examples: São Paulo, Brazil; Cape Town, South Africa;<br />
Bangkok, Thailand.
where they are located. These new configurations are<br />
more and more spatially connected and functionally<br />
bound by their economic and environmental ties, at times<br />
even socially and politically. They play an increasing role<br />
in the creation and distribution of prosperity far beyond<br />
their own specific geographic areas.<br />
Large urban configurations, as grouped in<br />
networks of cities, amplify the benefits of economies of<br />
agglomeration, increasing efficiencies and enhancing<br />
connectivity. They also generate economies of scale that are<br />
beneficial in terms of labour markets, as well as transport<br />
and communication infrastructure, which in turn increase<br />
local consumer demand.<br />
ENHANCING PROSPERITy IN LARGE URBAN<br />
CONFIGURATIONS: <strong>THE</strong> 5 DIMENSIONS<br />
Large urban configurations concentrate so many<br />
resources and opportunities that give substance to the<br />
five dimensions of prosperity: productivity, infrastructural<br />
development, quality of life, equity and social inclusion, and<br />
environmental sustainability.<br />
Enhanced productivity: Planning large urban<br />
configurations as a ‘portfolio’ of functional and<br />
complementary areas of specialization can lead to more<br />
diversified economies, capitalizing on the comparative<br />
advantages of each city within the large agglomeration<br />
31<br />
FACT<br />
and developing a strong<br />
regional vision for the<br />
whole large configuration.<br />
For instance, in the Pearl<br />
River Delta mega-region<br />
in China, each of the<br />
cities capitalizes on its<br />
comparative strengths, and<br />
contributes to the overall<br />
prosperity of the large<br />
configuration.<br />
Infrastructural<br />
development: Transport<br />
infrastructure improves<br />
Urban and Regional Trends<br />
A critical mass of people, ideas, infrastructure and<br />
resources acts as a magnet of development, attracting<br />
migrants, private firms, investors and developers. All of this<br />
enhances the prospects for more employment opportunities,<br />
wealth creation, innovation and knowledge, which are all major<br />
factors of prosperity.<br />
POLICy<br />
It is in a city’s<br />
interest to<br />
establish linkages with<br />
other neighbouring urban<br />
areas for the sake of<br />
complementary functions<br />
in order to acquire a<br />
strong collective regional<br />
identity, in the process<br />
achieving greater economic<br />
momentum than if they<br />
remain in isolation.<br />
India, Tirupur, Tamil Nadu.Workers at a textile factory in Tirupur.<br />
There are some 7,000 garment factories in the city, providing<br />
employment to close to one million people.<br />
© Atul Loke/Panos Pictures
State of the World’s Cities <strong>2012</strong>/<strong>2013</strong><br />
connectivity and spatially integrates the networks of cities<br />
that make up the urban/regional configuration. The large<br />
economically prosperous cities of Shanghai, Guangzhou<br />
and Beijing have invested<br />
in infrastructure to connect<br />
peripheral towns and<br />
POLICy enhance the large urban<br />
configuration. Beijing has<br />
extended 304 km of roads<br />
to link all ‘administrative<br />
villages’ to the city (2005).<br />
Shanghai has built 750 km<br />
of highways to integrate<br />
the rural hinterland (2007).<br />
Investments<br />
in transport<br />
infrastructure and related<br />
reforms, including finance<br />
and regulations, deliver<br />
major economic benefits,<br />
contributing to poverty<br />
alleviation and improving<br />
quality of life.<br />
POLICy<br />
Cities and regional governments should encourage<br />
social and institutional innovations that can level out<br />
socio-spatial inequalities; this can include tax revenue transfers<br />
among urban authorities within the large urban configuration, or<br />
revenue-sharing, or equalization grants.<br />
POLICy<br />
New or strengthened, more effective local and regional<br />
institutions, new linkages and alliances across the<br />
three tiers of government, together with a comprehensive vision<br />
with clear plans favouring inclusiveness, are all crucial for<br />
equitable development and prosperity.<br />
32<br />
China: high-speed train in Lujiazui City, the financial district of<br />
Shanghai. Bullet trains in China substantially reduce transit times<br />
between cities, a 140 km journey taking only 30 minutes.<br />
© ArtisticPhoto/Shutterstock.com<br />
Guangzhou has completed extensive networks of roads,<br />
electricity and water distribution to all neighbouring rural<br />
settlements with more than 100 residents (2007). 15<br />
Equity and social inclusion: The market-driven<br />
logic of scale economies can interfere with equitable<br />
distribution, such as unregulated land markets, spatial<br />
segregation, extreme income inequalities and uneven<br />
development. Speculative real estate development in<br />
many of these large urban<br />
configurations effectively<br />
excludes not only the poor,<br />
but even the middle class, POLICy from formal land markets,<br />
creating an uneven<br />
patchwork of privilege and<br />
underprivilege across large<br />
urban areas.<br />
Quality of life: When<br />
city leaders cooperate,<br />
rather than compete, in a<br />
number of areas (crime,<br />
poverty, social inequalities,<br />
Increasing<br />
evidence<br />
shows that<br />
interventions to<br />
promote quality<br />
of life have clear<br />
positive effects on<br />
the other dimensions<br />
of prosperity.<br />
Unsurprisingly, progress<br />
on the other dimensions<br />
of prosperity is found to<br />
enhance quality of life.
transport systems, infrastructure) a more effective type of<br />
regional governance emerges that has direct implications on<br />
the quality of life both inside and outside the large urban<br />
configuration.<br />
Environmental sustainability: Environmental<br />
challenges transcend political/administrative boundaries.<br />
Yet, local authorities may find themselves with little<br />
power or resources to counter negative impacts of growth<br />
on the environment, particularly in the face of negative<br />
externalities generated by neighbouring cities.<br />
LARGE URBAN CONFIGURATIONS FACE<br />
SPECIFIC RISkS<br />
Large urban configurations come with a number of wellidentified,<br />
specific risks: poor urban/regional planning,<br />
lack of coordination and deficient coping strategies in<br />
the face of social and fiscal disparities. Although these<br />
affect the whole population, the bulk of the risks fall<br />
disproportionately on the poor.<br />
Economic forces and spontaneous growth in the large<br />
urban configurations tend to sharpen spatial and social<br />
disparities, which are further compounded by inefficient use<br />
of land and other resources. Close links with world financial<br />
Endnotes<br />
1 UN-Habitat (2011) Cities and Climate Change: Global Report on Human Settlements<br />
2011, Earthscan, London<br />
2 United Nations (2010) World Economic and Social Survey 2010: Retooling Global<br />
Development, United Nation (DESA),New York, http://www.un.org/esa/policy/wess/<br />
wess2010files/wess2010.pdf<br />
3 Historically, water, biodiversity, knowledge and some other shared resources,<br />
including roads, sidewalks, highways and other public infrastructure have been<br />
considered as ‘commons’. ‘Commons’ are also intangible aspects such as clean<br />
environmental conditions, identity, cultural and symbolic spaces. More recently, from<br />
an institutional governance perspective, ‘commons’ are institutional arrangements<br />
such as ‘spaces’ for negotiation and participation, cultural norms and legal and<br />
statutory provisions.<br />
4 Dickinson, E. (2011) ‘GDP: A Brief History’, Foreign Policy, January/February 2011,<br />
http://www.foreignpolicy.com/articles/2011/01/02/gdp_a_brief_history.<br />
5 The outcome of China’s “green GDP” index was that if air pollution, water shortages,<br />
desertification, and depletion of fish stocks and wildlife were factored into its GDP<br />
calculation, the 2004 GDP would have been 511 billion yuan (US$ 66 billion), or three<br />
per cent lower (SEPA and NBS, 2006).<br />
6 Dickinson, 2011.<br />
7 Oyelaran-Oyeyinka, B. and P.G. Sampath (2010) Latecomer Development: Innovation<br />
and Knowledge for Economic Growth, Routledge, London and New York.<br />
33<br />
POLICy<br />
POLICy<br />
Urban and Regional Trends<br />
Looking beyond their own local interests and<br />
cooperating with the other jurisdictions involved,<br />
local authorities can improve competitive advantage while also<br />
preserving the environment.<br />
POLICy<br />
Working together, cities in a large urban configuration<br />
are in better positions effectively to protect,<br />
manage, and plan for physical environments that span multiple<br />
jurisdictions.<br />
POLICy<br />
The economic surpluses that large urban<br />
agglomerations derive from productivity gains can<br />
be channeled towards the protection of natural resources in the<br />
region, with the costs of maintaining these indivisible public goods<br />
equitably shared among the population.<br />
Should they fail to address those detrimental side<br />
effects, large urban configurations may find it<br />
increasingly difficult to attract investment, labour and skills, in the<br />
process compromising future prosperity.<br />
markets and the impacts of global and regional economic<br />
crises shape ‘uneven geographies of development’.<br />
8 Further compounding the problem of data dearth is the fact that most of the existing<br />
information was not collected in a uniform way to allow for comparisons of cities<br />
across countries and regions.<br />
9 This classification has used data from multiple sources for the various components<br />
of the UN-Habitat City <strong>Prosperity</strong> Index, and this calls for a word of caution when<br />
interpreting some of these variations.<br />
10 Eurostat (2008) ‘Ageing characterizes the demographic perspectives of the European<br />
societies’, Eurostat - Statistics in focus, 72/2008, Author: Konstantinos Giannakouris.<br />
European Commission, Brussels.<br />
11 United Nations (2010) World population policies 2009, United Nations, Department<br />
of Economic and Social Affairs, Population Division, New York, http://www.un.org/esa/<br />
population/publications/wpp2009/Publication_complete.pdf<br />
12 Ibid.<br />
13 Mohan, R. (2006) Asia’s Urban Century: Emerging Trends, Key note address delivered<br />
at the Conference of Land and Policies and Urban Development, Lincoln Institute<br />
of Land Policy, Cambridge, Massachusetts, June 5, http://www.bis.org/review/<br />
r060705e.pdf.<br />
14 ONU-HABITAT and SEDESOL (2011), El Estado de las Ciudades de México, ONU-<br />
HABITAT (Oficina Regional para América Latina y el Caribe), Rio de Janeiro,<br />
15 World Bank (2009) World Development Report 2009: Reshaping Economic<br />
Geography, World Bank, Washington.
Part Two
<strong>Prosperity</strong> of Cities
Chapter 2.1<br />
Productivity and the<br />
<strong>Prosperity</strong> of Cities<br />
Enhancing urban productivity is clearly desirable, as it<br />
improves competitiveness and, ultimately, the prosperity of<br />
any city. More productive cities are able to increase output<br />
with the same amounts of resources, generating additional<br />
real income that can raise living standards through more<br />
affordable goods and services. More specifically, the<br />
extra income and municipal revenue generated through<br />
productivity will enable any city to provide more, better<br />
services, such as housing, education and health services,<br />
social programmes and expanded infrastructure networks<br />
to support both productive and leisure activities.<br />
Urban productivity refers to the efficiency with which<br />
a city transforms inputs into outputs. However, because<br />
of limited data, gross domestic product (GDP) per capita<br />
is commonly used as a proxy for urban productivity, with<br />
a city’s GDP measuring<br />
local production of<br />
Raising urban goods and services and<br />
POLICy productivity<br />
the population serving<br />
is not a goal in itself, but<br />
a critical starting point<br />
as a proxy for inputs<br />
to provide residents with related to human capital.<br />
decent income for their<br />
However, it is important<br />
basic needs and adequate to emphasize that, despite<br />
living standards. its expediency, GDP<br />
1<br />
POLICy<br />
Cities are naturally more productive than rural areas,<br />
as they benefit from larger pools of labour and talent,<br />
together with concentration efficiencies for both producers and<br />
consumers, and a more fluid exchange of ideas and innovations. 2<br />
36<br />
per capita fails fully to reflect the complex dynamics<br />
determining urban productivity.<br />
RISING URBANIzATION AND INCREASING<br />
PRODUCTIvITy<br />
As countries become more urbanized, both urban<br />
and national productivity will increase. As shown in<br />
Figure 2.1.1, rising urbanization and per capita income<br />
went hand in hand for the world as a whole over the<br />
past five decades. While the share of urban populations<br />
worldwide increased from 33 to 51 per cent between 1960<br />
and 2010, per capita income increased by 152 per cent –<br />
from USD 2,382 to USD 6,006 – over the same period. 4<br />
However, as shown in Figure 2.1.2, the positive link<br />
between urbanization and national productivity holds<br />
mainly for high- and middle-income countries, signaling<br />
healthy urbanization dynamics fueled by prosperous<br />
cities acting as magnets for rural migration. Low-income<br />
countries display a more mixed trend. While these countries<br />
as a whole experienced a fast pace of urbanization from<br />
1960 onward, GDP per<br />
capita remained largely<br />
unchanged, and even<br />
In OECD<br />
decreased, particularly FACT countries, the<br />
between 1970 and the<br />
GDP per capita is, on<br />
year 2000. This would<br />
average, 64 per cent<br />
higher in towns and<br />
suggest that, rather than<br />
cities than in rural<br />
being attracted by better<br />
areas. Similarly, in<br />
economic opportunities<br />
European cities with<br />
in urban areas (demand<br />
populations over<br />
pull’), rural migrants<br />
one million, average<br />
were only seeking refuge<br />
GDP per capita is<br />
25 per cent higher than<br />
from famine, war or other<br />
in the EU as a whole,<br />
calamities in what is often and 40 per cent higher<br />
referred to as ‘supply push‘ than that of their home<br />
nations. 3<br />
urbanization. 5
Figure 2.1.1<br />
Urbanization and per capita GDP across countries<br />
as % of base year, 1960–2010<br />
5.0<br />
4.5<br />
4.0<br />
3.5<br />
3.0<br />
2.5<br />
2.0<br />
1.5<br />
1.0<br />
0.5<br />
0.0<br />
GDP per capita<br />
Urban population (%)<br />
1960<br />
1965<br />
1970<br />
1975<br />
1980<br />
1985<br />
1990<br />
1995<br />
2000<br />
2005<br />
2010<br />
Note: Both time series are indexed to 1 in the initial year. The y value of<br />
each series shows the unit change with respect to the base year.<br />
Source: UNDESA (<strong>2012</strong>) urbanization; World Bank (<strong>2012</strong>) GDP per capita.<br />
The experience of the USA, Brazil, China and<br />
Kenya illustrates some of the specific factors at work<br />
in individual countries. Figure 2.1.3 shows that in the<br />
USA, urbanization rates and per capita income moved<br />
together until roughly 1940, when urbanization reached<br />
close to 60 per cent. Thereafter, per capita income grew<br />
37<br />
Productivity and the <strong>Prosperity</strong> of Cities<br />
more rapidly, reflecting<br />
the productivity gains<br />
from improvements in<br />
manufacturing and services<br />
as well as infrastructure<br />
investments made during<br />
the inter-war years. 6<br />
The correlation<br />
FACT between<br />
urbanization rates and<br />
productivity over the past<br />
five decades has also varied<br />
across and within regions,<br />
reflecting the multiplicity<br />
Brazil, a higher middle- of factors affecting both<br />
income country, underwent phenomena.<br />
a seemingly similar growthurbanization<br />
path until the<br />
late 1960s, when about half the population became urban.<br />
Thereafter, productivity neither grew significantly faster<br />
than urbanization, nor were productivity gains sustained,<br />
suggesting that urbanization alone may not guarantee<br />
continued productivity increases.<br />
China, a lower middle-income country, experienced<br />
a gradual increase in urbanization rates and productivity<br />
until the late 1970s, when urbanization reached 20 per cent.<br />
After the opening up of the economy in 1978, productivity<br />
increased at a much faster pace – GDP per capita grew<br />
by a factor of roughly 15 between 1978 and 2010, while<br />
the percentage of the urban population increased by a<br />
factor of ‘only’ 2.4 during the same period.<br />
Shenzen, China: inside the factory of the biggest CCTV<br />
surveillance camera producer in China.<br />
© Bartlomiej Magierowski/Shutterstock.com
State of the World’s Cities <strong>2012</strong>/<strong>2013</strong><br />
5.0<br />
4.5<br />
4.0<br />
3.5<br />
3.0<br />
2.5<br />
2.0<br />
1.5<br />
1.0<br />
0.5<br />
0.0<br />
5.0<br />
4.5<br />
4.0<br />
3.5<br />
3.0<br />
2.5<br />
2.0<br />
1.5<br />
1.0<br />
0.5<br />
0.0<br />
FACT<br />
Figure 2.1.2<br />
Trends in urbanization and national GDP per capita – for various levels of income, 1960–2010<br />
GDP per capita<br />
5.0<br />
High-income countries, 1960–2010 Higher middle-income countries, 1960–2010<br />
4.5<br />
5.0<br />
Lower middle-income countries, 1960–2010 Low-income countries, 1960–2010<br />
4.5<br />
1960<br />
1965<br />
1970<br />
1975<br />
1980<br />
1985<br />
1990<br />
1995<br />
2000<br />
2005<br />
2010<br />
Note: Both time series are indexed to 1 in the initial year. The y value of each series shows the unit change with respect to the base year.<br />
Source: UNDESA (<strong>2012</strong>) urbanization; World Bank (<strong>2012</strong>) GDP per capita.<br />
In the USA, New York City contributes about 10 per cent<br />
of the country’s GDP and only 6.3 per cent of the total<br />
population. The 10 US cities with the largest GDP produce<br />
36 per cent of the country’s goods and services and 24 per cent<br />
of the total population. 8 São Paulo – Brazil’s economic and<br />
financial capital accounts for 10 per cent of the population, but<br />
25 per cent of national GDP. 9 In China, the 53 metropolitan regions<br />
with populations over one million contribute about 62 per cent<br />
of national non-farm GDP and 29 per cent of the country’s<br />
population. In Kenya, Nairobi, with 8.4 per cent of the country’s<br />
population, accounts for almost 20 per cent of the country’s<br />
GDP. 10 Worldwide, the largest 100 cities accounted for around<br />
30 per cent of the total production of goods and services in 2008,<br />
with the top 30 cities alone accounting for around 18 per cent. 11<br />
38<br />
4.0<br />
3.5<br />
3.0<br />
2.5<br />
2.0<br />
1.5<br />
1.0<br />
0.5<br />
0.0<br />
4.0<br />
3.5<br />
3.0<br />
2.5<br />
2.0<br />
1.5<br />
1.0<br />
0.5<br />
0.0<br />
Urban population (%)<br />
1960<br />
1965<br />
1970<br />
1975<br />
1980<br />
1985<br />
1990<br />
1995<br />
2000<br />
2005<br />
2010<br />
Lastly, Kenya illustrates the experience of the limited<br />
number of low-income countries, mostly in Sub-Saharan<br />
Africa, where productivity<br />
growth was negligible even<br />
though urbanization rates<br />
continued to rise. 7<br />
POLICy<br />
FACTORS AFFECTING<br />
URBAN PRODUCTIvITy<br />
The factors determining<br />
urban productivity can<br />
be split into two broad<br />
categories: external factors<br />
that give cities additional<br />
comparative advantage,<br />
including national and<br />
Despite<br />
differences<br />
in the pace of<br />
productivity growth<br />
with respect to<br />
urbanization, the urban<br />
dominance in economic<br />
productivity is evident<br />
across countries. In<br />
other words, urban<br />
areas contribute<br />
disproportionately to<br />
national productivity.
1,200<br />
1,000<br />
Figure 2.1.3<br />
Urbanization and GDP per capita in selected countries<br />
800<br />
600<br />
400<br />
200<br />
0<br />
350<br />
300<br />
250<br />
200<br />
150<br />
100<br />
50<br />
0<br />
1880<br />
1960<br />
USA<br />
Brazil<br />
1965<br />
1970<br />
1890<br />
1900<br />
1910<br />
1920<br />
1930<br />
1940<br />
1975<br />
1980<br />
regional factors; and city-level factors that affect the city’s<br />
production function, such as physical infrastructure,<br />
growth management, human capital, and innovative and<br />
entrepreneurship spirits.<br />
ExTERNAL FACTORS<br />
External factors are largely beyond cities’ orbits of<br />
influence. Some of the differences in productivity among<br />
cities are explained by external factors, such as geographic<br />
location, as well as regional and national comparative<br />
advantages (Table 2.1.1).<br />
In terms of geographic location, coastal areas and river<br />
deltas have been preferred locations for cities. Currently,<br />
14 of the world’s 19 largest cities are port cities, which<br />
benefit from lower shipping costs and access through wider<br />
markets. 12 Natural beauty and warmer weather also give<br />
1985<br />
1990<br />
1995<br />
1950<br />
1960<br />
1970<br />
1980<br />
1990<br />
2000<br />
2010<br />
2000<br />
2005<br />
2010<br />
39<br />
1960<br />
1960<br />
1965<br />
1965<br />
1970<br />
1970<br />
1975<br />
1975<br />
Productivity and the <strong>Prosperity</strong> of Cities<br />
1980<br />
1980<br />
GDP per capita<br />
Note: Both time series are indexed to 100 in the initial year. The y value of each series shows the percentage change with respect to the base year.<br />
GDP per capita is in constant 2000 USD.<br />
Source: Source: UNDESA (<strong>2012</strong>) urbanization; World Bank (<strong>2012</strong>) GDP per capita.<br />
350<br />
300<br />
250<br />
200<br />
150<br />
100<br />
50<br />
0<br />
2,250<br />
2,000<br />
1,750<br />
1,500<br />
1,250<br />
1,000<br />
750<br />
500<br />
250<br />
0<br />
Kenya<br />
China<br />
1985<br />
1985<br />
Urbanization<br />
cities a comparative advantage, and have served to spur the<br />
growth of resort cities around the world, from the French<br />
Riviera to Punta del Este (Uruguay), Eilat (Israel), Jurmala<br />
(Latvia) or Las Palmas<br />
(Canary Islands).<br />
The importance of<br />
Cities located<br />
national comparative POLICy in countries<br />
advantage is illustrated by with a well-educated labour<br />
the fact that, while 22 of<br />
force, sound infrastructure,<br />
the top 30 largest urban<br />
mature financial markets,<br />
stable political systems and<br />
areas (by population) were<br />
firmly grounded market<br />
located in emerging or<br />
mechanisms have higher<br />
developing economies in<br />
productivity than those<br />
2008, only seven emerging located in countries that do<br />
economy cities ranked<br />
not offer these conditions.<br />
among the top 30 in terms<br />
1990<br />
1990<br />
1995<br />
1995<br />
2000<br />
2000<br />
2005<br />
2005<br />
2010<br />
2010
State of the World’s Cities <strong>2012</strong>/<strong>2013</strong><br />
of urban GDP. The group<br />
included Mexico City,<br />
São Paulo, Buenos Aires,<br />
Moscow, Shanghai, Mumbai<br />
and Rio de Janeiro, but<br />
no Middle Eastern or<br />
African cities. The average<br />
GDP per capita of these<br />
emerging/developing<br />
country cities tends to be<br />
substantially smaller than<br />
that of developed cities<br />
(Figure 2.1.4).<br />
Subsequent expansion<br />
in individual cities triggered<br />
the emergence of ‘city<br />
clusters,’ spurring the<br />
growth of second-tier cities such as Tianjin, Shijiazhuang<br />
and Tangshan, which respectively developed around Beijing;<br />
Zhuhai, Dongguan and Foshan around the provincial<br />
capital of Guangzhou; and Suzhou, Wuxi and Hangzhou in<br />
close proximity to Shanghai. These city clusters generated<br />
agglomeration economies at the regional level, expanding<br />
opportunities for trade and enhancing their (and their entire<br />
region’s) attractions for investors. 13 This cumulative effect<br />
has resulted in dramatic differences in productivity between<br />
coastal cities and their counterparts in the hinterland, with<br />
the growth differential<br />
surpassing 6 per cent,<br />
and the per capita fiscal<br />
revenues between the<br />
richest and the poorest<br />
provinces increasing from a<br />
ratio of 2:1 to 19:1. 14<br />
In China, national<br />
FACT policies have<br />
played a key role in<br />
improved productivity<br />
in coastal cities. Three<br />
Table 2.1.1<br />
External factors determining a city’s productivity<br />
Geographical Physical attributes<br />
comparative Climate<br />
advantage Location (e.g., ports, rivers)<br />
decades ago, China<br />
Natural endowments<br />
initiated policies designed<br />
Soils<br />
to promote economic<br />
growth in those cities<br />
through a combination<br />
of industrialization and<br />
financial incentives,<br />
putting them in a better<br />
position to compete for<br />
Regional<br />
comparative<br />
advantage<br />
Minerals<br />
Energy<br />
Natural beauty<br />
Archeological heritage<br />
Economic opportunities<br />
Access to markets, investors and skills<br />
Regional hubs and/or clusters<br />
foreign investment and<br />
infrastructure spending.<br />
National<br />
comparative<br />
Level of development<br />
Pool of labour, skills, scientific and<br />
advantage technological capital<br />
Social conditions (e.g., poverty, inequality)<br />
Economic infrastructure<br />
Institutional conditions<br />
Sound institutions<br />
Sound governance<br />
Political stability<br />
Maturity of financial markets<br />
Economic policies<br />
Ease of doing business<br />
Investment attractiveness<br />
Macroeconomic stability<br />
vision<br />
National leadership<br />
Figure 2.1.4<br />
Population, GDP per capita and total GDP for selected metropolitan areas (2008)<br />
2008 GDP per capita (Thousands US$ PPPs)<br />
100<br />
CITy-LEvEL FACTORS<br />
AFFECTING URBAN<br />
PRODUCTIvITy<br />
Cities play a key role in<br />
determining their own<br />
productivity, since many<br />
factors that affect urban<br />
productivity play out at<br />
the city level. Some of<br />
these factors are intrinsic<br />
to all urban areas –<br />
occurring naturally such<br />
as agglomeration and scale<br />
90<br />
Boston<br />
80<br />
70<br />
60<br />
Atlanta<br />
50<br />
40<br />
Houston Paris<br />
30<br />
Buenos Aires<br />
20<br />
Istanbul<br />
10<br />
Cairo<br />
0<br />
Lagos<br />
Karachi<br />
0 5 10<br />
40<br />
Los Angeles<br />
15<br />
Shanghai<br />
New York<br />
Sao Paulo**<br />
Mexico City<br />
Dhaka Mumbai (Bombay)****<br />
20 25<br />
2008 Population (Millions)<br />
30<br />
35<br />
Sphere surface represents<br />
total urban GDP<br />
(2008 US$bn PPPs)<br />
** New data found from national data sources on GDP per capita in all major Brazilian Cities including Sao Paulo and Rio de Janeiro.<br />
**** New data found from national data sources on GDP per capita in Mumbai (as well as Delhi, Bangalore and Kolkata in full rankings).<br />
Source: Data from PricewaterhouseCoopers (2009)<br />
Tokyo<br />
40<br />
45
Table 2.1.2<br />
City-specific factors determining a city’s productivity<br />
Intrinsic<br />
(natural)<br />
productivity<br />
growth<br />
factors<br />
Extrinsic<br />
productivity<br />
growth<br />
factors<br />
Economies of scale<br />
Provision of urban services<br />
Agglomeration economies<br />
Matching<br />
Sharing<br />
Learning<br />
Technical efficiency<br />
Structural efficiency<br />
Land management policies<br />
Space efficiency<br />
Infrastructure investment<br />
Taxation<br />
Disaster prevention<br />
Operational efficiency<br />
Day-to-day urban management<br />
Service delivery<br />
Emergency management<br />
Institutional scaffolding<br />
Sound local institutions (e.g., decentralization)<br />
Sound governance<br />
Ease of doing business<br />
Quality of life (quality of education, safety,<br />
cultural life, liveliness)<br />
Attractiveness to knowledge-base industries<br />
Attraction and retention of the ‘creative class’<br />
Learning-based efficiency<br />
Creativity and innovation<br />
Research and development and technological<br />
development<br />
Entrepreneurship<br />
vision<br />
Local leadership<br />
Local governance<br />
economies (Table 2.1.2). Other city-specific factors depend<br />
on the city’s ability to capitalize on the natural productivity<br />
potential of agglomeration economies (‘extrinsic cityspecific<br />
factors’).<br />
Intrinsic city-level factors15 One of the most obvious factors determining urban<br />
productivity is population growth. As a city’s population<br />
increases, so does the pool of workers and consumers.<br />
Agglomeration economies are the benefits firms derive<br />
from locating near customers and suppliers in order to<br />
reduce transport and communication costs and having<br />
access to a large labour pool. In larger cities, workers<br />
41<br />
FACT<br />
benefit from a wider range<br />
of potential employers,<br />
which lowers their risk of<br />
failure. Better matching<br />
between labour supply<br />
and demand results in<br />
greater flexibility, higher<br />
productivity and stronger<br />
growth for both workers<br />
and businesses. Cities also<br />
offer firms and residents<br />
access to a wider and better<br />
range of shared services<br />
and infrastructure. 16<br />
Extrinsic city-level<br />
factors<br />
As cities continue to<br />
grow, higher productivity<br />
comes to depend on other<br />
factors, such as the ability<br />
of a city to maximize<br />
the technical efficiency<br />
of urban systems, both<br />
structural and operational.<br />
Effective management<br />
of agglomeration<br />
diseconomies – including<br />
congestion and rising input<br />
Productivity and the <strong>Prosperity</strong> of Cities<br />
The concentration of infrastructure, people as well<br />
as economic, social and cultural activities, leads to<br />
substantial benefits and efficiency due to agglomeration and scale<br />
economies.<br />
prices – enables the population and businesses to maximize<br />
their own productive potential.<br />
This has been the case in Mumbai, where serious<br />
attempts to create an international financial hub have<br />
been defeated by chaotic local transport conditions<br />
together with a prohibitive property (rental) market, with<br />
FACT<br />
POLICy Agglomeration<br />
economies<br />
give cities a competitive<br />
advantage over rural<br />
areas, as well as large<br />
cities over smaller cities.<br />
Agglomeration economies<br />
also benefit densely<br />
populated areas within<br />
cities.<br />
POLICy<br />
The structural<br />
productivity<br />
of cities in part rests upon<br />
an efficient supply of<br />
serviced land and reliable<br />
infrastructure, including<br />
transport, power, water<br />
and sanitation as will as<br />
ICT. These are critical<br />
enabling factors of urban<br />
development, as they<br />
constitute basic inputs of<br />
productive activity and,<br />
if deficient, constitute<br />
a limiting constraint<br />
on growth and private<br />
investment.<br />
Lack of adequate infrastructure severely hinders the<br />
structural productivity of cities, limiting their capacity to<br />
achieve full potential.
State of the World’s Cities <strong>2012</strong>/<strong>2013</strong><br />
rents twice as high as<br />
Manhattan’s pushing major<br />
financial companies away<br />
from the city. 17<br />
The sound<br />
POLICy operation of<br />
cities, which encompasses<br />
traffic to emergency<br />
management, transport<br />
Several cities are<br />
services, garbage collection, actively expanding<br />
and the provision of urban infrastructure as part<br />
services that offer critical of their development<br />
support to social and<br />
strategies. Kenya’s<br />
economic activities are<br />
capital Nairobi is<br />
important determinants of<br />
the operational productivity<br />
developing transport<br />
of cities.<br />
and communications<br />
infrastructure, with<br />
tangible results in terms of<br />
efficiency and productivity<br />
in various economic sectors. Similar efforts are underway<br />
in Guadalajara in central Mexico in a bid to attract more<br />
high-technology firms (electronics and communications). As<br />
a result, production structures are undergoing rapid change,<br />
and suburban landscapes with them.<br />
Figure 2.1.5<br />
Factors hampering economic productivity<br />
per cent<br />
40<br />
35<br />
30<br />
25<br />
20<br />
15<br />
10<br />
5<br />
0<br />
Corruption/lack of good governance<br />
Lack of appropriate knowledge & skills development<br />
42<br />
For example, Rio de Janeiro’s newly established<br />
Operations Centre offers a glimpse of the way cities might<br />
be managed in the future. 18 Conceived as a city-wide<br />
decision-making mechanism for emergency situations<br />
based on real-time information, the centre integrates<br />
information from multiple departments and government<br />
agencies, Visual displays of data from various urban<br />
systems, including surveillance cameras, together with<br />
maps, news updates, information about incidents and<br />
even simulations, facilitate real-time monitoring and<br />
analysis. Although initially designed for forecasting floods<br />
and other emergencies, the Centre is also used for dayto-day<br />
management of urban functions. Similar projects<br />
have already been implemented in New York City and in<br />
Gauteng (South Africa). 19<br />
With the decline of physical constraints on cities and<br />
communities as a result of technological progress in recent<br />
decades, creativity and innovation have arguably become<br />
major driving forces of productivity and economic growth<br />
in urban areas.<br />
Cost of conducting business<br />
De�cient infrastructure<br />
Weak public institutions<br />
Poor access to information<br />
Africa Asia LAC Arab States All regions
FACT<br />
New technologies<br />
offer opportunities for<br />
enhanced urban management,<br />
making cities more efficient<br />
and productive.<br />
China: the Hexi Corridor, part of the historical Silk Route, remains economically important.<br />
© <strong>2012</strong> Edwina Sassoon/fotoLIBRA.com<br />
43<br />
FACT<br />
Productivity and the <strong>Prosperity</strong> of Cities<br />
While physical factors are undoubtedly<br />
key determinants of productivity,<br />
local experts around the world emphasize<br />
the importance of ‘soft’ factors. Specifically,<br />
corruption and lack of good governance were<br />
identified as the most significant barriers<br />
to economic productivity by 25 per cent of<br />
the local experts surveyed by UN-Habitat<br />
(Figure 2.1.5). Additional factors included the<br />
high cost or difficulty of doing business, weak<br />
institutions, insufficient knowledge and skills,<br />
deficient infrastructure and poor access to<br />
information.
State of the World’s Cities <strong>2012</strong>/<strong>2013</strong><br />
FACT<br />
Cities that succeed<br />
in fostering the<br />
exchange of ideas and<br />
innovations are able to tap<br />
into growth dynamics that<br />
fuel the creation of social<br />
and intellectual capital,<br />
thereby further contributing<br />
to their productivity.<br />
POLICy<br />
Cities that<br />
succeed in<br />
educating, attracting<br />
and retaining creative<br />
individuals are more likely<br />
to prosper, as they not only<br />
generate new ideas and<br />
products but, in turn, also<br />
attract high-value added<br />
firms, such as knowledgebased<br />
industries.<br />
Some cities are<br />
strengthening comparative<br />
advantage by showcasing<br />
their tangible and<br />
intangible heritage and<br />
exploiting their cultural<br />
identity, in an effort to<br />
bring about social and<br />
economic transformation. 20<br />
Doha, for example, is<br />
developing education and<br />
arts as part of the city’s new<br />
cultural vision. 21 Gaziantep<br />
in eastern Turkey has<br />
started to use cultural<br />
heritage as a touristic<br />
asset for the purposes<br />
of increased prosperity.<br />
Heritage restoration and<br />
rehabilitation enhance<br />
quality of life while<br />
contributing to economic<br />
development. 22<br />
Talent, in turn, is a<br />
function of the quality of<br />
school systems and higher<br />
education. Many cities in<br />
the developing world are<br />
faced with brain drain<br />
due to lack of local and<br />
national policies to retain<br />
highly qualified individuals.<br />
With the exception of<br />
Asia, where about half of<br />
the local experts perceive<br />
that cities are making<br />
efforts to retain talent, the<br />
proportions are alarmingly<br />
low in other regions.<br />
There are exceptions,<br />
though: Dubai emphasizes<br />
higher education and<br />
training in engineering and<br />
information technologies. 23 Chongqing has developed an<br />
ambitious training programme to support the transition of<br />
rural migrants from manual-based to skill-based types of<br />
work; by 2009, nearly one-third of migrants had benefited<br />
from the scheme. 24<br />
A city’s existing<br />
FACT talent pool is<br />
a major determinant of<br />
productivity. The more<br />
highly skilled a city’s<br />
population, the more likely it<br />
is to attract more talent.<br />
By offering an<br />
POLICy environment<br />
conducive for Research and<br />
Development, cities can be<br />
key players in a knowledgebased<br />
economy, as there<br />
is a direct link between<br />
Research and Development,<br />
technology and productivity.<br />
44<br />
Some cities in developing countries have embraced<br />
the model of world-class innovation clusters, such as<br />
California’s Silicon Valley or Boston’s Route 128, to become<br />
‘high-tech hubs’. Those that have met with success in<br />
this endeavour, such as India’s Bangalore, owe it to the<br />
same basic factors: the presence of top-quality academic<br />
and research institutions as well as substantial public and<br />
corporate investment. However, some observers claim<br />
that the city needs to pay more attention to infrastructure<br />
development and to ensure that the benefits of growth are<br />
more evenly distributed across all the population.<br />
Quality of life is rapidly emerging as a major asset<br />
in any efforts to attract and retain creative minds and<br />
businesses. It comes as no surprise that Toronto, San<br />
Francisco or Stockholm should consistently rank among<br />
the top performing cities in the world, since they are found<br />
as performing particularly well in a wide range of both<br />
economic and quality of life indicators, crime, green areas,<br />
air quality and life satisfaction. Outside the more developed<br />
nations, Singapore, with a similar balance of quality of life<br />
attributes, also ranks among the top world cities and the<br />
highest among developing countries.<br />
URBAN PRODUCTIvITy: SOME CHALLENGES<br />
While China’s urban population increased from 17 to<br />
39 per cent within a span of 40 years (from 1963 to 2003),<br />
the same change in urban population took 120 years in<br />
Great Britain and 80 years in the USA. 26 Cities in more<br />
advanced countries are better positioned to capitalize on<br />
the agglomeration economies associated with population<br />
growth. This is not just because that growth is more<br />
manageable (typically around one per cent per year); but<br />
also because, as suggested by their high GDP per capita,<br />
these cities already have the physical and institutional<br />
support needed to capitalize on that demographic<br />
potential. Such capacities are generally not available in<br />
developing countries,<br />
leaving fast-expanding<br />
cities more exposed<br />
to the agglomeration<br />
diseconomies which<br />
prevent them from<br />
fully capitalizing on the<br />
productivity potential<br />
associated with sustained<br />
population growth<br />
(typically an annual rate<br />
of two to four per cent or<br />
FACT<br />
Top performing<br />
cities derive<br />
their strengths not<br />
just from their status<br />
as global economic<br />
powerhouses or<br />
from sophisticated<br />
infrastructure, but<br />
also from their ability<br />
to enhance quality of<br />
life. 25
more). Despite the difficulty, some cities such as Shenzhen,<br />
China has made remarkable progress as indicated in the<br />
box below.<br />
This is the case of Dhaka the capital city of Bangladesh,<br />
with an average annual population growth of 4.4 per cent<br />
between 1990 and 2008. The ninth largest city in the world,<br />
Dhaka is one of the fastest growing in Asia. While some of<br />
the population growth has only reflected recent expansion<br />
boundaries, the Dhaka region has long attracted migrants<br />
from rural areas looking for opportunities in the booming<br />
metropolis. They provide much-needed labour in rapidly<br />
Box 2.1.1<br />
Shenzhen: Capitalizing on the gains of urban growth<br />
Shenzhen is one of the world’s fastest growing cities. During<br />
the past 30 years, Shenzhen’s GDP per capita ranked first<br />
among China’s major cities – averaging a phenomenal<br />
27 per cent annual growth in urban GDP. Notably, the gains<br />
from Shenzhen’s fast pace of industrialization, urbanization<br />
and modernization have served to enhance the quality of<br />
life of all its residents. Income and living conditions have<br />
improved steadily. A new social security and public health<br />
insurance system has been successfully implemented. The<br />
city’s Gini coefficient has remained around 0.3, far less than<br />
that of the other cities on the mainland, denoting the city’s<br />
efforts to achieve an equitable growth pattern. 27<br />
Perceptions of experts regarding the distribution of<br />
economic prosperity<br />
per cent<br />
20<br />
15<br />
10<br />
5<br />
0<br />
Figure 2.1.6<br />
Africa<br />
Asia<br />
LAC<br />
Arab States<br />
Source: UN-Habitat, City Monitoring Policy Survey, 2011<br />
All regions<br />
45<br />
Productivity and the <strong>Prosperity</strong> of Cities<br />
growing sectors of the<br />
economy. Fueled by the<br />
continuous growth in the<br />
financial, manufacturing<br />
and telecommunications<br />
sectors, annual GDP<br />
is an estimated USD75<br />
billion. 28 At the same<br />
time, Dhaka’s GDP per<br />
capita is the lowest of all<br />
mega-cities, suggesting<br />
that agglomeration<br />
diseconomies are likely<br />
to have offset a large<br />
proportion of the potential<br />
Not all cities are<br />
FACT fully capitalizing<br />
on the gains of population<br />
growth.<br />
benefits associated<br />
with strong population FACT<br />
growth. In other words,<br />
the productivity gains<br />
associated with such<br />
growth would have been<br />
remarkable if only Dhaka<br />
had been able to manage<br />
its growth more effectively<br />
and distribute benefits it in<br />
a more equitable manner.<br />
As shown in<br />
Figure 2.1.6, urban experts<br />
from all regions share the<br />
same grim assessment, with<br />
Asia showing just a slightly<br />
more positive outlook – as<br />
20 per cent of local experts<br />
perceive that economic prosperity is evenly distributed,<br />
compared to 14 per cent in the Middle East and roughly<br />
7 per cent in Africa and Latin America.<br />
Unfortunately,<br />
The fast pace<br />
POLICy of urbanization<br />
in developing countries<br />
presents both challenges<br />
and opportunities for the<br />
productivity of cities.<br />
Dhaka’s experience<br />
is not exceptional. In the UN-<br />
Habitat survey, urban experts<br />
expressed scepticism<br />
regarding the progress being<br />
made towards distributing<br />
the benefits of a prosperous<br />
city. In cities like Bangalore,<br />
Ho Chi Minh and Chongqing,<br />
the benefits of economic<br />
prosperity are perceived to<br />
be captured mainly by the<br />
educated class; in Alexandria<br />
and Nairobi, mostly by the<br />
wealthy; while in Santo<br />
Domino, Dubai and Dar-es-<br />
Salam, largely by politicians.<br />
HOW TO RAISE A CITy’S PRODUCTIvITy? SOME<br />
GENERAL POLICy GUIDELINES<br />
While urban productivity is generally linked to stable<br />
macroeconomic conditions, sound institutions and<br />
adequate infrastructure, the focus of policy actions will<br />
depend on a city’s level of development.<br />
The management of urban growth is particularly<br />
important if rapidly expanding cities in early stages<br />
of development must be able fully to capitalize on the<br />
natural benefits of agglomeration economies and to<br />
reduce future inefficiencies.
State of the World’s Cities <strong>2012</strong>/<strong>2013</strong><br />
Ineffective land management, inadequate spending<br />
on infrastructure, distorting taxation schemes and unduly<br />
cumbersome business regulations are detrimental to any<br />
city’s structural productivity.<br />
POLICy<br />
As cities progress<br />
along the development<br />
path, they must facilitate<br />
production processes, addressing<br />
the technical and organizational<br />
inefficiencies that hinder structural<br />
and operational productivity.<br />
POLICy<br />
The importance<br />
of sound<br />
governance structures<br />
to prevent corruption,<br />
together with strong local<br />
institutions, and businessconducive<br />
regulations,<br />
cannot be overemphasized.<br />
46<br />
It is important to identify any barriers that prevent<br />
any city from maximizing its productivity potential. In<br />
this regard, reducing traffic congestion, enhancing mass<br />
transit options and providing efficient, reliable services are<br />
POLICy<br />
Cities at the early stages of development need<br />
to strive towards enhancing good transport<br />
connectivity to its markets and providing access to<br />
adequate health and basic education to its population.<br />
China: docks on the Huangpu river, which flows through the centre of Shanghai. The Huangpu is a tributary of the Yellow River, joining it just<br />
before that river flows into the East China Sea, and thus the port has developed as a major import/export hub.<br />
© Claudio Zaccherini/Shutterstock.com
major determinants in any city’s operational productivity.<br />
In addition, cities at intermediate levels of development<br />
should also enhance their technological capacities with a<br />
sharper focus on higher education and training as well as<br />
ICT infrastructure.<br />
While the factors at work are less easy to grasp than<br />
in the case of technical efficiency, experience from around<br />
the world points to the importance of supporting research<br />
and development in quality higher education and research<br />
institutions with both public and corporate investment.<br />
Promoting an entrepreneurial spirit, particularly among<br />
youth, is a desirable strategy for any city, regardless of<br />
development level or economic strength. Similarly, far<br />
from a desirable though ultimately dispensable aspiration,<br />
enhancing overall quality of life should be considered as<br />
essential to any economic development strategy if a city is to<br />
attract creative people and businesses.<br />
Leadership will always be always a critical factor,<br />
be it collective, as exercised through sound governance<br />
systems, or individual, i.e. relying on a particularly inspiring<br />
Endnotes<br />
1 Bodin-Buyle Z., and C. Hermant-De Callataÿ (2011), Urban <strong>Prosperity</strong> and Quality of<br />
Life in European cities – Beyond GDP, Background paper prepared for “State of the<br />
World’s Cities Report <strong>2012</strong>/<strong>2013</strong>” as part of EU /UN-Habitat collaboration.<br />
2 UN-Habitat (2010), State of the World’s Cities 2010/2011 : Cities for All: Bridging the<br />
Urban Divide.,Earthscan,London<br />
3 European Commission (2009) Promoting Sustainable Urban Development in Europe:<br />
Achievements and Opportunities. European Commission , Brussels<br />
4 World Bank (<strong>2012</strong>) World Bank Data: World Development Indicators & Global Development<br />
Finance, Online database last updated July 9 <strong>2012</strong>, http://data.worldbank.org<br />
5 Buckley, R. and A. Kallergis (2011) The Wealth of Cities and Equitable Growth,<br />
background paper for ‘State of the World Cities Report <strong>2012</strong>/13’<br />
6 Buckley, R. and A. Kallergis (2011) op. cit.<br />
7 Buckley, R. and A. Kallergis (2011) op. cit.<br />
8 PricewaterhouseCoopers (2009) ‘Global city GDP rankings 2008-2025’<br />
PricewaterhouseCoopers UK Economic Outlook, November 2009, London. http://www.<br />
ukmediacentre.pwc.com/Media-Library/Global-city-GDP-rankings-2008-2025-61a.aspx<br />
9 Cities Alliance (2006) Guide to City Development Strategies: Improving Urban<br />
Performance, Cities Alliance, Washington, D.C. http://www.citiesalliance.org/ca/sites/<br />
citiesalliance.org/files/CA_Docs/resources/cds/cds-guidelines/role_of_cities.pdf<br />
10 Kenya’s 2008 GDP (PPP current International), total population, population in the<br />
largest city: World Development Indicators (<strong>2012</strong>); Nairobi’s 2008 GDP (PPP):<br />
PricewaterhouseCoopers (2009).<br />
11 PricewaterhouseCoopers (2009) op. cit.<br />
12 UN-Habitat (2008) State of the World’s Cities Report 2008/09: Harmonious Cities.<br />
UN-Habitat, Nairobi.<br />
13 ActiveUKChina (<strong>2012</strong>) Business and economic distributions and clusters, http://www.<br />
activeukchina.com/business-environment/business-and-economic-distributionsand-clusters/<br />
14 UN-Habitat (2008) op. cit.<br />
15 This section draws heavily from Turok, I. (2011) Urban Employment and the <strong>Prosperity</strong> of<br />
Cities. Background paper prepared for “State of the World’s Cities Report <strong>2012</strong>/<strong>2013</strong>”<br />
47<br />
politician or local figure.<br />
It takes leadership to<br />
change the prevailing urban<br />
paradigm and develop<br />
the transformative vision<br />
that will not just boost<br />
productivity of a city, or<br />
region, or even country, but<br />
also broadly distribute the<br />
associated benefits for the<br />
sake of shared prosperity.<br />
POLICy<br />
Productivity and the <strong>Prosperity</strong> of Cities<br />
POLICy<br />
To be able to<br />
sustain higher<br />
wages and the associated<br />
standards of living, more<br />
advanced cities need to<br />
tap into innovation-driven<br />
productivity gains by<br />
supporting businesses’<br />
ability to compete based<br />
on more sophisticated<br />
and innovative production<br />
processes and products.<br />
To enhance productivity, cities at all stages of<br />
development must seek support from a wide range<br />
of stakeholders, including various public authorities, other urban<br />
areas in the same region, and major economic actors, and set in<br />
motion the process of desirable change.<br />
16 As noted by Turok, see Jacobs,J. (1969) The Economy of Cities, London, Jonathan<br />
Cape; Jacobs, J. (1984) Cities and the Wealth of Nations, New York, Random House;<br />
Porter, M. (1998) ‘Clusters and the new economics of competitiveness’, Harvard<br />
Business Review, December, pp.77-90.<br />
17 Bloomberg Business Week, April 23, 2011 as quoted by Buckley, R. and A. Kallergis<br />
(2011) op. cit.<br />
18 Rio’s Operation Centre builds upon advanced technologies created by IBM Research<br />
labs around the world.<br />
19 Astroman (2011) City Government and IBM Close Partnership to Make Rio<br />
de Janeiro a Smarter City, January 3, http://www.astroman.com.pl/index.<br />
php?mod=magazine&a=read&id=871<br />
20 Spirou, C. (2011) Urban Tourism and Urban Change: Cities in a Global Economy, New<br />
York, Routledge,<br />
21 Mena, A. (2011) City Report on Doha. Unpublished UN-Habitat background study for<br />
“State of the World’s Cities Report <strong>2012</strong>/<strong>2013</strong>”<br />
22 Kurtul,P. F. (2011) City Report on Gaziantep. Unpublished UN-Habitat background<br />
study for “State of the World’s Cities Report <strong>2012</strong>/<strong>2013</strong>”<br />
23 Al-Bassam, D. and J. Mouris (2011) City Report on Dubai. Unpublished UN-Habitat<br />
background study for “State of the World’s Cities Report <strong>2012</strong>/<strong>2013</strong>”<br />
24 Liu, Y. and Y. Wang (2011) City Report on Chongqing. Unpublished UN-Habitat<br />
background study for “State of the World’s Cities Report <strong>2012</strong>/<strong>2013</strong>”<br />
25 PricewaterhouseCoopers (2010) Cities of opportunities. PricewaterhouseCoopers/<br />
The Partnership for New York City, Inc. http://www.pwc.com/us/en/cities-ofopportunity/2011/pdfdownload.jhtml<br />
26 China’s urban growth rates: UNDESA (WUP): US’ and Great Britain’s urban growth<br />
rates: Buckley, R. and A. Kallergis (2011) op. cit.<br />
27 J Jin, L. and Y. Liu (2011) City Report on Shenzhen. Unpublished UN-Habitat<br />
background study for “State of the World’s Cities Report <strong>2012</strong>/<strong>2013</strong>”.<br />
28 PricewaterhouseCoopers (2009) op. cit.
Chapter 2.2<br />
Urban Infrastructure:<br />
Bedrock of <strong>Prosperity</strong><br />
Infrastructure is crucial for the development, functionality<br />
and prosperity of urban areas. It provides the foundation<br />
on which any city will thrive. Adequate infrastructure –<br />
improved water and sanitation, reliable and sufficient<br />
power supply, efficient transport networks and modern<br />
information and communication technologies (ICTs) –<br />
FACT<br />
The cities that<br />
have managed<br />
to attract investment and<br />
enhance competitiveness<br />
in a highly globalized<br />
economy are those that<br />
have vastly improved the<br />
range and quality of their<br />
infrastructure. Conversely,<br />
poor infrastructure is<br />
a major impediment to<br />
development, poverty<br />
reduction and improved<br />
standards of living.<br />
POLICy<br />
Cities that<br />
fail to provide<br />
adequate infrastructure are<br />
less likely to be prosperous<br />
and sustainable in terms<br />
of balancing economic and<br />
social development, and<br />
environmental protection. 1<br />
48<br />
contributes to the sustainability and economic growth<br />
of urban areas, promotes the competitiveness of local<br />
businesses, improves labour productivity, enhances the<br />
investment climate in the city and contributes to its<br />
attractiveness. Physical infrastructure like roads, power<br />
and communication facilities, improves urban connectivity,<br />
which is essential to induce growth and reduce poverty.<br />
There is a positive link between the provision of<br />
infrastructure and the level of urbanization. More<br />
urbanized countries tend to provide more infrastructures<br />
(Figure 2.2.1).<br />
Mexico: aerial view of Guadalajara.<br />
© Jesus Cervantes/Shutterstock.com
Figure 2.2.1<br />
Infrastructure provision is closely related to levels of urbanization<br />
TRENDS IN <strong>THE</strong> PROvISION <strong>OF</strong> URBAN<br />
INFRASTRUCTURE: IMPORTANT<br />
REGIONAL vARIATIONS<br />
Differences in infrastructure across regions have<br />
implications for the prosperity of cities and reflect a variety<br />
of factors, including levels of income or development,<br />
economic growth, pace of urbanization, technical<br />
capacities and political commitment. The lowest levels<br />
of infrastructure provision are to be found in urban<br />
Africa (average water and sanitation coverage is 89 and<br />
69 per cent respectively; electricity: 69 per cent; paved<br />
roads: 28 per cent; fixed telephone lines: 4 per cent;<br />
mobile telephones and Internet connectivity: 57 and<br />
10 per cent, respectively). Asian cities have strongly<br />
invested in infrastructure development in the last few<br />
decades, achieving nearly<br />
POLICy<br />
Infrastructure is the<br />
most common entry<br />
point to achieving<br />
prosperity in cities;<br />
consequently,<br />
prioritizing<br />
infrastructure is<br />
part of long-term<br />
economic development<br />
for most cities.<br />
social development,<br />
and environmental<br />
protection. 1<br />
universal provision of<br />
water, electricity and<br />
mobile telephone services.<br />
In particular, China has<br />
pursued a conscious<br />
strategy of infrastructureled<br />
growth since the<br />
1990s. Investment in<br />
this area increased from<br />
5.7 per cent of GDP in<br />
1998 to 14.4 per cent in<br />
2006. 2 During the same<br />
period, India increased<br />
infrastructure spending<br />
49<br />
Urban Infrastructure: Bedrock of <strong>Prosperity</strong><br />
Access to water(%) Access to sanitation(%)<br />
100<br />
100<br />
90<br />
90<br />
80<br />
80<br />
70<br />
60<br />
r=0.4907<br />
70<br />
60<br />
r=0.4778<br />
50<br />
50<br />
40<br />
40<br />
30<br />
30<br />
20<br />
20<br />
10<br />
0<br />
Improved water<br />
10<br />
0<br />
Improved sanitation<br />
0 10 20 30 40 50 60 70 80 90 100 0 10 20 30 40 50 60 70 80 90 100<br />
% urban % urban<br />
from 4.1 per cent to 5.6 per cent of GDP. The average for<br />
Latin America and the Caribbean is under two per cent of<br />
GDP3 , compared with Africa’s estimated 5–6 per cent. 4<br />
Makoko district of Lagos, Nigeria: a man bathes in fresh water<br />
sold to him by a nearby wealthy family.<br />
© Jacob Silberberg/Panos Pictures
State of the World’s Cities <strong>2012</strong>/<strong>2013</strong><br />
Figure 2.2.2<br />
Infrastructure coverage by region<br />
percentage of urban population<br />
with improved water<br />
per cent<br />
100<br />
90<br />
80<br />
70<br />
60<br />
50<br />
40<br />
30<br />
20<br />
10<br />
0<br />
Africa<br />
Asia<br />
LAC<br />
Developing countries<br />
World<br />
�xed telephone lines mobile cellular subscriptions internet users broadband (�xed) subscriptionsper<br />
per 100 inhabitants per 100 inhabitants per 100 inhabitants per 100 inhabitants<br />
25<br />
120<br />
40<br />
12<br />
20<br />
100<br />
35<br />
30<br />
10<br />
15<br />
80<br />
25<br />
8<br />
60<br />
20<br />
6<br />
10<br />
40<br />
15<br />
4<br />
5<br />
20<br />
10<br />
5<br />
2<br />
0<br />
0<br />
0<br />
0<br />
Africa<br />
Asia<br />
LAC<br />
Developing countries<br />
World<br />
percentage of urban population<br />
with improved sanitation<br />
Africa<br />
Asia<br />
LAC<br />
Developing countries<br />
World<br />
Africa<br />
Asia<br />
LAC<br />
Developing countries<br />
World<br />
Water Supply: When Good Governance<br />
Changes the Equation<br />
Adequate water supply is essential for environmental<br />
sustainability and quality of life. Access to clean water<br />
reduces morbidity and mortality, and improves the<br />
productive abilities of the poor.<br />
Water scarcity characterizes African cities. Although<br />
official statistics reveal that 89 per cent of the urban<br />
population in Africa is now enjoying improved water<br />
supply, a large majority of Sub-Saharan African cities<br />
experience regular water shortages. The UN-Habitat<br />
survey shows that 11 of the 14 African cities (79 per cent)<br />
under review are associated with serious such problems.<br />
Experts concur that worst affected are Ibadan and Dar es<br />
Salaam, closely followed by Accra, Addis Ababa, Luanda,<br />
50<br />
percentage of urban population<br />
with electricity<br />
Africa<br />
Asia<br />
LAC<br />
Developing countries<br />
World<br />
Africa<br />
Asia<br />
LAC<br />
Developing countries<br />
World<br />
paved roads as a percentage<br />
of total<br />
Source: WHO/UNICEF (2010); International Energy Agency (2010); International Road Federation (2009); ITU World Telecommunication/ICT Indicators<br />
Database (2010)<br />
Africa<br />
Asia<br />
LAC<br />
Developing countries<br />
World<br />
Africa<br />
Asia<br />
LAC<br />
Developing countries<br />
World<br />
Lusaka, Lagos and Nairobi, which suffer continuous water<br />
shortages. Despite 78 to 98 per cent of households in<br />
four of these cities – Accra, Lagos, Nairobi and Lusaka –<br />
benefiting from improved access to water, most experts<br />
also mention them as experiencing severe water shortages.<br />
Interestingly, despite its semi-arid climate and its location<br />
in a water-scarce country, Gaborone is where shortages<br />
are least severe, suggesting good water governance.<br />
The water shortage pattern is more mixed in Asian<br />
cities: half of the cities in the UN-Habitat survey experience<br />
water shortages. Those with the more severe shortages<br />
are Cebu, Davao, Bangalore, Lahore, and Hyderabad. In<br />
Bangalore, water is supplied once in 46 hours for a period<br />
of 2–3 hours. 5 This trend had been observed by one analyst<br />
who noted that: “no South Asian city can supply water
24/7 to its residents”. 6 On the other hand, water scarcity is<br />
unknown in Singapore, according to all local respondents to<br />
the survey. Other cities where water shortages are perceived<br />
to be relatively insignificant include Chongqing, Gaziantep,<br />
Kuwait City and Shenzhen.<br />
Water shortages vary a lot in Latin American cities:<br />
The UN-Habitat survey revealed that eight of the<br />
15 cities under review in this region were found to have<br />
serious water shortages, including Havana, Panama City,<br />
Guarenas (Venezuela), Lima, Ciudad del Este (Paraguay)<br />
and Guadalajara. Cities with moderate water scarcity<br />
are Tijuana, La Paz and Valparaíso. Those cities without<br />
perceived water shortages are Medellín, Fort de France<br />
(French Antilles) and Montevideo.<br />
Differences in shortages across cities reflect local<br />
conditions and the state of water management. In 2011,<br />
Havana experienced its worst water shortage since 1961<br />
due to the effects of drought and depletion of fresh<br />
supplies as well as a deteriorated network (70 per cent in<br />
poor condition).7 In contrast, regular supplies in Medellín<br />
reflect sound management by Empresas Públicas de<br />
Medellín (EPM), one of the most successful public utility<br />
companies in Latin America. In 2009, EPM launched<br />
the Water Programme Litros de Amor to provide free-ofcharge<br />
water (a daily 25 litres per head) to economically<br />
poor households. 8<br />
Limited water shortages in Arab State cities: Despite<br />
their typical location in hyper-arid regions, Arab state<br />
cities generally do not suffer from severe water shortages.<br />
However, according to local experts, three of the surveyed<br />
cities are finding water supply a major challenge: Amman,<br />
Basra and Saida (Lebanon). In Amman, the situation is<br />
quite critical with supplies only once or twice a week. 9<br />
In Basra, the supply<br />
falls short of around<br />
33 per cent of the needs<br />
of the population. 10<br />
Residents often complain<br />
about quality (taste,<br />
smell and colour). 11<br />
POLICy<br />
Arab cities deemed to be<br />
meeting their water needs<br />
include Aqaba, Doha,<br />
Al-Muharrak (Bahrain),<br />
Dubai and Erbil.<br />
There are remarkable<br />
inter-city differences<br />
in experts’ perceptions<br />
Cities<br />
authorities<br />
need to systematically<br />
maintain their stock<br />
of infrastructure to<br />
ensure that the benefits<br />
of infrastructure are<br />
fully capitalized. It<br />
is in their interest to<br />
improve coordination<br />
with the different<br />
levels of government<br />
in the design, provision<br />
and maintenance of<br />
infrastructure.<br />
51<br />
FACT<br />
Urban Infrastructure: Bedrock of <strong>Prosperity</strong><br />
The success of Singapore in meeting local water demand<br />
is down to effective water governance. The specialized<br />
agency has developed a long-term strategy known as the Four<br />
National Taps to ensure a robust and sustainable supply of<br />
water. The strategy entails using water from different water<br />
sources: water catchment, recycled water, desalinated water and<br />
imported water.<br />
FACT<br />
Many Arab cities are able to meet their water<br />
requirements because of the high political priority<br />
given to the provision of this public good. 12 City authorities have<br />
improved water security through increased supplies, demand<br />
management, conservation and desalination. 13<br />
Saudi Arabia: an old water tower, a well-known feature in the<br />
city of Riyadh.<br />
© Fedor Selivanov/Shutterstock.com
State of the World’s Cities <strong>2012</strong>/<strong>2013</strong><br />
Box 2.2.1<br />
Ranking of Urban Infrastructure<br />
UN-Habitat survey experts report that across all developing<br />
regions the least developed components of urban infrastructure<br />
relate to recreation, sanitation and urban transport, while the<br />
most developed is telecommunications; all of this has important<br />
implications for urban prosperity. For instance, the low priority<br />
Ranking <br />
ranking<br />
5.0<br />
most developed<br />
least developed<br />
4.5<br />
4.0<br />
3.5<br />
3.0<br />
2.5<br />
2.0<br />
1.5<br />
1.0<br />
0.5<br />
0<br />
Water<br />
Sanitation<br />
Electricity<br />
Telecommunications<br />
Transport infrastructure<br />
Recreation<br />
Water<br />
Sanitation<br />
Electricity<br />
Telecommunications<br />
Transport infrastructure<br />
Recreation<br />
regarding the coverage and quality of urban infrastructure.<br />
These differences are discussed below with respect to water,<br />
roads and ICTs.<br />
Trends in Road Infrastructure<br />
The road network will rank amongst any city’s most prized<br />
assets, as it facilitates the movement of people and goods.<br />
Apart from access, road networks also form the basic grid<br />
for trunk infrastructure for water, sanitation and power<br />
supplies. Roads also contribute to effective mobility, which<br />
is crucial for the prosperity of cities. Congested roads<br />
and poor facilities for pedestrians are the most pervasive<br />
transport problems affecting cities in developing countries.<br />
The UN-Habitat survey shows that to a large majority<br />
of experts – 96 per cent in Africa; 91 per cent in Asia;<br />
88 per cent in Latin America; and 80 per cent in Arab<br />
states – traffic congestion is the main form of infrastructure<br />
deficiency plaguing cities in those regions, hindering<br />
52<br />
given to recreational infrastructure implies that access to public<br />
spaces in many cities is limited, as indicated in Chapter 2.3<br />
(Quality of Life). Similarly, the low priority given to urban transport<br />
has wider-ranging implications, in this case for intra- and interurban<br />
mobility.<br />
Africa Asia LAC Arab States All regions<br />
Source: UN-Habitat, City Monitoring Branch, Policy Survey,<br />
Water<br />
Sanitation<br />
Electricity<br />
Telecommunications<br />
Transport infrastructure<br />
Recreation<br />
free movement and making travel frustrating and time-<br />
consuming. 14<br />
Water<br />
Sanitation<br />
Electricity<br />
Telecommunications<br />
Transport infrastructure<br />
Recreation<br />
Water<br />
Sanitation<br />
Electricity<br />
Telecommunications<br />
Transport infrastructure<br />
Recreation<br />
Road infrastructure remains poor in African cities:<br />
In most African cities, roads account for less than<br />
seven per cent of land area, compared with 25–30 per cent<br />
in developed cities. 15 In cities such as Kinshasa, Kampala<br />
and Ouagadougou, paved roads account for less than<br />
12 per cent of the whole urban network. In many cities, the<br />
road network has barely<br />
kept pace with urban<br />
growth: in Douala, for<br />
instance, it has remained<br />
unchanged for the past 20<br />
years despite a doubling of<br />
the population, increased<br />
numbers of vehicles,<br />
and urban sprawl. 16 FACT<br />
The<br />
dysfunctional nature of<br />
Road<br />
congestion,<br />
poor facilities for<br />
pedestrians, power<br />
outages and flooding<br />
are major infrastructural<br />
deficiencies, and thus<br />
adversely affect the<br />
prosperity of cities.
oad infrastructure in Africa poses a major challenge to<br />
mobility and prosperity and is an important source of<br />
congestion. In addition to this, poor maintenance is a major<br />
problem: only 18.5 per cent of experts across African cities<br />
believe that infrastructure is systematically maintained.<br />
Some African cities have taken innovative steps to<br />
enhance mobility and tackle traffic congestion. Lagos<br />
introduced Bus Rapid Transit (BRT) in 2008. South Africa’s<br />
Gauteng Province launched in 2010 the ‘Gautrain’, a stateof-the-art<br />
80-km mass rapid transit railway system. Cities<br />
like Nairobi and Dakar have achieved significant progress<br />
in the development of road infrastructure increasing<br />
prosperity prospects.<br />
Significant improvements in road infrastructure in<br />
Asian cities: In recent years, various Asian countries have<br />
embarked on ambitious programmes of road development<br />
and expansion. In 1997, India started the Golden<br />
Quadrilateral motorway to connect the country’s largest<br />
cities – Kolkata, Delhi, Mumbai and Chennai. An East-<br />
West corridor has also been recently completed, not just<br />
improving connections between cities but also opening up<br />
the hinterlands. In China, cities have been at the forefront<br />
of massive infrastructure development with emphasis on<br />
new roads and subway systems. The urban road network<br />
more than doubled between 1990 and 2003, 19 largely<br />
contributing to urbanization and economic growth. Cities<br />
like Beijing and Shanghai have extended infrastructure to<br />
suburban areas in a bid to match spatial expansion. Beijing<br />
currently allocates 30 per cent of its construction budget to<br />
mass transit20 and Shanghai spends 10 per cent of its GDP<br />
on infrastructure, of which 40 per cent is for transportation.<br />
Singapore’s public transportation system is considered to be<br />
one of the most integrated and well-planned in the world.<br />
In addition, adequate facilities are provided for pedestrians<br />
with a safe and comfortable<br />
walking environment that<br />
enhances quality of life.<br />
In major Asian<br />
Massive economic<br />
FACT cities, some<br />
growth in Asia, particularly<br />
11 per cent of land<br />
space is devoted to<br />
China and India, has<br />
roads, well below the spurred spectacular<br />
20–30 per cent rate increases in the numbers<br />
common in US cities. of motor vehicles. This<br />
has contributed to traffic<br />
congestion, air and<br />
noise pollution, road<br />
accidents and energy use<br />
in the region. In India,<br />
21<br />
In Indian cities, the<br />
proportion varies from<br />
21 per cent in Delhi to<br />
11 per cent in Mumbai<br />
to five per cent in<br />
Kolkata. 22<br />
53<br />
FACT<br />
Urban Infrastructure: Bedrock of <strong>Prosperity</strong><br />
A notable feature of the transport system in African cities<br />
is the virtual absence of State-operated public transport.<br />
The private sector is the major provider of transport services,<br />
often in the form of secondhand mini- and microbuses, shared<br />
taxis, and more recently commercial motorcycles. 17 The needs of<br />
pedestrians are hardly taken into consideration despite the fact<br />
that walking accounts for over 60–70 per cent of trips in cities<br />
such as Conakry, Douala or Kinshasa. 18<br />
the number of passenger<br />
vehicles increased by nine<br />
million, or 12.9 per cent,<br />
between 2007 and 2008. 23<br />
In China, the number of<br />
vehicles increased 10-fold<br />
between 1990 and 2002; of<br />
particular significance is the<br />
increase in motorcycles and<br />
scooters, which increased<br />
from just 200,000 in 1981<br />
to 50 million in 2002.<br />
Latin America and<br />
the Caribbean region<br />
features the highest level<br />
of motorization in the<br />
developing world: the<br />
region has five times more<br />
cars than sub-Saharan<br />
Africa and Asia, and<br />
about twice as many as the<br />
Middle East and North<br />
Africa. 26 Motorization<br />
in the region increased from 100 vehicles per 1,000 in<br />
1990 to 155 in 2005, before reaching 169:1,000 in 2008.<br />
Rising incomes, expanding middle classes, high levels of<br />
urbanization, an expanding local automobile industry, and<br />
availability of low-cost vehicles are the major forces driving<br />
motorization in the region. As a result, cities in the region<br />
experience severe traffic congestion. A great majority<br />
of experts in the UN-Habitat survey (over 80 per cent)<br />
indicate that the roads in their respective cities are<br />
congested, costing the region USD2.2 billion a year in lost<br />
productivity. 27 In India, public<br />
FACT transport accounts<br />
for only 22 per cent<br />
of urban trips among<br />
ever-increasing numbers<br />
of private vehicles.<br />
Time spent in traffic deteriorates quality<br />
of life, causing pollution, traffic accidents, increased fuel<br />
consumption and emission of greenhouse gases.<br />
In São Paulo, public transport as a share of all trips<br />
declined from 46 per cent in 1977 to 33 per cent in 1997 and<br />
24 A<br />
greater proportion of these<br />
vehicles are concentrated<br />
in only a few cities: New<br />
Delhi, Mumbai, Kolkata<br />
and Bangalore, which host<br />
five per cent of India’s<br />
population but 14 per cent<br />
of registered vehicles. 25<br />
Cities must<br />
POLICy address the<br />
road congestion problems<br />
that adversely affect their<br />
prosperity
State of the World’s Cities <strong>2012</strong>/<strong>2013</strong><br />
FACT<br />
A trend closely associated with motorization in Latin<br />
American and Caribbean cities is the decreasing share of<br />
public transport.<br />
POLICy<br />
It would be in the best interests of cities to develop<br />
sustainable public transport solutions that have<br />
positive repercussions on all ‘spokes’ of prosperity.<br />
down to 29 per cent in 2001. 28 In Havana, the total number<br />
of public transport users declined from 3.5 million in 1991<br />
FACT<br />
Bogotá and Curitiba<br />
feature the highest<br />
shares of dedicated bus<br />
lanes in the region, which<br />
have served as models for<br />
BRT across the world.<br />
to 540,000 in 2011. 29 In<br />
Guadalajara the use of<br />
private cars increased<br />
from 30 to 50 per cent of<br />
all trips between the years<br />
2000 and 2010, while the<br />
number of public transport<br />
users declined from 60 to<br />
Curitiba, Brazil: a tubular bus station and sleek, modern bus, part of the city’s integrated transport system.<br />
© Paul Smith/Panos Pictures<br />
54<br />
30 per cent. 30 Factors behind these sharp declines include a<br />
poor perception of public bus services; lack of information on<br />
availability, routes and schedules; crime and safety concerns;<br />
and the long distances that commuters have to walk to bus<br />
stops/terminals.<br />
Cities in the Arab States have the highest level of<br />
vehicle ownership: The quality and maintenance of roads in<br />
Arab cities are high when compared with other developing<br />
countries. However, despite massive investment, the<br />
expansion in road networks has not matched rapid increases<br />
in vehicle numbers, or urban sprawl. Over the past two<br />
decades, the Arab region has witnessed phenomenal rises in<br />
motorization. In 2008, the total number of vehicles reached<br />
26.7 million – growing at a 4.2 per cent annual average<br />
between 1997 and 2008. 31 In Bahrain, Kuwait, Qatar, the<br />
United Arab Emirates and Oman, the ratios of motor vehicles<br />
per 1,000 stand at 509, 507, 724, 313 and 225, respectively. 32<br />
Factors behind this trend include the affluence occasioned by<br />
the oil-driven economic boom, a strong preference for private<br />
cars, subsidized fuel, greater availability of car loans, and lack<br />
of effective mass transit systems. High levels of motorization<br />
in Arab cities have led to<br />
chronic traffic congestion.<br />
The traffic situation in<br />
Dubai typifies those of cities<br />
in the Gulf Cooperation<br />
Council countries: with<br />
over one million cars,<br />
the ownership ratio –<br />
541:1,000 – exceeds those<br />
of London (345) and New<br />
York (444). 33<br />
Dubai‘s Metro began<br />
operating as a fully<br />
automated rail transit<br />
FACT Public<br />
transport<br />
systems are inadequate<br />
in many cities of this<br />
region. For instance,<br />
in Beirut, fewer<br />
than 10 per cent of<br />
commuters are served<br />
by public transport 34 ;<br />
in Amman, the<br />
corresponding figure is<br />
14 per cent. 35
system in 2009, and when fully operational in <strong>2012</strong> is<br />
expected to reduce car use by 30 per cent. 36 In 2010, the<br />
Greater Amman Municipality launched a USD175 million<br />
Box 2.2.2<br />
Information and communication technologies (ICTs) and the <strong>Prosperity</strong> of Cities<br />
Over the past decade, worldwide expansion in ICTs has been<br />
nothing short of phenomenal. In the sole mobile telephony<br />
area, for instance, the total number of subscriptions increased<br />
from 962 million in 2001 to six billion in 2011 – resulting in a<br />
worldwide ratio of 867:1,000. 38 It is worth noting that developing<br />
countries account for over 75 per cent of global mobile cellular<br />
subscriptions. No other component of infrastructure has<br />
witnessed such spectacular growth. Advances in ICTs and<br />
liberalization of telecommunications markets have led to wealth<br />
creation and economic growth, with cities the major beneficiaries.<br />
ICTs play a major role in any city’s competitiveness, productivity<br />
and prosperity as they facilitate innovation, efficiency and<br />
effective service delivery. An overwhelming majority of surveyed<br />
experts – 85 per cent in Africa; 96 per cent in Asia; 86 per cent in<br />
Latin America and the Caribbean; and 90 per cent in Arab States –<br />
rank telecommunications infrastructure as ‘highly developed’ or<br />
‘developed’ in their cities.<br />
FACT<br />
In Africa, the total number of mobile telephone<br />
connections has grown an average 30 per cent<br />
per annum since 2001, and by 2011 over 60 per cent<br />
of the population was connected. In Asia-Pacific,<br />
the number of mobile connections increased from<br />
824 million in 2005 to three billion in 2011– making<br />
the region the largest mobile telephone market in<br />
the world. Remarkable growth rates have also been<br />
recorded in the Middle East, where the number of mobile<br />
connections increased from 177 million in 2007 to<br />
334 million in 2011. 39<br />
ICTs in African cities: Mobile telephones have leapfrogged<br />
landlines in Africa when compared with developed regions that<br />
invested in landlines before moving to mobile networks. 40 At least<br />
90 per cent of households in Abuja, Accra, Dakar, Lagos, Luanda<br />
and Nairobi own mobile telephones; even where ownership<br />
of mobile telephones appears to be low, it hardly falls below<br />
50 percent. The use of mobile telephones surpasses fixed lines<br />
in virtually all cities. In Kinshasa, there are 119 times as many<br />
households owning mobile telephones as fixed lines. In Lagos,<br />
Harare, Kampala and Mombasa, households are 12 times more<br />
likely to own mobile telephones than landlines. Apart from<br />
facilitating connectivity and communication, the cell-phone<br />
industry also serves as a catalyst for growth, contributing an<br />
55<br />
Urban Infrastructure: Bedrock of <strong>Prosperity</strong><br />
BRT project along three busy corridors totaling 32km; when<br />
completed in <strong>2012</strong>, the system will have a transport capacity<br />
of 6,000 passengers per hour. 37<br />
estimated average USD56 billion or 3.5 per cent of GDP, to the<br />
regional economy every year, 41 as well as employment for over<br />
five million Africans.<br />
ICTs in Asian cities: Mobile telephony has also expanded<br />
dramatically in this region. India’s four major cities – Delhi,<br />
Mumbai, Kolkata and Chennai – feature mobile telephone<br />
connection rates of 138 per cent, 112 per cent, 102 per cent and<br />
143 per cent respectively. 42 In Singapore, telecommunications<br />
infrastructure is highly developed. In 2010, the household fixedline<br />
penetration rate was 103 per cent, and the mobile population<br />
penetration rate was 144 per cent, with 82 per cent of households<br />
having access to Internet. 43 ICTs are major contributors to<br />
economic growth in Asia accounting for USD485 billion, or<br />
2.7 per cent of GDP; they also provide 11.4 million jobs – for<br />
each job created by a mobile operator, eight additional ones<br />
are generated. 44 The major role played by the mobile telephone<br />
sector has seen it act as a buffer against economic recession in<br />
the region.<br />
ICTs in Latin American cities: The ownership of mobile<br />
telephones is fairly widespread. Urban areas in Brazil, Chile,<br />
Panama, and Paraguay feature the highest connection rates, with<br />
at least 80 per cent of households owning mobile telephones. 45<br />
In major Mexican cities, ownership varies between 66 and<br />
84 per cent of the population. Compared with Africa and Asia,<br />
fixed lines are more developed in Latin American cities. For<br />
instance, between 41 per cent and 68 per cent of households<br />
in Mexico’s major cities have fixed lines. The mobile telephone<br />
industry contributes significantly to the region’s economy:<br />
1.7 per cent of regional GDP 46 (or USD82 billion) in 2010.<br />
Increases in mobile telephone connectivity have also been found<br />
to boost GDP per capita.<br />
ICTs in Arab States cities: Urban ownership of mobile<br />
telephones in Arab States, especially Gulf Cooperation Council<br />
countries, is widespread. Penetration rates in Doha, Dubai,<br />
Amman, Kuwait, Muscat and Riyadh are in excess 100 per cent<br />
(Dubai’s penetration rate is the highest in the world with over<br />
200 mobile telephones per 100 residents). The UAE and other Gulf<br />
Cooperation Council countries have invested in ITC-dedicated<br />
parks as a boost to socioeconomic growth and diversification<br />
away from an oil-dependent to a knowledge-based economy. The<br />
ICT sector plays a significant role in the region’s economy. In the<br />
case of the UAE, the sector contributed 5.3 per cent to GDP in<br />
2010, up from 4.1 per cent in 2007, and currently employs over<br />
11,500. 47
State of the World’s Cities <strong>2012</strong>/<strong>2013</strong><br />
Box 2.2.3<br />
Infrastructure Development and the Dimensions of <strong>Prosperity</strong><br />
Contribution of Infrastructure to the <strong>Prosperity</strong> of Cities<br />
per cent<br />
100<br />
90<br />
80<br />
70<br />
60<br />
50<br />
40<br />
30<br />
20<br />
10<br />
0<br />
per cent<br />
100<br />
90<br />
80<br />
70<br />
60<br />
50<br />
40<br />
30<br />
20<br />
10<br />
0<br />
Africa<br />
LAC<br />
Economic growth<br />
Mobility<br />
Access to health & education<br />
Quality of life<br />
Urban Growth<br />
Environmental quality<br />
Improving slum conditions<br />
Reducing spatial disparities<br />
Source: UN-Habitat, City Monitoring Branch, Policy Survey, 2011<br />
Arab States All cities<br />
56<br />
Asia<br />
Economic growth<br />
Mobility<br />
Access to health & education<br />
Quality of life<br />
Urban Growth<br />
Environmental quality<br />
Improving slum conditions<br />
Reducing spatial disparities<br />
POLICy<br />
Consistent and<br />
targeted investments<br />
in transport and<br />
communications<br />
infrastructure are a<br />
major factor behind<br />
urban prosperity.<br />
Economic growth<br />
Mobility<br />
Access to health & education<br />
Quality of life<br />
Urban Growth<br />
Environmental quality<br />
Improving slum conditions<br />
Reducing spatial disparities
It is possible to identify the specific contributions adequate<br />
infrastructure can make to the prosperity of cities, but it must be<br />
remembered that they are interrelated and interact with one another<br />
in a variety of ways. As perceived by experts participating in the<br />
UN-Habitat survey, these contributions are the following (by order<br />
of decreasing importance): economic growth; facilitating mobility;<br />
improving access to health and education; improving quality of life;<br />
steering spatial expansion; environmental quality; improving slum<br />
conditions and reducing poverty; and reducing spatial disparities.<br />
These eight types of contribution are presented in the charts for the<br />
four regions under review.<br />
Economic Growth: Infrastructure plays a crucial role in supporting<br />
economic growth, and it is worth noting that the reverse causal<br />
relationship also holds – that is, infrastructure benefits from<br />
economic growth. Infrastructure contributes to growth through<br />
enhanced productivity of the factors of production. Indeed between<br />
1990 and 2005, improved infrastructure contributed one per cent<br />
to per capita economic growth in Africa, and 1.2 per cent in<br />
Asia. 48 In Africa, the greatest impact has been attributed to<br />
telecommunications and, to a lesser extent, roads.<br />
Facilitating Mobility: Seamless movement within and between<br />
cities thanks to efficient mass transit systems is essential to the<br />
proper functionality and prosperity of cities. Cities that have deployed<br />
sustainable transport policies to enhance mobility have reaped huge<br />
advantages that positively impact on the other ‘spokes’ of prosperity.<br />
In Bogotá and Curitiba, for instance, BRT makes both cities more<br />
livable in very tangible ways, including reducing traffic congestion,<br />
decreasing travel times and costs, reducing energy consumption and<br />
improving environmental quality.<br />
Access to health and education: Infrastructure facilitates access<br />
to health and education, which are essential components of<br />
human development and feature prominently among Millennium<br />
Development Goals. Healthy children learn better and healthy<br />
adults work better – both being major assets to the city. Education<br />
is crucial to empowerment, reducing poverty and enhancing<br />
productivity. Cities with a healthier, better-educated workforce are<br />
more likely to be productive and competitive.<br />
Improving quality of life: Infrastructure can improve quality of<br />
life in a variety of ways, including: enhancing safety and security,<br />
especially for youth and women; and expanding the provision of<br />
public goods to enhance the city’s appeal.<br />
57<br />
POLICy<br />
Urban Infrastructure: Bedrock of <strong>Prosperity</strong><br />
The provision of infrastructure must take into<br />
consideration the needs of women.<br />
Steering spatial expansion: Infrastructure can steer the spatial<br />
expansion of a city, facilitating more compact urban development<br />
and integrating different land uses. This urban form is deemed<br />
to be efficient, inclusive and sustainable in four different ways:<br />
(1) the costs of infrastructure are cheaper; (2) access to services<br />
and facilities is improved; (3) the livelihoods of the urban poor are<br />
enhanced; and (4) social segregation is reduced.<br />
Environmental quality: Many developing country cities are<br />
characterized by inadequate water supply and squalid conditions in<br />
terms of sanitation. These two components of infrastructure are vital<br />
to improved environmental conditions in cities, as they facilitate a<br />
clean and pollution-free environment. On top of this, flood-control<br />
infrastructure safeguards urban areas against erosion, flooding,<br />
landslides and disasters.<br />
Improving slum conditions and reducing poverty: Infrastructure<br />
can contribute to the prosperity of cities through improved slum<br />
conditions and reducing poverty. Providing adequate infrastructure<br />
for roads, water, sanitation and electricity can reduce the health<br />
burden faced by slum dwellers, delivering major benefits in terms of<br />
environmental quality.<br />
Reducing spatial disparities: Infrastructure can reduce spatial<br />
disparities, particularly in uncontrolled and un-serviced peri-urban<br />
areas, connecting them to consolidated parts of the city.<br />
POLICy<br />
Beneficiary communities must be fully<br />
involved in the design, provision and<br />
maintenance of infrastructure.
State of the World’s Cities <strong>2012</strong>/<strong>2013</strong><br />
Endnotes<br />
1 Choguill, C. (1996) “Ten steps to sustainable infrastructure”, Habitat International, Vol.<br />
20(3), pp. 389-4044; Teriman, S., T. Yigitcanlar, and S. Mayere (2010) ‘Sustainable<br />
urban infrastructure development in south east Asia : evidence from Hong Kong,<br />
Kuala Lumpur and Singapore’ in Yigitcanlar, T. (ed.) Sustainable Urban and Regional<br />
Infrastructure Development : Technologies, Applications and Management, IGI Global,<br />
Hershey, Pennsylvania<br />
2 Lall, R., R. Anand and A. Rastogi (2010) ‘Developing physical Infrastructure: A<br />
comparative perspective on the experience of China and India’, in Gerhaeusser K.,<br />
Iwasaki, Y. and V. B. Tulasidhar, (eds) Resurging Asian Giants’ Asian Development<br />
Bank, Manila, pp.57-114.<br />
3 Fay, M. and M. Morrison (2005) Infrastructure in Latin America and the Caribbean:<br />
Recent Developments and Key Challenges, World Bank, Washington,DC.<br />
4 Foster, V., and C. Briceno-Garmendia (2010) Africa’s Infrastructure: A Time for<br />
Transformation, World Bank, Washington, DC.<br />
5 Belliapa, S.G. (2011) City Report on Bangalore. Unpublished UN-Habitat background<br />
study for “State of the World’s Cities Report <strong>2012</strong>/13”<br />
6 Harris, C (2008) “India Leads Developing Nations in Private Sector Investment”,<br />
Gridlines, No.3, March 2008, http://www.pppinindia.com/pdf/gridlines.pdf<br />
7 Latin American Herald Tribune (2011) ‘Cuban Capital Faces Worst Water Shortage in<br />
50 Years’, Latin American Herald Tribune, http://laht.com/article.asp?ArticleId=3915<br />
53&CategoryId=14510<br />
8 López , M (2011) Water Distribution as an Indicator of Social Inequality: The Case of<br />
Medellín, Colombia, http://www.centrodametropole.org.br/static/uploads/marcela_l.pdf<br />
9 Shabou, A., N. Soboh, K. Jalouka, and D. A. Thaib (2011) City Report on Amman.<br />
Unpublished UN-Habitat background study for “State of the World’s Cities Report<br />
<strong>2012</strong>/<strong>2013</strong>”<br />
10 Karim, S. S.A. (2011) City Report on Basra. Unpublished UN-Habitat background study<br />
for “State of the World’s Cities Report <strong>2012</strong>/<strong>2013</strong>”<br />
11 Takechi, A (2010) Basrah Water Supply from viewpoint of Its Water Sources, http://<br />
www.waterforum.jp/jpn/iraq/doc/expert_meeting/session/4_2.pdf<br />
12 Although the region is the least provided in the world, with just 1.4 per cent of the<br />
planet renewable freshwater. {Roudi-Fahimi, F., L. Creel and R. M. De Souza (2002)<br />
Finding the Balance: Population and Water Scarcity in the Middle East and North<br />
Africa, MENA Policy Brief, Population Reference Bureau, Washington, DC}<br />
13 The Arab State’s Region is host to 65 of the world’s 100 largest desalination plants.<br />
{Pacific Institute (2011) The World’s Water Volume 7: The Biennial Report on<br />
Freshwater Resources, Table 21, http://www.worldwater.org/data.html}<br />
14 The economic costs of traffic congestion are staggering: in the US in 2010 it<br />
was put at $101 billion in terms of lost productivity and wasted fuel, or $713 per<br />
commuter per year; in Mauritius, traffic congestion in cities costs the economy 1.3<br />
per cent of GDP. {African Economic Outlook (2011) Mauritius: Overview, http://www.<br />
africaneconomicoutlook.org/en/countries/southern-africa/mauritius/}<br />
15 Kumar , A., and F. Barrett (2008) Stuck in Traffic: Urban Transport in Africa, World<br />
Bank, Washington, DC<br />
16 Kumar,A. (2011) Understanding the Emerging Role Of Motorcycles in African<br />
Cities: A Political Economy Perspective, Sub-Saharan Africa Transport Policy<br />
Program Discussion Paper No. 13, World Bank, http://siteresources.worldbank.org/<br />
EXTAFRSUBSAHTRA/Resources/1513929-1262811948762/DP13-Role-Motorcycles.<br />
pdf<br />
17 In 2007, Lagos had over 100,000 minibuses and 200,000 commercial motorcycles<br />
directly employing 500,000 people. Kumar (2011)<br />
18 Kumar and Barrett (2008), op. cit.<br />
19 The network increased from 95,000 to 208,000 km from 1990 to 2003. Pucher et<br />
al (2007)<br />
20 McKinsey Global Institute (2009) Preparing for China’s Urban Billion, McKinsey and<br />
Company.<br />
21 World Bank (2002) Cities on the Move: A World Bank Urban Transport Strategy<br />
Review, World Bank, Washington, DC.<br />
22 Pucher, J., Z. Peng, N. Mittal, Y. Zhu,and N. Korattyswaroopam (2007) ‘Urban transport<br />
trends and policies in China and India: Impacts of rapid Economic growth’, Transport<br />
Reviews, Vol. 27 (4), pp. 379–410<br />
58<br />
23 Uddin, A. (2009) ‘Traffic Congestion in Indian Cities: Challenges of a Rising Power’,<br />
paper presented at the conference Kyoto of the Cities, Naples, March 26-28,<br />
2009, http://www.visionwebsite.eu/UserFiles/File/filedascaricare/Scientifci%20<br />
Partners,Papers(Kyoto)/Draft_koc_Azeem%20Uddin.pdf<br />
24 HPEC (2011) Report on Indian Urban Infrastructure and Services,National Institute of<br />
Urban Affairs, New Delhi<br />
25 Uddin, A (2009) op.cit.<br />
26 Estimated from World Bank (2011)<br />
27 Canassa, H. (2008) ‘São Paulo Traffic Jams Mean Lost Business, Stress, Helicopters’,<br />
Bloomberg, July 14, http://www.bloomberg.com/apps/news?pid=newsarchive&sid=<br />
aAwzOeXmIxgk<br />
28 Vicentini, V. L.(2010) ‘Lessons from urban transport in Latin America and the<br />
Caribbean’, presentation at the 2010 ADB Transport Forum, May 25-27, Manila;<br />
Luoma, J., M. Sivak and S. Zielinski (2010) The Future of Personal Transportation in<br />
Megacities of the World, Transportation Research Institute, University of Michigan,<br />
Ann Arbor<br />
29 Coyula, M. (2011) City Report on Havana. Unpublished UN-Habitat background study<br />
for “State of the World’s Cities Report <strong>2012</strong>/<strong>2013</strong>”<br />
30 Perez, F. (2011) City Report on Guadajara. Unpublished UN-Habitat background study<br />
for “State of the World’s Cities Report <strong>2012</strong>/<strong>2013</strong>”.<br />
31 ESCWA (2009) Transport for Sustainable Development in the Arab Region: Measures,<br />
Progress Achieved, Challenges and Policy Framework, United Nations, New York,<br />
http://www.uncclearn.org/sites/www.uncclearn.org/files/unescwa14.pdf<br />
32 World Bank (2011) World Development Indicators, World Bank, Washington, DC.<br />
33 Shariff, O. (2007) ‘Dubai Traffic Woes Inflict Losses of Dh4.6b a Year’, Gulf News,<br />
December 13, http://gulfnews.com/business/shipping/dubai-traffic-woes-inflictlosses-of-dh4-6b-a-year-1.75892;<br />
Raouf, M. A. (2009)’Towards sustainable<br />
transportation’, Gulf News, September 18, http://gulfnews.com/opinions/columnists/<br />
towards-sustainable-transportation-1.539872<br />
34 Kollock, P. (2010) ‘Still Sitting in Beirut Traffic’, NOW Lebanon, May 5 http://www.<br />
nowlebanon.com/NewsArchiveDetails.aspx?ID=166121<br />
35 Shabou, A., N. Soboh, K. Jalouka, and D. A. Thaib (2011) op. cit.<br />
36 Raouf, M. A. (2009) op. cit.<br />
37 Al-Rawashdeh, A. (2011) “New bus system aims to reduce Amman’s traffic<br />
congestion”, Al-Shorfa.com, January 26, http://al-shorfa.com/en_GB/articles/meii/<br />
features/main/2011/01/26/feature-02<br />
38 International Telecommunication Union (2010) World Telecommunication/ICT<br />
Indicators Database, http://www.itu.int/ITU-D/ict/statistics/<br />
39 GSM Association (2011a) Asia Pacific Mobile Observatory 2011, GSMA, London<br />
40 Aker, J. C. and I. M. Mbiti, (2010) ‘Mobile telephones and economic development in<br />
Africa’, Journal of Economic Perspectives, Vol. 24(3), pp. 207-232<br />
41 GSM Association (2011b) Africa Mobile Observatory 2011, GSMA, London<br />
42 Philip, J. T. (2009) ‘Average Urban Teledensity Crosses 100% Mark’, The Economic<br />
Times, December 12, http://articles.economictimes.indiatimes.com/2009-12-12/<br />
news/28416388_1_cent-mark-mobile-connections-teledensity<br />
43 Centre for Livable Cities (2011) City Report on Singapore. Unpublished UN-Habitat<br />
background study for “State of the World’s Cities Report <strong>2012</strong>/<strong>2013</strong>”<br />
44 GSM Association (2011a) op. cit.<br />
45 Fernández-Ardèvol, M. (2010) ‘Household access to mobile telephony in Latin<br />
America’, in Sevensson, J. and G. Wicander, (eds.): Proceedings of the 2nd<br />
International Conference on M4D,Mobile Communication Technology for<br />
Development, 10-11 November, Kampala, Uganda, pp. 60-69.<br />
46 GSM Association (2011c) Latin American Mobile Observatory 2011, GSMA London<br />
47 Telecommunications and Regulatory Authority (2011) UAE Telecommunications<br />
Sector Developments and Indicators, 2007 –2010.<br />
48 Calderón, C (2008) “Infrastructure and growth in Africa”, Policy Research Working<br />
Paper 4914, World Bank, Washington, DC
Chapter 2.3<br />
Quality of Life and<br />
Urban <strong>Prosperity</strong><br />
Today no one disputes that quality of life is essential<br />
for a city to prosper. The notion is increasingly used by<br />
decision-makers, practitioners and urban populations<br />
alike. Everyone agrees on its importance, but everyone<br />
will also agree that this notion comes with different<br />
meanings and facets. Many efforts have been made to<br />
develop a policy-oriented definition, yet the essence<br />
of quality of life remains vague when applied to urban<br />
areas. Despite these different views and understandings,<br />
the very basic notion remains largely similar both in the<br />
developed and the developing world: peoples in Jakarta,<br />
Naples, Los Angeles or Bogotá will, to large extent,<br />
share similar concerns, including decent employment,<br />
material wellbeing, fulfilling family lives and good<br />
health. Individuals and specific circumstances may<br />
value one of these factors over others; yet, as noted in<br />
the Report by the French Government Commission on<br />
the Measurement of Economic Performance and Social<br />
Progress (2009), these constitute “the most important<br />
features that give life its value.” 1<br />
MEASURING QUALITy <strong>OF</strong> LIFE<br />
Recently, efforts have turned from definition to scientific<br />
measurement of quality of life. To Nobel laureate<br />
Amartya Sen, quality of life is determined by the various<br />
opportunities open to individuals, and their freedom to<br />
choose from these many opportunities. 3 Other conceptual<br />
approaches measure quality of life based on the notion of<br />
subjective well-being and on economic notions drawn from<br />
welfare economics. 4 The most comprehensive subjective<br />
measurement of quality of life is the World Values Survey,<br />
59<br />
which reflects representative<br />
individuals’ beliefs and<br />
values in 54 countries around<br />
the world. 5 More recent<br />
measurements of quality of<br />
life combine subjective and<br />
objective measures. In 2003,<br />
the European Environmental<br />
Agency investigated eight<br />
domains of individual<br />
life situations in 25 EU<br />
member states, ranging<br />
from economic situation,<br />
housing and employment<br />
to work-life balance, health,<br />
subjective well-being and<br />
perceived quality of life. 6<br />
The international human resource consulting firm, Mercer,<br />
focuses on the quality of life of expatriates, taking in criteria<br />
such as availability of consumer goods, the economic<br />
environment, the natural, political and social environments<br />
as well as recreation amenities. 7<br />
The choice<br />
FACT of indicators<br />
reflects the audience for<br />
which the indices are<br />
being created. The UN-<br />
Habitat city prosperity<br />
index is primarily aimed<br />
at city leaders and<br />
national governments.<br />
Therefore, the quality<br />
of life indicators in the<br />
index include health<br />
and education and<br />
various infrastructure<br />
indicators.<br />
QUALITy <strong>OF</strong> LIFE: A SyN<strong>THE</strong>SIS <strong>OF</strong> ALL<br />
DIMENSIONS <strong>OF</strong> PROSPERITy<br />
Quality of life underpins the<br />
functionality of cities: the<br />
notion is at the crossroads<br />
of all policies and actions8 ,<br />
and a synthesis of all the<br />
dimensions of prosperity.<br />
When a city generates<br />
employment and economic<br />
growth, quality of life<br />
improves. When a city<br />
designs better buildings<br />
FACT<br />
“Quality of life<br />
is often tied<br />
to the opportunities<br />
available to people,<br />
to the meaning and<br />
purpose they attach to<br />
their lives and to the<br />
extent to which they<br />
enjoy the possibilities<br />
available to them”. 2
State of the World’s Cities <strong>2012</strong>/<strong>2013</strong><br />
and public spaces that<br />
Cities that<br />
provide attractive,<br />
POLICy improve quality<br />
secure, clean and<br />
of life experience higher<br />
durable surroundings,<br />
levels of prosperity; they<br />
are also likely to find<br />
it is improving quality<br />
themselves more advanced<br />
of life. When a city<br />
in terms of sustainability.<br />
provides adequate<br />
public transport, it<br />
improves quality of<br />
life for both users<br />
and non-users. When a city raises levels of education and<br />
provides good healthcare it is ensuring quality of life for<br />
the foreseeable future. And when a city reduces the use<br />
of environmental resources and becomes more energyefficient,<br />
it also improves quality of life.<br />
According to the<br />
UN-Habitat survey<br />
(2011), on balance experts<br />
value security to live<br />
and work freely, good<br />
quality of education,<br />
adequate housing with<br />
basic services, and<br />
meaningful employment<br />
and decent income as the<br />
most important factors<br />
FACT<br />
Experts from<br />
52 cities consider<br />
quality of life as the second<br />
most important dimension<br />
promoting prosperity in<br />
cities, after infrastructure<br />
development.<br />
POLICy<br />
It is in any city’s<br />
best interest to<br />
promote public goods such<br />
as public transport, green<br />
areas and public spaces<br />
and ‘urban commons’ such<br />
as safety and security and<br />
political participation in<br />
order to enhance quality of<br />
life and shared prosperity.<br />
60<br />
promoting quality of life and prosperity in their cities.<br />
In Europe, a survey on perceived quality of life in<br />
75 cities (2010) shows that ‘the three most important issues<br />
for the city’ were: educational facilities, job creation/reduce<br />
unemployment and the availability and quality of health<br />
services, among seven other alternatives such as social<br />
services, housing conditions, air pollution, noise, public<br />
transport, infrastructure and safety. 9<br />
It remains that, as perceived by experts and residents<br />
in developing and developed countries alike, the quality of<br />
urban life is a broader concept that includes a full range of<br />
factors such as economic development, living standards,<br />
material progress and individual and collective wellbeing,<br />
which all are important dimensions of prosperity.<br />
Accessibility, environmental sustainability and health: cyclists on dedicated cycle lanes in<br />
Copenhagen, Denmark.<br />
© Anne-Britt Svinnset/Shutterstock.com
Treating Quality of Life as a By-product<br />
UN-Habitat survey results show that the more committed<br />
the city is to promote quality of life, the more the chances<br />
that the effects will be broad-ranging. There is a clear<br />
positive association between a high degree of commitment<br />
to address quality of life and the possibility of designing<br />
specific policies. Unfortunately, the opposite also applies,<br />
and many cities treat quality of life as a by-product or an<br />
‘after-effect’ of policy interventions. Even where some cities<br />
perform well under other dimensions of prosperity, they<br />
fail to deliver better quality of life. Abidjan, Dakar, Dar<br />
es Salam and Kampala illustrate well this situation: they<br />
feature moderate or weak values in the “City <strong>Prosperity</strong><br />
Index”, but rank even much lower for quality of life, which<br />
goes to show that this dimension cannot be considered as an<br />
indirect component of any urban policy agenda.<br />
A number of studies have shown that the various<br />
determinants of quality of life generate complex interactions<br />
and diverse causal relations. Sometimes, efforts to promote<br />
one element can have unexpected detrimental effects<br />
on other elements; for example, prioritizing economic<br />
growth per se can result in negative environmental<br />
impacts. In other cases, positive linkages between<br />
these determinants are quite obvious; for instance, the<br />
provision of green open spaces brings health benefits to<br />
the population. In some other cases, the relationship can<br />
be less evident; for example, individual housing choices<br />
may have environmental impacts that affect quality of<br />
life in different ways. 10 All too often, cities do not clearly<br />
perceive the complexity of these interactions and assume<br />
that interrelations will always be positive. Several cities<br />
in Asia and the Arab States that are experiencing high<br />
economic growth are mostly focusing on infrastructure<br />
development in the pursuit<br />
POLICy Cities<br />
that focus<br />
only on economic<br />
development and<br />
provide services that<br />
are not public goods,<br />
may leave the urban<br />
poor, migrants, ethnic<br />
minorities and other<br />
vulnerable groups with<br />
serious difficulties to<br />
pay for the improved<br />
services, reducing the<br />
possibilities for them to<br />
enjoy quality of life.<br />
of higher productivity and<br />
therefore higher incomes,<br />
assuming that this will lead<br />
to better quality of life in<br />
the long term. Generally,<br />
that is what happens,<br />
since economic growth<br />
increases purchasing power<br />
and demand for goods<br />
and services including<br />
education, entertainment,<br />
financial services and<br />
housing, which, in turn,<br />
not only create new<br />
61<br />
Quality of Life and Urban <strong>Prosperity</strong><br />
employment opportunities<br />
but also contribute to<br />
higher quality of life. But<br />
there may also be negative<br />
consequences.<br />
However, UN-Habitat<br />
policy analysis shows that<br />
most surveyed cities in the<br />
developing world have<br />
no clear policies, actions<br />
and reliable procedures<br />
to deliver and expand<br />
quality of life to the whole<br />
population. With the<br />
exceptions of Singapore,<br />
Davao, Ho Chi Minh<br />
City and Chon Qing in<br />
Asia, Fort-de-France and<br />
Medellín in Latin America<br />
and the Caribbean, and<br />
Doha in the Arab States<br />
(whose commitment to<br />
quality of life was highly<br />
commended), experts<br />
took a critical view of the<br />
42 other cities on that<br />
count. They found public<br />
administrations to be<br />
generally inefficient and<br />
with poor incentives to<br />
devise specific quality of<br />
life policies for lack of adequate financial resources, trained<br />
staff or political interest.<br />
Positive exceptions can be found, such as Cebu,<br />
Singapore, Dubai, and Ho Chi Minh City, where, in the<br />
words of a local expert, “investing in human resources is<br />
considered to be the best way of seizing more opportunities<br />
and turning them into wealth and quality of life to make the<br />
city more prosperous”. 11 Social equity<br />
FACT and quality of<br />
life go hand in hand. In<br />
practice, though, any<br />
policies and actions<br />
aiming to expand<br />
societal well-being<br />
largely depend on<br />
the political will of<br />
governments and the<br />
degree of participation<br />
of civil society<br />
organizations and, in<br />
particular, their degree<br />
of autonomy when it<br />
comes to advocating,<br />
upholding and fighting<br />
for the rights of all.<br />
When a city<br />
POLICy focuses solely<br />
on economic prosperity, it is<br />
very likely that the benefits<br />
and improvements in terms<br />
of quality of life may not be<br />
geared to the urban poor,<br />
particularly in those cities<br />
where corruption and poor<br />
governance are endemic.<br />
In Cebu, a local expert argues that<br />
“it is not only a matter of expanding the pie (i.e., economic<br />
FACT<br />
Experts in 60 per cent of surveyed cities in Africa<br />
and Arab States and slightly more than 40 per cent<br />
of cities in Asia and Latin America believe that corruption and<br />
poor governance conspire against local prosperity and quality<br />
of life.
State of the World’s Cities <strong>2012</strong>/<strong>2013</strong><br />
POLICy<br />
Cities that are committed to quality of life are almost<br />
always committed to enhanced productivity and equity,<br />
emphasizing the strong relation between these dimensions.<br />
development), but dividing the pie and ensuring that the<br />
poor benefit, too (i.e., equity and quality of life)”. 12 Dubai,<br />
as other cities in the Arab Gulf, recognizes quality of life as<br />
Box 2.3.1<br />
Quality of Life – the ‘Spokes’ and the ‘Hub’ of the Wheel of Urban <strong>Prosperity</strong><br />
Quality of life and productivity<br />
Productivity and quality of life are increasingly associated. Skilled<br />
workers and talented people will flock to, and concentrate in,<br />
liveable cities with high quality of life, and firms will follow suit.<br />
Consulting firms rank cities based on their ‘good living’ factors to<br />
make informed locational decisions. High human capital, which<br />
is a main ingredient of quality of life, attracts firms that cluster in<br />
cities to take advantage of common labour pools. Well-planned<br />
and designed urban environments, with pedestrian-friendly areas,<br />
bicycle paths, mix-land uses and sufficient public goods, attract<br />
people and businesses which, in turn, contribute to finance further<br />
social amenities and public goods. More and more city leaders<br />
are investing in education and the provision of ‘commons’ and<br />
public goods as part of a quality of life. Inversely, cities that do<br />
not invest in quality of life tend to feature poor public health, low<br />
education, limited mobility, and marginalization of the urban poor,<br />
all resulting in low productivity.<br />
Quality of life and infrastructure development<br />
The prosperity of a city largely depends on infrastructure.<br />
Physical facilities like transportation, power and communications<br />
contribute to economic development, industrialization, trade and<br />
mobility of labour. Water supply, sanitation and sewerage, together<br />
with education and health facilities, have a direct impact on<br />
quality of life. All of these types of infrastructure connect people<br />
to people, goods to markets, workers to jobs, families to services,<br />
and the poor in rural areas to urban centres − a connectivity<br />
process that is essential to induce economic growth, reduce<br />
poverty and increase general well-being. More and more cities<br />
today are launching into ambitious initiatives to expand/improve<br />
infrastructure to sustain economic growth, prepare for population<br />
decline, address climate change issues and/or reduce slum<br />
incidence. Conversely, under-developed infrastructure makes life<br />
more difficult and more costly: poor facilities discourage industrial<br />
development, trade and investment and reduce competitiveness,<br />
besides generating air pollution, wasted time, fuel and safety<br />
costs, noise and more greenhouse gas emissions.<br />
62<br />
a key competitive advantage that contributes to promoting<br />
city productivity, attracting and retaining highly qualified<br />
individuals and prestigious firms and investors. Priority is<br />
given to those most easily perceived elements of quality of<br />
life such as parks, clean sidewalks, leisure, art and culture<br />
amenities as well as hospitals. Although not generalized<br />
to all the population, the pursuit of prosperity through<br />
quality of life is an interesting connection and entry point<br />
to development.<br />
Quality of life and equity<br />
Quality of life and equity are constitutive of progress and<br />
development. No city can claim to be prosperous when large<br />
segments of its population are excluded or live in abject poverty,<br />
or when large sections of the population are deprived of basic<br />
goods or services while other sections live in affluence. Cities<br />
that look to more equity in the distribution of resources and<br />
opportunities, in law enforcement, in the rules and relationships<br />
that govern institutions and in access to public goods will be those<br />
where shared prosperity and quality of life are improved. More<br />
equitable cities enhance the prospects for people to take part in<br />
democratic processes and participate in a more decisive manner<br />
in cultural and political life. The benefits of social participation<br />
and political voice extend to other domains such as health,<br />
employment and the urban environment.<br />
Quality of Life and Environmental Sustainability<br />
Environmental conditions have an immediate impact on the<br />
quality of people’s lives. They affect human health both directly<br />
(air, water pollution, noise) and indirectly (climate change,<br />
biodiversity). Well-managed urban commons and public goods<br />
can improve environmental conditions and quality of life.<br />
Conversely, the pursuit of short-term quality of life objectives can<br />
be detrimental to the more long-term sustainability objectives<br />
that collectively affect the lives of the whole population.<br />
Indeed, individual short-term aspirations to quality of life, such<br />
as affordable, low-density housing, can act as major factors<br />
behind urban sprawl, which in turn is detrimental to the natural<br />
environment through higher use of land, energy and water, along<br />
with greenhouse gas emissions.<br />
Quality of life and the ‘hub’ of the wheel of prosperity<br />
Effective institutions, more appropriate laws and regulations,<br />
proper urban planning and new value systems are essential<br />
power functions and can make sure that policies, actions and<br />
solutions involving any of the ‘spokes’ of prosperity can have<br />
positive effects on the others.<br />
Sources: Glaeser, E. and Berry, C. (2005); Gidwani, V. and Baviskar, A. (2011); European Environment Agency (2009); Stiglitz Joseph, Sen Amartya,<br />
Fitoussi Jean-Paul (2009); UN-Habitat (2008/9); Jones, Harry (2009); Lalnunmawia H, (2010); AusAid (2009).
Quality of Life: A Variety of Local Responses<br />
UN-Habitat has identified some convergent and divergent<br />
forms in which cities address quality of life.<br />
Divergent city responses: Actions to improve quality of<br />
life will largely depend on the stage of development of the<br />
relevant country or city.<br />
In most poor cities in the developing world, quality of<br />
life is strongly associated with the provision of public goods<br />
in the form of basic services such as water, sanitation and<br />
electricity, and improvements in slum neighbourhoods.<br />
Tanzania’s National Development Vision 2025 aims at<br />
high quality of life for all the population, linking this notion<br />
to economic growth and poverty reduction. 13 In Ho Chi<br />
Minh City, quality of life is directly linked to improved<br />
drainage, sewage collection and treatment systems, and<br />
other public infrastructures such as road enlargements.<br />
In middle-income countries, governments link quality of<br />
life to various factors, from improved living environments<br />
and enhanced material well-being to higher incomes. Experts<br />
in cities as diverse as Fort-de-Fran ce (Martinique), Habana,<br />
Cebu, Davao, and Beirut explicitly refer to the provision of a<br />
decent house and a healthy environment as essential elements<br />
for improved well-being and quality of life. In other cities<br />
−Rosario, Bangalore, Hyderabad, Alexandria and Guarenas<br />
(Venezuela) − improved solid waste disposal is perceived as<br />
a major condition for better quality of life. Improvements<br />
in healthcare services appear as another major factor. In<br />
Singapore, Doha, Chongqing and Shenzhen, local experts<br />
implicitly refer to good and affordable medical services for<br />
all as a good way of improving quality of life. Shenzhen’s<br />
universal healthcare system<br />
and Tehran’s Urban Heart<br />
Programme are good<br />
Box 2.3.2<br />
examples.<br />
POLICy Equitable<br />
cities<br />
generalize access<br />
to urban commons<br />
and public goods,<br />
preventing private<br />
appropriation and<br />
expanding the scope for<br />
improved quality of life<br />
for all.<br />
Quality of Life, World-Class Cities and Social Inclusion<br />
63<br />
FACT<br />
Quality of Life and Urban <strong>Prosperity</strong><br />
Experts in Beira, Algiers, Praia, Luanda and Addis<br />
Ababa, among others, explicitly link improved quality<br />
of life to slum upgrading and poverty reduction.<br />
In rich countries, government responses to the need<br />
for quality of life implicitly refer to access to a number<br />
of goods and services and improvements in the domestic<br />
living environment. Many<br />
European cities emphasize<br />
good transport, green open<br />
spaces, culture and sports<br />
facilities as major factors<br />
behind better quality of life.<br />
Although better paid jobs,<br />
good levels of education<br />
and health facilities always<br />
feature in government<br />
responses, quality of life is<br />
increasingly associated to<br />
an inclusive, well-planned,<br />
healthy and supportive<br />
environment. 14<br />
FACT<br />
Convergent city<br />
responses: Beyond local<br />
circumstances, some<br />
aspects of quality of life<br />
improvements can be found<br />
in all types of country.<br />
Northern<br />
European<br />
cities like Copenhagen,<br />
Amsterdam, Groningen,<br />
Berlin and Muenster<br />
promote cycling and<br />
walking as part of new<br />
urban cultures and in<br />
the pursuit of better<br />
quality of life. Others<br />
like Dresden, Vancouver<br />
and Los Angeles have<br />
launched into urban<br />
conversion programmes<br />
in cultural and historical<br />
neighbourhoods,<br />
adapting urban<br />
infrastructure and<br />
reusing open land<br />
areas for better quality<br />
of life.<br />
Cities with aspirations to ‘world class’ status will typically equate this notion with competitiveness.<br />
The 2007–2015 Dubai Long-term Strategic Development Plan declares these two notions as twin<br />
objectives that will “establish the city as a preferred home for current and future residents by<br />
improving the well-being of citizens and residents, and helping them live healthier lives enriched<br />
with opportunity and choice. 15 In Doha, the capital of Qatar, transformation of the city into a<br />
diversified knowledge-based economy is seen by public authorities as being contingent on the<br />
development and upgrading of the education and skills of the population and improved quality of<br />
life. 16 Singapore considers quality of life as a key competitive advantage to attract skilled foreign<br />
labour and investment. 17 At a different level, a local expert in Beirut noted that ‘quality of life’ mostly<br />
appeared in the advertising brochures of high-end property developments, in response to which<br />
non-governmental organizations have used the same notion to draw attention to the lack of public<br />
goods in the city, such as public or ‘green’ spaces. 18 In Santos, Brazil, quality of life is perceived as<br />
involving social justice and inclusion, not just economic growth, as a precondition for sustainable<br />
development.
State of the World’s Cities <strong>2012</strong>/<strong>2013</strong><br />
Cultural vitality enhances quality of life: Sinulog Street dancing, an annual event held on the third Sunday in January celebrates Santo Niño,<br />
the patron saint of Cebu, Philippines, as well as Cebuano peoples’ origins.<br />
© <strong>2012</strong> John Lander/fotoLIBRA.com<br />
64
UN-Habitat has identified various areas of intervention<br />
which governments with different political orientations and<br />
levels of development still consider as priority interventions:<br />
safety and security, efficient public transport, public spaces,<br />
healthcare and adequate housing, appear to be among the<br />
most important.<br />
Public Safety and Quality of Life: A safe and secure life<br />
for all is an integral component of a prosperous city. As an<br />
expert in Nairobi states, “quality of life only makes sense<br />
when there is adequate security”. 19 Experts in 52 cities in<br />
the developing world agreed that this is the most important<br />
factor contributing to a sense of empowerment and a feeling<br />
that one is part of a prosperous city. In Lima, for instance, a<br />
survey on quality of life conducted by a citizens’ observatory<br />
found that 73 per cent of the population considers urban<br />
insecurity as the main problem that conspires against quality<br />
of life and prosperity. 20<br />
A survey on “urban lifestyles” conducted in 2010 by<br />
Veolia Observatory in seven cities in both developing<br />
and developed nations found that in three of these cities<br />
(Chicago, London and São Paulo) insecurity appears as the<br />
most important problem, and in another (Paris) it features<br />
as the third most important. 21<br />
By itself, security may not bring prosperity to any city,<br />
but its absence is fatal. Economic inequity and/or instability<br />
nurtures high perceptions of crime and violence in various<br />
cities around the world, and inadequate urban planning law<br />
enforcement drives many high- and middle-class residents<br />
into gated communities and other guarded urban and<br />
suburban enclaves22 , creating pockets of prosperity. This<br />
type of privilege remains unaffordable to those on low<br />
incomes, whose safety is often more at risk. Personal safety<br />
is seriously detrimental to freedom, mobility, productivity<br />
and public interactions, all of which are crucial to ensuring<br />
a high quality of life.<br />
Crime and violence can hinder, and sometimes, paralyze<br />
regional and national economies. High rates of violence<br />
and insecurity in Kingston (Jamaica) and Nairobi (Kenya)<br />
have stultified the otherwise thriving tourist sectors in<br />
these countries. 23<br />
Even though urban<br />
insecurity is to large extent<br />
POLICy the result of extreme<br />
inequalities, it can also<br />
generate further social<br />
and spatial disparities<br />
that restrain access to<br />
employment, resources<br />
Effective<br />
public<br />
safety is a fundamental<br />
‘common good’ that<br />
enhances quality of life<br />
for all, and is a major<br />
foundation of urban<br />
prosperity.<br />
65<br />
FACT<br />
Quality of Life and Urban <strong>Prosperity</strong><br />
In 19 cities out of the 52 surveyed by UN-Habitat, an<br />
overwhelming majority of experts (more than 80 per cent)<br />
rated security to work and live freely as a major contributor<br />
to prosperity. In cities like Praia, Cebu, Algiers, Chongqing,<br />
Singapore, La Paz and Amman, nearly all experts rated security as<br />
‘contributing’ or ‘highly contributing’ to prosperity.<br />
and opportunities. Moreover, unsafe cities and perceptions<br />
of insecurity also lead to more fragmented, sprawled and<br />
car-dependent urban environments. The fear of crime and<br />
violence not only increases reliance on private automobiles<br />
through the proliferation of low-density, peri-urban gated<br />
communities, it also deters<br />
the public from using<br />
public transport.<br />
Extensive provision<br />
of public goods such<br />
as parks, schools, basic<br />
services, sports facilities<br />
and community centres,<br />
particularly in more violent<br />
neighbourhoods, together<br />
with strong participation<br />
from local communities,<br />
has enabled Medellín to<br />
enhance safety through social cohesion.<br />
Reviving the public space: In a large number of cities,<br />
provision, preservation and improvement of public spaces<br />
remains a neglected agenda. According to a local expert<br />
in Panama City, “in practice, the concept of public space<br />
does not exist”. 24 In Cebu, an expert mentions that “public<br />
parks, playground areas and recreational facilities are<br />
grossly inadequate”. 25 Another in Al-Muharrak (Bahrain)<br />
states that “the city has been losing green areas and today<br />
the proportion of gardens is small”. 26 Nearly one-third<br />
FACT of local experts in<br />
Latin America, 25 per cent<br />
in African cities and more<br />
than 10 per cent in Asia and<br />
the Arab States said lack<br />
of public security was not<br />
properly addressed in their<br />
respective cities.<br />
As many other<br />
public goods, ‘green’ and open areas tend to be enclosed,<br />
restricted, or depleted by unsustainable use. In Amman,<br />
city authorities have been converting public areas and<br />
parks into developments.<br />
In India, confessional<br />
groups erect temples in<br />
Many public spaces<br />
public parks; in Bangladesh FACT are residual urban<br />
areas that are exposed<br />
developers construct<br />
to speculation for private<br />
housing in open public<br />
profit. In other cities, public<br />
areas; in Nairobi, private spaces remain concentrated<br />
interests occupy riparian in the affluent areas.<br />
lands. 27
State of the World’s Cities <strong>2012</strong>/<strong>2013</strong><br />
POLICy<br />
Cities that<br />
reevaluate<br />
their notion of the public<br />
and thereby provide green<br />
areas, parks, recreation<br />
facilities and public spaces<br />
demonstrate a commitment<br />
to improved quality of life.<br />
POLICy<br />
Cities that<br />
enhance and<br />
sustain the use of public<br />
space have enhanced<br />
community cohesion, civic<br />
identity and quality of life.<br />
Box 2.3.3<br />
Greenery and Quality of Life in Asian Cities<br />
In Amman, parks<br />
represent 12 per cent of the total land area; however, in<br />
the eastern part of the city, with the highest population<br />
density, open spaces are very scarce. 28 In some other cities,<br />
Internet café, Maroc telecom, and teleboutique signs in Morocco.<br />
Access to the Internet is now a vital asset for both poor and rich.<br />
© <strong>2012</strong> Alistair Laming/fotoLIBRA.com<br />
Many cities across the developing world, especially in Asia and the Arab States, are creating new<br />
parks in an effort to meet international standards for green area per capita (i.e., eight square meters<br />
per head). 32 In the past five years, Shenzhen has created 435 new parks as part of the “Eco-city<br />
Programme” and the “Garden City Plan”, achieving a ratio of 16.3 sqm in 2009. As a result, the<br />
urban ecological environment in Shenzhen has gradually improved and with it quality of life. 33 Also<br />
in China, Chongqing has increased the combined green belt and public square surface area by a<br />
multiple of 16 in the last 30 years. 34 The state-city of Singapore is a leading example in the world,<br />
with greenery over 50 per cent of the surface area and over 450 public parks and gardens. The city<br />
is also preserving its rich biodiversity with four nature reserves which cover more than 3.000 ha, and<br />
are legally protected to safeguard key indigenous ecosystems. These initiatives contribute to a cleaner<br />
environment, shaping the country’s landscape and enhancing quality of life. Recently, greenery has<br />
been given even more emphasis, with a new plan for a “City-In-a-Garden”’. 35<br />
66<br />
particularly those aiming at ‘world-class’ status, parks and<br />
‘green’ spaces have a more ornamental or ‘image’ role than<br />
a real ‘public good’ one.<br />
Parks and ‘green’ spaces have always been associated<br />
with better quality of urban life. In Praia, a city where<br />
such spaces are very scarce, a newly opened, small public<br />
square has become a major place for recreation, leisure<br />
and socialization despite its reduced dimensions. 29 In<br />
Guadalajara, Mexico, temporary appropriation of streets<br />
and public spaces for pedestrian and cycling purposes has<br />
become extremely popular. As a result, this recreational<br />
project, known as ‘vía recreativa’, has been extended<br />
Box 2.3.4<br />
Internet, Information and Quality of Life<br />
Basic needs are rapidly changing. Access to Internet is<br />
increasingly becoming an essential component of quality<br />
of life. In many cities today, Internet is used not just to<br />
communicate, socialize and learn, but also to promote public<br />
participation and to assess citizens’ perceptions of urban<br />
affairs. Formal recognition of right to information (i.e., India,<br />
2005; the Philippines, 2008; South Africa, 2000) empowers<br />
citizens and encourages participation in governance and<br />
government programmes. The cities of Hyderabad, Cebu,<br />
and Johannesburg, amongst many others, are introducing<br />
e-governance to enable many services on-line − issuance<br />
of documents, payments, ticketing, applications and<br />
complaints − as a major step to enhance quality of life. In<br />
India more than 500 million cell phones are currently in use,<br />
and many with reduced call rates. This is improving the<br />
connectivity of poor and rich alike, and enhancing economic<br />
opportunities for the urban poor. As stated by a local expert in<br />
India, “Internet is an empowerment tool”.
from 3.4 km to over 25 km and across four municipal<br />
jurisdictions. At national level, the Mexican government<br />
has launched an ambitious programme to recover public<br />
spaces in a bid to improve quality of life and enhance public<br />
security, particularly in marginalized neighbourhoods in<br />
various cities. 30 In Cuba, as part of a ‘non-discriminatory<br />
enjoyment of public spaces’ policy, several cultural<br />
programmes have been made free or affordable for all, with<br />
plazas, avenues and even vacant lots featuring various events<br />
that enhance quality of life. 31<br />
In Europe, public greens which take the form of corner<br />
lots, small community parks, street greens, linear parks,<br />
Endnotes<br />
1 Stiglitz, J.E., A. Sen, and J-P. Fitoussi (2009) Report by the Commission on the<br />
Measurement of Economic Performance and Social Progress, The Commission, Paris,<br />
http://www.stiglitz-sen-fitoussi.fr/en/index.htm<br />
2 Stiglitz, J.E., A. Sen, and J-P. Fitoussi (2009) op. cit.<br />
3 Andrulis ,D.P., H.M. Reid, L. M. Duchon (2004), Quality of Life in the Nation’s 100<br />
Largest Cities and Their Suburbs: New and Continuing Challenges for Improving<br />
Health and Well-Being, The Social and Health Landscape of Urban and Suburban<br />
America Report Series, USA.<br />
4 Stiglitz, J.E., A. Sen, and J-P. Fitoussi (2009) op. cit.<br />
5 www.worldvaluessurvey.org<br />
6 European Environment Agency (2009), Ensuring quality of life in Europe’s cities and<br />
towns: Tackling the environmental challenges driven by European and global change,<br />
EEA Report 5/2009,Office for Official Publications of the European Communities,<br />
Luxembourg<br />
7 http://www.mercer.com/articles/quality-of-living-survey-report-2011; Also targeting<br />
business, the Economist Intelligence Unit designed a Quality of Life Index using<br />
nine factors: material well-being, health, political stability and security, family life,<br />
community life, gender equality, political freedom, climate and geography, and job<br />
security, Refer to http://www.economist.com/media/pdf/QUALITY_<strong>OF</strong>_LIFE.pdf<br />
8 European Environment Agency (2009) op. cit.<br />
9 Bodin-Buyle Z., and C. Hermant-De Callataÿ (2011), Urban <strong>Prosperity</strong> and Quality of<br />
Life in European cities – Beyond GDP, European Union, Brussels, prepared for UN-<br />
Habitat as part of EU – UN-Habitat collaboration.<br />
10 European Environment Agency (2009) op. cit.<br />
11 Dzung, D. D. (2011) City Report on Ho Chi Minh City, Unpublished UN-Habitat<br />
background study for “State of the World’s Cities Report <strong>2012</strong>/<strong>2013</strong>”<br />
12 Fernandez, F.L. (2011) City Report on Cebu, Unpublished UN-Habitat background<br />
study for “State of the World’s Cities Report <strong>2012</strong>/<strong>2013</strong>”<br />
13 Lupala, A. (2011) City Report on Dar es Salaam, Unpublished UN-Habitat background<br />
study for “State of the World’s Cities Report <strong>2012</strong>/<strong>2013</strong>”<br />
14 European Environment Agency (2009) op. cit.<br />
15 Al-Bassam, D. and J. Mouris (2011) City Report on Dubai, Unpublished UN-Habitat<br />
background study for “State of the World’s Cities Report <strong>2012</strong>/<strong>2013</strong>”<br />
16 Mena, A. (2011) City Report on Doha, Unpublished UN-Habitat background study for<br />
“State of the World’s Cities Report <strong>2012</strong>/<strong>2013</strong>”<br />
17 Centre for Livable Cities (2011) City Report on Singapore, Unpublished UN-Habitat<br />
background study for “State of the World’s Cities Report <strong>2012</strong>/<strong>2013</strong>”<br />
18 Fawaz, M. and N. Baghdadi (2011) City Report on Beirut, Unpublished UN-Habitat<br />
background study for “State of the World’s Cities Report <strong>2012</strong>/<strong>2013</strong>”<br />
19 Omenya, A. (2011) City Report on Nairobi, Unpublished UN-Habitat background study<br />
for “State of the World’s Cities Report <strong>2012</strong>/<strong>2013</strong>”<br />
67<br />
and river banks as well<br />
as large city parks, are<br />
designed for specific types<br />
of activity. The liveliness<br />
and continuous use of<br />
public space as a public<br />
good leads, in turn, to<br />
urban environments that<br />
are well-maintained and<br />
safe, making the city an<br />
attractive place to live and<br />
work in. 36<br />
Quality of Life and Urban <strong>Prosperity</strong><br />
POLICy “Having<br />
access to<br />
public spaces does not<br />
only improve quality<br />
of life, it is a first step<br />
to civic empowerment<br />
on the way to further<br />
institutional and political<br />
spaces”. 37<br />
20 Lima Como Vamos (2010) Lima Según sus Ciudadanos, Observatorio Ciudadano,<br />
Informe de Percepción sobre la Calidad de Vida, Lima.<br />
21 Veolia Environment (2010), Villes à Vivre 2010, Observatoire Veolia de Modes de Vie<br />
Urbains, Paris.<br />
22 Davis, D. (2007) “Urban Violence, Quality of Life, and the Future of Latin American<br />
Cities,” in Allison M. Garland,A.M, M. Massoumi and B. A. Ruble (Eds) Global Urban<br />
Poverty: Setting the Agenda. Woodrow Wilson International Center for Scholars,<br />
Comparative Urban Studies Project, Washington D.C, pp. 57-87.<br />
23 UN-Habitat (2007) Enhancing urban safety and security: Global report on human<br />
settlements 2007, Earthscan, London<br />
24 Mendoza, I. R. (2011) City Report on Panama City, Unpublished UN-Habitat<br />
background study for “State of the World’s Cities Report <strong>2012</strong>/<strong>2013</strong>”<br />
25 Fernandez, F.L. (2011) op. cit.<br />
26 Al- Kubaisy, F. (2011) City Report on Al-Muharrak, Unpublished UN-Habitat<br />
background study for “State of the World’s Cities Report <strong>2012</strong>/<strong>2013</strong>”<br />
27 UN-Habitat (2010), Bridging the Urban Divide, State of the World’s Cities Report<br />
2010/2011, Earthscan, London<br />
28 Shabou, A., N. Soboh, K. Jalouka, and D. A. Thaib (2011) City Report on Amman,<br />
Unpublished UN-Habitat background study for “State of the World’s Cities Report<br />
<strong>2012</strong>/<strong>2013</strong>”<br />
29 Fernandez, C. (2011) City Report on Cape Verde, Unpublished UN-Habitat background<br />
study for “State of the World’s Cities Report <strong>2012</strong>/<strong>2013</strong>”<br />
30 SEDESOL (2007). Guia de Diseno del Espacio Publico Seguro, Incluente y<br />
Sustentable. Secretaria de Desarrollo Social, México<br />
31 Coyula, M. (2011) City Report on Havana, Unpublished UN-Habitat background study<br />
for “State of the World’s Cities Report <strong>2012</strong>/<strong>2013</strong>”<br />
32 The agreed international ratio is 8 square meters per capita. For instance, Lima, the<br />
capital of Peru, has around 3 square meters, the Mexican border city of Tijuana has<br />
around one or two, and Al-Muharrak in Bahrain has less than 1 square meters.<br />
33 Jin, L. and Y. Liu (2011) City Report on Shenzhen, Unpublished UN-Habitat<br />
background study for “State of the World’s Cities Report <strong>2012</strong>/<strong>2013</strong>”<br />
34 Liu, Y. and Y. Wang (2011) City Report on Chongqing, Unpublished UN-Habitat<br />
background study for “State of the World’s Cities Report <strong>2012</strong>/<strong>2013</strong>”<br />
35 Centre for Livable Cities (2011) op. cit.<br />
36 Shehayeb, D. (2008) ‘Safety and Security in Public Space’ in International Report on<br />
Crime Prevention and Community Safety: Trends and Perspectives, ICPC, Montreal,<br />
pp. 107-112<br />
37 Castellanos, G. (2011) City Report on Santo Domingo, Unpublished UN-Habitat<br />
background study for “State of the World’s Cities Report <strong>2012</strong>/<strong>2013</strong>”
Chapter 2.4<br />
Equity and the<br />
<strong>Prosperity</strong> of Cities<br />
The past few decades have witnessed a notable surge in<br />
economic growth, but one which has been accompanied<br />
by an equally daunting degree of inequity under various<br />
forms, with wider income gaps and deepening poverty<br />
in many cities across the world. In the 1970s, widening<br />
income gaps began an unhealthy co-existence with<br />
economic growth, with reduced incomes for households in<br />
the middle and lower classes and steady increases for the<br />
well-off. Economic inequality is seriously detrimental to the<br />
equitable distribution among individuals of opportunities<br />
to pursue a life of their<br />
choosing and be spared<br />
Cities must realize from extreme deprivation<br />
FACT that equity has<br />
in outcomes.<br />
a significant impact on<br />
Equity involves<br />
economic performance, systematic (re)distribution<br />
since the greater the degree<br />
of the economic benefits<br />
of equity, the greater the<br />
of growth or development,<br />
chances of a fuller, more<br />
efficient use of available with legal frameworks<br />
resources, including skills ensuring a ‘level playing<br />
and creative talent. field’ and institutions<br />
protecting the rights<br />
of the poor, minorities<br />
and vulnerable groups.<br />
Promotion of equity<br />
also involves enhancing<br />
socioeconomic equality<br />
and providing for civic<br />
participation by all in the<br />
social, political and cultural<br />
spheres.<br />
1<br />
As understood in<br />
FACT this Report urban<br />
prosperity thrives on equity,<br />
which involves reduction<br />
in barriers on individual/<br />
collective potential,<br />
expansion of opportunities,<br />
and strengthening of<br />
human agency2 and civic<br />
engagement.<br />
68<br />
<strong>THE</strong> UNEQUAL WEALTH <strong>OF</strong> <strong>CITIES</strong>: INCREASED<br />
INCOME DISPARITIES<br />
The 2011 OECD report Divided We Stand stresses that<br />
income gaps between rich and poor are expanding in both<br />
developed and developing countries. In OECD countries,<br />
inequalities are as steep as they have been for over 30<br />
years. The Report shows that, in advanced economies, the<br />
average income of the richest 10 per cent of the population<br />
is about nine times higher than that of the poorest<br />
10 per cent. In Europe’s Nordic countries, the average is a<br />
multiple of six but growing,<br />
compared with multiples<br />
of 10 in Italy, Korea and<br />
the United Kingdom, and<br />
up to 14 in Israel, Turkey<br />
and the United States.<br />
These are overshadowed<br />
by countries such as Chile<br />
and Mexico with multiples<br />
of 27, and in Brazil, despite<br />
recent declines in inequity<br />
(the exception among<br />
the BRICs countries), the<br />
ratio of incomes between<br />
richest and poorest reached<br />
a staggering 50:1. 4 In<br />
the 34 OECD member<br />
countries, Gini coefficients<br />
have risen by 10 per cent<br />
on average between the<br />
1980s and the late 2000s<br />
(from 0.29 to 0.316). 5<br />
In emerging economies<br />
(such as Argentina, Brazil,<br />
China, India, Indonesia,<br />
the Russian Federation<br />
FACT<br />
Cities generate<br />
wealth, but it<br />
is not shared equitably.<br />
Despite considerable<br />
increases in capital and<br />
per capita GDP growth<br />
along with reductions<br />
in extreme poverty,<br />
inequality as a whole is<br />
growing in most parts<br />
of the world – a process<br />
that undermines urban<br />
prosperity.<br />
FACT<br />
In many cities,<br />
the population<br />
and local experts<br />
concur that inequalities<br />
are becoming steeper.<br />
A review of inequality<br />
in cities reveals a<br />
steady increase over<br />
the long term, as well<br />
as in recent decades. 3<br />
Paradoxically, this has<br />
occurred as wealth rose<br />
enormously around the<br />
world.
1.0<br />
0.9<br />
0.8<br />
0.7<br />
0.6<br />
0.5<br />
0.4<br />
0.3<br />
0.2<br />
0.1<br />
0<br />
Box 2.4.1<br />
Income Inequalities in the World’s Cities: An Overview<br />
The UN-Habitat database shows that income inequalities are<br />
widening in urban Asia; this is also the case in half of the<br />
African countries where urban data is available, while the gap<br />
has narrowed slightly in Latin America and the Caribbean.<br />
According to the database, the most unequal cities in the<br />
developing world are Hong Kong, Yichan, Shenzhen, Kuala<br />
Lumpur, Manila, Davao, Colombo, Bangkok, and Ho Chi Minh<br />
City; Bujumbura, Douala, Brazzaville, Addis Ababa, Libreville,<br />
Maputo, Lagos, Kigali and several South African cities (the<br />
most unequal in the world); and cities in Brazil and Colombia,<br />
together with Mexico City, Port-au-Prince, Buenos Aires,<br />
Santiago and Quito.<br />
Rising inequity is not limited to the developing world, as the<br />
recent banking/financial crisis has had serious socioeconomic<br />
effects on the developed countries where it started in the<br />
first place.<br />
Figure 2.4.1<br />
Urban <strong>Prosperity</strong>, Poverty and Inequity<br />
69<br />
and South Africa)<br />
income inequality is<br />
significantly steeper<br />
than the OECD average.<br />
Inequality has increased<br />
in all these countries over<br />
time, reaching extremes<br />
in Argentina, Brazil and<br />
South Africa.<br />
EQUITy COMES WITH<br />
MULTIPLIER EFFECTS<br />
Equity and lack thereof<br />
work in exactly opposite<br />
ways. When actively<br />
Equity and the <strong>Prosperity</strong> of Cities<br />
pursued, equity can act as a powerful catalyst for prosperity,<br />
exerting multiplier effects on other prosperity factors,<br />
optimizing their respective performances and creating<br />
CPI Gini MPI<br />
Mexico city<br />
Moscow<br />
Cape Town<br />
Johannesburg<br />
Ha Noi (Red Delta region)<br />
Jakarta<br />
Manila<br />
Casablanca<br />
Nairobi<br />
Guatemala city<br />
Abidjan<br />
Yaounde<br />
Lagos<br />
Accra<br />
Punjab*<br />
Phnom Penh*<br />
Dhaka*<br />
Dakar*<br />
Addis Ababa*<br />
Kampala*<br />
Dar es Salaam*<br />
* Gini coeffecient based on consumption<br />
This graph shows the difference between poverty and inequity in the context of rising prosperity. In many developing countries, inequity is often concealed in<br />
poverty, thus misdirecting policy and strategic interventions which tend to concentrate only on poverty. The case of Chile (Santiago) is a case in point. Whereas<br />
poverty has been reduced by around 20 per cent, the Gini coefficient increased from 0.542 in 1990 to 0.558 in 2009. A typical example of income polarisation<br />
can be found in Nairobi, which features a Gini coefficient of 0.59, whereby the richest 10 per cent in the city account for 45.2 per cent of income while the<br />
poorest 10 per cent account for just 1.6 per cent.<br />
Source: WHO/UNICEF (2010); International Energy Agency (2010); International Road Federation (2009); ITU World Telecommunication /<br />
ICT Indicators Database (2010)<br />
POLICy Promoting<br />
equity must<br />
be a dual endeavour: (i)<br />
providing the conditions that<br />
enable every individual and<br />
social group to realize their<br />
full potential and harness<br />
the collective benefits and<br />
opportunities any city has<br />
to offer; and (ii) removing<br />
any systemic barriers that<br />
discriminate against any<br />
individual or social group.
State of the World’s Cities <strong>2012</strong>/<strong>2013</strong><br />
linkages among them.<br />
When equity Its absence will will<br />
POLICy is embedded have the reverse effect,<br />
in urban development<br />
compounding any existing<br />
strategies, efficiency is<br />
enhanced, asset utilization<br />
biases, or dysfunctions<br />
becomes optimal,<br />
already hindering<br />
productivity improves, social prosperity.<br />
cohesion is strengthened,<br />
Undoubtedly, some<br />
and both sustainability and cities have demonstrated a<br />
resilience are enhanced.<br />
capacity to stimulate growth<br />
and prosperity even in the<br />
absence of equity. However,<br />
as has become amply evident in the past three decades,<br />
such prosperity, coupled with uneven distribution, remains<br />
narrowly confined and is unsustainable. Conversely, cities<br />
that have built equity into their local development strategies<br />
are better placed for enhanced prosperity.<br />
Equity reduces alienation and exclusion, paving the<br />
way for empowerment and engagement of all social groups,<br />
and for the realization of the full potential of the entire<br />
population. Indeed, cities that have removed impediments<br />
to the full engagement of women, youths and even the<br />
Box 2.4.2<br />
Spatial divisions exacerbate inequality<br />
Spatial inequalities are not only a forerunner of social and<br />
economic divisions; these in turn cause further inequalities and<br />
different forms of exclusion and marginalization. In Jordan’s<br />
capital, for instance, 97 per cent of households in Western<br />
Amman have computers while in Eastern Amman the proportion<br />
is no more than eight per cent. Not surprisingly, in Western<br />
Amman more than 50 per cent of males and 20 per cent of<br />
females earn more than USD1,400 monthly, compared with only<br />
two per cent for males and less than one per cent for females in<br />
Eastern Amman. 7<br />
The urban divide appears to widen with higher degrees of<br />
economic prosperity; at least this is the perception of populations<br />
and local experts. In Bangalore, where specialisation in computer<br />
technologies has brought a fair amount of economic prosperity,<br />
a local expert remarked that “while quality of life is comfortable<br />
for ‘elite Bangalore’, it is not so for the ‘other Bangalore’ which<br />
comprises the majority of the population”. 8 In São Paulo, even<br />
as municipal authorities strive to integrate favelas, informal<br />
settlements and rehabilitated urban neighbourhoods into a more<br />
inclusive city, wealthy Paulistanos resist the process and gravitate<br />
to more exclusive enclaves. The result is what has been dubbed<br />
a ‘city of walls’ where any visible prosperity appears to be largely<br />
monopolised by the wealthy. In Lusaka, a local expert reports<br />
70<br />
elderly have invariably enhanced overall prosperity.<br />
Equity is not simply a normative concern, related to<br />
issues of fairness and justice, important as these may be. It is<br />
a material factor which directly impinges on the process of<br />
social and material sustenance. In fact, through removal of<br />
‘unfreedoms’, and with the attendant broadening of choices<br />
and opportunities, equity enhances the city’s transformative<br />
capacity while also promoting identity and agency among<br />
the population.<br />
The social process that comes with the opportunities<br />
made available to all through public goods like quality<br />
education and skills, enables the population to remain<br />
engaged and to stake a claim on the city. In this respect, the<br />
way a city shapes, and is in turn shaped by, its population,<br />
will largely depend on whether urban systems provide all<br />
residents with equal opportunities for development and the<br />
ability to exert agency.<br />
Inequity is inefficient from an economic perspective. As<br />
stressed by Sen, “the primitiveness of social developments<br />
(such as widespread illiteracy, malnutrition, lack of health<br />
facilities and medical networks) is a barrier to the full<br />
realisation of the benefits of participatory growth and<br />
that ”increasing degrees of exclusion are reappearing in the<br />
city, especially with the new infrastructure under development.<br />
Segregation along racial lines is re-emerging.” 9 In Dubai, as in<br />
some other Gulf cities, the gap between nationals and nonnationals<br />
(access to schooling, public hospitals, health insurance,<br />
adequate and affordable housing, labour grievances and rights) is<br />
unequal in the extreme.<br />
Research shows that when combined, the physical and social<br />
divisions between rich and poor neighbourhoods can generate<br />
further exclusion and marginalization, especially when the<br />
poor are confined to farther neighbourhoods with inadequate<br />
accessibility. The underprivileged people living in these ‘lost’<br />
areas suffer from a triple jeopardy: long distances, high transport<br />
costs and excessive commuting times. This turns into a genuine<br />
“spatial poverty trap” that conspires against shared prosperity<br />
through restrictions on jobs, compounding gender differences,<br />
limiting social interactions and reducing social capital, increasing<br />
the likelihood of crime and violence, with worsening living<br />
standards as a result. 10 The spatial inequalities so visible in<br />
so many cities are also the outcome of broader and deeply<br />
entrenched processes of unplanned urban development, poor<br />
governance and institutionalized exclusion and marginalisation of<br />
specific groups.
prosperity.” 6 Remedies<br />
here include such public<br />
goods as political freedom,<br />
economic facilities, social<br />
opportunities, transparency<br />
and security, with the<br />
safeguards against a variety<br />
of risks that they ensure for<br />
basic capabilities.<br />
<strong>THE</strong> RISkS <strong>OF</strong><br />
UNCHALLENGED<br />
DIvISION<br />
A growing body of<br />
research connects the<br />
competitiveness of cities<br />
with social cohesion.<br />
Analysis increasingly<br />
links the importance of<br />
tackling inequality at earlier<br />
stages of development<br />
to the achievement of<br />
prosperity. Reducing<br />
inequality and poverty has<br />
been highlighted as a key<br />
aspect of urban quality<br />
of life. A UNICEF study<br />
on poverty reduction<br />
mentioned that “evidence from India, China and Brazil<br />
indicates very clearly that efforts to ease inequalities<br />
generate larger dividends for poverty reduction than a<br />
more conventional focus on economic growth”. 11 An<br />
OECD study has reached similar conclusions: the notion of<br />
social cohesion includes dimensions of social relationships,<br />
social inclusiveness and social equity, which are major<br />
components of broader-defined prosperity. “The key<br />
idea that has emerged to link these concerns is that social<br />
cohesion improves economic performance. This is a more<br />
positive way of saying that social division and fragmentation<br />
undermine long-term economic success”. 12<br />
However, the absence of social cohesion, particularly<br />
in the form of equity, does not just challenge economic<br />
success: it also jeopardises prosperity as a whole through<br />
the multidimensional, and far-reaching consequences<br />
which inequity spreads throughout urban society. UN-<br />
Habitat analysis (2010) of urban inequality in 47 developing<br />
countries challenged the notion that inequity is an<br />
acceptable, inevitable aspect of economic growth. 13<br />
71<br />
Equity and the <strong>Prosperity</strong> of Cities<br />
Kibera, Nairobi: Looking out ... access to good education is one<br />
way out the slum.<br />
© Eduardo Lopez Moreno<br />
Recently, OECD experts agreed that economic growth<br />
and equality were by no means contradictory variables but<br />
instead can, and arguably should, act in a complementary<br />
way, stressing that “researchers are increasingly finding that<br />
regions marked by higher levels of inequality, in fact, find<br />
their economic performance damaged.” 14<br />
The statement that ‘more equal cities are more<br />
prosperous cities’ is<br />
increasingly supported by<br />
evidence, and has become<br />
More and<br />
a development proposition. FACT more empirical<br />
Without elaborating on<br />
data suggests a strong<br />
the moral principle that<br />
connection between<br />
equity and economic<br />
inequality is inherently<br />
prosperity, with equity<br />
unacceptable, it would<br />
being a cause not a<br />
appear that when certain result of economic<br />
groups of people are<br />
prosperity.
State of the World’s Cities <strong>2012</strong>/<strong>2013</strong><br />
POLICy<br />
If left unaddressed, socioeconomic fragmentation can<br />
jeopardise urban prosperity and pose major risks to<br />
nationwide political stability.<br />
repeatedly and disproportionately refrained from taking<br />
their fair, full share of the multidimensional benefits of the<br />
‘urban advantage’, the above statement comes with two<br />
interconnected corollaries. First, inequality can be linked<br />
to poor economic productivity, and experience shows that<br />
more sustainable urban economies are frequently associated<br />
with lower inequality. Second, persistent, ever-higher<br />
inequality carries direct risks. Stark disparities within cities<br />
have proven to be social detonators, as recent revolutions<br />
in the Arab world and social unrest in some cities in the<br />
developed world have recently demonstrated.<br />
Take a city anywhere in the world that can boast<br />
sustained economic growth thanks to high productivity,<br />
adequate infrastructure, a high quality of life and<br />
environmental preservation: the more this prosperity is<br />
inequitably distributed, the more precarious it is bound<br />
to be. All five ‘spokes’ in the ‘prosperity wheel’ must be<br />
developed in a well-balanced way for a smoother ride on the<br />
path of sustainable, shared prosperity.<br />
The recent society-wide upheavals in Tunisia, Libya<br />
and Egypt did not occur against a background of extreme<br />
poverty or deprivation. In all three countries, national<br />
poverty reduction programmes had gained considerable<br />
traction. Slum improvement or eradication had been<br />
achieved or was on-going. Large infrastructure projects<br />
with adequate transport networks had been deployed or<br />
were underway and, in terms of education and health,<br />
achievements were approaching or surpassing national<br />
Millennium Development Goals. Still, Egypt, Libya and<br />
Tunisia were shown to have feet of clay. The sobering<br />
message from the Arab<br />
Spring, though still in a<br />
When prosperity state of flux, is that leaders<br />
POLICy remains an<br />
and societies ignore<br />
elusive proposition for a inequality at their own peril.<br />
majority of the population,<br />
A recent report on the<br />
the prospects of social<br />
East African Community<br />
unrest or full-blown<br />
has highlighted a number of<br />
conflicts increase, since<br />
the majority’s claims are remarkable achievements in<br />
nothing but demands for terms of economic growth<br />
effective human dignity. over the past decade,<br />
propelled by massive<br />
72<br />
increases in trade based on new, all-weather roads and uptake<br />
of mobile telephone technology. Still, the actual number of<br />
East Africans living below the poverty line has increased from<br />
44 million to 53 million, and income inequality indicators, as<br />
measured by Gini coefficients, have also worsened in most<br />
countries. 15 As a regional expert put it, ”The reason for this<br />
is that inequality is both deepening and widening. Fewer<br />
people are enjoying the benefits of economic growth.” 16<br />
Inequality and criminality appear to be part and parcel<br />
of the same equation. This is all the more so when lack of<br />
opportunities and rising unemployment are added to the<br />
balance. Perceptions of rising criminality, and the fears<br />
thereof, may be strong in cities characterised by high<br />
inequity, and even stronger than actual numbers actually<br />
state. In one poll, comparing perceptions and expert<br />
opinion in São Paulo and London, criminality emerged<br />
as a major concern in both cities, even though actual<br />
numbers in São Paulo were a multiple of London’s. 17 In<br />
the same survey, residents of cities as diverse as Mumbai,<br />
Chicago, Cairo, London, Paris, Beijing and São Paulo<br />
overwhelmingly agreed (89 per cent) that “a non-dangerous<br />
city” was their prime criterion for the ‘good urban life’, a<br />
notion that has much to do with prosperity.<br />
LINkING EQUITy TO PROSPERITy<br />
“Inequalities are increasing day after day”, according to a<br />
local expert in Hyderabad. This comment echoes findings<br />
from the United Nations General Assembly 2011 Report on<br />
Progress towards Millennium Development Goals (MDGs),<br />
which stressed that “despite advances towards achieving<br />
the MDGs, insufficient emphasis in the MDG agenda had<br />
been given to the issue of inequity which is increasing within<br />
and between countries.” 18 Even in those countries that have<br />
made progress towards the MDGs, inequalities have grown.<br />
Therefore, as suggested by the UN General Assembly, equity<br />
must be mainstreamed in the development agenda, based on<br />
more inclusive growth.<br />
Evidence showing that<br />
equity is a critical dimension<br />
of prosperity runs<br />
against the conventional<br />
development approaches<br />
that prevailed before the<br />
2008–09 global financial<br />
crisis. A particular case in<br />
point is the ‘Washington<br />
Consensus’, which<br />
reinforced the notion that<br />
POLICy<br />
Cities must<br />
pay more<br />
attention to inequity as<br />
a critical factor affecting<br />
prosperity. Deliberate<br />
and conscious policies<br />
now need to emphasise<br />
the importance of equity<br />
in urban decisionmaking.
economic growth is to take place first before equity issues can<br />
be addressed. Although the Consensus promoted pro-poor<br />
growth and the provision of primary education along with<br />
primary health and infrastructure development, it was based<br />
on the premise that poorer sections of society benefit from<br />
whatever ‘trickles through’ the economic and social pyramid,<br />
in an environment of free enterprise and deregulation. The<br />
dramatic collapse of the banking system in major Western<br />
countries in 2008 and the subsequent world economic crisis<br />
has seriously discredited the Consensus approach.<br />
Ample evidence suggests that structures and institutions<br />
are skewed in favour of dominant groups in society. These<br />
groups may legally or otherwise maximise their own<br />
benefits, not by chance but by design, and perpetuate and<br />
enhance conditions that further benefit themselves or their<br />
socio-political class. This is particularly true in cities with<br />
poor governance arrangements, weak institutions and nonexisting<br />
or ineffective planning structures − in other words,<br />
in cities where the ‘hub’ of the wheel of prosperity is not<br />
properly working and fails to steer growth and development<br />
in a more equitable manner.<br />
The UN-Habitat survey on urban prosperity in<br />
developing regions has highlighted corruption as the<br />
greatest barrier to equity, followed by weak civil society<br />
Figure 2.4.2<br />
Factors restricting the scope of greater urban equity<br />
ranking<br />
4.5<br />
4.0<br />
3.5<br />
3.0<br />
2.5<br />
2.0<br />
1.5<br />
1.0<br />
0.5<br />
0<br />
73<br />
Equity and the <strong>Prosperity</strong> of Cities<br />
(with its role in rights advocacy) (Figure 2.4.2). This is<br />
the case in Lahore, Bangalore, Amman and Beirut. In the<br />
survey, local experts also<br />
cited poor governance,<br />
lack of political will<br />
and structural barriers<br />
The impact of<br />
FACT inequity has been<br />
to pro-equity policies<br />
overlooked in conventional<br />
as other significant<br />
economic and development<br />
hindrances to equity. Far<br />
from being a historic or<br />
inevitable phenomenon,<br />
theory.<br />
urban inequality in this<br />
perspective is understood<br />
More equitable<br />
POLICy cities have<br />
to be the result of<br />
greater chances to be more<br />
deliberate negligence,<br />
prosperous; but prosperity<br />
structural obstacles and<br />
does not happen all by itself,<br />
weak capacities to counter<br />
or as a logical consequence<br />
prevailing conditions.<br />
of economic growth.<br />
Historic patterns of inequality Corruption Discriminatory practices<br />
Inef�cient and ineffective government<br />
Lack of democracy<br />
Lack of interest from ruling elites Public institutions controlled by ruling elite<br />
Lack of funds<br />
FACT<br />
While equity has a direct effect on the emergence of<br />
prosperity, it must be brought about through the other<br />
dimensions of prosperity.<br />
Weak civil society to claim or defend rights<br />
Africa Asia LAC Arab States All regions
State of the World’s Cities <strong>2012</strong>/<strong>2013</strong><br />
FOSTERING SOCIAL INCLUSION<br />
Unequal income and unequal opportunities are the two<br />
main underlying factors of urban inequity. They derive<br />
from biases in distribution at national level as well as<br />
dysfunctions at the local urban level. In this sense, inequity<br />
reveals a differentiation in the manner in which resources<br />
are allocated and facilities and services accessed. The main<br />
driver of inequity often tends to be differential access<br />
to employment as well as to public goods and services.<br />
Inequity in this respect reflects biases in the economic<br />
realm which effectively concentrate a disproportionate<br />
share of resources, services and opportunities in the hands<br />
of certain groups or individuals. A common response is<br />
the consolidation of redistributive programmes, mainly<br />
in the area of social welfare. In developing countries, this<br />
has been complemented with the design of local economic<br />
development initiatives as well as poverty alleviation<br />
measures. However, it has become increasingly evident that<br />
beyond dysfunctions in the distributive systems, in both<br />
developed and developing countries, some systemic barriers<br />
sustain outright discrimination and alienation.<br />
Transcending poverty and deprivation, social inclusion<br />
as both a process and an outcome entails the removal of<br />
barriers to access to goods, services and opportunities<br />
as well as improved wellbeing and self-fulfilment. This<br />
goes to show that social inclusion is not just reactive;<br />
rather, it recognizes the<br />
importance of differences<br />
POLICy<br />
Cities willing to<br />
embrace shared<br />
prosperity must also look<br />
beyond equity to ensure the<br />
promotion of social inclusion<br />
as a whole.<br />
FACT<br />
Equity is also<br />
about social and<br />
political relations among<br />
urban populations as well<br />
as among government<br />
institutions and individuals<br />
and social groups. It is the<br />
relational dimension which<br />
underlies the degree to<br />
which a city operates and<br />
sustains as a collective<br />
entity.<br />
and diversity, and harnesses<br />
the commonality of lived<br />
and shared experiences<br />
to achieve positive<br />
societal ends.<br />
To a substantial<br />
degree, the urban protest<br />
movements that were<br />
referred to earlier in this<br />
Report have been about<br />
social inclusion (Chapter<br />
1, Part 1). The rallying cry,<br />
“We are the 99 per cent”,<br />
is more of a reaction to<br />
exclusion and alienation<br />
than a protest against<br />
poverty or deprivation.<br />
Whereas equity in its<br />
primarily economic<br />
dimension is driven by<br />
74<br />
‘macro’ and national policies, most interventions in favour<br />
of social inclusion take place at the local level. Therefore,<br />
urban authorities have a major role to play when it comes to<br />
making shared prosperity a reality within their jurisdictions.<br />
In European cities an abundance of initiatives have been<br />
introduced to promote social inclusion, and their benefits<br />
seem to have registered in the UN-Habitat “City <strong>Prosperity</strong><br />
Index”. For example, the ‘Cities Against Social Exclusion’<br />
(CASE) programme illustrates the concerted efforts at local<br />
and regional levels to share experiences and improve local<br />
action among a network of European cities.<br />
Typical interventions, such as in Stockholm, include<br />
removal of barriers to full engagement of women, youths,<br />
the homeless, the elderly and the disabled. In Vienna,<br />
an elaborate action plan involves systems for nondiscrimination<br />
at all levels, improved political and social<br />
participation of all minority groups including migrants, and<br />
measurable monitoring of social diversity and integration.<br />
As Vienna’s mayor once put it, “Social cohesion and a<br />
climate of respect are particularly important at a time when<br />
we all face new challenges. Good neighbourly relations<br />
cannot be enacted by law. The people who live in Vienna<br />
need to come to an understanding and formulate mutually<br />
acceptable solutions.” 19<br />
Similar noteworthy experiences are emerging in<br />
developing countries where Medellín, Dar es Salaam<br />
and Kigali, for instance, have found effective ways of<br />
enhancing prosperity based on relatively lower productivity,<br />
infrastructural development and quality of life. Medellín has<br />
resorted to civic architecture and public spaces to further<br />
inclusiveness and the empowerment of otherwise marginalized<br />
social groups. These groups benefit from expanded public<br />
facilities as infrastructure reaches out to them, improving not<br />
just their sense of wellbeing<br />
but also their capacity<br />
fully to engage with the<br />
At the city<br />
urban fabric. In Dar es POLICy level, social<br />
Salaam, a conscientious<br />
inclusion provides an<br />
environment where<br />
plan for socially mixed<br />
individuals feel they<br />
neighbourhoods has<br />
belong to the larger<br />
brought more inclusion<br />
whole, have access<br />
both in space and in<br />
to ‘commons’ and are<br />
social relations. In Kigali,<br />
free fully to engage in<br />
innovative measures aim to<br />
collective affairs. Social<br />
inclusion involves a<br />
consolidate reconciliation<br />
broad set of variables<br />
and integration as part<br />
as it hinges upon<br />
of the post-genocide<br />
the socio-political<br />
reconstruction process.<br />
relationship.
PLACING EQUITy ON <strong>THE</strong> DEvELOPMENT AGENDA<br />
UN-Habitat policy analysis shows that in most developed<br />
countries, concerns for socio-economic equity are typically<br />
built into concerted actions from local and national<br />
governments. This will usually result in urban policies<br />
promoting inclusion, diversity, multi-ethnicity, affirmative<br />
action, positive discrimination and pro-poor planning. This<br />
in turn can take the form of wide-ranging programmes<br />
and actions, from strategic positioning of educational and<br />
recreational centres to low-cost housing to quota systems<br />
to encourage minority engagement in local politics and<br />
representation, as well as targeted subsidies and financial<br />
support for new businesses. Similar policies and dedicated<br />
institutions are found at the municipal level in most<br />
developed countries and in some emerging economies.<br />
Local experts in the UN-Habitat survey believe that<br />
equity is primarily the responsibility of public authorities;<br />
where a failure of political will, or indifference, are to blame<br />
for deficient, or total lack of, effective policy. Such failure<br />
can be identified at national or local level. In the survey,<br />
local experts in Nairobi, Luanda, Kuwait City, Lahore,<br />
Figure 2.4.3<br />
Most notable policy or action the city is implementing to be more equitable<br />
per cent<br />
40<br />
35<br />
30<br />
25<br />
20<br />
15<br />
10<br />
5<br />
0<br />
Vocational education and training to<br />
enable skills development<br />
Cash transfers and other forms of �nancial<br />
support for disadvantaged groups<br />
Other<br />
75<br />
Equity and the <strong>Prosperity</strong> of Cities<br />
Lima, Fort-de-France, Erbil<br />
and Saida felt that national POLICy<br />
governments showed<br />
little concern for inequity<br />
whereas local experts<br />
in Alexandria, Algiers,<br />
Hyderabad, Guadalajara,<br />
Panama City, Beirut and Doha report that it is local policymakers<br />
who show little concern for equity.<br />
Elsewhere, local experts report that some cities<br />
prioritize equity in planning and policy strategies.<br />
Figure 2.4.3 summarises the types of action they use. In<br />
African and Asian cities in the UN-Habitat survey, pro-poor<br />
vocational training and skills programmes are emphasised,<br />
with some projects explicitly targeting the poor and<br />
Addressing<br />
inequities<br />
requires political will, strong<br />
institutions and welltargeted<br />
policies.<br />
Easier access to employment<br />
and opportunities<br />
Financial incentives for the<br />
urban poor<br />
None<br />
FACT<br />
Institutions are not fully contributing to equity. Rulers lack<br />
interest and ineffective governments are hampering the<br />
potential for more equitable cities.<br />
New rules and regulations to promote<br />
equitable development<br />
Speci�c projects targeting the poor<br />
& marginalized<br />
Africa Asia LAC Arab States All regions
State of the World’s Cities <strong>2012</strong>/<strong>2013</strong><br />
marginalised. Singapore offers a clear example of repeated<br />
commitment by the government to education and training<br />
for all in an environment that promotes productivity and<br />
social mobility. In Ho Chi Minh City, government-led<br />
promotion of the high-tech (IT) and service sectors offers<br />
widespread new opportunities for communities to switch<br />
away from conventional manual labour. 20 In Africa, Addis<br />
Ababa’s Micro and Small Enterprises Development Strategy<br />
targets the unemployed. 21 Johannesburg enhances the skills<br />
of poor communities, expanding access to education and<br />
76<br />
Medellín, Colombia: children enjoy education at a junior school.<br />
© Jez Coulson/Panos Pictures<br />
training. In Latin American and Caribbean countries, some<br />
experts cited cash transfers and other financial assistance<br />
in support of marginalised groups, such as Brazil’s “Bolsa<br />
Familia” and Mexico’s “Oportunidades” programme.<br />
In Arab cities, local experts found that new rules and<br />
regulations did promote equitable development.
Box 2.4.3<br />
Making Progress on the Equity Agenda<br />
Today, some cities and<br />
national governments in the<br />
developing world are<br />
beginning to prioritize equity<br />
through concerted actions.<br />
They understand that working<br />
together maximizes their<br />
possibilities to make positive<br />
changes in the living<br />
conditions of the urban poor.<br />
They also understand that<br />
equity is a fundamental aspect<br />
Endnotes<br />
POLICy<br />
There is no<br />
substitute<br />
for government<br />
leadership to address<br />
issues of equity,<br />
with civil society in<br />
advocacy, support and<br />
complementary roles.<br />
of prosperity. Their interventions are closely linked to propoor<br />
programmes such as, in Alexandria, the Social Fund<br />
for Development, which focuses on small- and medium-size<br />
businesses; in Gaziantep, the Social Solidarity Fund whose cash<br />
transfers are conditional on children being sent to school; in<br />
Lahore, the Benazir Income Support Programme; in Shenzhen,<br />
social equity policies have brought large numbers of migrant<br />
workers and vulnerable groups into the city’s social housing and<br />
welfare system; in Ho Chi Minh City, the ‘Doimoi’ reform process<br />
has reduced inequalities in Vietnam’s capital.<br />
1 World Bank (2006) World Development Report 2006 - Equity and Development,<br />
Oxford University Press ,Oxford<br />
2 Gewirth, A. (1996), The Community of Rights, Chicago: University of Chicago Press<br />
3 UN-Habitat (2010) State of the World’s Cities Report 2010/2011: Bridging the Urban<br />
Divide, Earthscan, London<br />
4 OECD (2011) Divided We Stand: Why Inequality Keeps Rising, OECD Publishing, Paris,<br />
pp.22<br />
5 Ibid.<br />
6 Sen, A. (1999) Development as Freedom, Oxford University Press, Oxford<br />
7 Shabou, A., N. Soboh, K. Jalouka, and D. A. Thaib (2011) City Report on Amman,<br />
Unpublished UN-Habitat background study for “State of the World’s Cities Report<br />
<strong>2012</strong>/<strong>2013</strong>”<br />
8 Belliapa, S.G. (2011) City Report on Bangalore, Unpublished UN-Habitat background<br />
study for “State of the World’s Cities Report <strong>2012</strong>/<strong>2013</strong>”<br />
9 Hampwaye, G. and W. Nchito (2011) City Report on Lusaka, Unpublished UN-Habitat<br />
background study for “State of the World’s Cities Report <strong>2012</strong>/<strong>2013</strong>”<br />
10 UN-Habitat (2010) Op. Cit<br />
11 UNICEF(2010) Understanding Urban Inequalities in Bangladesh: A prerequisite for<br />
achieving Vision 2021, UNICEF Bangladesh, Dhaka<br />
12 Turok, I (2006) ‘The Connection between Social Cohesion and City Competitiveness’,<br />
in OECD Territorial Reviews Competitive Cities in the Global Economy, OECD<br />
publishing, Paris.<br />
13 UN-Habitat (2010) Op. Cit; UN-Habitat (2008) State of the World’s Cities Report<br />
2008/2009: Harmonious cities, Earthscan, London<br />
77<br />
Equity and the <strong>Prosperity</strong> of Cities<br />
Cities are also allocating funds and introducing local<br />
programmes to promote equity. Some of these interventions are<br />
becoming best practices and good examples that are inspiring<br />
other cities, and sometimes national governments. Authorities<br />
in Chongqing have made social equity a primary goal. Priority<br />
public rental housing programmes have improved conditions<br />
and rural migrant workers’ rights are better protected. In Beirut,<br />
vulnerable groups are targeted for special social support as part<br />
of a scheme that has significantly reduced homelessness and<br />
the number of people (10 per cent in 2009) below the National<br />
Poverty line 22). Faced with very steep income inequality (with<br />
Gini coefficients as high as 0.75 in 2005), Johannesburg is<br />
responding with pro-poor policies including ‘Cash Social Grants’.<br />
Singapore integrates equity in national development policies<br />
and urban planning. According to a local expert, ‘There is room<br />
for upward social mobility among the poor and lower-middle<br />
class people through adequate opportunities for all in education<br />
and the job market’.<br />
14 OECD (2006) OECD Territorial Reviews Competitive Cities in the Global Economy,<br />
OECD publishing, Paris.<br />
15 Society for International Development (SID) ( <strong>2012</strong>) The State of East Africa Report<br />
<strong>2012</strong>: Deepening Integration, Intensifying Challenges, http://www.sidint.net/docs/<br />
SoEAR<strong>2012</strong>_final.pdf<br />
16 SID Programme director Aidan Eyakuze [Mungai, C. (<strong>2012</strong>) ‘East Africa region’s<br />
economy expands amid deepening levels of poverty and malnutrition’ in The East<br />
African, April 7, http://www.theeastafrican.co.ke/news/A+richer+East+African+Com<br />
munity+with+more+poor+people/-/2558/1381658/-/v2nkg7/-/index.html]<br />
17 Urban Age (2009) Cities and Social Equity: Inequality, Territory and Urban Form,<br />
Summary report, http://downloads0.cloud.lsecities.net/downloads/2009/09/<br />
SouthAmericaReport/CSE_Summary_Report.pdf<br />
18 United Nations General Assembly (2011) Accelerating progress towards the<br />
Millennium Development Goals: options for sustained and inclusive growth and<br />
issues for advancing the United Nations development agenda beyond 2015, Annual<br />
report of the Secretary-General (A/66/126) ,July 2011<br />
19 Vienna City Administration (n.d) Vienna Charter. Shaping the Future Together, http://<br />
www.wien.gv.at/english/living-working/vienna-charter.html<br />
20 Dzung, D. D. (2011) City Report on Ho Chi Minh City, Unpublished UN-Habitat<br />
background study for “State of the World’s Cities Report <strong>2012</strong>/<strong>2013</strong>”<br />
21 Admassie, Y. (2011) City Report on Addis Ababa, Unpublished UN-Habitat background<br />
study for “State of the World’s Cities Report <strong>2012</strong>/<strong>2013</strong>”<br />
22 UNDP (2009) Arab Human Development Report: Challenges to Human Security in the<br />
Arab Countries , UNDP , New York,,p. 113-114.
Chapter 2.5<br />
Environmental<br />
Sustainability and the<br />
<strong>Prosperity</strong> of Cities<br />
The prosperity and environmental sustainability of cities are<br />
inextricably linked. Urban areas consume huge amounts of<br />
environmental goods and services like food, water, energy,<br />
forestry, building materials, and ‘green’ or open spaces often<br />
beyond their boundaries. This undermines the assimilative<br />
capacity of the environment around urban areas. 1 For<br />
example, the cities of the world generate over 720 billion<br />
tons of wastes every year, but in developing regions, even<br />
in large, presumably more<br />
affluent, cities only 25 to<br />
55 per cent of wastes are<br />
collected. 2 Demographic<br />
and spatial expansion can<br />
be so rapid as to outstrip<br />
the capacity of cities to<br />
provide basic amenities −<br />
housing, water and<br />
sanitation, etc. − resulting<br />
in poor urban conditions. 3<br />
FACT Environmentally<br />
sustainable cities<br />
are likely to be more<br />
productive, competitive,<br />
innovative, and prosperous<br />
enough to provide better<br />
preservation for the<br />
environment and enhance<br />
quality of life and well-being<br />
for all the population.<br />
POLICy<br />
Inasmuch cities are sources of environmental<br />
problems within and beyond their jurisdictions,<br />
they are also best-placed to provide most of the solutions.<br />
Environmentally sustainable cities are able to draw a healthy<br />
balance between economic growth and the environment, and<br />
facilitate prosperity and resilience in the process. 4<br />
78<br />
A key message is that prosperous cities can operate<br />
efficiently and productively without damaging the<br />
environment. 5 This is possible only when environmental<br />
and social objectives are fully integrated in a city’s overall<br />
economic goals to help bring about environmental<br />
sustainability. 6<br />
ENvIRONMENTAL SUSTAINABILITy IN <strong>CITIES</strong><br />
It is generally assumed that any country can preserve<br />
the environment while maintaining economic growth. 7<br />
However, a degree of commitment is required from all<br />
Solar panel assembly at a Suntech factory in Wuxi, China. A high<br />
percentage of China's homes use solar-heated water.<br />
© Qilai Shen/Panos Pictures
stakeholders, particularly at local level, if sustainable<br />
development is to be achieved. 8<br />
Nowhere are the commitments of cities to<br />
environmental sustainability more vital than in developing<br />
countries, where urban demographics are growing rapidly<br />
and current total population accounts for 82 per cent<br />
of the world population. This underscores the need for<br />
growth and prosperity to sustain and fulfil basic needs.<br />
Vitally important as economic growth may be, it must be<br />
sustainable if any city is to achieve prosperity.<br />
AFRICAN <strong>CITIES</strong><br />
In Nairobi, for example, local experts point to extensive<br />
pollution of the Nairobi River not just by industrial effluents<br />
but also solid waste. 12 Traffic congestion is also mentioned<br />
as a major environmental problem, and apart from the<br />
attendant air pollution, the cost to the local economy<br />
is enormous. 13 Similar opinions are held by experts in<br />
Lusaka, Accra, Algiers, Lagos, Ibadan and Luanda, where<br />
rapid urban sprawl and uncontrolled spatial development<br />
combine with poor infrastructures and weak regulatory<br />
Figure 2.5.1<br />
Environmental Impact of Growth* – African Cities<br />
per cent<br />
100<br />
90<br />
80<br />
70<br />
60<br />
50<br />
40<br />
30<br />
20<br />
10<br />
0<br />
Nairobi<br />
Lusaka<br />
Praia<br />
Algiers<br />
Dar Es Salaam<br />
Ibadan<br />
Accra<br />
Luanda<br />
* As perceived by local experts surveyed by UN-Habitat<br />
Source: UN-Habitat, City Monitoring Branch, Policy Survey, 2011<br />
Lagos<br />
Addis Ababa<br />
Gaborone<br />
79<br />
Environmental Sustainability and the <strong>Prosperity</strong> of Cities<br />
FACT<br />
In Europe, cities stand at the forefront of initiatives<br />
in favour of environmental sustainability9 , as they<br />
keep developing and implementing various policies and<br />
strategies. 10<br />
POLICy<br />
If economic development and related urban activities<br />
are pursued in an environmentally sustainable<br />
manner, they can facilitate urban prosperity.<br />
frameworks to undermine quality of life and, more<br />
generally, prosperity in their respective cities.<br />
Of the fourteen African cities covered in this Report,<br />
no more than four – Johannesburg, Beira, Alexandria, and<br />
Gaborone – can be found where only a few local experts<br />
perceive that economic development and related activities<br />
have negative effects on<br />
the environment. This<br />
comes as no surprise<br />
Africa’s rate<br />
FACT of economic<br />
growth has outpaced<br />
the global economic<br />
growth over the last<br />
decade. Real growth<br />
GDP has been steady<br />
particularly in the<br />
Sub-Saharan region,<br />
a sub-region expected<br />
to continue growing by<br />
more than 5 per cent. 11<br />
Alexandria<br />
Johannesburg<br />
Beira<br />
All Sampled<br />
Africa Cities<br />
POLICy<br />
However, an<br />
overwhelming<br />
majority of local experts<br />
believe that urban<br />
economic development has<br />
unintended effects on the<br />
environment in cities such<br />
as Nairobi, Lusaka, Praia,<br />
Algiers, Dar es Salaam,<br />
Ibadan, Accra, Luanda and<br />
Lagos. These cities are<br />
seen to be unable to match<br />
sustained economic and<br />
demographic growth with<br />
corresponding expansion in<br />
infrastructures and services.
State of the World’s Cities <strong>2012</strong>/<strong>2013</strong><br />
FACT<br />
In some African cities, a large majority of local<br />
experts report that although economic developed and<br />
related urban activities have detrimental effects on the natural<br />
environment, sustainability is largely overlooked by policy-makers.<br />
given that these cities are<br />
among those pursuing<br />
environmental sustainability<br />
as a matter of policy.<br />
South Africa’s<br />
economic capital has been<br />
systematically promoting<br />
creation and preservation<br />
of open spaces, pursuing energy efficiency and the reduction<br />
of greenhouse gases, and promoting solar energy, energysaving<br />
bulbs and insulation as part of a retrofitting scheme.<br />
Above all, the city promotes sustainable building design<br />
and construction through a comprehensive set of planning<br />
regulations, whereby a sustainable approach must pervade all<br />
planning stages. 14<br />
POLICy Johannesburg’s<br />
approach to<br />
environmental sustainability<br />
appears to be the most<br />
comprehensive of all African<br />
cities.<br />
FACT<br />
Apart from cities<br />
in the Arab States,<br />
economic development and<br />
urban activities in Asian<br />
cities are perceived to have<br />
the least detrimental effects<br />
on the natural environment.<br />
POLICy<br />
When cities<br />
promote<br />
environmental sustainability<br />
as a matter of policy,<br />
they are able to cushion<br />
the unintended effects of<br />
economic development<br />
and urban activities.<br />
Environmentally sustainable<br />
cities are, almost by<br />
definition, more compact,<br />
energy-efficient, clean<br />
and less polluted, more<br />
accessible, and offer better<br />
transport choices<br />
Figure 2.5.2<br />
Environmental Impact of Growth* – Asian Cities<br />
per cent<br />
90<br />
80<br />
70<br />
60<br />
50<br />
40<br />
30<br />
20<br />
10<br />
0<br />
Ho Chi<br />
Minh City<br />
Bangalore<br />
Lahore<br />
80<br />
ASIAN <strong>CITIES</strong><br />
However, the expert opinion survey reveals differences<br />
across cities. For instance, economic growth is not<br />
perceived to have been matched by adequate infrastructure<br />
and services in Ho Chi Minh City, Bangalore, Lahore, and<br />
Hyderabad. In Lahore, experts point to ground water<br />
pollution, extensive air pollution, traffic congestion and<br />
urban sprawl as major effects of economic development and<br />
urban activities on the environment, these are compounded<br />
by inadequate capacity and weak institutions. 15 Similarly<br />
in Bangalore, experts point to poor air quality, depletion<br />
of ground water tables and fast receding lakes. 16 These<br />
perceptions contrast with those of local experts in<br />
Singapore, Turkey’s Gaziantep, and Shenzhen, where very<br />
few local experts view economic growth and urban activities<br />
as detrimental to the environment (Figure 2.5.2).<br />
In Asia, close to two-thirds of local experts report<br />
that this type of policy is at work in their respective cities,<br />
especially in Singapore and Ho Chi Minh City. Singapore<br />
is fully committed to environmental sustainability. This<br />
includes environmental awareness campaigns, with<br />
Hyderabad<br />
Davao<br />
* As perceived by local experts surveyed by UN-Habitat<br />
Source: UN-Habitat, City Monitoring Branch, Policy Survey, 2011<br />
Cebu<br />
Gaziantep<br />
Shenzen<br />
Singapore<br />
All Sampled<br />
Asian Cities
institutions and grassroots leaders collaborating on<br />
community outreach schemes, and various programmes<br />
involving the citizenry in the ‘sustainable’ agenda. The city-<br />
State’s ‘compact city initiative’ promotes density, facilitates<br />
mass transit and includes a ‘walkable’ campaign. Under<br />
Singapore’s waste management scheme, 58 per cent of solid<br />
wastes are recycled, another 40 per cent incinerated to<br />
produce energy, and the remaining two per cent goes to a<br />
purpose built off-shore sanitary landfill.<br />
<strong>CITIES</strong> IN ARAB <strong>STATE</strong>S<br />
Across Arab States, only one-third of local experts consider<br />
that economic development has unintended detrimental<br />
effects on the environment (Figure 2.5.3). However, this<br />
favourable average conceals sharp differences across<br />
cities. Experts that view that economic development has<br />
negative effects on the environment are an overwhelming<br />
majority in Beirut, and 50 per cent in Kuwait City, Shiraz<br />
and Muharrak in Bahrain. These cities have relatively<br />
large populations (Beirut, Kuwait City and Shiraz) and<br />
intense economic activity. In Beirut, local experts see a<br />
direct link between rapid<br />
urban expansion and<br />
environmental problems,<br />
with one describing the city<br />
Figure 2.5.3<br />
as “a metaphor for brutal<br />
real estate speculation”,<br />
per cent<br />
with attendant noise<br />
90<br />
pollution and traffic<br />
congestion. 17<br />
Similarly in Kuwait<br />
City, local experts point<br />
to the construction boom<br />
associated with economic<br />
growth and urban<br />
expansion. As noted by<br />
one, this double boom has<br />
placed “acute pressures on<br />
road networks, with traffic<br />
becoming a nightmare”. 18<br />
Only very few local<br />
experts in Saida (Lebanon),<br />
Basra and Beirut believe<br />
their respective cities<br />
promote environmental<br />
sustainability as a matter<br />
of policy. In Beirut,<br />
“environmental concerns<br />
80<br />
70<br />
60<br />
50<br />
40<br />
30<br />
20<br />
10<br />
0<br />
Environmental Impact of Growth* – Arab Cities<br />
Beirut<br />
Kuwait City<br />
Muharrak<br />
Shiraz<br />
81<br />
Environmental Sustainability and the <strong>Prosperity</strong> of Cities<br />
are rarely considered”, with an absence of effective policies<br />
for urban planning, although they are needed in areas<br />
like traffic and waste management. 19 However, in Doha,<br />
Aqaba and Dubai, most local experts report that their<br />
respective cities have proper policies in place. In Dubai,<br />
environmental sustainability policies include the Emirates’<br />
Energy and Environment Rating System and the Air<br />
Quality Management System, among other robust policies<br />
and governance mechanisms promoting environmental<br />
sustainability in Qatar’s capital city. 20<br />
LATIN AMERICA AND <strong>THE</strong> CARIBBEAN<br />
Two distinct phenomena may be at play here: the region’s<br />
high rates of urban spatial expansion and relatively high<br />
Amman<br />
POLICy<br />
Basra<br />
* As perceived by local experts surveyed by UN-Habitat<br />
Source: UN-Habitat, City Monitoring Branch, Policy Survey, 2011<br />
The main message from Arab States is that<br />
urbanisation and economic growth are inevitable;<br />
and if matched with appropriate and effective policies and<br />
governance, the environmental consequences are manageable.<br />
Erbil<br />
Dubai<br />
Doha<br />
Aqaba<br />
Saida<br />
All Sampled<br />
Arab Cities
State of the World’s Cities <strong>2012</strong>/<strong>2013</strong><br />
FACT<br />
The overall<br />
picture in Latin<br />
American cities is one of<br />
inadequate commitment to<br />
environmental sustainability,<br />
with the concomitant<br />
absence of policies or<br />
strategies. This leaves<br />
relatively few opportunities<br />
for wider participation in<br />
environmental policies,<br />
which can only further<br />
exacerbate the negative<br />
effects of economic<br />
development and urban<br />
activities on the natural<br />
environment.<br />
POLICy<br />
Figure 2.5.4<br />
Environmental Impact of Growth* – Latin America and Caribbean Cities<br />
per cent<br />
90<br />
80<br />
70<br />
60<br />
50<br />
40<br />
30<br />
20<br />
10<br />
degrees of economic<br />
development. The<br />
consequences of economic<br />
development on the environment are considered as<br />
‘serious’ or ‘very serious’ by majorities of local experts in<br />
Guadalajara, Lima, Ciudad de Este, Medellín, La Paz and<br />
Valparaíso (Figure 2.5.4). In Medellín, experts point to the<br />
224,000 tons of pollutants discharged annually into the<br />
atmosphere, of which 66 per cent are traceable to traffic<br />
in a city that keeps expanding rapidly in both surface<br />
area and population. 21 In Santo Domingo, rapid urban<br />
sprawl and population expansion are fuelled by natural<br />
resource exploitation, and the two combine with weak<br />
institutions to compound environmental problems. 22 In<br />
Lima, an overwhelming number of local experts concur<br />
that environmental sustainability has not been a priority in<br />
the management of the city. The few existing initiatives are<br />
largely uncoordinated, though all under the responsibility of<br />
the central rather than local government. 23<br />
de-France, from 2008 onwards, a determined mayor has<br />
taken action, challenging environmental misbehaviour –<br />
particularly with regard to solid waste – and vigorously<br />
enforcing rules and regulations across all sectors through<br />
a so-called ‘green brigade’.<br />
On the other hand, environmental sustainability<br />
policies have worked relatively well in Fort-de-France,<br />
Havana and Venezuela’s Guarenas. In the case of Fort-<br />
24 Similarly in Medellín, the<br />
municipality’s environmental department implements<br />
a variety of ‘sustainable’ policies with regard to noise<br />
pollution, global warming, water conservation and<br />
reforestation. A range of targets have been set involving<br />
various greenhouse gas emission controls and air<br />
quality. As one local expert put it, “the municipality is<br />
awakening and educating people towards a more responsible<br />
environmental behaviour.” 25<br />
Latin America<br />
and the<br />
Caribbean is the region<br />
where a greater proportion<br />
of local experts believe that<br />
0<br />
economic development<br />
* As perceived by local experts surveyed by UN-Habitat<br />
and urban activities have<br />
(unintended) detrimental<br />
effects on the environment.<br />
Source: UN-Habitat, City Monitoring Branch, Policy Survey, 2011<br />
ENvIRONMENTAL SUSTAINABILITy: A CATALyST<br />
FOR CITy PROSPERITy<br />
Environmental sustainability offers cities huge scope for<br />
the balanced economic growth that can pave the way<br />
to prosperity. This includes opportunities for new types<br />
of employment and investment, poverty alleviation and<br />
reduced inequity together with new types of infrastructures<br />
and services.<br />
82<br />
Guadalajara<br />
Lima<br />
Este<br />
Santo Domingo<br />
Medellin<br />
La Paz<br />
Valparaiso<br />
Panama<br />
Santos<br />
Guarenas<br />
Tijuana<br />
Montevideo<br />
La Habana<br />
Rosario<br />
Fort-De-France<br />
All Sampled<br />
Arab Cities
RENEWABLE ENERGIES<br />
The renewable energy sector – solar, wind, hydroelectric,<br />
geothermal and bio-fuel – continues to attract huge<br />
investments. In 2010, a total of USD 243 billion had been<br />
committed to this sector worldwide28 ; this is projected to<br />
rise to USD 630 billion by 2030, in the process creating<br />
as many as 20 million jobs. 29 Although much of this has<br />
concentrated on developed countries, investments in<br />
renewable energies are beginning to materialise in the<br />
developing world. 30<br />
Around the world, about 300,000 workers are employed<br />
in the wind power sector alone, and another 100,000<br />
in solar photovoltaic, while some 1.2 million jobs have<br />
already been created in the biomass sector in Brazil, China,<br />
Germany and the USA. 31 In the UK for example, 250,000<br />
people are already employed in the various renewable<br />
energy sectors estimated to<br />
be worth USD 53 billion<br />
annually. 32<br />
While developed countries<br />
have the lion’s share of<br />
jobs in the sustainable<br />
sector around the world,<br />
huge opportunities exist<br />
for developing countries.<br />
India is looking to create<br />
no fewer than 100 million<br />
jobs in this sector within<br />
10 years, most of which<br />
are expected to be in the<br />
solar energy sector. 33 South<br />
Africa reckons that 98,000<br />
new ‘low carbon’ jobs are<br />
possible in the short term,<br />
and close to 717,000 in the<br />
medium to long-term34 , to<br />
be split into recycling, solar<br />
energy and retrofitting of<br />
old buildings for energy<br />
efficiency.<br />
POLICy Investment<br />
in renewable<br />
energies could generate<br />
more employment<br />
and income for urban<br />
households.<br />
83<br />
Environmental Sustainability and the <strong>Prosperity</strong> of Cities<br />
POLICy<br />
Environmental sustainability offers huge<br />
employment potential in terms of: substitution<br />
of renewable alternatives for non-renewable resources,<br />
recycling and reusing materials26 , production and installation<br />
of renewable energy systems, sustainable urban transport,<br />
waste recycling, retrofitting old buildings, new sustainable<br />
buildings and infrastructures, and environmental services. 27<br />
WASTE AND RECyCLING<br />
In Bangladesh, 800,000 of the 3.5 million potential<br />
jobs associated with environmental sustainability are in<br />
recycling. 36 Besides new jobs, waste management and<br />
recycling have also spawned technical innovations, leading<br />
to the creation of many specialised small- and medium-sized<br />
businesses in cities of developing countries. 37<br />
India: the wind turbine area of southern Tamil Nadu runs for mile after mile across the plains south<br />
of the Southern Ghats mountains, producing electricity for part of the massive demand for power<br />
throughout India.<br />
© <strong>2012</strong> Peter Herbert/fotoLIBRA.com
State of the World’s Cities <strong>2012</strong>/<strong>2013</strong><br />
POLICy Waste<br />
management<br />
and recycling can be a<br />
huge source of employment<br />
in developing countries<br />
where 15 million people are<br />
estimated to work in waste<br />
collecting and processing. 35<br />
BUILDINGS<br />
Buildings have a major role<br />
to play in climate change<br />
mitigation because of the<br />
disproportionate amounts<br />
of natural resources, waste and pollution they involve. For<br />
instance, 60 per cent of the operational energy of a typical<br />
building goes to cooling and heating, 18 per cent to water<br />
heating, six per cent to refrigeration and three per cent to<br />
POLICy<br />
Dhaka, Bangladesh: in a factory producing Polyethylene Terephthalate (PET) flakes, women sort plastic<br />
bottles collected from the streets. Bangladesh exports over 20,000 tons of PET flakes made in 3,000<br />
factories across the country. The industry is worth GBP 7 million, and growing by 20% per annum.<br />
© G.M.B. Akash/Panos Pictures<br />
The construction industry has the largest potential<br />
to create ‘green’ jobs in urban areas. The building<br />
and construction sector employs more than 111 million people<br />
worldwide, or approximately 5–10 per cent of total employment<br />
at the country level with 75 per cent in developing countries and<br />
90 per cent in micro-firms (those with fewer than 10 employees). 39<br />
84<br />
POLICy<br />
In Ouagadougou,<br />
Burkina Faso,<br />
a project for collecting<br />
and recycling plastic<br />
waste has helped improve<br />
environmental conditions<br />
and has created jobs and<br />
incomes for local people,<br />
who either collect the<br />
plastic waste or work in<br />
the recycling centre. The<br />
project has also resulted in<br />
a cleaner environment in the<br />
suburbs and has generated<br />
USD 35,000 in revenues. 38<br />
lighting. This is why buildings have been identified as having<br />
the greatest potential for reduced greenhouse emissions. 40<br />
In addition to this, environmental jobs associated with<br />
buildings will largely occur in retrofitting in accordance with<br />
new sustainable standards, designs and codes. 41<br />
URBAN TRANSPORT<br />
New jobs can be created not only by replacing or<br />
retrofitting old, polluting buses, but also in retrofitting<br />
other vehicles used in urban transport, in a double effort<br />
to reduce air pollution.<br />
The bicycle industry also offers opportunities<br />
for employment, though only in a few countries.
The manufacture of bicycles is dominated by China,<br />
India and the European Union, all of which account for<br />
87 per cent of global production. However, China alone<br />
produces more than half the world’s bicycles.<br />
DRIvERS AND CAPACITy-BUILDING FOR<br />
ENvIRONMENTAL SUSTAINABILITy<br />
Sustainable urban policies are driven by seven main<br />
factors: availability of financial resources, human resources,<br />
appropriate technology, specialised institutions, access to<br />
information, adequate organisational arrangements, and<br />
supportive legal frameworks.<br />
Approximately one-third of local experts across all<br />
regions are of the view that mechanisms for coordination<br />
between city and national authorities regarding<br />
environmental sustainability are already in place<br />
(Table 2.5.1). Less than one-third report that cities are<br />
mobilising investment to support sustainable resource use,<br />
or pulling their resources together in order to enhance<br />
environmental sustainability.<br />
These efforts can only go so far, it would seem, as<br />
experts simultaneously highlight the widespread problem of<br />
inadequate capacity. This refers to lack of not just finance,<br />
but also effective arrangements to facilitate partnerships<br />
with stakeholders, together with weak institutional<br />
frameworks and poor urban governance structures. 44 These<br />
conditions have drastically restraining effects on cities’<br />
ability for effective mitigation and adaptation.<br />
Similarly, cities and local authorities in developing<br />
countries may find it difficult to prioritize environmental<br />
Table 2.5.1<br />
Drivers of Environmental Sustainability in Cities*<br />
Regions<br />
Available mechanism(s) for<br />
coordination between local and<br />
national authorities concerning<br />
sustainability (%)<br />
85<br />
Environmental Sustainability and the <strong>Prosperity</strong> of Cities<br />
POLICy<br />
Public transport jobs account for 1–2 per cent of<br />
total employment in many countries. In Europe<br />
and the USA, some 30 jobs are created for every USD 1.4<br />
million invested in public transport infrastructure, and another<br />
57 in transport operations proper. 42<br />
POLICy<br />
Pilot projects in the Philippines suggest that<br />
retrofits of two-stroke engines on two- and<br />
three-wheeled vehicles − the most popular public transport<br />
in many developing countries − has cut fuel consumption<br />
by 35–50 per cent and emissions of air pollutants by as<br />
much as 90 per cent. Installing and servicing the kits creates<br />
employment. 43<br />
sustainability issues and challenges over and above<br />
unemployment, poverty, housing shortages, infrastructures<br />
and services, especially where local political expediency<br />
demands this type of action.<br />
This underscores the importance of growth and<br />
prosperity to the capacity of cities to address urban<br />
environmental sustainability issues, and this is also why<br />
they must be innovative and inventive when dealing with<br />
historic urban environmental problems while shaping an<br />
environmentally sustainable future. This situation highlights<br />
the fact that the twin dynamics of sustainability and economic<br />
prosperity are inevitably subject to a number of structural<br />
constraints that are specific to each and every urban area<br />
regardless of size.<br />
Leveraging of investments to<br />
support sustainable resource<br />
use and lower greenhouse<br />
gas emissions (%)<br />
Africa 31 20 20<br />
Arab States 37 35 35<br />
Asia 48 49 48<br />
Latin America & Caribbean 26 18 20<br />
All Regions 34 29 29<br />
* As perceived by local experts surveyed by UN-Habitat<br />
Source: UN-Habitat, City Monitoring Branch, Policy Survey, 2011<br />
Municipalities in same city/<br />
region combining resources<br />
& partnering together for<br />
enhanced environmental<br />
sustainability (%)
State of the World’s Cities <strong>2012</strong>/<strong>2013</strong><br />
FACT<br />
FACT<br />
Cities are best able to<br />
Asia and the Arab<br />
States appear to<br />
combine sustainability and<br />
best placed, in terms of<br />
shared prosperity through<br />
capacities, to deal with<br />
effective urban governance<br />
environmental concerns and transformational<br />
and bring about more<br />
leadership. This type of<br />
sustainable cities.<br />
leadership recognises<br />
the complex interactions<br />
between urbanisation and<br />
the environment at the local, regional, and global levels.<br />
The next step is to put in place appropriate institutions<br />
and build the institutional building capacities required<br />
for environmentally sustainable urban systems including<br />
transport, energy, waste management, rehabilitation of<br />
the built and natural environments, and management of<br />
ecosystem services.<br />
For the time being, local experts across all developing<br />
regions clearly highlight financial and institutional<br />
capacities as a major problem (Table 2.5.2). More<br />
specifically, only a few believe that efficient systems<br />
are in place in their respective regions to monitor<br />
environmental sustainability or the transport sector. Local<br />
experts also identify further challenges, suggesting that<br />
growth has a critical role to play if cities are to be in a<br />
Table 2.5.2<br />
Cities with the capacity for environmental sustainability*<br />
Region<br />
Environmental sustainability requires capacity-building<br />
and resource availability at the local level.<br />
Local authorities<br />
with financial<br />
& institutional<br />
capacity (%)<br />
Integration of<br />
environmental<br />
protection plans<br />
in to policies and<br />
strategies (%)<br />
86<br />
position to tackle the effects of climate change on top of<br />
poverty and inequity.<br />
The need for adequate capacity is further underscored by<br />
the fact that whereas environmental sustainability is widely<br />
recognised as essential, local authorities when faced with<br />
competing demands and budget constraints, consider it to<br />
be the least of priorities. 45 This has implications for cities,<br />
especially given the role they must play in local environmental<br />
issues, including when it comes to responding to the needs<br />
of the population at a time when the need for environmental<br />
preservation is gaining more recognition in public opinion. 46<br />
Efficient<br />
monitoring<br />
systems for<br />
environmental<br />
sustainability (%)<br />
Cities with<br />
environmental<br />
transport policies<br />
(%)<br />
Cities making<br />
progress<br />
toward more<br />
sustainable urban<br />
environment<br />
(%)<br />
Africa 22 48 17 9 36<br />
Arab States 60 46 37 8 46<br />
Asian 64 65 45 31 70<br />
Latin America & the Caribbean 24 47 21 8 46<br />
All Regions 39 51 28 36 43<br />
* As perceived by local experts surveyed by UN-Habitat<br />
Source: UN-Habitat, City Monitoring Branch, Policy Survey, 2011<br />
Kuwait City: skyscraper under construction.<br />
© <strong>2012</strong> Wael Hamdan/fotoLIBRA.com
Nevertheless, cities need not wait until full capacity<br />
is built before adopting and implementing adequate<br />
environmental policies and strategies: indeed, in many cases<br />
cities have managed to enhance overall quality of life despite<br />
modest financial and institutional capacities.<br />
Endnotes<br />
1 Mitlin, D., and S. Satterthwaite (1996) Sustainable Development and Cities. In Pugh,<br />
C. (ed.) Sustainability, the Environment and Urbanisation, Earthscan, London<br />
2 UNEP (1996) Taking Action: Environmental Guide for You and Your Community, UNEP,<br />
Nairobi, http://www.nyo.unep.org/action/08f.htm<br />
3 UN-Habitat (2003) The Challenge of Slums: Global Report on Human Settlements<br />
2003, Earthscan, London<br />
4 UN-Habitat (2011a). Cities and Climate Change: Policy Directions, Abridged edition,<br />
Earthscan, London.<br />
5 Cities Alliance, ICLEI and UNEP (2007) Liveable Cities: The Benefits of Urban<br />
Environmental Planning. A Cities Alliance Study on Good Practices and Useful Tools,<br />
Cities Alliance, Washington DC.<br />
6 Pacione, M. (2003) ‘Urban Environmental Quality and Human Wellbeing; A Social<br />
Geographical Perspective’, Landscape and Urban Planning, vol.65, pp.19-30<br />
7 WCED (World Commission on Environment and Development) (1987) Our Common<br />
Future, Oxford University Press, Oxford<br />
8 United Nations (1992) Agenda 21: Programme of Action for Sustainable Development,<br />
United Nations, New York<br />
9 Portney, K. E. and J.M. Berry (2011) Civil Society and Sustainable Cities. Paper<br />
prepared for the Princeton Conference on Environmental Politics: Research Frontiers<br />
in Comparative and International Environmental Politics, Niehaus Center for<br />
Globalization and Governance, Princeton University, December 2-3, 2011<br />
10 Lafferty, W.M and Eckerberg, K. (1998) From the Earth Summit to Local Agenda 21:<br />
Working Towards Sustainable Development, Earthscan, London.<br />
11 Africa Economic Outlook (<strong>2012</strong>) Macroeconomic Prospects, http://www.<br />
africaneconomicoutlook.org/en/outlook/forecast/<br />
12 Omenya, A. (2011) City Report on Nairobi, Unpublished UN-Habitat background study<br />
for “State of the World’s Cities Report <strong>2012</strong>/<strong>2013</strong>”<br />
13 Ibid.<br />
14 Awuor-Hayanga, R. (2011) City Report on Johannesburg, Unpublished UN-Habitat<br />
background study for “State of the World’s Cities Report <strong>2012</strong>/<strong>2013</strong>”<br />
15 Zaidi, S.S.H. (2011) City Report on Lahore, Unpublished UN-Habitat background study<br />
for “State of the World’s Cities Report <strong>2012</strong>/<strong>2013</strong>”<br />
16 Belliapa, S.G. (2011) City Report on Bangalore, Unpublished UN-Habitat background<br />
study for “State of the World’s Cities Report <strong>2012</strong>/<strong>2013</strong>”<br />
17 Fawaz, M. and N. Baghdadi (2011) City Report on Beirut. Unpublished UN-Habitat<br />
background study for “State of the World’s Cities Report <strong>2012</strong>/<strong>2013</strong>”<br />
18 Khattab, O. (2011) City Report on Kuwait City, Unpublished UN-Habitat background<br />
study for “State of the World’s Cities Report <strong>2012</strong>/<strong>2013</strong>”<br />
19 Ibid.<br />
20 Al-Bassam, D. and J. Mouris (2011) City Report on Dubai, Unpublished UN-Habitat<br />
background study for “State of the World’s Cities Report <strong>2012</strong>/<strong>2013</strong>”<br />
21 Urán, H. B. (2011) City Report on Medellín, Unpublished UN-Habitat background study<br />
for “State of the World’s Cities Report <strong>2012</strong>/<strong>2013</strong>”<br />
22 Castellanos, G. (2011) City Report on Santo Domingo, Unpublished UN-Habitat<br />
background study for “State of the World’s Cities Report <strong>2012</strong>/<strong>2013</strong>”<br />
23 Galimberti, L. D. (2011) City Report on Lima, Unpublished UN-Habitat background<br />
study for “State of the World’s Cities Report <strong>2012</strong>/<strong>2013</strong>”<br />
24 Yerro, A. P. (2011) City Report on Fort-De-France, Unpublished UN-Habitat<br />
background study for “State of the World’s Cities Report <strong>2012</strong>/<strong>2013</strong>”<br />
25 Urán, H. B. (2011) op. cit.<br />
26 UNEP (2008) UNEP Background Paper on Green Jobs, UNEP, Nairobi<br />
87<br />
Environmental Sustainability and the <strong>Prosperity</strong> of Cities<br />
POLICy<br />
Cities must build those financial and other institutions<br />
required to achieve environmental sustainability without<br />
which economic growth will fall short of ensuring shared prosperity.<br />
27 Simon, D., M. Fragkias, R.Leichenko , R. Sánchez-Rodríguez, K. Seto and B.Solecki<br />
(2011) The Green Economy and the <strong>Prosperity</strong> of Cities, background paper for ‘State<br />
of the World Cities Report <strong>2012</strong>/13’<br />
28 UNEP (2011) Renewable energy: Investing in energy and resource efficiency http://<br />
www.unep.org/greeneconomy/Portals/88/documents/ger/GER_6_RenewableEnergy.pdf<br />
29 UNEP (2009) Global Green New Deal, UNEP Policy Brief, http://www.unep.org/<br />
pdf/A_Global_Green_New_Deal_Policy_Brief.pdf<br />
30 Martinot, E. , A. Chaurey , D. Lew, J. R. Moreira, and N. Wamukonya (2002)<br />
‘Renewable Energy Markets in Developing Countries’, Annual Review of Energy and<br />
Environment, vol. 27, pp. 309-348.<br />
31 UNEP, ILO ,IOE and ITUC (2008) Green Jobs: Towards Decent Work in a Sustainable,<br />
Low-Carbon World, UNEP, Nairobi<br />
32 Peacock, L (2011) ‘Future of jobs: Green industry to create thousands of roles’, The<br />
Telegraph, September 15, http://www.telegraph.co.uk/finance/jobs/8765695/Futureof-jobs-Green-industry-to-create-thousands-of-roles.html<br />
33 Shukla, A. (<strong>2012</strong>) ‘India to create 100 million green jobs’, One World South Asia,<br />
February 13, http://southasia.oneworld.net/todaysheadlines/india-to-create-100million-green-jobs/?searchterm=100%20million%20green%20jobs<br />
34 Maia, J., T. Giordano,N. Kelder, G. Bardien, M. Bodibe, P. Du Plooy, X. Jafta, D.<br />
Jarvis, E. Kruger-Cloete, G. Kuhn, R. Lepelle, L. Makaulule. K. Mosoma, S. Neoh, N.<br />
Netshitomboni, T. Ngozo, and J. Swanepoel, (2011) Green Jobs: An Estimate Of The<br />
Direct Employment Potential Of A Greening South African Economy. IDC/DBSA, Trade<br />
and Industrial Policy strategies<br />
35 UNEP, ILO, IOE and ITUC (2008) op. cit.<br />
36 HK (2010) Estimating green jobs in Bangladesh: A GHK report for the ILO, http://<br />
www.ilo.org/wcmsp5/groups/public/---ed_emp/---emp_ent/documents/publication/<br />
wcms_159433.pdf<br />
37 Simon, D., M. Fragkias, R.Leichenko, R. Sánchez-Rodríguez, K. Seto and B.Solecki<br />
(2011) op.cit.<br />
38 ILO (2007) Green jobs initiative in Burkina Faso: From waste to wages, http://www.<br />
ilo.org/global/about-the-ilo/press-and-media-centre/insight/WCMS_084547/langen/index.htm<br />
39 Simon, D., M. Fragkias, R.Leichenko, R. Sánchez-Rodríguez, K. Seto and B.Solecki<br />
(2011) op.cit.<br />
40 Ibid.<br />
41 Renner, M., S. Sweeney and J. Kubit (2008) ‘Green Jobs: Working for People and the<br />
Environment’, WorldWatch Report 177, Worldwatch Institute , Washington, DC<br />
42 UNEP, ILO, IOE and ITUC (2008) op. cit.<br />
43 UNEP, ILO, IOE and ITUC (2008) op. cit.<br />
44 UN-Habitat (2011b) Cities and Climate Change: Global Report on Human Settlements<br />
2011, Earthscan, London<br />
45 Hess, D. and L. Winner (2006) Enhancing Justice and Sustainability at Local Level:<br />
Affordable Policies for Urban Governments, http://www.davidjhess.org/PolicyPaper.pdf<br />
46 UNCED (1992) Capacity Building: Agenda 21’s definition (Chapter 37), United Nations,<br />
New York.
Part Three<br />
Policies for<br />
Prosperous Cities
Chapter 3.1<br />
From Comparative<br />
Advantage to Urban<br />
<strong>Prosperity</strong><br />
Geography has always played an important role in the<br />
evolution of cities. Historically, coastal cities and cities in<br />
river deltas have been preferred locations – at present, 14 of<br />
the world’s 19 largest cities are port cities. However, with<br />
advances in transport and communication technologies and<br />
also with increasing specialization, other locational factors,<br />
beyond positions along waterways, have accelerated the<br />
growth and development of cities. Even when located in the<br />
hinterland, cities located close to other major urban centres<br />
or to important urban agglomerations have significantly<br />
gained from their position and demonstrated relatively<br />
higher levels of development. Indeed, new configurations<br />
such as mega-regions and urban corridors generate regional<br />
economies and trigger the evolution of new patterns of<br />
economic activity which contribute to prosperity. Similarly,<br />
cities which lie in the vicinity of markets and infrastructure,<br />
or close to transnational<br />
borders, have also exhibited<br />
a tendency to grow and<br />
prosper much faster. 1<br />
It is time for<br />
POLICy governments<br />
to recognize the existence<br />
The increasing number<br />
of a wide scope for human of large and dynamic cities<br />
intervention that can<br />
which are not sea or river<br />
enable cities to enhance<br />
ports confirms that much<br />
their potential as engines<br />
of today’s and tomorrow’s as geographic location is<br />
prosperity, both locally and an important correlate of<br />
nationally.<br />
a city’s prosperity, it does<br />
not explain everything.<br />
90<br />
Many cities derive their prosperity from their capacity to<br />
harness other advantages, particularly through repositioning<br />
themselves in the national, regional or global context.<br />
Common among all of them has been their capacity to<br />
change and adjust to new circumstances and to build upon<br />
their own history and identity. Such cities have been able<br />
to envision a new future and to use their different forms of<br />
capital and assets. Critical also has been the ability of these<br />
cities to build social and political consensus. In essence,<br />
many cities today are able to deploy the capacity of human<br />
agency and to steer growth in the new direction of choice.<br />
Indeed, the prosperity of any city is no accident. It is the<br />
result of innovation, sustained vision and good governance.<br />
It is also a result of proper laws, regulations and institutions,<br />
as well as reinvigorated planning and adequate policies.<br />
Effective use of these instruments and processes has<br />
enabled many cities around the world to optimize their<br />
comparative advantages and to set themselves along the<br />
path of prosperity. They have used a range of avenues and<br />
capitalized on different sets of ‘spokes’ in their drive to<br />
shared and sustainable growth and wellbeing.<br />
Some cities are enhancing prosperity though strategic<br />
thinking and conscious<br />
planning policies. This<br />
is the case with Dubai in FACT the Persian Gulf, which<br />
took advantage of its<br />
privileged geographic<br />
location to become the<br />
largest re-exporting<br />
centre in the Middle East,<br />
and today is emerging<br />
as a cosmopolitan<br />
centre. Other cities<br />
are devising long-term<br />
visions with well-defined<br />
Geography<br />
alone cannot<br />
determine which city<br />
will grow and which will<br />
decline. Other factors<br />
such as government<br />
policies, corporate<br />
strategies, human<br />
capital, major political<br />
forces and decisions,<br />
investments in strategic<br />
sectors, all have an<br />
influence on the fate of<br />
cities.
91<br />
From Comparative Advantage to Urban <strong>Prosperity</strong><br />
implementation plans, like Melbourne’s or Rio de Janeiro’s<br />
strategies for improved quality of life.<br />
Some other cities are enhancing prosperity based on<br />
national economic policies and investments with financial<br />
support from central government. The Jordanian city of<br />
Aqaba on the coastline of the Red Sea was designated as<br />
Special Economic Zone (ASEZ) in 2001 and benefited<br />
from a public-private venture that created a duty-free and<br />
multi-sectoral development. The Zone contributed to<br />
enhanced infrastructure development, restoration of the<br />
city’s historic core and enhanced prosperity through the<br />
development of the tourism industry. 2 Shenzhen, too, has<br />
benefited from national economic and industrial policies<br />
and related strategic investments. These examples show that<br />
success depends on careful design of regional and economic<br />
strategies, effective coordination across government tiers,<br />
massive infrastructure building, outstanding industrial and<br />
entrepreneurial strategies, and pro-equity policies.<br />
Other cities still pursue prosperity through improved<br />
provision of goods and services at regional level. Nairobi,<br />
the capital of Kenya, is capitalizing on the newly-created<br />
East African Common Market and Customs Union to<br />
enhance its communications and information technology<br />
sector, while at the same time developing its transport<br />
infrastructure to improve<br />
efficiency and productivity.<br />
<strong>Prosperity</strong> can also be<br />
pursued through other<br />
important dimensions<br />
such as knowledge<br />
development. Doha is<br />
developing education<br />
and arts as part of the<br />
city’s new cultural vision.<br />
Concepción in Chile,<br />
like the Algerian cities of<br />
Blida, Tlemcen, Sidibel-Abbès<br />
and Setif, are<br />
growing and becoming<br />
more prosperous through<br />
education institutions and<br />
higher learning. 3<br />
Some cities showcase<br />
their tangible and<br />
intangible cultural heritage<br />
and identity, in a bid to<br />
bring about social and<br />
economic transformations. 4<br />
Gaziantep in Eastern<br />
Turkey is a case in<br />
point, with its efforts to<br />
develop cultural heritage<br />
tourism. Restoration<br />
POLICy<br />
and rehabilitation works<br />
enhance quality of life and<br />
at the same time creating<br />
alternative means of<br />
economic development. Valparaíso, Chile’s most important<br />
seaport and a well-known tourist resort, is repositioning its<br />
image as a cultural centre with facilities for entertainment,<br />
leisure and tourism.<br />
Many other cities are developing innovative ideas and<br />
strategies to shape new urban identity in the pursuit of<br />
prosperity. This typically includes revamped public spaces,<br />
rehabilitation of architecture and historic landmarks, recreation<br />
of the street as part of the soul of the city, shaping a<br />
‘sense of place’ with monuments, piazzas, marketplaces and<br />
streetscapes as open venues for arts and cultural expression.<br />
All of these achievements testify not just to the creative<br />
and innovative powers of municipal and other public<br />
authorities; they are also the outcomes of the interplay<br />
between the various power functions at work in any city.<br />
Beyond<br />
geography,<br />
well-managed urbanization<br />
stands out as the new<br />
comparative advantage in<br />
this early 21st century.<br />
La Paz, Bolivia: providing public goods for all, irrespective of neighbourhood or income bracket.<br />
© Eduardo Lopez Moreno
State of the World’s Cities <strong>2012</strong>/<strong>2013</strong><br />
This driving power behind urban change and transformation<br />
acts as the ‘hub’ at the centre of the ‘wheel of prosperity’.<br />
Urban power functions are where the public, collective<br />
interest is determined, together with the practical rules,<br />
plans and actions that are to embed it in a specific area. The<br />
hub is where decisions are made to activate any of the five<br />
dimensions of prosperity, keeping them well-balanced and<br />
maintaining the momentum in the wheel.<br />
Part 2 of this Report detailed the respective roles of<br />
the five dimensions of urban prosperity, with the various<br />
interlinkages and multipliers involved. Part 3 presents the<br />
policy related factors underlying the prosperity of cities,<br />
including drivers and constraints. It also focuses on urban<br />
power functions – the ‘hub’ holding together, activating<br />
and controlling the five ‘spokes’ of the ‘wheel of prosperity’<br />
across the length and breadth of any urban jurisdiction,<br />
regardless of geographic location, size or resources. Just<br />
like productivity, infrastructure or a well-preserved natural<br />
environment, these urban power functions are human<br />
constructs; it is for governments, local and municipal<br />
authorities, and society at large to make sure that these<br />
power functions work for the benefit of the majority of the<br />
population and keep enhancing shared urban prosperity.<br />
Policy-Related Factors<br />
Underlying the <strong>Prosperity</strong><br />
of Cities<br />
The policy-related factors underlying the prosperity of<br />
cities are multifaceted. They can be described in terms<br />
of drivers and constraints. The drivers could be the<br />
traditional and non-conventional factors that create an<br />
environment conducive to prosperity; they often affect the<br />
prosperity of cities in a positive manner. The constraints<br />
act as impediments that prevent a city from becoming<br />
more prosperous. These<br />
factors are further<br />
Effective urban mediated by the local<br />
FACT planning and<br />
context, and as such, their<br />
management is perceived<br />
effects may vary across<br />
to be the most important<br />
driver creating a favourable cities and regions – a<br />
environment for the<br />
particular factor might be<br />
prosperity of cities.<br />
important in one city or<br />
region, but not in another.<br />
92<br />
Actualizing dreams of prosperity: penthouse in El Alto, Bolivia.<br />
© Eduardo Lopez Moreno<br />
FACTORS CREATING AN ENvIRONMENT<br />
CONDUCIvE FOR <strong>THE</strong> PROSPERITy <strong>OF</strong> <strong>CITIES</strong><br />
According to the local experts surveyed by UN-Habitat,<br />
the factors that create a favourable environment for cities<br />
to prosper are effective urban planning and management;<br />
decentralization polices and appropriate institutions; a<br />
system that creates equal opportunities for all; participation<br />
of civil society; elected local officials; a favourable business<br />
environment; access to basic amenities; and public transport<br />
and mobility. Most of these factors are interrelated or<br />
complementary and jointly affect the prosperity of cities.<br />
The importance of these factors with respect to the various<br />
regions is presented in Figure 3.1.1.<br />
Effective urban planning and management<br />
The perceived importance of urban planning is most<br />
pronounced in the Arab States followed by Africa and Asia.<br />
However, in Latin America<br />
and the Caribbean, urban<br />
planning emerges as the<br />
third most important factor<br />
that creates an environment<br />
conducive for cities to<br />
prosper.s<br />
POLICy<br />
As a starting<br />
point,<br />
urban planners must<br />
view urbanization as a<br />
positive phenomenon.
Urban planning can contribute to the prosperity of cities<br />
in various ways.<br />
While there is growing recognition of the benefits,<br />
positive contribution and potential opportunities associated<br />
with cities, urban planners and policymakers in some<br />
developing countries are still ambivalent about the<br />
importance of urbanization and some cases, show aversion<br />
to the urbanization process. This should not be the case,<br />
because cities generate the bulk of GDP; they are the<br />
engines of growth and centres of innovation.<br />
There at least two ways to achieve this. The first is<br />
to nurture the growth of high-productivity activities –<br />
particularly manufacturing and services, which benefit from<br />
agglomeration economies. The second entails managing<br />
the negative externalities associated with the economic<br />
growth and success of cities – congestion, inequality, crime<br />
and violence, and soaring cost of land and housing, among<br />
others. 5 Neglecting cities even in countries with low levels<br />
of urbanization can impose significant costs. 6<br />
The positive nature of urbanization can be beneficial<br />
to the poor if the common deprivations that affect<br />
their daily existence are adequately addressed. Such<br />
deprivations include limited access to income and<br />
Figure 3.1.1<br />
Factors underlying urban prosperity<br />
per cent of respondents<br />
35<br />
30<br />
25<br />
20<br />
15<br />
10<br />
5<br />
0<br />
Ef�cient urban planning &<br />
management<br />
Policies that promote participation<br />
of civil society<br />
93<br />
From Comparative Advantage to Urban <strong>Prosperity</strong><br />
employment; inadequate<br />
living conditions; poor<br />
infrastructure and<br />
services; risks associated<br />
with living in slums;<br />
spatial issues which inhibit<br />
mobility and transport;<br />
and inequality associated<br />
with exclusion.<br />
Effective urban<br />
planning, together with<br />
Access to basic amenities including public transport<br />
Decentralization policies &<br />
appropriate institutions<br />
System that creates equal<br />
opportunities for all<br />
Elected local of�cials Sound business environment &<br />
entrepreneurial culture<br />
Africa Asia LAC Arab States All regions<br />
Source: UN-Habitat City Monitoring Policy Survey, 2011<br />
POLICy<br />
Managing urbanization is essential to nurturing the<br />
prosperity of cities. Cities that want to grow and<br />
be prosperous in all five dimensions must make urbanization<br />
work well.<br />
POLICy<br />
When urbanization is planned and well-managed, and<br />
distributive mechanisms of prosperity are put in place,<br />
it can contribute to poverty reduction.<br />
POLICy<br />
Another way<br />
urban planning<br />
can bring about more<br />
liveable cities consists in<br />
tackling slums and informal<br />
settlements, as no city can<br />
claim to be prosperous<br />
when large segments of<br />
the population live in slum<br />
conditions.
State of the World’s Cities <strong>2012</strong>/<strong>2013</strong><br />
POLICy<br />
Urban planning and appropriately developed<br />
institutions and regulations can play major roles,<br />
improving urban equity through the capture and redistribution of<br />
rising land values.<br />
political commitment, has contributed to a reduction<br />
of slums in a number of countries including Argentina,<br />
China, Colombia, Egypt, India, Indonesia, Morocco,<br />
South Africa and Tunisia.<br />
One positive outcome of urban growth is that it<br />
increases urban land values. Components of urban<br />
planning systems – such as re-zoning, granting of planning<br />
permission, and the provision of infrastructure and<br />
services – also contribute to higher urban land values.<br />
Experience in North and Latin America shows that value<br />
capture can be an effective way to link urban planning and<br />
land use regulations, as well as to control land use, finance<br />
urban infrastructure, and generate local revenue to fund<br />
urban management.<br />
Uncontrolled sprawl presents a major challenge for<br />
urban planning and<br />
has implications for<br />
the prosperity of cities.<br />
Urban sprawl contributes<br />
to the high numbers of<br />
cars, distances travelled,<br />
length of paved roads, fuel<br />
consumption, alteration of<br />
ecological structures and<br />
the conversion of rural land<br />
into urban uses – all of<br />
which are environmentally<br />
POLICy<br />
Urban planning<br />
can encourage<br />
more compact, efficient<br />
and sustainable urban<br />
development.<br />
FACT Decentralization<br />
policies emerge<br />
as the second important<br />
factor enhancing urban<br />
prosperity.<br />
94<br />
unsustainable. Compact urban development has several<br />
advantages. It is more efficient, inclusive and sustainable. The<br />
cost of providing infrastructure is lower, access to services<br />
and facilities is improved since thresholds are higher, the<br />
urban poor find that livelihoods are less of a challenge, and<br />
social segregation is reduced. Urban planning has played a<br />
significant role in Singapore’s compact pattern and modern,<br />
convenient public transportation. Singapore is transitoriented,<br />
with high-density residential and commercial<br />
developments integrated into transport nodes. This improves<br />
accessibility to public transport.<br />
Decentralization and appropriate institutions<br />
In Latin America and the Caribbean, decentralization<br />
is perceived to be the most important factor enhancing<br />
urban prosperity. This is an indication of the effectiveness,<br />
or more developed nature, of decentralization policies in<br />
Latin America and the Caribbean compared with other<br />
regions. The perceived effect of decentralization in Arab<br />
States appears to lag behind other regions. The highly<br />
centralized governance structure in the region undermines<br />
the efficiency of municipal authorities, obstructs political<br />
Kathmandu, Nepal: the relentless urban sprawl of the Kathmandu Valley. The Vishnumati River is<br />
surrounded by suburbs which have sprung up in recent years. With few building regulations, the<br />
city keeps on growing, as many look for a better life in the city than in the countryside. The result is<br />
environmental chaos with severe noise, air and water pollution problems.<br />
© <strong>2012</strong> Jonathan Mitchell/fotoLIBRA.com
participation and erodes the relationships between the<br />
citizenry and the level of government closest to them. 7<br />
Box 3.1 highlights how decentralization can play a key<br />
role in the prosperity of cities.<br />
While the responsibilities of municipal governments<br />
have increased following reforms in recent years, many have<br />
no access to the financial resources needed to undertake<br />
these functions. This naturally creates a mismatch between<br />
responsibilities and financial resources, and is a major<br />
reason why decentralization has been less than successful in<br />
certain countries.<br />
National reforms relating to various aspects of<br />
decentralization – revenue allocation, community<br />
participation, local elections, local planning, pro-urban<br />
development strategies – all provide the enabling<br />
environment for cities to prosper.<br />
Box 3.1.1<br />
Decentralization and the prosperity of cities<br />
A major benefit of decentralization as it relates to the prosperity<br />
of cities is that delivery of essential services such as water,<br />
sanitation and waste management, health and education can<br />
be carried out more effectively. Decentralization can make<br />
for better service delivery by providing greater opportunities<br />
for community-based groups to lobby for improved services.<br />
Proximity to physical demand for a service encourages<br />
effectiveness and promotes a more rational use of resources,<br />
while also allowing for closer monitoring by the beneficiary<br />
population of projects intended to serve them.<br />
The devolution of authority can foster community<br />
participation, too. Decentralization can lead to an institutional<br />
framework through which various political, religious, social,<br />
ethnic groups and multi-levels including towns and cities, can<br />
participate in making decisions that will affect them.<br />
Decentralized decision-making can provide a better<br />
framework for poverty reduction, so long as it is accompanied<br />
by fiscal devolution of powers to municipal authorities.<br />
Decentralization can accelerate economic development through<br />
active engagement of regional and municipal government<br />
units and local enterprises in economic activities. The transfer<br />
of authority and resources to local units of government and<br />
administration to design and implement programmes provides<br />
more opportunities for local citizens to play a more direct role<br />
in the development process. As catalysts for development and<br />
local change agents, they can make decisions about location of<br />
services and determine priorities.<br />
Source: UN-Habitat (<strong>2012</strong>) Decentralization in Iraq: Challenges and<br />
Solutions for Federal and Local Governments, Nairobi: UN-Habitat<br />
95<br />
POLICy<br />
System that creates<br />
equal opportunities<br />
The importance of this<br />
factor is most pronounced<br />
in Arabs States compared<br />
with other regions. This<br />
is because Arab States<br />
are one of the most<br />
egalitarian in terms of<br />
income distribution in the<br />
developing world. This is<br />
reflected in an overall (low)<br />
Gini coefficient of 0.36,<br />
which has been declining<br />
over time. 9 The low degree<br />
of inequality in the region<br />
has been attributed to a<br />
From Comparative Advantage to Urban <strong>Prosperity</strong><br />
For decentralization to strengthen urban authorities’<br />
commitment to urban prosperity, it must be backed by<br />
fiscal devolution.<br />
strong, cohesive social system, and the fact that redistribution<br />
constitutes a policy priority in Islamic economies. 10<br />
A system that creates equal opportunities for all can<br />
use redistributive policies that give priority to low-income<br />
groups and areas. In Venezuela, the government has used<br />
redistributive policies to bring significant improvements<br />
to the living standards of the urban poor through<br />
massive investment in health and education. 11 With the<br />
provision of over 8,000 clinics in the barrios, people are<br />
able to access health services 24 hours a day at no cost.<br />
Similarly, illiteracy has been eliminated, pupils are no<br />
longer restricted to elementary school, and those with the<br />
required academic qualifications can attend university.<br />
Another form of redistribution policy involves<br />
conditional cash transfers. These enhance the human<br />
capital of beneficiaries through transfers which are made<br />
POLICy<br />
POLICy Decentralization<br />
works well<br />
when backed by strong<br />
commitment and support<br />
from central government. 8<br />
FACT<br />
A system that<br />
guarantees equal<br />
opportunities for all is<br />
the third important factor<br />
underlying the prosperity of<br />
cities. The more egalitarian<br />
a city, the more prosperous<br />
it becomes.<br />
For a city to be truly prosperous, it must deploy<br />
systems that will ensure equal opportunities for all,<br />
especially the more vulnerable – the poor, women, children, the<br />
elderly, youth and the disabled. A prosperous city is one where the<br />
aspirations of all segments of the population are realized. Highly<br />
unequal cities are a ticking time bomb waiting to explode.
State of the World’s Cities <strong>2012</strong>/<strong>2013</strong><br />
conditional on certain requirements such as school<br />
attendance, visits to clinics and periodic immunization. 12<br />
Brazil’s Bolsa Família scheme, which benefits 11.1 million<br />
families, is the largest of its kind in the world, and has<br />
contributed to reducing poverty and inequality. 13 Indeed,<br />
80 per cent of Bolsa Família benefits go to families living<br />
below the poverty line; the programme also accounted for<br />
21 per cent of the decline in<br />
inequality in Brazil between<br />
1995 and 200414 Policies that<br />
– all of<br />
FACT promote the<br />
which contribute to making<br />
participation of civil society cities more prosperous.<br />
are perceived as the fourth<br />
most important factor<br />
behind enhanced urban<br />
prosperity.<br />
POLICy<br />
Participation of<br />
civil society has<br />
the potential to empower<br />
communities, build social<br />
capital, lead to better design<br />
of urban projects, and<br />
allow for citizens’ concerns<br />
to be incorporated into<br />
development strategies.<br />
POLICy<br />
Lessons from<br />
experience<br />
suggest that successful<br />
civil society participation<br />
is dependent upon<br />
certain preconditions<br />
such as: (i) a political<br />
system that encourages<br />
active citizenship and is<br />
committed to equity and<br />
remedial action; (ii) the<br />
legal basis for participation;<br />
(iii) available resources<br />
in terms of skilled and<br />
committed professionals,<br />
as well as well-resourced<br />
and empowered local<br />
governments; and (iv)<br />
informed and organized<br />
communities and<br />
stakeholders. 16<br />
Civil society participation<br />
The perceived importance<br />
of participation of civil<br />
society varies across<br />
regions. It is seen by local<br />
experts as the second<br />
most important factor in<br />
Latin America and the<br />
Caribbean, while in Arab<br />
96<br />
States, it is the fifth important factor. This is not surprising,<br />
given that participation of civil society has very strong roots<br />
in Latin American cities, with the best-known participatory<br />
approaches being participatory budgeting and participatory<br />
planning. A classic example of participatory planning<br />
process in Asia is the People’s Campaign for Decentralized<br />
Planning in Kerala (India), which strengthens democratic<br />
decentralization by identifying local needs and establishing<br />
local development options and priorities through local<br />
consultation and participation. 15<br />
Elected local officials<br />
Research shows that durable democracy is correlated with<br />
economic development. 17 Across the world, the more<br />
prosperous cities (at least economically) tend to be located<br />
in countries that are stable democracies. Democratically<br />
elected local officials owe their mandate to the people, and<br />
as such, are best placed to respond to the people’s needs,<br />
which include providing good conditions for employment,<br />
Kerala, India: food security is critical for productivity. Ready<br />
access to a variety of wholesome food enhances quality of life.<br />
© <strong>2012</strong> Peter Herbert/fotoLIBRA.com
providing adequate infrastructure and urban services,<br />
improving the quality of life, making society more equitable,<br />
and ensuring environment sustainability.<br />
Of course, there are instances where non-democratic<br />
leadership is associated with a degree of economic<br />
prosperity, but this is the exception rather than the rule.<br />
Indeed, non-democratic regimes are coterminous with<br />
pathologies such as predation and expropriation, and in<br />
the long-run undermine the institutions underlying that<br />
prosperity. 18 It has been noted that autocratic governments<br />
often distribute benefits to an elite group, while democratic<br />
governments distribute benefits more widely to gain the<br />
support of the general public. 19<br />
Favourable business environment<br />
A business-conducive environment is needed for a vibrant<br />
private sector, attracting and retaining investment (including<br />
foreign direct), creating jobs and improving productivity –<br />
all of which are important for the promotion of growth and<br />
for expanded opportunities for the poor. 20<br />
Cities such as Singapore, Hong Kong, Seoul, Busan,<br />
Kuala Lumpur, Tokyo, Yokohama and Osaka all feature<br />
favourable business environments, with beneficial effects on<br />
prosperity. In Africa, it is easier to do business in St Louis<br />
(Mauritius), Johannesburg, Kigali, Tunis and Gaborone<br />
than in Kinshasa, Conakry, Asmara, N’Djamena or Bangui,<br />
which are located in countries that rank low in business<br />
environment. Generally, cities in the former group of<br />
countries tend to be more prosperous than those in the latter.<br />
Rwanda has consciously deployed a business-friendly<br />
environment, in the process bringing a higher degree of<br />
prosperity to its capital, Kigali. In recent years, Rwanda<br />
has undertaken reforms to streamline business procedures,<br />
create a favourable legal framework, reduce bureaucracy,<br />
and improve service delivery in order to promote both<br />
domestic and foreign investment. For instance, in Kigali,<br />
registering a business takes only three days and costs less<br />
than five per cent of the average income in an environment<br />
devoid of corruption, making the city “a very easy place for<br />
a global firm to operate”. 21<br />
Access to basic amenities<br />
An efficient mass transit system is essential for the seamless<br />
movement of people and goods within and between cities,<br />
which in turn is vital for the prosperity of cities. In Lagos,<br />
the bus rapid transport (BRT) system has attracted new<br />
patronage, lowered average fares, creating 1,000 jobs as<br />
well as indirect employment for over 500,000 people. 22<br />
97<br />
FACT<br />
POLICy<br />
From Comparative Advantage to Urban <strong>Prosperity</strong><br />
A system that ensures that local officials are elected<br />
is ranked by local experts as the fifth most important<br />
policy-related factor that enhances urban prosperity. The election<br />
of local or city officials presupposes the existence of stable<br />
democracy through which citizens are empowered to elect and<br />
remove their leaders through an open, free and fair ballot.<br />
Political institutions like democracy are essential<br />
if the conditions for prosperity are to be laid out<br />
and nurtured.<br />
FACT<br />
Across the four developing regions surveyed by UN-<br />
Habitat, a favourable business environment is perceived<br />
to be most important in Asia – possibly pinpointing the role played<br />
by cities in the region, creating an enabling environment for<br />
businesses and attracting foreign direct investment.<br />
FACT<br />
In South Africa, the<br />
Gautrain is expected<br />
to reduce road traffic<br />
between Johannesburg<br />
and Pretoria by 25,000-<br />
30,000 cars per day; this is<br />
one of the busiest roads in<br />
South Africa where traffic<br />
increases an average seven<br />
per cent every year. 23 In<br />
Bogotá, the BRT provides<br />
fast and reliable transport<br />
for over 1.4 million<br />
passengers per day, in the<br />
process reducing traffic<br />
congestion and enhancing<br />
environmental quality. 24<br />
Access to basic<br />
amenities and<br />
infrastructure, including<br />
improved public transport<br />
and ICT, is a factor that<br />
will enhance the prosperity<br />
of any city. This factor<br />
is considered as most<br />
important in African and<br />
Asian cities.<br />
Cities with a<br />
POLICy favourable<br />
business environment and<br />
entrepreneurial culture<br />
are more likely to be<br />
prosperous.<br />
In addition to the<br />
foregoing, access to basic<br />
amenities can deliver major<br />
prosperity-enhancing benefits such as: supporting economic<br />
growth; contributing to achievement of Millennium<br />
Development Goals through improved health and education;<br />
improving quality of life especially for youth and women;<br />
enhancing environmental quality through improved access<br />
to water and sanitation, which in turn reduces morbidity and<br />
mortality, and fosters greater productivity.
State of the World’s Cities <strong>2012</strong>/<strong>2013</strong><br />
SOME IMPEDIMENTS TO <strong>THE</strong> URBAN PROSPERITy<br />
Based on the UN-Habitat local expert survey, there are<br />
seven main impediments to urban prosperity, as follows:<br />
poor governance and weak institutions; corruption; lack<br />
of appropriate infrastructure; high incidence of slums and<br />
poverty; high costs of doing business; low levels of human<br />
capital; and high crime rates (Figure 3.1.2). The hard-won<br />
prosperity gains made by cities in terms of productivity,<br />
infrastructures, quality of life, equity, social inclusion and<br />
environmental sustainability can be jeopardized or eroded,<br />
either individually or collectively, by these impediments.<br />
Poor governance and weak institutions<br />
What this implies is that countries in Africa and Arab<br />
States must do more to improve urban governance and<br />
institutions. Indeed, in many developing countries, the<br />
institutions required for urban prosperity, if they exist, are<br />
weakly developed. Proper<br />
institutions are crucial<br />
Poor governance formal (Constitution,<br />
FACT and weak<br />
laws and regulations) and<br />
institutions act as major informal (social norms,<br />
impediments to higher<br />
customs and traditions)<br />
urban prosperity.<br />
rules that determine how<br />
people, organizations<br />
and firms make decisions<br />
POLICy<br />
The impact of<br />
poor governance<br />
and weak institutions on<br />
urban prosperity appears<br />
to be more pronounced in<br />
cities in Africa and Arabs<br />
States, where over 40 per<br />
cent of experts cite this<br />
factor as the single most<br />
important impediment.<br />
FACT<br />
Corruption is<br />
considered by local<br />
experts as the second most<br />
important hindrance to<br />
enhanced urban prosperity.<br />
FACT<br />
Corruption can<br />
be detrimental<br />
to urban prosperity in a<br />
variety of ways.<br />
of an economic, social<br />
political nature, maximize<br />
potentials and optimize<br />
resources. 25<br />
Sound institutions<br />
matter for the prosperity<br />
of cities, as they provide<br />
the superstructure that<br />
enables, or otherwise,<br />
underlying factors to<br />
operate and deliver a<br />
maximum of benefits<br />
to the largest possible<br />
majority of the population.<br />
Institutional inadequacies<br />
take the form of weak (if<br />
not altogether lacking)<br />
legal and institutional<br />
frameworks26 , disregard<br />
for the rule of law,<br />
poor enforcement of<br />
property rights, excessive<br />
98<br />
bureaucracy, and proliferation of corrupt practices among<br />
others. All these are incompatible with urban prosperity.<br />
Corruption<br />
Local experts surveyed by UN-Habitat unanimously concur<br />
that corruption is a major threat to the prosperity of cities.<br />
This is in line with the view that corruption is the single<br />
largest obstacle to development. 27 Corruption can be found<br />
operating on a grand scale, often penetrating the highest<br />
policy-making organs of government, including urban<br />
authorities, or take a petty sort of nature, involving everyday<br />
public and social interactions.<br />
Corruption acts a deterrent to direct (and even<br />
indirect) foreign investment, as it will influence foreign<br />
firms’ decisions to locate in a particular country or city.<br />
Corruption acts like a tax, only imposed for private instead<br />
of public benefit. 28 One of the reasons that foreign firms are<br />
attracted to cities such as Bridgetown (Barbados), Santiago<br />
(Chile), Gaborone (Botswana), Doha (Qatar), San Juan<br />
(Puerto Rico), St Louis (Mauritius), Kigali (Rwanda) or<br />
Victoria (Seychelles) is because they all located in countries<br />
with low levels of corruption.<br />
Corruption undermines the ability of city authorities to<br />
provide fair municipal services, as it distorts planning and<br />
allocation processes.<br />
Corruption is particularly evident in large-scale<br />
urban infrastructure projects, and distorts infrastructure<br />
spending in various ways. 29 It can increase public<br />
expenditure on new infrastructure, since such capital<br />
projects can be easily manipulated by politicians and highlevel<br />
officials to obtain bribes.<br />
Corruption can reduce the resources normally available<br />
to urban authorities for improved provision of basic services<br />
such as water, sanitation, education, health and recreation,<br />
which are all essential for urban prosperity and the<br />
achievement of the Millennium Development Goals, many<br />
of which are urban-related.<br />
Corruption can also result in shoddy delivery of urban<br />
services. When contractors offer bribes to secure contracts,<br />
they are likely to cut back and compromise on quality in<br />
order to recoup part or whole of the bribe offered.<br />
Inadequate infrastructure<br />
Cities with deficient infrastructure will be adversely affected<br />
on many fronts; they are less likely to be prosperous,<br />
sustainable or productive. For instance, inadequate water<br />
and sanitation facilities will lead to deterioration of the<br />
urban environment, increasing the disease burden of the
urban poor, particularly in slums and squatter settlements.<br />
Deficient infrastructure can drive up the costs of doing<br />
business in urban areas and reduce firm productivity by<br />
as much as 40 per cent30 , and its impact can be as large<br />
as those of crime, bureaucracy, corruption or financial<br />
market constraints. 31 Deficient infrastructure is also a<br />
major impediment to trade and competitiveness in many<br />
developing countries, particularly landlocked and small<br />
island states. In the case of Africa, the proportion of paved<br />
roads in is about five times less than in high income OECD<br />
countries; the end-result of this infrastructure bottleneck<br />
is that transport costs are 63% higher in African countries<br />
compared with developed countries. 32 This has major<br />
implications for competitiveness of African cities on local<br />
and international markets.<br />
High incidence of slums and poverty<br />
Slums feature the most deplorable living and environmental<br />
conditions and are characterized by inadequate water<br />
supply, poor sanitation, overcrowded and dilapidated<br />
housing, hazardous locations, insecurity of tenure and<br />
vulnerability to serious health risks – all of which have<br />
major implications for quality of life. Slums are also known<br />
for their atmosphere of fear and the social and economic<br />
exclusion of their residents. 33 Slum dwellers are often<br />
Figure 3.1.2<br />
Perceived impediments to the prosperity of cities<br />
per cent of respondents<br />
45<br />
40<br />
35<br />
30<br />
25<br />
20<br />
15<br />
10<br />
5<br />
0<br />
99<br />
From Comparative Advantage to Urban <strong>Prosperity</strong><br />
stigmatized on account of<br />
Cities with large<br />
their location and are often<br />
proportions of their<br />
discriminated against in<br />
populations living in slum<br />
conditions are less likely to<br />
terms of access to public<br />
be prosperous.<br />
and social services, as well<br />
as employment.<br />
Slum prevalence<br />
is highest in Sub-Saharan Africa (62 per cent), where<br />
basic services are lacking not only in informal, but<br />
formal settlements, too. North Africa features the lowest<br />
prevalence (13 per cent). In Asia, the average proportion<br />
of urban populations living in slums ranges from 25 per<br />
cent in Western Asia to 35 per cent in South Asia. In Latin<br />
America and the Caribbean, average slum prevalence is<br />
24 per cent. To a large extent, regional patterns of slum<br />
prevalence reflect degrees of access to basic services such<br />
as water and sanitation, as well as the nature of urban<br />
development policies.<br />
Poor governance & weak institutions Corruption Inadequate infrastructure<br />
High incidence of slums and poverty<br />
High levels of crime<br />
High cost of doing business Low levels of human capital<br />
Africa Asia LAC Arab States All regions<br />
Source: UN-Habitat City Monitoring Policy Survey, 2011<br />
FACT<br />
Inadequate infrastructure is a major impediment to the<br />
prosperity of cities. The impacts of deficient infrastructure<br />
appear to be more pronounced in Asian and African cities and less<br />
so in Arab States.<br />
FACT
State of the World’s Cities <strong>2012</strong>/<strong>2013</strong><br />
FACT<br />
Large concentrations of slums impose enormous burdens<br />
on urban authorities that often lack the resources to<br />
provide even the most basic services, with obvious consequences<br />
on prosperity. Rather than opting for proactive perspective on<br />
urban development, cities with large concentrations of slums are<br />
likely to adopt antagonistic or fragmentary approaches, which<br />
among other shortcomings tends to be expensive in the long term.<br />
Mumbai, India: where there is inadequate access to, or provision of, resources, people will improvise dwellings using whatever comes to hand.<br />
© <strong>2012</strong> Nicola Barranger/fotoLIBRA.com<br />
High cost of doing business<br />
In Africa, countries like Mauritania, Cameroon, Burundi,<br />
Benin, Eritrea, and Guinea Bissau are ranked low in terms<br />
of the ease of doing business. 34 This means that their capital<br />
cities – Nouakchott, Yaoundé, Bujumbura, Porto Novo,<br />
Asmara and Bissau, will be characterized by a high cost<br />
100<br />
of doing business and thus, likely to be less prosperous<br />
compared to other African cities located in countries where<br />
the cost of doing business in low.<br />
In Latin America and the Caribbean, Brazil,<br />
Honduras, Bolivia, Haiti and Suriname are ranked<br />
relatively low on the ease of doing business. In Brazilian
cities, the business environment is bogged down by the<br />
labyrinth of bureaucracy. For instance, it takes an average<br />
of 119 days and 13 procedures to register a business. 35<br />
Anyone wishing to start a business will require approval<br />
from no less than 12 different government agencies. 36<br />
As one store owner lamented: “You need a document.<br />
But to have that document, you need to hand in seven<br />
documents. And to get each of these seven, there’s a<br />
different demand.” 37<br />
Poorly developed human capital<br />
Education is essential not just for nurturing, but also<br />
for attracting talents, and bolstering innovation. The<br />
development of Boston, Silicon Valley, Oxford and<br />
Cambridge (UK) clearly benefited from the presence of<br />
reputed universities. 39 Availability of highly-skilled human<br />
capital in turn attracts and generates innovative and<br />
knowledge-based industries.<br />
Within the OECD, the productivity of some<br />
metropolitan areas has been attributed to human resource<br />
endowments. For instance in Montreal, the relatively low<br />
productivity of high value-added sectors has been linked to<br />
lower educational attainment and inadequate investment,<br />
particularly in small and medium-sized enterprises. 40<br />
Similarly, in Istanbul and Mexico City, productivity and<br />
hence, prosperity, is hampered by low skills, as well as the<br />
extent of the informal sector, where adult education and<br />
skill upgrading are difficult to provide. 41<br />
Attracting and<br />
cultivating talents has<br />
FACT<br />
The myriad<br />
of laws, taxes<br />
and regulations and<br />
bureaucracy involved in<br />
registering or running<br />
a business has been<br />
cited as one of the<br />
main reasons why<br />
40 per cent of Brazilian<br />
startup businesses<br />
hardly survive for more<br />
than two years. The<br />
cost of bureaucracy<br />
is staggering; in 2010<br />
bureaucracy cost the<br />
Brazilian economy<br />
46.3 billion reals. 38 This<br />
has implications for the<br />
prosperity of cities in<br />
Brazil.<br />
become common practice<br />
for cities in the pursuit<br />
of prosperity. From New<br />
York, to Boston, London<br />
to Vienna, Dubai to<br />
Singapore, or Bangalore to<br />
Shenzhen, many cities can<br />
illustrate this phenomenon.<br />
Munich’s experience with<br />
vocational education can<br />
be particularly inspiring.<br />
The capital of Bavaria<br />
as well as the economic,<br />
cultural, technological and<br />
transportation centre of<br />
South Germany, Munich<br />
is one of Europe’s most<br />
prosperous cities. It ranked<br />
101<br />
FACT<br />
From Comparative Advantage to Urban <strong>Prosperity</strong><br />
Just as a favourable business environment enhances the<br />
prosperity of urban areas, the high cost of doing business<br />
can serve as an impediment to cities becoming more prosperous.<br />
A high cost of doing business has obvious implications for<br />
investment, productivity, employment, income, taxation and<br />
poverty reduction – all of which impact on the prosperity of cities.<br />
8th for technological<br />
innovation (as measured<br />
by international patent<br />
applications), among<br />
the 500 sample cities in<br />
the 2010 Global Urban<br />
Competitiveness Ranking;<br />
its GDP per capita was<br />
USD 58,197 in 2007 with<br />
three per cent economic<br />
growth on an annual<br />
average basis in 2001-2007. 42 Low levels of<br />
POLICy human capital<br />
or labour can hinder urban<br />
prosperity. When it fails to<br />
develop and nurture human<br />
resources, a city will be less<br />
likely to be prosperous than<br />
those with highly educated<br />
labour forces.<br />
Munich’s manufactured<br />
products enjoy a good international reputation and export<br />
competitiveness. The city’s large proportion of high-skilled<br />
workers, nurtured through its vocational education system,<br />
has been crucial to the city’s prosperity.<br />
High crime rates<br />
Crime is a major deterrent to domestic and foreign<br />
investment and can cause capital flight. In Africa, more<br />
than 29 per cent of business people report that crime was<br />
a significant investment constraint. 43 Investors generally<br />
worry about violent crime for fear of direct losses to<br />
business and lack of security for staff.<br />
High crime rates can have a crippling effect on the<br />
prosperity of cities. In Lusaka, for instance, fear of crime in<br />
the poverty-stricken community of Chawama can prevent<br />
teachers from showing up<br />
at work. 45 In South Africa,<br />
a survey of major cities<br />
showed that over a quarter<br />
of respondents would not<br />
consider opening a business<br />
due to fear of crime, with<br />
more than 25 per cent<br />
saying they were reluctant<br />
to allow their children to<br />
walk to school, while 30 per<br />
cent stopped using public<br />
transportation. 46 In large<br />
FACT<br />
According to the<br />
local experts<br />
surveyed by UN-Habitat,<br />
crime emerges as another<br />
major impediment to the<br />
prosperity of cities. No<br />
city can claim to be truly<br />
prosperous if it is crimeridden<br />
and the population<br />
lives in a perpetual state of<br />
insecurity.
State of the World’s Cities <strong>2012</strong>/<strong>2013</strong><br />
FACT<br />
In Latin America, the financial burden of violent crime<br />
is equivalent to 25 per cent of GDP in Colombia and<br />
El Salvador; 12 per cent in Mexico and Venezuela; 11 per cent<br />
in Brazil; and five per cent in Peru. 44 In Jamaica, crime has a<br />
pernicious effect on national tourism and is often cited as a major<br />
reason for the country’s weak economy.<br />
Endnotes<br />
1 UN-Habitat (2008) State of the World’s Cities Report 2008/09: Harmonious Cities,<br />
Earthscan, London.<br />
2 Shabou, A., N. Soboh, K. Jalouka, and D. A. Thaib (2011) City Report on Aqaba,<br />
Unpublished UN-Habitat background study for “State of the World’s Cities Report<br />
<strong>2012</strong>/<strong>2013</strong>”<br />
3 UN-Habitat (2008) op.cit.<br />
4 Costas, S. (2011) Urban Tourism and Urban Change: Cities in a Global Economy, New<br />
York, Routledge<br />
5 Spence, M (2008) “Preface”, in Urbanization and Growth, Spence M. , P.C. Annez.,<br />
and R. Buckley (eds.), Commission on Growth and Development, World Bank,<br />
Washington DC.<br />
6 Annez, P.C. and R. Buckley (2008) “Urbanization and growth: Setting the context”, in<br />
Urbanization and Growth, Spence M. , P.C. Annez., and R. Buckley (eds.), Commission<br />
on Growth and Development, World Bank, Washington DC.<br />
7 UN-Habitat (<strong>2012</strong>) The State of Arab Cities <strong>2012</strong>: Challenges of Urban Transition,<br />
UN-Habitat, Nairobi.<br />
8 UN-Habitat (2006) State of the World’s Cities 2006/07, Earthscan, London.<br />
9 UN-Habitat (2004) State of the World’s Cities 2004/05, Earthscan, London.<br />
10 Ibid.<br />
11 Scipes, K. (2006) ‘Venezuela and South Africa: Redistributive policies vs. neo-liberal<br />
economic policies’, Third World Traveler, http://www.thirdworldtraveler.com/<br />
Venezuela_page/Venez_SAfrica_EconPolicies.html<br />
12 Hailu, D. and F. V. Soares(2008) ‘Cash transfers in Africa and Latin America: An<br />
overview”, Poverty in Focus, Number 15, International Policy Centre for Inclusive<br />
Growth, Brasilia, pp: 3-5.<br />
13 Britto, T (2008) ‘Brazil’s Bolsa Família: Understanding its origins and challenges’,<br />
Poverty in Focus, Number 15, International Policy Centre for Inclusive Growth,<br />
Brasilia, pp: 6-7.<br />
14 Soares, F. V., S. Soares, M .Medeiros, , and R. G. Osório, (2006) ‘Cash transfer<br />
programmes in Brazil: Impacts on inequality and poverty‘ , International Policy Centre<br />
for Inclusive Growth working Paper, Number 21, International Poverty Centre Brasilia<br />
15 UN-Habitat (2009) Planning Sustainable Cities: Global Report on Human Settlements<br />
2009. Earthscan, London<br />
16 UN-Habitat(2009) op. cit.<br />
17 Sharma, S. (2005) ‘Democracy, good governance, and economic development’,<br />
Taiwan Journal of Democracy, vol 3 (1), pp: 29-62.<br />
18 Sharma, S. (2005) op. cit.<br />
19 Holcombe, R. G. (<strong>2012</strong>) ‘Democracy and <strong>Prosperity</strong>,’ in Young, B. C. (ed.) Institutional<br />
Economics and National Competitiveness, Routledge, London<br />
20 World Bank and International Finance Corporation (2011) Doing Business <strong>2012</strong>:<br />
Doing Business in a More Transparent World, World Bank.Washington DC<br />
21 The Economist (<strong>2012</strong>) ‘Business in Rwanda: Africa’s Singapore?’, The Economist,<br />
February 25, http://www.economist.com/node/21548263<br />
22 World Bank (2009) Getting people and traffic moving again in Lagos, http://web.<br />
worldbank.org/WBSITE/EXTERNAL/EXTABOUTUS/IDA/0,,contentMDK:22229765~men<br />
uPK:4754051~pagePK:51236175~piPK:437394~theSitePK:73154,00.html<br />
23 BBC (2011) ‘South Africa Gautrain opens Johannesburg-Pretoria route’, BBC News,<br />
August 2, http://www.bbc.co.uk/news/world-africa-14371113<br />
102<br />
Latin America cities, high numbers of murders deter people<br />
from working evenings and at night. 47<br />
All these factors have implications for local economies,<br />
quality of life and the attractiveness of public spaces, on top<br />
of lost opportunities for socioeconomic advancement that<br />
are so crucial for the prosperity of cities.<br />
24 Hidalgo, D.(2008) ‘Why is TransMilenio still so special?’, The City Fix, August 5, http://<br />
thecityfix.com/blog/why-is-transmilenio-still-so-special/<br />
25 Sharma, S. (2005) op. cit.<br />
26 Oyeyinka, B. O. (<strong>2012</strong>) ‘Institutional capacity and policy for latecomer technology<br />
development’, International Journal of Technological Learning, Innovation and<br />
Development, Vol. 5, (1/2), pp. 85-110.<br />
27 UN-Habitat (2007) Enhancing Urban Safety and Security: Global Report on Human<br />
Settlements 2007,Earthscan, London<br />
28 Dong, B and Torgler, (2010) The Consequences of Corruption: Evidence from China,<br />
Center for in Economics, Management and the Arts Working Paper No. 2010-06,<br />
http://www.crema-research.ch/papers/2010-06.pdf<br />
29 Arimah, B. C. (2005) ‘What drives infrastructure spending in cities of developing<br />
countries?’, Urban Studies, Vol 42 (8), pp. 1345-1368<br />
30 Escribano, A. ,J.L. Guasch, and J. Pena (2008) ‘Impact of Infrastructure Constraints<br />
on Firm Productivity in Africa, Africa Infrastructure Diagnostic Study Working Paper 9,<br />
World Bank, Washington, DC.<br />
31 Foster, V., and C. Briceno-Garmendia (2010) Africa’s Infrastructure: A Time for<br />
Transformation, World Bank, Washington, DC.<br />
32 African Economic Outlook (<strong>2012</strong>) Progress in Infrastructure Developments,<br />
http://www.africaneconomicoutlook.org/en/outlook/trade_policies/progress-ininfrastructure-developments/<br />
33 Bloom, D. E., D. Canning, and G. Fink (2008) ‘Urbanization and the wealth of nations’,<br />
Science, Vol. 319, pp. 772 - 775.<br />
34 World Bank and International Finance Corporation (2011) op. cit.<br />
35 Ibid.<br />
36 Gomes, L . (<strong>2012</strong>) ‘Brazil’s labyrinth of bureaucracy’, BBC News, May 16, http://www.<br />
bbc.co.uk/news/business-18020623<br />
37 Ibid.<br />
38 Gomes (<strong>2012</strong>) op.cit.<br />
39 Pengfei, Ni (2011) Driving factors of <strong>Prosperity</strong>: An Empirical Analysis Global Cities,<br />
background paper for ‘State of the World Cities Report <strong>2012</strong>/13’<br />
40 OECD (2006) Competitive Cities in the Global Economy, OECD, Paris<br />
41 Ibid.<br />
42 Pengfei, Ni (2011) op. cit.<br />
43 UNODC (2005) Crime and Development in Africa, http://www.unodc.org/pdf/<br />
African_report.pdf<br />
44 Moser, C. , A.Winton, and A.Moser (2005) ‘Violence, Fear among the Urban Poor<br />
in Latin America’ In The Urban Poor in Latin America, Fay, M (ed.) World Bank,<br />
Washington, DC.<br />
45 Moser, C. O. N. and J. Holland (1997) ‘Confronting crisis in Chawama, Lusaka<br />
Zambia’, Household Responses to Poverty and Vulnerability, Vol 4, Urban Programme<br />
Management Policy Paper 24, World Bank, Washington, DC.<br />
46 UNODC (2005) op.cit.<br />
47 Hamermesh, D. S. (1998) Crime and the Timing of Work, National Bureau of<br />
Economic Research Working Paper 6613,NBER, Boston
Chapter 3.2<br />
Innovating to Support<br />
the Transition to the<br />
City of the 21st Century<br />
Cities have played a major role in creativity and innovation<br />
throughout history. Creative people and systems,<br />
innovative milieus, knowledge creation mechanisms,<br />
and new technological developments have all primarily<br />
happened in cities and all contributed to societal<br />
development and prosperity.<br />
Creativity and innovation involve a variety of areas<br />
that range from technology, institutions and organizations,<br />
modes of operation, information and knowledge, finance<br />
and human development. Innovation can also take a<br />
variety of forms, including improved project design and<br />
quality, changes in organization and management, higher<br />
efficiency, high- and medium-tech industrial development,<br />
creation of new linkages and coordination mechanisms,<br />
scientific research and<br />
the commercialisation<br />
of technical knowledge. 1<br />
This goes to show that, to<br />
a large extent, creativity<br />
and innovation are already<br />
embedded in economic<br />
functions and under<br />
the control of financial<br />
capital. 2 Creativity and<br />
FACT innovation<br />
can flourish in many<br />
other areas that do<br />
not automatically<br />
contribute to economic<br />
development per se<br />
such as developing and<br />
In technologies<br />
managing urban life,<br />
and the arts alike,<br />
the renewal of social<br />
institutions, better urban innovation is increasingly<br />
policies, development of dominated by the private<br />
knowledge networks, etc. sector.<br />
103<br />
Creativity and<br />
innovation are largely<br />
influenced by six main<br />
types of factors: (1)<br />
locational advantages<br />
(i.e., economies of<br />
agglomeration and<br />
‘positive externalities’<br />
at regional scale); (2)<br />
knowledge networks; (3)<br />
cultural factors; (4) the<br />
economic environment;<br />
(5) organizational factors; and (6) state/government<br />
interventions (i.e., policies, incentives, institutions).<br />
‘Innovation’, as glorified in association with ‘creative<br />
cities’, the ‘creative class’ and ‘city competition’, more often<br />
than not is in the sole benefit of business and economic<br />
elites, 4 and it fails to integrate the various dimensions<br />
of prosperity, particularly equitable development and<br />
environmental sustainability.<br />
Innovation is a creative capital that is brought to bear<br />
on various dimensions of development and prosperity,<br />
in the process unleashing undeveloped potential and<br />
making fuller use of local resources and assets. The<br />
culture of creativity must be embedded in the way<br />
cities operate. 6 Therefore, it is not just for government<br />
or business, but also<br />
for communities and<br />
the public at large to<br />
Innovation, as<br />
contribute their own FACT defined in this<br />
powers of imagination.<br />
Report, is a broader<br />
notion that has to do<br />
And this has to be not just<br />
with creative approaches<br />
encouraged but legitimised<br />
to planning, economy,<br />
as well, in a bid to broaden social inclusion,<br />
the range of solutions to<br />
environment, culture and<br />
urban issues.<br />
local identity. 5<br />
The cities<br />
POLICy and countries<br />
best placed for economic<br />
growth and prosperity are<br />
those that invest in building<br />
knowledge and innovation<br />
institutions and related<br />
systems with strong support<br />
from public authorities and<br />
the private sector. 3
State of the World’s Cities <strong>2012</strong>/<strong>2013</strong><br />
Box 3.2.1<br />
Measuring Innovation and Creativity<br />
In 2000 a “Creative City Index” was developed to measure<br />
‘the imaginative pulse of cities’, combining a variety of<br />
indicators ranging from political and public frameworks,<br />
diversity, vitality and expression, openness and tolerance,<br />
entrepreneurship, vision, liveability, learning and<br />
professionalism, among 10 specific dimensions. In 2007,<br />
Melbourne-based “2thinkNow” developed an “Innovation<br />
Cities Program” along with an “Innovation Cities Index” in a<br />
bid to enhance understanding of the links between innovation<br />
and the way cities operate. The measure also uses a large<br />
variety of indicators, involving cultural assets, infrastructure<br />
and networked markets in areas such as commerce, finance,<br />
food, the arts, health, technology, religion, the media, etc.<br />
On this basis, cities are classified in five categories: ‘nexus’<br />
(cities featuring critical innovations),’hub’ (cities that are<br />
influential in key areas), ‘node’ (cities combining broadranging<br />
performance and imbalances), ‘influencer’ (cities that<br />
are competitive but unbalanced on the whole), and ‘upstart’<br />
(cities with potential for future performance).<br />
Source: UN-Habitat (<strong>2012</strong>) Decentralization in Iraq: Challenges and<br />
Solutions for Federal and Local Governments, Nairobi: UN-Habitat<br />
POLICy<br />
A creative city must establish a balance between<br />
‘hardware’ factors – infrastructure and technology –<br />
and ‘software’ factors (including mind-set, dynamics of place, the<br />
connection between thinkers and doers, and a change-friendly<br />
environment). 7<br />
<strong>THE</strong> FACTORS BEHIND URBAN INNOvATIvENESS<br />
Innovation can emanate from a creative worker, a<br />
community leader, a business person, an artist, a public<br />
servant or a scientist, etc. Innovation can respond to a<br />
specific problem, reduce risks, anticipate challenges, result<br />
in new products or process, or harness existing or emerging<br />
opportunities. For the purposes of urban prosperity,<br />
innovation has a clear role in improved conditions for<br />
populations and the way they live, work, move, relax and<br />
more generally make the most of the urban advantage.<br />
If its existing<br />
creative capital is to be<br />
POLICy<br />
The culture of<br />
creativity must<br />
be embedded in the way<br />
cities operate. 8<br />
enhanced, or activated<br />
where dormant, a city<br />
should become a locus<br />
where sociocultural<br />
diversity can be staged,<br />
104<br />
and where links can flourish among both individuals and<br />
institutions. In practice, all of this requires well-adapted<br />
physical environments, which in turn have to do with<br />
urbanization economies9 and better urban planning. From<br />
a more institutional point of view, support to knowledge<br />
exchange and networking is another way of stimulating<br />
creative capital, along with favourable conditions for<br />
research and development. As for the productive sector,<br />
creative stimulation can also derive from economies of<br />
agglomeration and an entrepreneur-friendly environment.<br />
It may come as no surprise that in Asia, most<br />
local experts saw a strong link between research and<br />
development (R&D), on the one hand, and enhanced<br />
prosperity on the other, with public authorities and other<br />
stakeholders playing significant roles in the areas of<br />
business, industry and technology.<br />
This was the case in Singapore, Hyderabad and<br />
Bangalore (India), Shenzhen and Chongqing (China),<br />
Gaziantep (Turkey) and Cebu (the Philippines). In<br />
Singapore, gross expenditure on R&D increased from<br />
1.9 per cent in 1990 to 2.8 per cent 2008 and three<br />
per cent in 201010 , with the focus on applied research,<br />
technology, sustainable urban living and ‘clean’ energy. 11<br />
In Bangalore, the emergence of the city as a knowledge<br />
hub is a visible impact of policy, entrepreneurship and<br />
innovation. With more than 66 engineering colleges and<br />
55 polytechnics, the city has developed as a centre for<br />
scientific innovation, research in aeronautics and electronics<br />
with strong public research facilities. 12 Biotechnologies<br />
and computer/communications also feature highly in<br />
Hyderabad, India’s pharmaceutical capital, with support<br />
from central government and more than 40 research<br />
and educational institutions. 13 Shenzhen has developed<br />
an endogenous innovation strategy led by the state with<br />
investments from government agencies, industries and<br />
universities. In few years,<br />
the city has developed a<br />
high-tech, modern service<br />
industry, actively promoting FACT industrial transformation<br />
and upgrade, focusing<br />
on electronics, biological<br />
engineering and new<br />
material technology.<br />
The city has also made<br />
important innovations<br />
in the service industry<br />
(finance, logistics and<br />
UN-Habitat<br />
survey shows<br />
that five main factors<br />
are at play when cities<br />
innovate: innovative<br />
urban management,<br />
entrepreneurial capacity,<br />
the promotion of<br />
arts and culture, the<br />
emergence of industrial<br />
clusters, and research<br />
and development (R&D).
Innovating to Support the Transition to the City of the 21st Century<br />
Singapore: an innovative bronze sculpture of five boys jumping into the river for a swim, by local sculptor Chong Fah Cheong, installed at<br />
the Open Air Interpretive Centre along the Singapore River serves to remind viewers of the essential freedoms that underpin a vital and<br />
prosperous city.<br />
© Sengkang<br />
105
State of the World’s Cities <strong>2012</strong>/<strong>2013</strong><br />
culture) as a way to drive<br />
economic growth and<br />
prosperity. 14 Still in China,<br />
Chongqing has utilized<br />
a state-led investment to<br />
stimulate the economy and<br />
improve social welfare by<br />
optimizing endogenous<br />
development through<br />
research and technology.<br />
Chongqing strategy “Three<br />
Centers, Two Hubs, and<br />
One Base” connects<br />
business, finance and education with a strong support of<br />
infrastructure, communication and a modern base of hightech<br />
industry. 15 In contrast to<br />
FACT Asia, the share<br />
of R&D as a per cent of<br />
GDP expenditure in Africa<br />
and Latin America is low,<br />
where not next to nil. In the<br />
absence of any systematic<br />
public sector involvement,<br />
creativity and innovation<br />
largely remain the purview<br />
of the private sector.<br />
In southeast Turkey, Gaziantep – one of<br />
the oldest inhabited cities in the world – has deliberately<br />
embraced R&D and innovation, with various educational<br />
institutions explicitly supporting entrepreneurship. Business<br />
has cooperated with public authorities to launch a number<br />
of initiatives known as Trademark City, Smart Industry,<br />
Teknopark, Innovation Valley and R&D Movement to<br />
Nairobi, Kenya: children play in a schoolyard in Kibera. The newly introduced Pesapal system enables<br />
school fees to be paid by the Internet or mobile telephone.<br />
© Meunierd/Shutterstock.com<br />
106<br />
open up markets, diversify the economy and promote<br />
employment in the search of prosperity. 16<br />
With the exception of South Africa and Brazil, which<br />
recorded the highest expenditure on R&D as a percentage<br />
of GDP in their respective regions (around 1 per cent<br />
in 2008), the Latin America region and the Sub-Saharan<br />
Africa had an average expenditure of about 0.6 per cent.<br />
In some African countries such as Mali, Mozambique,<br />
Nigeria, Senegal, Uganda, Zambia, among many others, this<br />
expenditure was under 0.4 per cent. 17<br />
A vARIETy <strong>OF</strong> SOCIAL AND<br />
INSTITUTIONAL INNOvATIONS<br />
Many factors stand in the way of urban innovation,<br />
especially in developing countries. Not all these factors<br />
have been sufficiently identified, understood or addressed.<br />
Still, seven major types of deficiency seem to play significant<br />
roles: (1) poor physical and knowledge infrastructure; (2) an<br />
absence of appropriate innovation policies (due to lack of<br />
interest or understanding); (3) limited financial resources;<br />
(4) weak local institutions (formal or informal); (5)<br />
unavailability of human resources (number and qualification<br />
of personnel); (6) lack of<br />
stakeholder participation<br />
and coordination in<br />
the elaboration and<br />
implementation of<br />
innovation policies; and (7)<br />
poor incentives (if any).<br />
In other cases, the<br />
problems instead lie<br />
in technology transfer<br />
and poor adaptation<br />
to local know-how. 18<br />
But then ‘home-made’<br />
innovations, too, can be<br />
poorly related to local<br />
and national conditions,<br />
or overlook the needs<br />
of the underprivileged,<br />
when they fail “to take<br />
into due consideration the<br />
plurality of knowledge and<br />
technological options” that<br />
are locally available. 19<br />
The city of<br />
Johannesburg has adopted<br />
an innovative governance
model to rebuild local government and improve service<br />
delivery. Bangalore in India has launched technologybased<br />
public-private experiments in governance in a bid<br />
better to deliver public services, too. In Latin America<br />
and the Caribbean, Rosario, just like Santo Domingo, has<br />
introduced significant institutional innovations in terms of<br />
participatory governance. In Nairobi, Kenya, the private<br />
sector has launched ‘Pesapal’ a new payment platform<br />
enabling low- and middle-income residents to conduct<br />
e-commerce transactions and even to pay school fees via cell<br />
phones or the Internet.<br />
Many other social and institutional innovations involve<br />
the creation of new systems and models to meet the needs<br />
of underserved populations in a more efficient, effective,<br />
and sustainable manner. In Iran’s Tehran, the scope of the<br />
WHO-UN-Habitat ‘Urban HEART’ Programme has been<br />
extended to assess equity under not just under the health<br />
dimension but also a more general social perspective.<br />
Shenzhen has created a multilevel social security system<br />
that includes basic social insurance, poverty insurance,<br />
compensation for job seekers, and special care for patients<br />
and the disabled, which includes the migrant population<br />
that represents up to 75 per cent of the population. 20<br />
Chongqing has created investment companies to activate<br />
state-owned capital to speed up the construction of<br />
infrastructure and public facilities, using a combination of<br />
innovative funding mechanisms: taxes, land reserves, fees,<br />
state bonds and state-owned capital. 21<br />
Social and institutional innovation can take the form of<br />
enlightened rules or legislation. In Cebu, the Philippines, an<br />
ordinance now encourages those employed in outsourced<br />
business processing services to enrol in (post)graduate<br />
studies, in a bid to expand the pool of highly skilled people.<br />
Rosario, Argentina, has declared itself a “Human Rights<br />
City”, with a commitment to openness, transparency and<br />
accountability. 22 Some other institutional innovations<br />
connect urban planning and design with the use of social<br />
public space. In Colombia,<br />
Bogotá has improved<br />
Innovations are<br />
many diverse public spaces<br />
FACT often copied (sidewalks, public parks<br />
or transferred from<br />
and libraries) in a bid to<br />
abroad. More often than rebuild social cohesion.<br />
not though, this causes<br />
Singapore’s ‘Skyway’ is a<br />
problems as foreign<br />
spectacular aerial walkway<br />
innovation runs against<br />
the grain of the social or<br />
among giant man-made<br />
cultural features of the trees that collect rainwater<br />
target communities. and generate solar energy,<br />
Innovating to Support the Transition to the City of the 21st Century<br />
107<br />
and is an invitation to view<br />
the city from a different<br />
perspective. In Korea,<br />
the municipality of Seoul<br />
resorts to urban design to<br />
improve the efficiency and<br />
enhance the attractiveness<br />
of the city with innovative<br />
projects, such as the ‘Han<br />
River Renaissance’ scheme<br />
and the ‘City in the Park’<br />
initiative. 23<br />
<strong>THE</strong> TRANSFORMATIvE POWER <strong>OF</strong> INNOvATIONS<br />
Almost by definition, innovation processes are not linear,<br />
nor are they easily controllable. However, as far as urban<br />
innovation is concerned, a consistent basic pattern seems to<br />
be at work. Whether in response to new risks or immediate<br />
emergencies, or in more ordinary circumstances, urban<br />
innovation seems to result from cooperation and dialogue<br />
among a broad variety of stakeholders. Such dialogue acts<br />
as a catalyst, bringing together a variety of perspectives,<br />
resources, capacities and types of human capital. 24<br />
Innovations introduce knowledge, products, processes<br />
and programmes that change the ways of doing business or<br />
using resources, or even social attitudes and preferences.<br />
Innovations are at the core of all economic processes and<br />
they contribute to knowledge generation and information<br />
flows’. 25 Innovations of a technological nature have added<br />
value and helped transform<br />
the urban space (e.g.,<br />
connectivity, proximity<br />
and distance, de-location<br />
of manufacturing).<br />
Although innovations<br />
take place mainly in major<br />
metropolitan centres,<br />
they are not restricted to<br />
big cities.<br />
The transformative<br />
power of innovation is<br />
closely linked to the various<br />
components of prosperity –<br />
productivity, infrastructure,<br />
quality of life, equity<br />
and environmental<br />
sustainability. Innovation<br />
can contribute to any of<br />
POLICy<br />
Cities have<br />
interest<br />
to promote social and<br />
institutional innovations in<br />
response to local problems<br />
to address social needs<br />
and improve the efficiency<br />
and quality of urban<br />
management.<br />
POLICy<br />
It is in cities’<br />
best interests<br />
to strengthen the links<br />
between policy-makers,<br />
business, academia, civil<br />
society and a variety of<br />
practitioners to promote<br />
urban innovations.<br />
FACT<br />
Local authorities<br />
are becoming<br />
increasingly aware that<br />
promoting interactions,<br />
synergies and adequate<br />
environments can<br />
enhance local creative<br />
capital and prosperity.
State of the World’s Cities <strong>2012</strong>/<strong>2013</strong><br />
these dimensions or respond to the supporting institutions<br />
and policies at the core of these dimensions (see the<br />
‘Wheel of <strong>Prosperity</strong>’, Chapter 1.4) steering the course<br />
of the city along the path of prosperity and sustainable<br />
development. From this more general, strategic perspective,<br />
innovation can bring four major types of benefits: (1)<br />
reviving and sustaining the social economy (e.g.. better<br />
policies for human needs satisfaction); (2) changes in<br />
social relations (e.g. new societal arrangements, new social<br />
pact); (3) reinforcing existing, or creating new, institutions<br />
for improved urban management and governance (e.g.,<br />
regulation of land or social conflicts, new legislation);<br />
and (4) forward-looking changes to the urban space (e.g.<br />
resource redistribution, expanded access to services and<br />
public goods). Any value added by all these social and<br />
A pedestrian bridge (part of the railing stolen for scrap) near Cape<br />
Town, South Africa<br />
© <strong>2012</strong> Rodger Shagam/fotoLIBRA.com<br />
108<br />
institutional innovations will accrue primarily to society<br />
as a whole, rather than private individuals or groups26 ,<br />
enhancing the prospects of prosperity and giving its full<br />
meaning to the notion of ‘spatial justice’. 27<br />
Being a social construct, any city can be steered and<br />
shaped towards higher levels of prosperity. A fresh, different<br />
vision of urban planning and design can combine with new,<br />
more insightful change narratives and development ideas.<br />
As urban risks and challenges keep changing over space<br />
and time, existing safeguards, instruments or mechanisms<br />
must come under review and be adjusted as and where<br />
required. Innovation must also help reduce the cost of<br />
urban living. Innovative rules and legislation must support<br />
the transformation of the existing urban model. The<br />
current model is unsustainable for several reasons: endless<br />
physical expansion, intensive energy use, alarming and<br />
dangerous contributions to climate change, multiple forms<br />
of inequality and exclusion, and inability to provide decent<br />
jobs and livelihoods. 28 If ongoing urbanization is to usher<br />
in the city of the 21st century, then this transformation must<br />
be grounded in a more effective and sustainable use of<br />
urban space. The city of the 21st century is a reinvented city<br />
that is more productive, equitable and sustainable. It is a<br />
more prosperous city.<br />
Urban <strong>Prosperity</strong> Through<br />
Planning and Design<br />
In the midst of ongoing demographic, socioeconomic or<br />
environmental cross-currents, cities must reassert control<br />
over their destinies with reinvigorated urban planning and<br />
design for the sake of shared prosperity and harmonious<br />
development.<br />
This imperative comes as a reminder of the fact that so<br />
far, in most cities of the developing world, modern urban<br />
planning (where any) has proved unable to nurture shared<br />
socioeconomic advancement. For all the paraphernalia of<br />
legislation, complex regulations and spatial design plans,<br />
a majority of those cities have continued with the flawed<br />
models which, as ‘advanced’ countries have finally found<br />
out, are unsustainable in a variety of ways.<br />
Cities have found themselves woefully unprepared<br />
in the face of the spatial and demographic challenges<br />
associated with urbanization, not to mention those of<br />
an environmental nature. With a few commendable
exceptions, modern urban planning has failed to integrate<br />
the urban poor in the socioeconomic fabric of the city.<br />
As an expert in Bangalore put it, “The poor have survived<br />
despite master planning.” 30 Understood primarily as a<br />
technical tool, planning has been unable to address the<br />
power relations that have been at work to the detriment of<br />
the great majorities of urban populations. Planning has also<br />
proved unable to prevent environmental degradation or the<br />
formation of slums, and is notable for serious shortcomings<br />
in terms of transport and urban mobility.<br />
Conceived as a comprehensive, long-term strategy,<br />
a master plan – the quintessence of modern planning –<br />
typically represents an ideal end-state for a particular city<br />
with serious gaps between the initial vision and actual<br />
results. This has ensued in what a scholar in 1996 called<br />
“the dark side of planning” 31 , something an expert in<br />
Montevideo has referred to as “urban plans that are at odds<br />
with the notion of prosperity.” 32<br />
The shortcomings of modern urban planning have<br />
triggered significant reform since the 1980s and 1990s, in an<br />
effort to move away from comprehensive plans, top-down<br />
decision-making and wide-ranging regulation. 33 A more<br />
flexible approach was adopted to improve conditions in<br />
cities, through ‘strategic planning’ and other methods that<br />
are more pragmatic, incremental and typically focused on<br />
‘getting things done’. However, too many ‘strategic urban<br />
plans’ have effectively imposed an entrepreneurial view of<br />
the city, promoting mostly economic prosperity and often<br />
turning into marketing gimmicks in all but name, complete<br />
with oversized architectural designs and mega-developments.<br />
In emerging or developing countries, these initiatives<br />
typically favour the gentrification of entire areas and, at times,<br />
massive displacement in order to make room for highways,<br />
skyscrapers, luxury compounds, shopping malls, etc., at the<br />
expense of the habitat and livelihoods of the poor. 34<br />
UN-Habitat policy analysis in 50 cities in Asia, Africa,<br />
Latin America and the Arab States (2011) shows that up<br />
to 80 per cent of local<br />
experts believe that the<br />
benefits of economic<br />
FACT prosperity mainly serve the<br />
interests of the wealthy and<br />
politicians (a view shared<br />
by up to 90 per cent of<br />
African experts). Through<br />
political influence, bribery<br />
and corruption, these<br />
powerful interest groups<br />
Whatever<br />
the planning<br />
approach, powerful<br />
political and economic<br />
interests keep interfering<br />
with the design and<br />
implementation of<br />
strategic plans and<br />
the pursuit of urban<br />
prosperity for all.<br />
Innovating to Support the Transition to the City of the 21st Century<br />
109<br />
FACT<br />
From Asia to Africa to Latin America, ‘master’,<br />
‘blueprint’ and layout plans have had similar,<br />
harmful consequences in countless numbers of cities: spatial<br />
segregation, social exclusion, excessive mobility needs and<br />
consumption of energy, together with poor regard for the<br />
potential economies of scale and agglomeration that any city<br />
can offer. 29<br />
manage to distort urban plans, dodge spatial or legal rules,<br />
reduce the production of public goods and manipulate<br />
the power of eminent domain; in the process they<br />
capture unfair shares of a city’s potential, resources and<br />
prosperity to the detriment of large, poor majorities of<br />
urban populations.<br />
The New Urbanism Movement of the early 1980s<br />
broke with conventional master-planning and introduced<br />
a number of welcome innovations: liveable, pedestrianfriendly<br />
cities, dense neighbourhoods with mixes of<br />
housing and job-creating commercial and business sites,<br />
together with mixed land uses having a diversity of<br />
buildings in terms of style, size, price and function – all<br />
of this with a strong focus on local communities. 35 For all<br />
these fresh efforts, though, a conventional approach to<br />
urban development has remained dominant to this day.<br />
In developing and emerging countries alike, cities are still<br />
hostages to a mix of homogeneous forms or functions on<br />
the one hand, and spatial /social segregation on the other<br />
hand. Urban areas continue to expand across endless<br />
peripheries, with serious, pervasive problems of traffic<br />
congestion, enhancing the dependence on motor vehicles<br />
and intensive use of expensive fossil fuels. This dominant<br />
type of city is detrimental to the built heritage and the<br />
environment, including<br />
surrounding agricultural<br />
land, as well as biodiversity.<br />
This is the pattern which<br />
UN-Habitat refers to as<br />
the “Global Standard<br />
Urbanization Model<br />
of the 20th Century”<br />
(GS20C), 36 Today, the<br />
FACT GS20C<br />
model appears to be<br />
predominant across<br />
the world, being<br />
largely driven by land<br />
which<br />
speculation and real<br />
estate interests that<br />
privileges individualism,<br />
build cities according to<br />
consumerism, new<br />
financial and economic<br />
(artificial) values and<br />
parameters often<br />
lifestyles, excessive mobility radically at odds with<br />
and privatization of the<br />
shared prosperity.<br />
public space.<br />
37
State of the World’s Cities <strong>2012</strong>/<strong>2013</strong><br />
RE-POSITIONING URBAN PLANNING AT <strong>THE</strong><br />
HUB <strong>OF</strong> <strong>THE</strong> WHEEL <strong>OF</strong> PROSPERITy<br />
“The city has many scars to treat and many wounds to cure;<br />
urban planning is powerless to do that” 38 , claims an expert in<br />
Santo Domingo (Dominican Republic). Still, in the 50 cities<br />
surveyed by UN-Habitat in 2011, efficient urban planning<br />
and urban management are perceived as the most important<br />
conditions for shared<br />
POLICy<br />
If urban planning<br />
is to be in a<br />
better position to address<br />
the shortcomings of the<br />
GS20C model, both theory<br />
and practice must come<br />
under serious review to<br />
‘rescue’ the discipline from<br />
its role as a mere technical<br />
tool, restoring it to its<br />
rightful position in the public<br />
sphere.<br />
POLICy<br />
As a decisionmaking<br />
tool<br />
urban planning must better<br />
defend the ‘public’ against<br />
the menace of everexpanding<br />
‘private’ interests<br />
and its consequences:<br />
shrinking public spaces<br />
and reduced provision of<br />
public goods, which affect<br />
more collective, intangible<br />
dimensions like quality<br />
of life, social interaction,<br />
cultural identity and social<br />
values.<br />
FACT<br />
Very often<br />
planning has<br />
failed to represent correctly<br />
collective values and<br />
agreements, instead<br />
of contributing to the<br />
perpetuation of the urban<br />
divide with daunting,<br />
outdated, irrelevant<br />
requirements.<br />
prosperity. 39<br />
For any revival or<br />
reinvigoration of urban<br />
planning to take place<br />
in the pursuit of shared<br />
prosperity, four conditions<br />
must be met: (i) restoration<br />
of public confidence; (ii)<br />
repositioning of urban<br />
planning in decision-<br />
Box 3.2.2<br />
Streetwise versus Petrol-Powered <strong>Prosperity</strong><br />
110<br />
making; (iii) deployment of the fullness of its functions<br />
across the five dimensions of shared prosperity; and (iv)<br />
support for these functions with adequate financing.<br />
Restoration of confidence: Public confidence must<br />
be restored in the capacity of urban planning (alongside<br />
other urban power functions) to represent the interests of<br />
all the population – including the poor, women, children,<br />
youth, elderly or disabled people, immigrants and ethnic<br />
minorities – so that the public, collective interest prevails at<br />
all times and across the whole jurisdiction over any other,<br />
and more particularly the vested or special interests of the<br />
rich and powerful.<br />
Repositioning: If it is to play this stronger role to the<br />
full, urban planning must be re-positioned. No longer a<br />
mere technical functionality, urban planning must sit at the<br />
core of urban power. Urban planning can only be as good<br />
as the values it represents and the governance mechanisms<br />
that frame it.<br />
In Peru’s capital Lima, it has taken ‘only’ an open-air public staircase all the way downhill to the city<br />
centre to change the name of an informal settlement from fearful ‘Quick Sands’ to ‘The Belt of Hope’.<br />
This goes to show the regenerating power of planning for urban public spaces and their decisive role<br />
in shared prosperity – well away from the constraints of the outdated automobile-based model of<br />
urban development.<br />
Indeed, public spaces, as symbolized by ‘the street’, can make significant contributions to<br />
socioeconomic prosperity, if only they are adequately configured. The street acts as the interface<br />
between public and private spaces, with retail businesses and jobs dependent on the quality of the<br />
pedestrian environment. In British towns, customers were found to spend nearly twice as much<br />
when walking instead of driving. In Mexico, research has shown that ‘walkability’ improves home<br />
and land values.<br />
Public spaces provide the physical support for urban infrastructure. However, particularly in<br />
the developing world, streets are designed mainly for motorized traffic, overlooking the human<br />
dimension and only adding to congestion with more or wider streets. The resulting huge imbalance<br />
in transport options damages other aspects of urban functionality. A number of cities have<br />
sought to counter this trend in a variety of ways. As early as 1962 motor vehicles were banned<br />
from Copenhagen’s main street and bicycle commuting was facilitated. In Melbourne, improved<br />
sidewalks, new pedestrian streets, squares and urban design have together increased pedestrian<br />
traffic by 39 per cent in daytime and 100 per cent at night. Combined with other modes of popular<br />
transport like biking and walking, Bus Rapid Transport (BRT) has spread from Curitiba (Colombia)<br />
to Jakarta, Bogotá, Guatemala City, Guangzhou, Istanbul, Mexico City, Brisbane and Los Angeles,<br />
among others.<br />
Upgraded and better designed public spaces have the potential to improve overall quality of life.<br />
In Cape Town under the Dignified Places Programme, more than 40 projects have brought dignity,<br />
beauty and better functionality to various areas, in the process demonstrating that after decades of<br />
repression it was once again possible to meet and talk in a shared space.
Working on the five ‘spokes’: Interdependencies and<br />
interactions among the five ‘spokes’ in the ‘wheel of urban<br />
prosperity’ (productivity, infrastructure, quality of life,<br />
equity and environmental sustainability) can be deliberately<br />
enhanced (as opposed to being allowed to occur all by<br />
themselves) through the strategies and interventions that<br />
are part and parcel of urban planning. More specifically, it<br />
is in the power of a well-planned decision or well-calibrated<br />
choice in one dimension of prosperity − for example, the<br />
design of a street supporting multimodal transport as part<br />
of the infrastructure development of the city − not just to<br />
make that particular part of the urban space more accessible<br />
or pedestrian-friendly, but in the process also to improve<br />
productivity (shops, street-trading, etc.), quality of life and<br />
social inclusion (see Box 3.2.1.).<br />
Financial support: For urban planning to work more<br />
efficiently as an urban power function, it must be reinforced<br />
from a financial and legal point of view. Cities need more<br />
permanent funding mechanisms to support the provision<br />
of public goods and the design and implementation of<br />
sustainable technical solutions if their performance and<br />
functionality are to be improved.<br />
Few cities or countries are in a proper legal position to<br />
do that, and where they are, they find themselves faced with<br />
systematic interference by special interest groups or political<br />
expediency. 40 Here again, the public interest must prevail,<br />
and governments must look to improve and enforce the<br />
mechanisms that enable local authorities to capture urban<br />
land and site values, in the process generating the revenues<br />
needed to extend prosperity to the poorest areas. 41<br />
ExPANDING PROSPERITy:<br />
CHANGING CITy LANDSCAPES<br />
In many cities, urban planning has been instrumentalised by<br />
the real estate business. Cities that respond to the interests<br />
of the better-off or only focus on strategic economic<br />
interventions in specific spaces tend to create enclaves of<br />
prosperity for a select few.<br />
POLICy UN-Habitat<br />
calls for<br />
a fresh, different type<br />
of urban planning and<br />
design – one that has<br />
the power to transform<br />
city landscapes and<br />
expand existing<br />
enclaves of prosperity<br />
to the entire city.<br />
Urban planning can be<br />
so unrealistic or overambitious<br />
as to overlook<br />
the need to steer and<br />
control spatial expansion,<br />
with large parts of the city<br />
ignoring existing plans or<br />
regulations. “The city falls<br />
out of the map, making<br />
it irrelevant”, deplores<br />
Innovating to Support the Transition to the City of the 21st Century<br />
111<br />
POLICy<br />
Restoring urban planning at the central point of the<br />
‘wheel’, where a solid and efficient institutional ‘hub’<br />
holds together, controls and activates the five ‘spokes’ , can only<br />
enhance the conditions for sustained, shared prosperity.<br />
POLICy<br />
an expert in Panama<br />
City. 42 Land legislation<br />
Either by action or<br />
and planning<br />
omission, this type of urban must combine to put<br />
planning contributes to<br />
municipal authorities<br />
in a better position to<br />
the production of spatial<br />
extract land values and<br />
inequities, rather than<br />
related capital gains, with<br />
better shared prosperity.<br />
the additional revenue<br />
This reinvigorated<br />
available for the funding of<br />
notion of urban planning<br />
infrastructure extensions<br />
comes with a new value<br />
and other projects.<br />
system that relies on<br />
effective institutions, welladapted<br />
laws and regulations, sustainable urban solutions and<br />
active civic involvement in public affairs. This type of planning<br />
signals a paradigm shift towards a new urban pattern − the<br />
city of the 21st century: a city that can better respond to the<br />
challenges of our age, optimizing resources to harness the<br />
potentialities of the future; a people-centred city, one that is<br />
capable of transcending the inefficient, unsustainable GS20C<br />
model, in the process integrating and nurturing the five<br />
dimensions of urban prosperity as defined in this Report.<br />
However, if urban planning is to be reinvigorated, it<br />
must shift away from the ‘spoke’ of productivity, where it has<br />
been predominantly operating these past several decades,<br />
to the centre of the ‘wheel’, right in the ‘hub’: indeed this<br />
is where, as an urban power function, planning will be in a<br />
better position to make its beneficial influence felt across all<br />
the ‘spokes’, increasing the<br />
scope of shared prosperity<br />
across the whole of the<br />
The 21st<br />
city. This will, of course, POLICy century is in a<br />
involve political choices<br />
position to ensure equitable<br />
and commitments, which<br />
development, preserve<br />
must be turned into tools, the natural environment,<br />
regulations and sustainable promote inexpensive energy<br />
sources, provide necessary<br />
technical solutions, which<br />
infrastructures and ensure<br />
will be all the better<br />
inclusive economic growth.<br />
accepted by society at large The city of the 21st century<br />
as they are seen to embed builds the conditions of<br />
shared prosperity across the prosperity for all.<br />
whole urban space.
State of the World’s Cities <strong>2012</strong>/<strong>2013</strong><br />
FACILITATING ACCESS TO ‘COMMONS’,<br />
PROvIDING PUBLIC GOODS, IMPLEMENTING<br />
SUSTAINABLE SOLUTIONS<br />
Facilitating Access to ‘Commons’: A prosperous city<br />
facilitates equitable access to the ‘commons’. These include<br />
water, air, biodiversity, knowledge and other shared<br />
resources, including public infrastructure, together with<br />
more intangible forms like a better environment, sense of<br />
identity and cultural and symbolic spaces that in principle<br />
belong to everyone.<br />
Cities with islands of prosperity tend to enclose the<br />
‘commons’, restrict their use to a selected few, or deplete<br />
them through unsustainable use.<br />
Prosperous cities require ‘commons resource pools’,<br />
which can take the form of institutional arrangements where<br />
conflicts are solved through negotiation, and consensus is<br />
built for decision-making. ‘Commons’ also include any legal<br />
or statutory provisions facilitating community participation<br />
in planning decisions, available quality information,<br />
transparency as well as cultural norms and social compacts.<br />
Some public goods, such as community civic centres,<br />
will often be found to function as ‘space commons’,<br />
facilitating the integration of marginal and voiceless groups,<br />
in the process promoting pluralism and diversity, which are<br />
inseparable from shared prosperity.<br />
Providing public goods43 : A prosperous city makes a<br />
profusion of public goods available to all: efficient public<br />
transport, educational<br />
opportunities, healthcare,<br />
quality public spaces such<br />
as libraries, recreation<br />
areas, parks and open<br />
spaces, etc. A substantial<br />
part of urban well-being<br />
is derived from access to<br />
and consumption of these<br />
public goods, which in<br />
principle must be ‘nonexcludable’<br />
(everyone can<br />
enjoy their benefits) and<br />
‘non-rivalry’ (individual<br />
consumption of the good<br />
does not decrease the<br />
amount available for<br />
consumption by others). 44<br />
POLICy<br />
Enclaves of prosperity<br />
‘fence in’ or restrict the<br />
availability of public goods,<br />
UN-Habitat’s<br />
reinvigorated<br />
notion of urban planning<br />
involves sustainable use<br />
and equitable access to<br />
the ‘commons’ through<br />
appropriate policies and<br />
schemes.<br />
In general, the<br />
FACT production AND<br />
enjoyment of public goods<br />
rely on a set of ‘commons’<br />
such as better connectivity,<br />
public security and safety,<br />
predictability, property rights<br />
under their various forms,<br />
street nomenclature, etc.<br />
112<br />
concentrating public investment in selected areas only,<br />
limiting access and privatizing control over a number of<br />
such goods.<br />
The provision of public goods contributes to<br />
economic advancement with environmental preservation<br />
and quality of life, which, incidentally, are fundamental<br />
‘smart growth’ concerns, too. 45 Bogotá has transformed<br />
its own landscape with a variety of public goods such as<br />
multi-modal transport, social infrastructure and quality<br />
public spaces that have contributed to sharing more of<br />
the benefits of prosperity with poor and middle-income<br />
neighbourhoods. Still in Colombia, Medellín has resorted<br />
to bold civic architecture, public spaces and other public<br />
goods in a bid to enhance collective prosperity. Involvement<br />
of urban planning with education, culture, infrastructure,<br />
safety and community development has enabled the<br />
municipality to connect poor barrios (which, according to<br />
the head of municipal planning, “always had lots of energy,<br />
but were disconnected from the city”) with more affluent<br />
neighbourhoods, in the process planting the seeds of mutual<br />
trust and expanding shared prosperity. 46<br />
Acting from the ‘hub’ of the ‘wheel for prosperity’,<br />
urban planning can identify strategies and plan for optimal<br />
production of public goods, in the process contributing<br />
to social capital, enhancing sense of place, safety and<br />
security, integrating social groups (e.g., youth), and<br />
increasing the economic value of the areas where these<br />
goods are provided. This strategy can generate widespread<br />
benefits to all urban residents, expanding prosperity across<br />
different areas. Such prosperity in turn can be leveraged for<br />
maintenance and further enhancement of public goods.<br />
Implementing Sustainable Solutions: Prosperous cities<br />
must plan and implement a variety of technical solutions<br />
to improve the functionality of the city and achieve a<br />
sustainable urban form.<br />
Although solutions can<br />
vary according to local<br />
conditions, UN-Habitat POLICy has identified a number<br />
of key interventions in<br />
various areas to assist the<br />
transition away from the<br />
current “Global Standard<br />
Urbanization Model of the<br />
20th Century” (GS20C),<br />
which is unsustainable<br />
on many accounts, to the<br />
city of the 21st century.<br />
A<br />
reinvigorated<br />
notion of urban planning<br />
would give any city<br />
tighter public control<br />
over the use of land,<br />
change the form and<br />
function of cities<br />
based on sustainable<br />
development principles,<br />
as well as expand the<br />
provision of, and access<br />
to, public goods.
As suggested earlier, it is in the power of well-calibrated<br />
planning rules and interventions to help embed the five<br />
dimensions of shared prosperity across the length and<br />
breadth of any urban jurisdiction.<br />
Making more functional the city, preserving access to the<br />
commons and producing useful public goods can be achieved<br />
through five different, sustainable types of intervention:<br />
Increase population density to sustainable levels: More<br />
intense land occupation and activities result in sustainable<br />
population densities which contain or reduce urban sprawl<br />
and depletion of limited resources. Greater proximity will, in<br />
turn, facilitate supply and distribution of goods and services.<br />
An efficient layout (together with adequate land legislation<br />
and policies) can reduce the cost of infrastructure. On top<br />
of suburban densification and sprawl remediation, land use<br />
can be intensified through area redevelopment, planning for<br />
new areas with higher densities, ‘brownfield’ development<br />
(i.e., decontaminating and developing land previously used<br />
for industrial or certain commercial purposes), building<br />
conversions, and transit-oriented developments.<br />
Encourage social<br />
diversity and mixed<br />
land-use: Land planning<br />
can bring about<br />
clusters of land uses in<br />
appropriate locations,<br />
with the flexibility<br />
needed to adapt to the<br />
changing requirements<br />
of the population. Urban<br />
planning must facilitate the<br />
deployment of common<br />
spaces that allow encounter,<br />
interaction and dialogue<br />
between different socialethnic<br />
groups. Moreover,<br />
physical urban structure<br />
facilitates communication<br />
between economic activities<br />
and residential areas,<br />
providing employment<br />
and services on a<br />
neighbourhood scale, with<br />
positive repercussions on<br />
productivity, infrastructure,<br />
equity, quality of life and<br />
the environment. Urban<br />
design strengthens and<br />
Innovating to Support the Transition to the City of the 21st Century<br />
113<br />
POLICy<br />
Acting at the space level (form and function of the<br />
city), urban planning can steer the overall functioning<br />
of the ‘wheel’, modulating each dimension of prosperity and<br />
ensuring synergies between them in order to maintain overall<br />
balance and sustainable growth, regardless of city size or level of<br />
development.<br />
empowers structures through infrastructure and facilities<br />
(education, healthcare, commerce, manufacturing and<br />
culture/entertainment).<br />
Devise multimodal mobility strategies: Urban planning<br />
can provide alternatives to the current widespread<br />
dependency on private motorised vehicles and reinforce<br />
London, UK: the Olympic Park for the <strong>2012</strong> Olympics Stratford<br />
was constructed on brownfield sites in an area of East London<br />
that had been previously rundown. After the Olympic games, the<br />
site is to be used to accommodate low cost housing as well as<br />
leisure activities.<br />
© <strong>2012</strong> Alistair Laming/fotoLIBRA.com
State of the World’s Cities <strong>2012</strong>/<strong>2013</strong><br />
use of public transport in combination with non-motorized<br />
modes and proper sidewalks. An integrated urban transport<br />
strategy generates immediate effects on productivity, including<br />
reductions in travel times. Improved transport systems come<br />
with environmental benefits such as better air quality due to<br />
reduced exhaust fumes. Accessibility for all potential users is<br />
essential to ensure equal mobility opportunities.<br />
Plan infill development and guided expansion: Urban<br />
planning must combine both of these for the sake of proper<br />
density and provision of affordable urban land. Infill<br />
development can revitalize dilapidated areas in the city. In<br />
those developing countries where urbanization continues<br />
apace, new areas must be developed for the benefit of<br />
newcomers if further slum expansion is to be avoided.<br />
Properly planned spatial patterns can reduce pressure on<br />
land, provide for urban services and alleviate the burden<br />
over existing infrastructure. In addition, forward-looking<br />
planning can put a halt to land speculation while facilitating<br />
access to affordable housing and urban services.<br />
Promote Livable public spaces and vibrant streets:<br />
Public spaces and streets must be seen as multifunctional<br />
areas for social interaction, economic exchange and cultural<br />
expression among a wide diversity of participants. It is for<br />
planning to organize for those public spaces, and for design<br />
to encourage their use, in the process enhancing a sense of<br />
identity and belonging. Safety and security are important<br />
dimensions to be considered in any such design, together<br />
with vital underground infrastructure (water, energy and<br />
communications).<br />
Empowering Laws<br />
and Institutions for<br />
Urban <strong>Prosperity</strong><br />
The success of some of the cities as highlighted in<br />
this Report is based on specific combinations of laws,<br />
regulations, institutions and processes. In almost all cases,<br />
FACT<br />
As the proximate reflection of society’s values, and as<br />
an emanation of political and social relations, laws and<br />
institutions serve as the most powerful instrument available to<br />
shape urban development.<br />
114<br />
advances along the five dimensions of prosperity are either<br />
accelerated or impeded by existing bodies of laws and<br />
regulations, the strength of enforcement, as well as by the<br />
configuration, capacity and flexibility of the institutions<br />
responsible for steering urban development. In recent years,<br />
there has been a resurgence of policy reviews and scholarly<br />
studies striving to address the normative and organizational<br />
underpinnings of urban change.<br />
To paraphrase Amartya Sen’s dictum about nations<br />
and democracy, a city does not need to be deemed fit for a<br />
prosperity-oriented legal and institutional system; rather,<br />
it must become fit through such a system – which, again, is<br />
needed now, and for the city as a whole. 47<br />
At a time when so many crisis-struck nations find that a<br />
fresh start on the path of prosperity depends more than ever<br />
on cities, these must mobilise their potential to the full. 48<br />
More than ever, cities need empowering, not forbidding<br />
legal and institutional systems for their prosperity. Cities<br />
need such systems now − and they are at hand’s reach,<br />
if only public authorities found the political will (as this<br />
chapter will show, some do). The universal demand for<br />
justice, fairness and legitimacy transcends cultural barriers.<br />
Therefore, it can be met in a variety of ways through a<br />
variety of frameworks, as determined by local urban power<br />
functions. These form the hub that drives the ‘wheel of<br />
urban prosperity’, supplying the laws and regulations that<br />
support and shape the five ‘spokes’, adjusting them over<br />
time as conditions, needs and fresh risks may require.<br />
However, in all parts of the world, law and institutions have<br />
always been shaped by the complex interactions of sociocultural<br />
factors, with new forces constantly bringing their<br />
own influences to bear. 49<br />
Business, academia, civil society – non-governmental<br />
and grassroots organisations, trade unions and professional<br />
associations, political<br />
parties, etc. − are all the<br />
legitimate expressions of POLICy the various forms which<br />
a city’s specific potential<br />
can take; and the needs to<br />
which these stakeholders<br />
give ‘voice’ relate to the<br />
preservation and further<br />
development of their<br />
respective potentials.<br />
Urban power<br />
functions – governance,<br />
urban planning, legal and<br />
Promoting<br />
prosperity<br />
involves deployment of<br />
proper laws, regulations<br />
and institutions<br />
which have a direct<br />
or indirect bearing on<br />
equity, productivity,<br />
infrastructures and living<br />
standards, and which<br />
extend across the length<br />
and breadth of the<br />
whole jurisdiction of the<br />
relevant urban authority.
Urban Planning/Design & <strong>Prosperity</strong><br />
<strong>Prosperity</strong><br />
Dimensions<br />
Innovating to Support the Transition to the City of the 21st Century<br />
Urban Planning Commons/Goods/<br />
Sustainable Solutions<br />
Productivity Harness the benefits of agglomeration economies Commons<br />
Infrastructure<br />
development<br />
Improve access to productive advantage (knowledge, quality of the environment, etc.) Commons<br />
Provide sufficient public space for circulation of goods and people and deploy adequate Public goods<br />
infrastructure.<br />
Provide efficient transport systems for people and goods<br />
Encourage polycentric urban development, allowing synergies between centres and<br />
Sustainable solutions<br />
sub-centres<br />
Promote mixed-land use to enhance economies of agglomeration and scale with better<br />
clustering<br />
Intensify urban nodes and corridors to maximize the benefits of concentration<br />
Provide clean infrastructure, closing ‘energy waste loops’ to preserve climate, air and water Commons<br />
quality Improve connectivity.<br />
Expand multimodal transport systems with sidewalks and bicycle infrastructure Public goods<br />
Provide social Infrastructure such as civic centres, libraries, sports facilities, etc.)<br />
Ensure eco-efficiency of infrastructural systems Sustainable solutions<br />
Support density through integrated infrastructure development, enhancing efficiency and access<br />
Quality of life Enhance identity and culture through symbolic spaces and heritage preservation<br />
Improve safety and security<br />
Commons<br />
Equity<br />
and social<br />
inclusion<br />
Table 3.2.1<br />
Environmental<br />
sustainability<br />
Support place-making through urban design<br />
Ensure high quality of public spaces that engage interaction among communities Public goods<br />
Promote a system of green spaces<br />
Enhance the role of the street as a multi-functional urban space and integrate natural<br />
spaces and recreational areas<br />
115<br />
Sustainable solutions<br />
Enhance freedom of movement Commons<br />
Provide well–located, adequate public infrastructure and amenities (incl. education,<br />
Public Goods<br />
health, recreation, etc.)<br />
Create mixed neighbourhoods with the diversity of jobs and housing options.<br />
Sustainable solutions<br />
Plan infill development and guided expansions<br />
Promote mixed-used land development, ensuring involvement from marginalised groups.<br />
Improve connectivity between neighborhoods and access to services.<br />
Turn land and development thereof into a revenue source.<br />
Ensure clean air, unpolluted water and preservation of biodiversity.<br />
Commons<br />
Act on climate change adaptation/mitigation<br />
Maximize the natural benefits of the site (sunlight, water bodies, winds, etc.)<br />
Plan for restoration of ecosystems<br />
Enhance public parks, waterfront and ‘green’ areas for recreational and productive purposes Public goods<br />
Use “passive urban design” to reduce carbon emissions Sustainable solutions<br />
Plan for urban density to reduce energy consumption and settlements footprint<br />
Reduce fragmentation of natural systems; reduce spatial footprint through careful design of<br />
infrastructure networks and settlements.
State of the World’s Cities <strong>2012</strong>/<strong>2013</strong><br />
regulatory frameworks and<br />
strong institutions – form<br />
the ‘hub’ that controls the<br />
‘wheel of urban prosperity’<br />
and give it direction,<br />
pace and momentum<br />
(see Chapter 1.1). Shared<br />
prosperity requires the<br />
predominance of the public<br />
interest as embodied in<br />
public authorities50 to<br />
ensure that none of the five<br />
‘spokes’ gain prevalence to<br />
the detriment of the others.<br />
Abstract values and norms<br />
are institutions because<br />
they guide individual<br />
and collective action. 51<br />
In the cities<br />
FACT of the world<br />
today, the power to be<br />
mobilised against the crisis<br />
emanates from a variety of<br />
stakeholders, not just public<br />
authorities, although these<br />
retain a decisive role.<br />
The crucial<br />
POLICy role of public<br />
authorities is to harness the<br />
various types of societal<br />
powers and potentials<br />
through appropriate urban<br />
power functions.<br />
Box 3.2.2 shows how, in<br />
China and in Europe centuries ago, the State imposed the<br />
prevalence of the public over other interests and needs,<br />
treating them all equitably for the sake of shared prosperity.<br />
The powers and functions that are part of the governance<br />
structure of a city may derive from promulgated city charters,<br />
local government frameworks, or directly from the national<br />
Constitution. The rights and responsibilities granted to<br />
individuals and firms in cities are all dictated by prevailing<br />
legal frameworks. Similarly, the interactions among urban<br />
residents as well as the modalities of production, distribution<br />
and consumption of urban space have always been regulated<br />
by explicit and implicit codes of behaviour and practice. The<br />
transformative potential of any city has, therefore, always<br />
been a function of the enabling scope of its laws, regulations<br />
and institutions. The degree to which such instruments can<br />
be deployed as they are, or consolidated, or even reformed<br />
will determine a city’s degree of prosperity.<br />
In the metaphor of the ‘<strong>Prosperity</strong> Wheel’, the legal and<br />
institutional framework as a whole acts as the ‘hub’ which<br />
steers the development<br />
of the five dimensions<br />
(‘spokes’) of prosperity,<br />
Laws and the modulating momentum,<br />
FACT associated<br />
relaying its energy to the<br />
institutional set-up<br />
other dimensions, and<br />
have determined the<br />
maintaining the overall<br />
very genesis of the<br />
modern city, both in its balance of the ‘wheel’.<br />
essence as well as its Internal dysfunctions in<br />
functionality.<br />
the legal and institutional<br />
116<br />
framework, or any disconnect between the hub and the<br />
spokes, interferes with the operation of the ‘wheel’ and<br />
makes any existing momentum unsustainable (such as based<br />
on only one of the five dimensions).<br />
<strong>THE</strong> LEGAL-INSTITUTIONAL BASIS <strong>OF</strong> <strong>THE</strong><br />
20TH-CENTURy CITy<br />
Advances in industrial development, consolidation of the<br />
market economy and the permeating influence of liberal<br />
democracy (both in its origin in the West and the postcolonial<br />
variant in the developing world) have created a<br />
shared legal and regulatory foundation in much of the urban<br />
world. The legal, regulatory and institutional fundamentals<br />
of the contemporary city tend to be identical, differing only<br />
in levels of development, institutional characteristics and<br />
performance ability. Indeed, the legal-institutional basis of<br />
the 20th-century city is fairly uniform; and this explains the<br />
similarities not only in functional modalities but also in the<br />
all-too visible imbalances characterizing the 20th-century<br />
city in its generic sense (i.e., spatial segregation, social<br />
exclusion, a predominance of motorised mobility, high<br />
Karnataka, Bangalore, India: A road sign hangs over the entrance<br />
to ‘Electronics City’, an industrial complex dedicated to the IT<br />
and electronics industries. Located ten miles (16km) outside<br />
Bangalore, the complex has been hugely successful in attracting<br />
foreign investment.<br />
© Chris Stowers/Panos Pictures
Box 3.2.3<br />
Individual versus collective interests<br />
The legal foundation of the 20th-century city lies in the<br />
ancient tenets of Roman Law and the Napoleonic Code,<br />
together with the subsequent elaboration into modern civil<br />
and common law. The gist of this legal corpus is the preeminence<br />
of the individual, who is considered as possessed<br />
of inherent rights as represented in the 18th century French<br />
Revolution’s Declaration of the Rights of Man and the Citizen.<br />
Within this individualistic legal tradition, property rights reign<br />
supreme, with the emphasis on the rights of owners to the<br />
detriment of their social implications and other, broader,<br />
collective interests, including duties and responsibilities. With<br />
particular regard to urban settings, ‘land and property are<br />
conceived largely as commodities whose economic value is<br />
determined by the owners’ interests.’ 52 In this system, the<br />
role of the State at all levels is relegated to harmonizing and<br />
mediating these interests, and to oversee those assets and<br />
facilities that require collective use.<br />
energy consumption and poor regard for the potential for<br />
agglomeration economies.<br />
TOWARDS A NEW LEGAL-URBAN ORDER FOR<br />
HOLISTIC PROSPERITy<br />
During the last two decades, the pitfalls of the conventional<br />
urban development model have become more glaring. As<br />
shown in the previous section (Urban <strong>Prosperity</strong> through<br />
Planning and Design) the potential of cities has not been<br />
fully harnessed, a more common trend has developed where<br />
urban development tends to be spatially fragmented and the<br />
benefits of prosperity remains socially segmented.<br />
In contrast, over the past two decades some Brazilian<br />
cities have taken to re-examining the prevailing urban<br />
legal order, with bold practical schemes inspired by a set<br />
of alternative, radical urban doctrines and jurisprudence<br />
which depart from the classical liberal legalism exalting<br />
individualism and private property. After a long period<br />
of consultations and<br />
negotiations, a nationwide<br />
those few<br />
City Statute was adopted<br />
FACT cities featuring in 2001 enshrining a Right<br />
balanced and<br />
to the City. The Statute<br />
sustainable prosperity<br />
makes an important<br />
have effectively<br />
contribution to urban<br />
deployed adequate<br />
laws, regulations and law, facilitating shared<br />
institutions in support of prosperity, particularly<br />
their transformation. in the context of a<br />
Innovating to Support the Transition to the City of the 21st Century<br />
117<br />
FACT<br />
Although the 20th-century city tends to exhibit fair<br />
degrees of vibrancy and dynamism, whatever attendant<br />
prosperity it experiences is often skewed and unsustainable – and<br />
therefore ridden with perennial crises.<br />
developing country. The Statute also “broke with the<br />
long-standing tradition of civil law and set the basis of<br />
a new legal-political paradigm for urban land use and<br />
development control.” 53 A prominent scholar highlights<br />
four dimensions of Brazil’s 2001 City Statute: “A<br />
conceptual one, providing elements for the interpretation<br />
of the constitutional principle of the social functions of<br />
urban property and of the city; the regulation of new<br />
instruments for the construction of a different urban order<br />
by the municipalities; the indication of processes for the<br />
democratic management of cities; and the identification<br />
of legal instruments for the comprehensive regularisation<br />
of informal settlements in private and public urban<br />
areas.” 54 This new urban legal order has had highly<br />
visible effects. As a nation and at macro-economic level,<br />
Brazil is among a handful of countries in the world that<br />
has been able to achieve remarkable growth rates for<br />
much of the early years of this century, despite the global<br />
economic turbulence. More significantly, Brazilian cities<br />
have been able to expand the middle class segments of<br />
their populations and to improve economic and living<br />
conditions for substantial numbers of poor residents.<br />
Although still very high, cities are reducing income<br />
inequalities, as measured by the Gini coefficient, which<br />
decreased from 0.606 in 1990 to 0.569 in 2009. 55<br />
REvITALIzED ‘RIGHTS TO <strong>THE</strong> COMMONS’ AND<br />
ExPANSION <strong>OF</strong> <strong>THE</strong> PUBLIC REALM<br />
‘Commons’ reinforce the social function of property and<br />
that of the city as a whole, while recognizing the dynamism<br />
of private assets. Laws, regulations and institutions as<br />
factors of restraint, opportunity and action, act as the levers<br />
that can optimize the social<br />
function of property and<br />
balance it out with private<br />
rights and assets. It must<br />
be stressed here that this<br />
social function is not about<br />
ownership rights or their<br />
transactional implications.<br />
Rather, it is essentially<br />
POLICy<br />
Shared urban<br />
prosperity<br />
is about enhancing the<br />
public realm, equitable<br />
sharing of public goods and<br />
consolidating rights to the<br />
commons for all.
State of the World’s Cities <strong>2012</strong>/<strong>2013</strong><br />
about user rights for<br />
As cities work enhanced human value.<br />
POLICy on the five<br />
The ‘Right to<br />
dimensions of prosperity,<br />
the Commons’ is an<br />
there also occurs a<br />
progressive expansion in<br />
ancient concept in legal<br />
the size of the commons. jurisprudence originating<br />
More amenities are brought in feudal England, where<br />
into collective use and more it referred to the extension<br />
access is provided, enabling of user rights for all on<br />
larger numbers of urban<br />
a manor’s grazing land.<br />
residents to use and enjoy<br />
shared spaces, services and<br />
Lately, the notion has<br />
facilities.<br />
resurfaced in urban settings<br />
(including public goods,<br />
societal institutional<br />
arrangements, public<br />
culture, and heritage sites),<br />
The capacity for<br />
FACT a city to maintain where it is perceived as an<br />
extensive and quality<br />
effective way of countering<br />
shared spaces and facilities not just rampant enclosures<br />
provides a good indication and appropriations, but<br />
of its degree of prosperity.<br />
also the rise of duality<br />
under the form of inequity<br />
and segregation.<br />
In this respect, cities such as Helsinki, Toronto and<br />
Barcelona, which achieve high rankings on the UN-<br />
Habitat City <strong>Prosperity</strong> Index (CPI), feature more<br />
extensive public realms than Monrovia, Nairobi or Dakar,<br />
or similar cities with low CPI readings.<br />
Legal and regulatory instruments exert a major<br />
bearing on the origination and preservation of the<br />
commons, and also in ensuring indiscriminate access.<br />
Statutes, ordinances and regulations are the bases for the<br />
guidelines and standards regulating spatial layouts and<br />
construction designs. The same applies to institutional<br />
relationships, functional<br />
allocations and authority<br />
designation, besides<br />
In this era of<br />
resource distribution. The<br />
FACT enclosures,<br />
privatization and even<br />
legal framework in turn<br />
invasion of the traditional enables civic organisations<br />
urban commons (including and community activities.<br />
beaches, river banks,<br />
Equally significant is the<br />
forests, school yards and<br />
overall manner in which<br />
even pavements), the size<br />
legal-regulatory and<br />
and quality of a city’s overall<br />
public space acts as a<br />
institutional frameworks<br />
good indicator of shared delineate the public and<br />
prosperity.<br />
private spheres and guide<br />
the interaction between<br />
118<br />
and within them in the everyday workings of the city.<br />
One component of the commons that lately has<br />
attracted a lot of attention is the management of public<br />
spaces. 56 In Panama City, one of the local experts surveyed<br />
by UN-Habitat put it as follows: “The more degraded<br />
public space, the more degraded the citizen, because public<br />
space is not only about quality of life but also the expression<br />
of citizenship”. 57 Another local expert, in Santo Domingo,<br />
underscored the same point perhaps more incisively:<br />
“Citizens need to gain positive empowerment, to defend<br />
space enclaves where public life is still alive and where laws<br />
and norms for doing so are available.” 58<br />
REvISITING URBAN CODES FOR SHARED<br />
PROSPERITy<br />
Rules and regulations constitute a key instrument in urban<br />
management and development. That is why appropriate<br />
institutions are required to ensure implementation<br />
and enforcement as well as awareness building and<br />
mobilization. Rules and regulations have significant roles<br />
to play, as they generally steer and circumscribe planning<br />
and construction. One author has even gone so far as to<br />
ascribe the ‘shaping and misshaping of American cities’ to<br />
poor planning regulations. 59 Indeed, zoning regulations,<br />
building codes, utility standards, deed restrictions and<br />
the many other instruments that shape the urban built<br />
environment, will determine not only the pattern, use<br />
and form of spaces and structures, but will also strongly<br />
influence the quality of life in cities.<br />
The review of regulatory frameworks is of particular<br />
importance for those cities in the developing world that<br />
have long operated with<br />
externally derived standards<br />
and codes, who, must<br />
also tend to effective<br />
implementation and<br />
enforcement capacities.<br />
Revisiting the codes<br />
developed for formerly<br />
colonial or apartheid cities<br />
like Nairobi, Dar es Salaam<br />
or Johannesburg in a bid<br />
to achieve an inclusive<br />
urban form is a challenging<br />
endeavour. This calls not<br />
only major for institutional<br />
restructuring, but also a<br />
revision of zoning and<br />
POLICy Laws,<br />
rules and<br />
institutions must<br />
be kept alert, not<br />
inert, to current and<br />
evolving needs and<br />
risks if a city’s whole<br />
human potential is<br />
to be harnessed,<br />
not repressed –<br />
empowering the whole<br />
population with “basic<br />
capabilities” or “generic<br />
conditions of agency”<br />
at the service of<br />
today’s and tomorrow’s<br />
prosperity.
uilding codes to support urban reforms, not to mention<br />
squatter regulation and slum upgrading. On top of that,<br />
cities today must provide accommodative measures, allowing<br />
for progressive construction, smaller plot sizes and multiple<br />
variants of land tenure. Similarly, utility standards must be<br />
adjusted, and new development financing channels devised,<br />
in the face of inequity and exclusion.<br />
INSTITUTIONAL TRANSFORMATION<br />
Some of the real-life experiences outlined in this chapter<br />
suggest that when it comes to structuring the urban power<br />
functions that form the hub of the ‘prosperity wheel’, it<br />
is for every city to make its own choices. Indeed, many<br />
choices have already been made; but common to all is the<br />
adaptation and consolidation of key institutions which<br />
harness the energy and engagement of all stakeholders in<br />
a city. Major stakeholders, such as business, professionals,<br />
civic organisations, besides neighbourhood associations,<br />
must be provided with an institutional avenue for effective<br />
engagement with urban prosperity – how it is generated<br />
and how it is shared. Such engagement transcends the<br />
traditional participatory practices of forums and consultative<br />
Box 3.2.4<br />
Law, institutions and the public interest<br />
Urban space is shaped by laws, rules and institutions (or lack<br />
thereof) in response to the needs and requirements of varying<br />
numbers of stakeholders. In this sense, the prosperity of a city<br />
is also a legal and institutional construct, and the past has some<br />
lessons for early 21st century central and municipal governments.<br />
Major legal systems around the world have long recognised that<br />
far from being just an abstract norm, law and institutions have the<br />
capacity to shape up a variety of interests across ethnic, cultural<br />
and other divides. They do so within the spatial confines of their<br />
jurisdictions, and with a long-term view. 61<br />
This is the background against which the state has historically<br />
emerged as the apex body of an interdependent network of<br />
powerful repositories of different kinds of power – legal, religious,<br />
bureaucratic, economic, etc. 62 In this role, the state has gradually<br />
built a monopoly over universality. This went hand in hand with the<br />
constitution of bureaucratic functions independent of particular<br />
interests – family, religion, the economy – with agents that were<br />
mandated to embody the public interest. Along with this came the<br />
constitution of a new, “public” kind of resources that embodied<br />
universality, or at any rate a degree of universality that was superior<br />
to that of previously existing resources. This public realm gradually<br />
stood out against particular interests, and also against private<br />
appropriation of public functions through patronage or nepotism.<br />
Innovating to Support the Transition to the City of the 21st Century<br />
119<br />
FACT<br />
POLICy<br />
As some cities have found out, shared prosperity involves<br />
a serious review of regulatory frameworks.<br />
As some cities have come to realise, shared and<br />
integrated prosperity is a socio-political project,<br />
involving a commitment by all stakeholders and entailing a<br />
re-examination of laws, regulations, and the corresponding<br />
institutional framework.<br />
mechanisms; it turns socioeconomic conditions into levers<br />
of enhanced prosperity, with every household and business<br />
considered as an asset to be safeguarded, optimized and<br />
promoted – empowered – for the benefit of all<br />
An exemplary case of institutional innovation for shared<br />
prosperity is that of Medellín. During the past decade,<br />
the Colombian city’s prosperity has experienced major<br />
turnaround, as it endeavoured to overcome the combined<br />
challenges of poverty, inequality, exclusion and informality,<br />
besides rampant violence, through a whole new social<br />
As the state evolved into “the geometric focal point of all<br />
perspectives” and a principle of public order, it established a<br />
unified space – imposing spatial over social, genealogical or other<br />
types of proximity. In the process, public authority has gained<br />
more recognition from the various segments of society, which<br />
further consolidates both its privileged position and its efficiency.<br />
As a result, the notion of “public interest” can pave the way for<br />
consensus and mobilization; at any rate, it sheds light on reality<br />
and becomes a shared evaluation criterion.<br />
Historically, in China as in Europe, the city has served as the<br />
privileged locus of the emergence of the state and the public<br />
interest as we know them today. In 11th century Western<br />
Europe 63 , it fell to municipal authorities to control violence as<br />
well as economic and political relations. Although the poor were<br />
effectively left out of some functions, they were equal members<br />
of the assemblies in charge of endorsing municipal officials and<br />
laws (including those on economic activities). Moreover, purchase,<br />
sale and mortgaging of land and buildings were open to all. At the<br />
time, the protections and safeguards provided by cities also aimed<br />
at preserving their prosperity from heavy-handed monarchs or<br />
emperors.
State of the World’s Cities <strong>2012</strong>/<strong>2013</strong><br />
dispensation. Conditions<br />
have been put in place for<br />
civic mobilisation, bringing<br />
together politicians, the<br />
private sector, professionals<br />
and communities, with the<br />
aim of building a future<br />
that benefits everyone. The<br />
collective energy behind<br />
this compact reconstructs<br />
the foundations of<br />
shared prosperity in all<br />
socioeconomic spheres.<br />
Helsinki, a city that<br />
features prominently in the<br />
UN-Habitat City <strong>Prosperity</strong><br />
Index, has invested in<br />
human capital, promoted<br />
innovation and developed<br />
strong institutions, using a<br />
multi-prong approach to<br />
enhanced prosperity. 60<br />
POLICy<br />
Legal and institutional<br />
transformation for the<br />
sake of prosperity is not<br />
confined to the cities of the<br />
developed world. Despite<br />
the formidable challenges<br />
facing them, a number of<br />
Asian and African cities<br />
are taking significant steps, with some already achieving<br />
visibly higher degrees of prosperity. Cities such as Bangalore<br />
and Hyderabad, South Africa’s Gauteng urban region,<br />
Nairobi, Dakar and Dar es Salaam are all engaged in the<br />
pursuit of shared, sustainable prosperity through effective<br />
legal, regulatory and institutional frameworks. Bangalore<br />
clearly demonstrates the challenges of higher prosperity<br />
path against a developing country background; but the city<br />
benefits from strong institutional synergies, with investment<br />
Shared<br />
prosperity is<br />
not accidental, nor is it<br />
an automatic outcome of<br />
economic growth or market<br />
forces. It is a human,<br />
collective construct which<br />
requires vision, leadership<br />
and a coherent programme<br />
of action.<br />
In Helsinki, the<br />
FACT enabling potential<br />
of legal and regulatory<br />
instruments is used to build<br />
a dynamic institutional<br />
framework which enhances<br />
shared prosperity.<br />
Shared and<br />
POLICy integrated<br />
prosperity in cities is<br />
about the reclaiming of a<br />
sense of community and<br />
sustainability through urban<br />
power functions.<br />
Endnotes<br />
1 Oyelaran-Oyeyinka, B. and P.G. Sampath (2010) Latecomer Development: Innovation<br />
and Knowledge for Economic Growth, Routledge, London and New York.<br />
2 Kratke, S. (2011) The Creative Capital of Cities: Interactive Knowledge Creation and<br />
The Urbanization Economies of Innovation, Wiley-Blackwell ,Chichester<br />
3 Oyelaran-Oyeyinka, B. and P.G. Sampath (2010) op. cit.<br />
4 Kratke, S. (2011) op. cit.<br />
5 Landry, C. (2000) The Creative City, Earthscan, London.<br />
120<br />
by national, state and local government, including Greater<br />
Bangalore authority. The private-public partnership model<br />
seems to be the driving factor behind the city’s enhanced<br />
prosperity, together with a well-adapted regulatory<br />
framework for Information Technology Parks, an attractive<br />
environment for highly skilled labour, and facilitating the<br />
establishment of training and research institutions.<br />
A pedestrian footbridge at night in the modern city of<br />
Shenzhen, China.<br />
© Fuyu Liu/Shutterstock.com<br />
6 Landry, C. (2000) The Creative City, Earthscan, London.<br />
7 Ibid.<br />
8 Landry, C. (2000) op. cit.<br />
9 ‘Urbanization economies’ refer to the advantages gained from a specific urban<br />
location: proximity to markets, available labour force, communications, and auxiliary<br />
business services.
10 Government of Singapore (2010) Singapore Budget 2010 - Towards an Advanced<br />
Economy: Superior Skills, Quality Jobs, Higher Incomes, http://www.mof.gov.sg/<br />
budget_2010/speech_toc/pd.html.<br />
11 Centre for Livable Cities (2011) City Report on Singapore, Unpublished UN-Habitat<br />
background study for “State of the World’s Cities Report <strong>2012</strong>/<strong>2013</strong>”<br />
12 Belliapa, S.G. (2011) City Report on Bangalore, Unpublished UN-Habitat background<br />
study for “State of the World’s Cities Report <strong>2012</strong>/<strong>2013</strong>”<br />
13 Vejella, S. (2011) City Report on Hyderabad, Unpublished UN-Habitat background<br />
study for “State of the World’s Cities Report <strong>2012</strong>/<strong>2013</strong>”<br />
14 Jin, L. and Y. Liu (2011) City Report on Shenzhen, Unpublished UN-Habitat<br />
background study for “State of the World’s Cities Report <strong>2012</strong>/<strong>2013</strong>”<br />
15 The city’s GDP rose from 136.024 billion Yuan in 1997 to 789.424 billion Yuan<br />
in 2010. Even during the serious financial crisis of 2008 and 2009, Chongqing<br />
maintained a high growth rate of GDP of 14% [ Liu, Y. and Y. Wang (2011) City Report<br />
on Chongqing, Unpublished UN-Habitat background study for “State of the World’s<br />
Cities Report <strong>2012</strong>/<strong>2013</strong>”]<br />
16 Kurtul,P. F. (2011) City Report on Gaziantep, Unpublished UN-Habitat background<br />
study for “State of the World’s Cities Report <strong>2012</strong>/<strong>2013</strong>”<br />
17 World Bank (<strong>2012</strong>) World Bank Data:World Development Indicators & Global<br />
Development Finance, Online database last updated July 9 <strong>2012</strong>, http://data.<br />
worldbank.org<br />
18 SET-DEV (2011) Technological Responsibility:Guidelines for a shared governance<br />
of the processes of socialisation of scientific research and innovation, within an<br />
interconnected world, http://www.set-dev.eu/images/pdf/setdev-pg2110728?e6227e<br />
3a1ee01ab67932453dd186b586=fe92758461b428418da8873e8a9fc566<br />
19 Ibid.<br />
20 Jin, L. and Y. Liu (2011) op. cit.<br />
21 In ten years of reform and development, the total assets of state-owned enterprises<br />
increased from 160 billion Yuan to one trillion Yuan, nearly seven-fold increase [Liu, Y.<br />
and Y. Wang (2011) op. cit.]<br />
22 UN-Habitat (2010) State of the World’s Cities 2010/2011 : Cities for All: Bridging the<br />
Urban Divide, Earthscan, London<br />
23 UN-Habitat (2010) ‘Scaling New Heights: New Ideas in Urban Planning’, Urban World,<br />
Vol. 1, Issue, 4, October. Nairobi.<br />
24 James, P.A., K. Deiglmeier and D. T. Miller (2008) ‘Rediscovering Social Innovations’,<br />
Stanford Social Innovation Review, http://www.ssireview.org/articles/entry/<br />
rediscovering_social_innovation/<br />
25 Castells, M. (1996) The Information Age: Economy, Society and Culture – Volume 1 –<br />
The Rise of the Network Society, Blackwell, Oxford<br />
26 James, P.A., K. Deiglmeier and D. T. Miller (2008) op. cit.<br />
27 Soja, E. W. (2010), Seeking Spatial Justice, University of Minnesota Press,<br />
Minneapolis<br />
28 Cohen, M.(<strong>2012</strong>), Reinventing the Future: Designing Urban 3.0, unpublished proposal<br />
for UN-Habitat Habitat 3 Summit.<br />
29 Clos, J. (<strong>2012</strong>) Urbanization Challenges of the 21st Century, Unpublished document,<br />
UN-Habitat, Nairobi<br />
30 Belliapa, S.G. (2011) City Report on Bangalore. Unpublished UN-Habitat background<br />
study for “State of the World’s Cities Report <strong>2012</strong>/<strong>2013</strong>”<br />
31 Flyvbjerg, B. (1996) ‘The Dark Side of Planning: Rationality and Realrationalität,’ in<br />
Seymour, M., Mazza ,L., and R. Burchell (eds.), Explorations in Planning Theory ,<br />
Center for Urban Policy Research Press, New Brunswick, NJ. pp. 383-394.<br />
32 Viana, I. (2011) City Report on Montevideo, Unpublished UN-Habitat background<br />
study for “State of the World’s Cities Report <strong>2012</strong>/<strong>2013</strong>”<br />
33 López, E. M. (2011), New Urban Planning: Going Back to Basics, Unpublished<br />
document, UN-Habitat, Nairobi<br />
34 Kothari, M. and S. Chaudhry (2009), Taking the right to the city forward: Obstacles<br />
and promise, background paper for ‘State of the World Cities Report 2010/11’<br />
35 Briney, A. (2009) New Urbanism is Taking Planning to a New Level, http://geography.<br />
about.com/od/urbaneconomicgeography/a/newurbanism.htm<br />
36 Clos, J. (<strong>2012</strong>) op.cit. This ‘global standardization process’ is also referred by<br />
professionals like David Mangin (Mangin, D. (2004) La Ville franchisée: Formes et<br />
structures de la ville contemporaine, Editions de la Villette, Paris<br />
Innovating to Support the Transition to the City of the 21st Century<br />
121<br />
37 Buhigas, M. (<strong>2012</strong>), Efficient Urban Planning and Management, background paper for<br />
‘State of the World Cities Report <strong>2012</strong>/13’<br />
38 Castellanos, G. (2011) City Report on Santo Domingo. Unpublished UN-Habitat<br />
background study for “State of the World’s Cities Report <strong>2012</strong>/<strong>2013</strong>”<br />
39 A highest percentage of respondents in all regions found that planning and<br />
management is the most important factor, while the majority of respondents in LAC<br />
opined that decentralization of policies and appropriate laws and regulation plays a<br />
more important role.<br />
40 ONU-HÁBITAT (<strong>2012</strong>) El estado de las ciudades de América Latina y el Caribe <strong>2012</strong>,<br />
ONU-HÁBITAT ,Rio de Janeiro (to be published)<br />
41 Earth Right Institute (2011), Land Rights and Land Value Capture, http://www.<br />
earthrights.net/docs/long_form_brochure_lrlvc.html; UN-Habitat (2008), Municipal<br />
financing and urban development, UN-Habitat , Nairobi<br />
42 Mendoza, I. R. (2011) City Report on Panama City, Unpublished UN-Habitat<br />
background study for “State of the World’s Cities Report <strong>2012</strong>/<strong>2013</strong>”<br />
43 The notion of fixed social capital, which encompasses all assets of society that are<br />
not mobile (or soft) but are solid and owned by the public is equivalent to the ‘public<br />
goods’ mentioned in this chapter.<br />
44 UNIDO (2008) Public Goods for Economic Development, UNIDO, Vienna, http://www.<br />
unido.org/fileadmin/user_media/Publications/documents/Public%20goods%20<br />
for%20economic%20development_sale.pdf<br />
45 The CLEAR Network (2006), Urban Planning and Smart Growth, http://www.clear.<br />
london.ca/Urban_Planning.html<br />
46 Kimmelman, M. (<strong>2012</strong>), ‘A City Rises, Along With Its Hopes’, New York Times, May 18,<br />
http://www.nytimes.com/<strong>2012</strong>/05/20/arts/design/fighting-crime-with-architecturein-medellin-colombia.html?_r=1&pagewanted=all.<br />
47 Sen, A. K., (1999) ‘Democracy as a universal Value’, Journal of Democracy , vol 10<br />
(3), Washington, DC, pp. 3-17<br />
48 ‘Cities have always been exposed to brutal economic pressures from overseas;<br />
the nation state has always, to a greater or smaller extent, tried to cushion these<br />
pressures.’ [Pierre, J. (2011) The Politics of Urban Governance Palgrave Macmillan,<br />
Basingstoke]<br />
49 Menski, W. (2006) Comparative Law in a Global Context: The Legal Systems of Asia<br />
and Africa, Cambridge University Press, Cambridge<br />
50 ‘It could well be argued that the growing significance of non-elected actors in<br />
urban politics in many countries only increases the need for political control and<br />
accountability.’ [Pierre, J. (2011) op.cit.]<br />
51 Pierre, J. (2011) op.cit.<br />
52 Fernandes, E. and M.M.M. Copello (2009) ‘Law and Land Policy in Latin America:<br />
Shifting Paradigms and Possibilities for Action’, Land Lines, Lincoln Institute of Land<br />
Policy, Cambridge, MA<br />
53 Fernandes, E. (2007a)’ Implementing the urban reform agenda in Brazil’, Environment<br />
& Urbanization Vol 19(1), pp. 177–189<br />
54 Fernandes, E. (2007b) “Constructing the `Right to the City’ in Brazil”, Social & Legal<br />
Studies, Vol. 16(2), pp. 201-219;<br />
55 UN-Habitat database (<strong>2012</strong>).<br />
56 See, for instance, Gehl, J. (2010) Cities for People, Island Press, Washington DC.<br />
57 Mendoza, I. R. (2011) City Report on Panama City, Unpublished UN-Habitat<br />
background study for “State of the World’s Cities Report <strong>2012</strong>/<strong>2013</strong>”<br />
58 Castellanos, G. (2011) City Report on Santo Domingo, Unpublished UN-Habitat<br />
background study for “State of the World’s Cities Report <strong>2012</strong>/<strong>2013</strong>”<br />
59 Talen, E. (<strong>2012</strong>) City Rules: How Regulations Affect Urban Form, Island Press,<br />
Washington DC.<br />
60 Karvinen, M. (2005) Innovation and creativity strategies in Helsinki Metropolitan Area<br />
– reinvention of regional governance, proceedings of the 41st ISoCaRP Congress<br />
2005, Bilbao, Spain<br />
61 Berman, Harold. J. (1983) Law and Revolution: The formation of the Western Legal<br />
Tradition, vol. 1, Cambridge, MA: Harvard University Press; Menski (2006) op.cit.<br />
62 Bourdieu, P. (<strong>2012</strong>) Sur l’Etat – Cours au Collège de France 1989-1992, Raisons<br />
d’Agir/Seuil, Paris<br />
63 Berman (1983) op. cit.; Sassen, S. (2006) Territory, Authority, Rights: From Medieval<br />
to Global Assemblages, Princeton University Press, Princeton
Statistical<br />
Annex<br />
Table 1: City <strong>Prosperity</strong> Index and components<br />
Table 1<br />
City <strong>Prosperity</strong> Index and components<br />
Country City<br />
City<br />
<strong>Prosperity</strong><br />
Index (CPI)<br />
with 5<br />
Dimensions<br />
GENERAL DISCLAIMER<br />
The designations employed and presentation of the data in the Statistical Annex do not imply<br />
the expression of any opinion whatsoever on the part of the Secretariat of the United Nations<br />
concerning the legal status of any country, city or area of its authorities, or concerning the<br />
delimitation of its frontiers or boundaries.<br />
Table 2: Proportion of urban population living in slums and urban slum population, by country 1990-2009<br />
Table 3: Urban population, proportion of urban population living in slum area and urban slum population, by region,<br />
1990-<strong>2012</strong><br />
Table 4: City population and city population growth rate of urban agglomerations with 750,000 Inhabitants or More in 2009,<br />
by Country, 1950-2025 (thousands)<br />
Table 5: Urban Population and Urbanization by Country, 1990-2030<br />
City<br />
<strong>Prosperity</strong><br />
Index (CPI)<br />
with 4<br />
Dimensions*<br />
122<br />
Productivity<br />
Index<br />
Quality of<br />
life Index<br />
Infrastructure<br />
Index<br />
Enivronment<br />
Index<br />
Austria Vienna 0.925 0.936 0.939 0.882 0.996 0.932 0.883<br />
United States New York 0.825 0.934 0.940 0.866 0.994 0.941 0.502<br />
Canada Toronto 0.890 0.934 0.874 0.907 0.997 0.963 0.733<br />
United Kingdom London 0.904 0.934 0.923 0.898 0.997 0.920 0.793<br />
Sweden Stockholm 0.898 0.934 0.896 0.925 0.995 0.921 0.767<br />
Finland Helsinki 0.924 0.933 0.890 0.905 0.997 0.944 0.890<br />
Ireland Dublin 0.913 0.929 0.901 0.867 0.996 0.958 0.850<br />
Norway Oslo 0.924 0.929 0.870 0.914 0.997 0.939 0.903<br />
France Paris 0.897 0.927 0.895 0.925 0.996 0.895 0.788<br />
Japan Tokyo 0.905 0.925 0.850 0.931 0.989 0.936 0.828<br />
Australia Melbourne 0.903 0.925 0.867 0.875 0.996 0.967 0.820<br />
New Zealand Auckland 0.862 0.922 0.854 0.889 0.994 0.958 0.657<br />
Netherlands Amsterdam 0.895 0.915 0.866 0.872 0.995 0.933 0.818<br />
Switzerland Zurich 0.884 0.914 0.868 0.858 0.997 0.941 0.772<br />
Denmark Copenhagen 0.913 0.911 0.855 0.871 0.997 0.928 0.922<br />
Belgium Brussels 0.883 0.910 0.862 0.864 0.997 0.922 0.783<br />
Spain Barcelona 0.876 0.909 0.829 0.912 0.995 0.908 0.755<br />
Italy Milan 0.870 0.908 0.868 0.895 0.997 0.876 0.733<br />
Poland Warsaw 0.883 0.901 0.846 0.864 0.990 0.911 0.817<br />
Portugal Lisbon 0.853 0.899 0.827 0.867 0.995 0.916 0.692<br />
Hungary Budapest 0.881 0.894 0.808 0.867 0.990 0.921 0.833<br />
Greece Athens 0.862 0.889 0.800 0.885 0.996 0.884 0.762<br />
Czech Republic Prague 0.871 0.882 0.855 0.771 0.992 0.926 0.827<br />
Republic of Korea Seoul 0.861 0.876 0.801 0.903 0.989 0.822 0.807<br />
Russia Moscow 0.793 0.870 0.806 0.813 0.960 0.908 0.550<br />
Brazil São Paulo 0.757 0.836 0.742 0.803 0.918 0.894 0.507<br />
Equity<br />
Index
Table 1<br />
City <strong>Prosperity</strong> Index and components<br />
Country City<br />
City<br />
<strong>Prosperity</strong><br />
Index (CPI)<br />
with 5<br />
Dimensions<br />
City<br />
<strong>Prosperity</strong><br />
Index (CPI)<br />
with 4<br />
Dimensions*<br />
123<br />
Productivity<br />
Index<br />
Quality of<br />
life Index<br />
Infrastructure<br />
Index<br />
Enivronment<br />
Index<br />
Statistical Annex<br />
Kazakhstan Almaty 0.830 0.833 0.751 0.822 0.872 0.897 0.818<br />
China Shanghai 0.826 0.832 0.671 0.836 0.900 0.950 0.800<br />
Romania Bucharest 0.836 0.821 0.707 0.767 0.968 0.867 0.900<br />
Mexico Mexico City 0.709 0.816 0.743 0.764 0.900 0.866 0.405<br />
Turkey Ankara 0.780 0.806 0.699 0.802 0.842 0.891 0.683<br />
Jordan Amman 0.771 0.796 0.697 0.790 0.887 0.824 0.680<br />
Thailand Bangkok 0.733 0.794 0.719 0.747 0.871 0.850 0.533<br />
Ukraine Kyïv 0.798 0.781 0.579 0.757 0.968 0.874 0.873<br />
Viet Nam Hà Noi 0.756 0.776 0.712 0.761 0.912 0.733 0.683<br />
Armenia Yerevan 0.779 0.769 0.635 0.850 0.870 0.745 0.817<br />
China Beijing 0.799 0.762 0.667 0.836 0.911 0.663 0.967<br />
South Africa Cape Town 0.590 0.758 0.628 0.645 0.933 0.875 0.217<br />
Indonesia Jakarta 0.769 0.743 0.636 0.733 0.741 0.881 0.885<br />
South Africa Johannesburg 0.479 0.742 0.654 0.645 0.880 0.816 0.083<br />
Philippines Manila 0.723 0.737 0.676 0.647 0.775 0.868 0.669<br />
Egypt Cairo 0.722 0.730 0.679 0.743 0.916 0.616 0.692<br />
Morocco Casablanca 0.647 0.700 0.634 0.513 0.827 0.891 0.472<br />
Honduras Tegucigalapa 0.652 0.694 0.541 0.729 0.709 0.829 0.510<br />
Moldova Chisinau 0.698 0.693 0.340 0.850 0.895 0.894 0.717<br />
India Mumbai 0.694 0.688 0.645 0.739 0.745 0.632 0.715<br />
Kenya Nairobi 0.593 0.673 0.481 0.559 0.860 0.889 0.357<br />
Cambodia Phnom Penh 0.677 0.666 0.544 0.613 0.728 0.809 0.722<br />
Mongolia Ulaanbaatar 0.675 0.664 0.493 0.777 0.632 0.804 0.722<br />
Guatemala Guatemala City 0.614 0.646 0.440 0.556 0.823 0.866 0.502<br />
Cameroon Yaoundé 0.618 0.623 0.492 0.555 0.666 0.827 0.600<br />
India New Delhi 0.635 0.617 0.596 0.690 0.786 0.448 0.712<br />
Côte d’Ivoire Abidjan 0.578 0.599 0.452 0.440 0.767 0.842 0.500<br />
Nepal Kathmundu 0.598 0.594 0.385 0.621 0.740 0.704 0.617<br />
Bangladesh Dhaka 0.633 0.593 0.545 0.539 0.673 0.627 0.817<br />
Uganda Kampala 0.581 0.590 0.512 0.486 0.507 0.956 0.550<br />
Nigeria Lagos 0.496 0.582 0.475 0.634 0.576 0.659 0.262<br />
Ghana Accra 0.560 0.576 0.347 0.592 0.737 0.728 0.500<br />
Bolivia La Paz 0.551 0.565 0.363 0.621 0.745 0.606 0.502<br />
Ethiopia Addis Ababa 0.501 0.564 0.503 0.534 0.521 0.724 0.313<br />
Senegal Dakar 0.581 0.552 0.510 0.384 0.794 0.596 0.712<br />
Zimbabwe Harare 0.493 0.542 0.246 0.451 0.899 0.864 0.338<br />
United Republic of Tanzania Dar es Salaam 0.571 0.530 0.427 0.371 0.607 0.822 0.767<br />
Zambia Lusaka 0.434 0.507 0.316 0.463 0.590 0.766 0.233<br />
Niger Niamey 0.482 0.456 0.402 0.426 0.485 0.521 0.602<br />
Mali Bamako 0.491 0.452 0.401 0.416 0.544 0.460 0.683<br />
Madagascar Antananarivo 0.465 0.446 0.171 0.558 0.511 0.812 0.552<br />
Guinea Conakry 0.449 0.416 0.133 0.461 0.607 0.809 0.612<br />
Liberia Monrovia 0.313 0.285 0.048 0.381 0.411 0.886 0.457<br />
* The CPI with 4 dimensions does not include the equity index<br />
Source: United Nations Human Settlements Programme (UN-Habitat), Global Urban Indicators Database <strong>2012</strong>.<br />
Equity<br />
Index
State of the World’s Cities <strong>2012</strong>/<strong>2013</strong><br />
Table 2<br />
Proportion of urban population living in slums and urban slum population, by country 1990-2009<br />
Major area, region,<br />
country or area<br />
Proprotion of urban population living in slum area a<br />
124<br />
Urban Slum Population at Mid-year by Major Area,<br />
Region and Country (thousands)<br />
1990 1995 2000 2005 2007 2009 1990 1995 2000 2005 2007 2009<br />
AfricA<br />
Angola 86.5 76.2 65.8 7,756 7,466 7,019<br />
Benin 79.3 76.8 74.3 71.8 70.8 69.8 1,311 1,616 1,897 2,260 2,423 2,595<br />
Burkina Faso 78.8 72.4 65.9 59.5 59.5 960 1,109 1,374 1,762 2,029<br />
Burundi 64.3 64.3 452 508<br />
Cameroon 50.8 49.6 48.4 47.4 46.6 46.1 2,532 3,160 3,826 4,585 4,870 5,188<br />
Central African Republic 87.5 89.7 91.9 94.1 95.0 95.9 943 1,113 1,296 1,470 1,551 1,642<br />
Chad 98.9 96.4 93.9 91.3 90.3 89.3 1,257 1,507 1,844 2,312 2,509 2,714<br />
Comoros 65.4 65.4 65.4 68.9 68.9 80 91 101 119 124<br />
Congo 53.4 51.7 49.9 1,098 1,119 1,134<br />
Côte d’Ivoire 53.4 54.3 55.3 56.2 56.6 57.0 2,674 3,366 4,158 5,066 5,496 5,979<br />
Democratic Republic of the Congo 76.4 69.1 61.7 14,491 14,375 14,079<br />
Egypt 50.2 39.2 28.1 17.1 17.1 17.1 12,607 10,704 8,447 5,677 5,903 6,143<br />
Equatorial Guinea 66.3 157<br />
Ethiopia 95.5 95.5 88.6 81.8 79.1 76.4 5,819 7,562 8,653 9,729 10,067 10,427<br />
Gabon 38.7 443<br />
Gambia 45.4 34.8 373 313<br />
Ghana 65.5 58.8 52.1 45.4 42.8 40.1 3,571 4,070 4,473 4,755 4,817 4,848<br />
Guinea 80.4 68.8 57.3 45.7 45.7 1,385 1,517 1,490 1,390 1,489<br />
Guinea-Bissau 83.1 362<br />
Kenya 54.9 54.8 54.8 54.8 54.8 54.7 2,343 2,859 3,400 4,069 4,396 4,762<br />
Lesotho 35.1 44.4 53.7 163 223 290<br />
Liberia 68.3 1,282<br />
Madagascar 93.0 88.6 84.1 80.6 78.0 76.2 2,470 2,997 3,486 4,046 4,225 4,460<br />
Malawi 66.4 66.4 66.4 66.4 67.7 68.9 725 893 1,192 1,572 1,786 2,027<br />
Mali 94.2 84.8 75.4 65.9 65.9 65.9 1,902 2,066 2,247 2,496 2,743 3,009<br />
Morocco 37.4 35.2 24.2 13.1 13.1 13.1 4,490 4,904 3,713 2,205 2,308 2,416<br />
Mozambique 75.6 76.9 78.2 79.5 80.0 80.5 2,161 3,216 4,381 5,714 6,311 6,940<br />
Namibia 34.4 34.1 33.9 33.9 33.6 33.5 135 165 200 239 254 272<br />
Niger 83.6 83.1 82.6 82.1 81.9 81.7 1,016 1,219 1,475 1,787 1,944 2,121<br />
Nigeria 77.3 73.5 69.6 65.8 64.2 62.7 26,549 31,538 36,951 42,783 45,195 47,612<br />
Rwanda 96.0 87.9 79.7 71.6 68.3 65.1 372 397 874 1,129 1,165 1,208<br />
Senegal 70.6 59.8 48.9 43.3 41.1 38.8 2,071 2,051 1,955 2,010 2,030 2,048<br />
Sierra Leone 97.0 1,824<br />
Somalia 73.5 73.6 73.6 2,161 2,316 2,486<br />
South Africa 46.2 39.7 33.2 28.7 23.0 23.0 8,834 8,950 8,475 8,179 6,814 7,055<br />
Togo 62.1 1,486<br />
Uganda 75.0 75.0 75.0 66.7 63.4 60.1 1,473 1,833 2,214 2,403 2,487 2,578<br />
United Republic of Tanzania 77.4 73.7 70.1 66.4 65.0 63.5 3,719 4,539 5,335 6,271 6,713 7,200<br />
Zambia 57.0 57.1 57.2 57.2 57.3 57.3 1,778 1,930 2,083 2,350 2,483 2,633<br />
Zimbabwe<br />
ASIA<br />
4.0 3.7 3.3 17.9 21.0 24.1 121 138 140 801 963 1,141<br />
China 43.6 40.5 37.3 32.9 31.0 29.1 13,1670 151,437 169,102 183,544 182,934 180,560<br />
Mongolia 68.5 66.7 64.9 57.9 57.9 866 860 882 878 915<br />
Bangladesh 87.3 84.7 77.8 70.8 66.2 61.6 19,999 23,535 25,819 27,831 27,770 27,542
Table 2<br />
Proportion of urban population living in slums and urban slum population, by country 1990-2009<br />
Major area, region,<br />
country or area<br />
Proprotion of urban population living in slum area a<br />
125<br />
Statistical Annex<br />
Urban Slum Population at Mid-year by Major Area,<br />
Region and Country (thousands)<br />
1990 1995 2000 2005 2007 2009 1990 1995 2000 2005 2007 2009<br />
India 54.9 48.2 41.5 34.8 32.1 29.4 121,022 122,231 119,698 112,913 109,102 104,679<br />
Nepal 70.6 67.3 64.0 60.7 59.4 58.1 1,194 1,585 2,100 2,630 2,850 3,075<br />
Pakistan 51.0 49.8 48.7 47.5 47.0 46.6 18,054 20,688 23,890 27,158 28,529 29,965<br />
Cambodia 78.9 2,052<br />
Indonesia 50.8 42.6 34.4 26.3 23.0 23.0 27,559 29,017 29,691 24,777 22,456 23,255<br />
Lao People’s Democratic Republic 79.3 1,277<br />
Myanmar 45.6 6,701<br />
Philippines 54.3 50.8 47.2 43.7 42.3 40.9 16,479 17,158 17,613 17,972 18,134 18,302<br />
Thailand 26.0 26.5 27.0 5,539 5,841 6,146<br />
Viet Nam 60.5 54.6 48.8 41.3 38.3 35.2 8,118 8,852 9,395 9,491 9,396 9,224<br />
Iraq 16.9 16.9 16.9 52.8 52.8 52.8 2,131 2,439 2,828 9,974 10,361 10,759<br />
Jordan 15.8 17.7 19.6 689 824 971<br />
Lebanon 53.1 1,877<br />
Saudi Arabia 18.0 3,442<br />
Syrian Arab Republic 10.5 22.5 1,080 2,516<br />
Turkey 23.4 20.7 17.9 15.5 14.1 13.0 7,773 7,859 7,714 7,422 7,022 6,728<br />
Yemen 67.2 76.8 4,088 5,140<br />
LATIn AmERICA AnD <strong>THE</strong> CARIBBEAn<br />
Argentina 30.5 31.7 32.9 26.2 23.5 20.8 8,622 9,772 10,953 9,274 8,521 7,737<br />
Belize 18.7 28<br />
Bolivia 62.2 58.2 54.3 50.4 48.8 47.3 2,305 2,590 2,794 2,972 3,030 3,080<br />
Brazil 36.7 34.1 31.5 29.0 28.0 26.9 40,527 42,789 44,604 45,428 45,309 44,947<br />
Chile 9.0 1,285<br />
Colombia 31.2 26.8 22.3 17.9 16.1 14.3 7,077 6,884 6,404 5,670 5,306 4,899<br />
Costa Rica 10.9 291<br />
Dominican Republic 27.9 24.4 21.0 17.6 16.2 14.8 1,135 1,143 1,145 1,100 1,067 1,024<br />
Ecuador 21.5 1,786<br />
El Salvador 28.9 1,079<br />
French Guiana 10.5 16<br />
Grenada 6.0 2<br />
Guadeloupe 5.4 24<br />
Guatemala 58.6 53.3 48.1 42.9 40.8 38.7 2,146 2,301 2,438 2,572 2,619 2,660<br />
Guyana 33.7 33.5 33.2 73 73 72<br />
Haiti 93.4 93.4 93.4 70.1 70.1 70.1 1,893 2,393 2,876 2,908 3,230 3,557<br />
Honduras 34.9 1,170<br />
Jamaica 60.5 840<br />
Mexico 23.1 21.5 19.9 14.4 14.4 13,760 14,457 14,800 11,574 11,906<br />
Nicaragua 89.1 74.5 60.0 45.5 45.5 1,929 1,860 1,676 1,388 1,437<br />
Panama 23.0 526<br />
Paraguay 17.6 608<br />
Peru 66.4 56.3 46.2 36.1 36.1 9,964 9,566 8,776 7,540 7,801<br />
Saint Lucia 11.9 5<br />
Suriname 3.9 13<br />
Trinidad and Tobago 24.7 40<br />
Venezuela (Bolivarian Republic of) 32.0 7,861<br />
Notes: (a) Computed from country household data using the four components of slum (improved water, improwed sanitation, durable housing and sufficient living area.<br />
Source: United Nations Human Settlements Programme (UN-Habitat), Global Urban Indicators Database <strong>2012</strong>.
State of the World’s Cities <strong>2012</strong>/<strong>2013</strong><br />
Table 3<br />
Urban population, proportion of urban population living in slum area and urban slum population, by region, 1990-<strong>2012</strong><br />
Urban Population at Mid-year by Major Area, Region (thousands) a<br />
Major region or area 1990 1995 2000 2005 2007 2010 <strong>2012</strong><br />
Developing Regions 1,406,473 1,658,909 1,930,248 2,228,145 2,341,589 2,514,583 2,634,197<br />
Northern Africa 58,552 66,491 73,996 82,209 85,843 91,590 95,602<br />
Sub-Saharan Africa 146,640 181,532 220,535 266,848 287,548 321,300 345,564<br />
Latin America and the Caribbean 311,042 352,267 393,420 432,646 447,430 468,757 482,496<br />
Eastern Asia 352,808 429,924 512,043 619,535 652,715 699,813 731,647<br />
Southern Asia 317,857 369,356 424,294 481,719 506,248 545,479 573,698<br />
South-eastern Asia 138,996 165,445 197,360 220,814 230,851 246,701 257,677<br />
Western Asia 79,005 92,146 106,691 122,294 128,796 138,654 145,126<br />
Oceania 1,572 1,748 1,908 2,080 2,158 2,289 2,387<br />
Proportion of urban population (per cent)<br />
Major region or area 1990 1995 2000 2005 2007 2010 <strong>2012</strong><br />
Developing Regions 34.5 37.2 39.9 42.7 43.7 45.0 45.9<br />
Northern Africa 48.5 50.0 51.2 52.4 53.0 54.0 54.6<br />
Sub-Saharan Africa 28.3 30.6 32.7 34.9 35.8 37.2 38.2<br />
Latin America and the Caribbean 70.3 73.0 75.5 77.7 78.5 79.6 80.3<br />
Eastern Asia 29.1 33.4 38.0 44.5 46.3 48.7 50.3<br />
Southern Asia 26.5 27.7 29.0 30.2 30.8 31.7 32.4<br />
South-eastern Asia 31.6 34.5 38.2 39.9 40.6 41.8 42.7<br />
Western Asia 60.5 62.1 63.7 65.2 65.7 66.6 67.1<br />
Oceania c 24.4 24.1 23.5 23.0 22.9 22.8 22.9<br />
Notes: (a) United Nations Department of Economic and Social Affairs Population Division - World Urbanization Prospects: The 2009 Revision<br />
(b) Population living in household that lack either improved water, improved sanitation, sufficient living area (more than three persons per room), or durable housing<br />
(c) Trends data are not available for Oceania. A constant figure does not mean there is no change<br />
Source: United Nations Human Settlements Programme (UN-Habitat), Global Urban Indicators Database <strong>2012</strong>.<br />
126
Urban Slum Population at Mid-year by Region (thousands) b<br />
127<br />
Statistical Annex<br />
Major region or area 1990 1995 2000 2005 2007 2010 <strong>2012</strong><br />
Developing Regions 650,444 711,832 759,915 793,723 803,280 819,969 862,569<br />
Northern Africa 20,126 18,798 15,054 10,984 11,463 12,226 12,762<br />
Sub-Saharan Africa 102,641 122,635 143,255 168,005 179,538 198,168 213,134<br />
Latin America and the Caribbean 104,794 110,871 114,993 110,129 110,412 110,194 113,424<br />
Eastern Asia 154,175 174,363 191,563 204,253 202,809 197,529 206,515<br />
Southern Asia 181,667 190,758 194,364 192,842 192,325 190,647 200,510<br />
South-eastern Asia 68,852 74,049 78,246 75,443 73,744 76,540 79,945<br />
Western Asia 17,810 19,936 21,980 31,565 32,470 34,112 35,704<br />
Oceania 379 421 460 501 520 552 575<br />
Proportion of urban population living in slum (per cent)<br />
Major region or area 1990 1995 2000 2005 2007 2010 <strong>2012</strong><br />
Developing Regions 46.2 42.9 39.4 35.6 34.3 32.6 32.7<br />
Northern Africa 34.4 28.3 20.3 13.4 13.4 13.3 13.3<br />
Sub-Saharan Africa 70.0 67.6 65.0 63.0 62.4 61.7 61.7<br />
Latin America and the Caribbean 33.7 31.5 29.2 25.5 24.7 23.5 23.5<br />
Eastern Asia 43.7 40.6 37.4 33.0 31.1 28.2 28.2<br />
Southern Asia 57.2 51.6 45.8 40.0 38.0 35.0 35.0<br />
South-eastern Asia 49.5 44.8 39.6 34.2 31.9 31.0 31.0<br />
Western Asia 22.5 21.6 20.6 25.8 25.2 24.6 24.6<br />
Oceania c 24.1 24.1 24.1 24.1 24.1 24.1 24.1<br />
Notes: (a) United Nations Department of Economic and Social Affairs Population Division - World Urbanization Prospects: The 2009 Revision<br />
(b) Population living in household that lack either improved water, improved sanitation, sufficient living area (more than three persons per room), or durable housing<br />
(c) Trends data are not available for Oceania. A constant figure does not mean there is no change<br />
Source: United Nations Human Settlements Programme (UN-Habitat), Global Urban Indicators Database <strong>2012</strong>.
State of the World’s Cities <strong>2012</strong>/<strong>2013</strong><br />
Country/City<br />
AFgHAnISTAn<br />
City Population of<br />
Urban Agglomerations (’000)<br />
1990 1995 2000 2005 2010 2015 2020 2025<br />
128<br />
1990-<br />
1995<br />
1995-<br />
2000<br />
City Population Growth Rate of<br />
Urban Agglomerations (%)<br />
Kabul 1,282 1,616 1,963 2,994 3,731 4,616 5,665 6,888 4.63 3.90 8.44 4.41 4.26 4.09 3.91<br />
ALgERIA<br />
El Djazaïr (Algiers) 1,815 2,023 2,254 2,512 2,800 3,099 3,371 3,595 2.17 2.17 2.17 2.17 2.03 1.68 1.29<br />
Wahran (Oran) 647 675 705 736 770 827 902 970 0.86 0.86 0.86 0.90 1.43 1.73 1.47<br />
AngOLA<br />
Huambo 326 444 578 775 1,034 1,305 1,551 1,789 6.17 5.25 5.87 5.78 4.64 3.46 2.85<br />
Luanda 1,568 1,953 2,591 3,533 4,772 6,013 7,080 8,077 4.39 5.66 6.20 6.01 4.62 3.27 2.63<br />
ARgEnTInA<br />
Buenos Aires 10,513 11,154 11,847 12,551 13,074 13,401 13,606 13,708 1.18 1.21 1.15 0.82 0.49 0.30 0.15<br />
Córdoba 1,200 1,275 1,348 1,423 1,493 1,552 1,601 1,638 1.21 1.11 1.09 0.96 0.78 0.61 0.46<br />
Mendoza 759 802 838 876 917 956 990 1,016 1.11 0.88 0.88 0.91 0.84 0.68 0.53<br />
Rosario 1,084 1,121 1,152 1,186 1,231 1,280 1,322 1,354 0.68 0.55 0.58 0.75 0.78 0.64 0.48<br />
San Miguel de Tucumán 611 666 722 781 831 868 899 924 1.71 1.63 1.58 1.23 0.89 0.70 0.54<br />
ARmEnIA<br />
Yerevan 1,175 1,142 1,111 1,104 1,112 1,120 1,132 1,143 -0.55 -0.55 -0.14 0.14 0.15 0.22 0.18<br />
AUSTRALIA<br />
Adelaide 1,046 1,074 1,102 1,133 1,168 1,214 1,263 1,307 0.53 0.51 0.55 0.61 0.78 0.79 0.68<br />
Brisbane 1,329 1,471 1,603 1,780 1,970 2,096 2,178 2,245 2.04 1.71 2.10 2.03 1.24 0.76 0.61<br />
Melbourne 3,117 3,257 3,433 3,641 3,853 4,022 4,152 4,261 0.88 1.05 1.17 1.13 0.86 0.64 0.51<br />
Perth 1,160 1,273 1,373 1,484 1,599 1,687 1,753 1,810 1.87 1.51 1.56 1.49 1.07 0.77 0.64<br />
Sydney 3,632 3,839 4,078 4,260 4,429 4,592 4,733 4,852 1.11 1.21 0.87 0.78 0.72 0.61 0.50<br />
Wien (Vienna) 1,539 1,544 1,549 1,642 1,706 1,753 1,779 1,801 0.06 0.07 1.17 0.76 0.55 0.30 0.25<br />
AzERBAIjAn<br />
Baku 1,733 1,766 1,806 1,867 1,972 2,082 2,190 2,291 0.37 0.45 0.67 1.09 1.08 1.01 0.90<br />
BAngLADESH<br />
Chittagong 2,023 2,578 3,308 4,180 4,962 5,680 6,447 7,265 4.85 4.99 4.68 3.43 2.70 2.53 2.39<br />
Dhaka 6,621 8,332 10,285 12,555 14,648 16,623 18,721 20,936 4.60 4.21 3.99 3.08 2.53 2.38 2.24<br />
Khulna 985 1,133 1,285 1,464 1,682 1,933 2,211 2,511 2.79 2.53 2.60 2.79 2.78 2.69 2.54<br />
Rajshahi 521 606 678 764 878 1,013 1,164 1,328 3.02 2.27 2.39 2.77 2.86 2.78 2.63<br />
BELARUS<br />
Minsk 1,607 1,649 1,700 1,775 1,852 1,905 1,917 1,917 0.52 0.61 0.85 0.86 0.56 0.12 0.01<br />
BELgIUm<br />
Antwerpen 893 906 925 945 965 979 984 985 0.28 0.43 0.43 0.42 0.28 0.10 0.02<br />
Bruxelles-Brussel 1,680 1,715 1,776 1,840 1,904 1,941 1,948 1,948 0.41 0.70 0.70 0.69 0.39 0.07 0.00<br />
BEnIn<br />
Cotonou 504 577 642 720 844 1,016 1,217 1,445 2.73 2.13 2.28 3.19 3.69 3.62 3.44<br />
BOLIvIA<br />
Table 4<br />
City population and city population growth rate of urban agglomerations with 750,000 Inhabitants or More in 2009,<br />
by Country, 1950-2025 (thousands)<br />
La Paz 1,062 1,267 1,390 1,524 1,673 1,840 2,005 2,156 3.53 1.85 1.85 1.87 1.90 1.72 1.45<br />
Santa Cruz 616 833 1,054 1,325 1,649 1,916 2,103 2,261 6.04 4.69 4.59 4.37 3.01 1.86 1.45<br />
2000-<br />
2005<br />
2005-<br />
2010<br />
2010-<br />
2015<br />
2015-<br />
2020<br />
2020-<br />
2025
Country/City<br />
BRAzIL<br />
City Population of<br />
Urban Agglomerations (’000)<br />
1990 1995 2000 2005 2010 2015 2020 2025<br />
129<br />
1990-<br />
1995<br />
1995-<br />
2000<br />
City Population Growth Rate of<br />
Urban Agglomerations (%)<br />
2000-<br />
2005<br />
2005-<br />
2010<br />
2010-<br />
2015<br />
Statistical Annex<br />
Aracaju 453 527 606 691 782 849 883 902 2.99 2.83 2.60 2.49 1.63 0.79 0.42<br />
Baixada Santista 1,184 1,319 1,468 1,638 1,819 1,949 2,014 2,045 2.15 2.14 2.18 2.10 1.39 0.66 0.30<br />
Belém 1,129 1,393 1,748 1,963 2,191 2,351 2,427 2,460 4.20 4.54 2.32 2.19 1.41 0.64 0.27<br />
Belo Horizonte 3,548 4,093 4,659 5,237 5,852 6,260 6,420 6,463 2.86 2.59 2.34 2.22 1.35 0.50 0.13<br />
Brasília 1,863 2,257 2,746 3,292 3,905 4,296 4,433 4,474 3.84 3.92 3.62 3.42 1.91 0.63 0.19<br />
Campinas 1,693 1,975 2,264 2,533 2,818 3,018 3,109 3,146 3.08 2.74 2.24 2.14 1.37 0.60 0.24<br />
Cuiabá 510 606 686 728 772 813 843 861 3.43 2.49 1.18 1.16 1.04 0.72 0.42<br />
Curitiba 1,829 2,138 2,494 2,951 3,462 3,791 3,913 3,953 3.12 3.07 3.37 3.19 1.82 0.63 0.20<br />
Florianópolis 503 609 734 882 1,049 1,162 1,210 1,233 3.85 3.72 3.67 3.48 2.04 0.81 0.37<br />
Fortaleza 2,226 2,554 2,875 3,280 3,719 4,011 4,130 4,170 2.75 2.37 2.63 2.51 1.51 0.58 0.20<br />
Goiânia 1,132 1,366 1,635 1,880 2,146 2,327 2,405 2,439 3.75 3.60 2.80 2.65 1.62 0.66 0.27<br />
Grande São Luís 672 844 1,066 1,173 1,283 1,367 1,415 1,440 4.54 4.68 1.90 1.79 1.28 0.68 0.35<br />
Grande Vitória 1,052 1,221 1,398 1,613 1,848 2,008 2,078 2,109 2.97 2.72 2.85 2.72 1.66 0.69 0.30<br />
João Pessoa 652 741 827 918 1,015 1,089 1,129 1,151 2.54 2.21 2.09 2.01 1.39 0.73 0.38<br />
Londrina 491 554 613 709 814 889 925 944 2.39 2.04 2.89 2.78 1.75 0.80 0.41<br />
Maceió 660 798 952 1,068 1,192 1,282 1,329 1,353 3.77 3.55 2.30 2.19 1.46 0.72 0.36<br />
Manaus 955 1,159 1,392 1,577 1,775 1,913 1,979 2,009 3.87 3.68 2.49 2.36 1.50 0.67 0.30<br />
Natal 692 800 910 1,099 1,316 1,460 1,519 1,545 2.89 2.58 3.79 3.60 2.08 0.78 0.34<br />
Norte/Nordeste Catarinense 603 709 815 936 1,069 1,162 1,207 1,230 3.22 2.78 2.78 2.66 1.67 0.76 0.37<br />
Pôrto Alegre 2,934 3,236 3,505 3,791 4,092 4,316 4,428 4,469 1.96 1.59 1.57 1.53 1.07 0.51 0.18<br />
Recife 2,690 2,958 3,230 3,542 3,871 4,107 4,219 4,259 1.90 1.76 1.84 1.78 1.18 0.54 0.19<br />
Rio de Janeiro 9,595 10,174 10,803 11,368 11,950 12,404 12,617 12,650 1.17 1.20 1.02 1.00 0.75 0.34 0.05<br />
Salvador 2,331 2,644 2,968 3,422 3,918 4,243 4,370 4,411 2.53 2.31 2.84 2.71 1.60 0.59 0.19<br />
São Paulo 14,776 15,948 17,099 18,647 20,262 21,300 21,628 21,651 1.53 1.39 1.73 1.66 1.00 0.31 0.02<br />
Teresina 614 706 789 843 900 950 984 1,004 2.77 2.24 1.32 1.30 1.09 0.70 0.40<br />
BULgARIA<br />
Sofia 1,191 1,168 1,128 1,169 1,196 1,211 1,215 1,215 -0.38 -0.70 0.71 0.46 0.25 0.06 0.00<br />
BURkInA FASO<br />
Ouagadougou 537 667 921 1,328 1,908 2,643 3,457 4,332 4.32 6.45 7.32 7.25 6.52 5.37 4.51<br />
CAmBODIA<br />
Phnum Pénh (Phnom Penh) 615 836 1,160 1,354 1,562 1,803 2,093 2,427 6.14 6.55 3.10 2.87 2.86 2.99 2.96<br />
CAmEROOn<br />
Douala 931 1,155 1,432 1,767 2,125 2,478 2,815 3,131 4.30 4.30 4.20 3.69 3.07 2.55 2.13<br />
Yaoundé 754 948 1,192 1,489 1,801 2,103 2,392 2,664 4.59 4.59 4.45 3.80 3.11 2.57 2.15<br />
CAnADA<br />
Table 4<br />
City population and city population growth rate of urban agglomerations with 750,000 Inhabitants or More in 2009,<br />
by Country, 1950-2025 (thousands)<br />
Calgary 738 809 953 1,056 1,182 1,262 1,315 1,364 1.84 3.26 2.06 2.27 1.30 0.82 0.73<br />
Edmonton 831 859 924 1,017 1,113 1,178 1,227 1,274 0.67 1.47 1.92 1.80 1.14 0.81 0.74<br />
Montréal 3,154 3,305 3,471 3,603 3,783 3,925 4,048 4,165 0.94 0.98 0.74 0.98 0.74 0.62 0.57<br />
Ottawa-Gatineau 918 988 1,079 1,119 1,182 1,236 1,285 1,333 1.48 1.74 0.75 1.09 0.89 0.78 0.74<br />
Toronto 3,807 4,197 4,607 5,035 5,449 5,706 5,875 6,029 1.95 1.86 1.78 1.58 0.92 0.59 0.52<br />
Vancouver 1,559 1,789 1,959 2,093 2,220 2,318 2,400 2,479 2.75 1.81 1.33 1.18 0.86 0.70 0.65<br />
2015-<br />
2020<br />
2020-<br />
2025
State of the World’s Cities <strong>2012</strong>/<strong>2013</strong><br />
Country/City<br />
CHAD<br />
City Population of<br />
Urban Agglomerations (’000)<br />
1990 1995 2000 2005 2010 2015 2020 2025<br />
130<br />
1990-<br />
1995<br />
1995-<br />
2000<br />
City Population Growth Rate of<br />
Urban Agglomerations (%)<br />
N'Djaména 477 565 647 732 829 960 1,170 1,445 3.38 2.72 2.48 2.48 2.93 3.96 4.23<br />
CHILE<br />
Santiago 4,616 4,964 5,275 5,605 5,952 6,237 6,408 6,503 1.46 1.21 1.21 1.20 0.94 0.54 0.29<br />
Valparaíso 733 771 803 837 873 911 946 973 1.02 0.83 0.83 0.83 0.86 0.76 0.57<br />
CHInA<br />
Table 4<br />
City population and city population growth rate of urban agglomerations with 750,000 Inhabitants or More in 2009,<br />
by Country, 1950-2025 (thousands)<br />
Anshan, Liaoning 1,234 1,307 1,384 1,515 1,663 1,827 1,990 2,120 1.15 1.15 1.81 1.86 1.89 1.71 1.27<br />
Anyang 410 556 753 1,033 1,130 1,220 1,326 1,417 6.07 6.08 6.32 1.79 1.53 1.67 1.32<br />
Baoding 471 645 884 1,042 1,213 1,385 1,524 1,628 6.28 6.29 3.30 3.03 2.67 1.91 1.32<br />
Baotou 1,044 1,212 1,406 1,826 1,932 2,072 2,243 2,388 2.98 2.98 5.23 1.13 1.41 1.58 1.25<br />
Beijing 6,788 8,138 9,757 11,455 12,385 13,335 14,296 15,018 3.63 3.63 3.21 1.56 1.48 1.39 0.99<br />
Bengbu 447 554 687 794 914 1,037 1,142 1,222 4.29 4.29 2.91 2.80 2.53 1.91 1.36<br />
Benxi 759 807 857 911 969 1,044 1,136 1,215 1.22 1.22 1.22 1.22 1.50 1.68 1.35<br />
Changchun 2,192 2,446 2,730 3,143 3,597 4,046 4,409 4,673 2.19 2.19 2.81 2.70 2.35 1.72 1.16<br />
Changde 275 450 735 801 849 913 994 1,064 9.82 9.82 1.73 1.16 1.47 1.69 1.36<br />
Changsha, Hunan 1,089 1,504 2,077 2,197 2,415 2,655 2,885 3,066 6.45 6.46 1.12 1.89 1.89 1.66 1.22<br />
Changzhou, Jiangsu 730 883 1,068 1,876 2,062 2,267 2,466 2,624 3.81 3.81 11.27 1.89 1.90 1.68 1.24<br />
Chengdu 2,955 3,403 3,919 4,467 4,961 5,441 5,886 6,224 2.82 2.82 2.62 2.10 1.85 1.57 1.12<br />
Chifeng 345 483 677 761 842 931 1,020 1,092 6.74 6.74 2.33 2.02 2.03 1.81 1.37<br />
Chongqing 3,123 4,342 6,039 7,266 9,401 9,850 10,514 11,065 6.59 6.60 3.70 5.15 0.93 1.30 1.02<br />
Cixi 207 367 650 725 781 850 928 994 11.44 11.44 2.16 1.50 1.70 1.75 1.38<br />
Dalian 1,884 2,311 2,833 3,060 3,306 3,599 3,896 4,132 4.08 4.08 1.54 1.54 1.70 1.59 1.17<br />
Dandong 543 607 679 736 795 867 947 1,014 2.24 2.24 1.60 1.56 1.73 1.75 1.37<br />
Daqing 757 905 1,082 1,294 1,546 1,797 1,981 2,112 3.58 3.58 3.58 3.56 3.00 1.96 1.28<br />
Datong, Shanxi 917 981 1,049 1,141 1,251 1,375 1,500 1,602 1.34 1.34 1.68 1.84 1.89 1.74 1.31<br />
Dongguan, Guangdong 553 1,416 3,631 4,692 5,347 5,971 6,483 6,852 18.82 18.83 5.13 2.61 2.21 1.64 1.11<br />
Dongying 395 498 628 773 949 1,123 1,246 1,334 4.64 4.64 4.14 4.09 3.37 2.09 1.36<br />
Foshan 429 569 754 4,033 4,969 5,455 5,903 6,242 5.63 5.63 33.53 4.17 1.86 1.58 1.12<br />
Fushun, Liaoning 1,289 1,323 1,358 1,368 1,378 1,434 1,544 1,647 0.52 0.52 0.16 0.15 0.79 1.49 1.29<br />
Fuxin 600 633 667 739 821 912 999 1,070 1.06 1.06 2.05 2.12 2.09 1.83 1.37<br />
Fuyang 142 265 695 804 874 957 1,045 1,119 12.42 19.30 2.91 1.69 1.81 1.76 1.36<br />
Fuzhou, Fujian 875 1,316 1,978 2,368 2,787 3,201 3,509 3,727 8.15 8.15 3.59 3.26 2.77 1.84 1.20<br />
Guangzhou, Guangdong 3,072 4,745 7,330 8,165 8,884 9,669 10,409 10,961 8.69 8.70 2.16 1.69 1.69 1.48 1.03<br />
Guilin 561 652 757 867 991 1,120 1,231 1,317 2.99 2.99 2.71 2.68 2.45 1.89 1.35<br />
Guiyang 1,080 1,417 1,860 2,015 2,154 2,325 2,519 2,679 5.44 5.44 1.60 1.33 1.53 1.60 1.23<br />
Haerbin 2,392 2,860 3,419 3,789 4,251 4,473 4,800 5,080 3.57 3.57 2.06 2.30 1.02 1.41 1.14<br />
Haikou 331 494 738 1,410 1,586 1,772 1,937 2,065 8.02 8.02 12.96 2.35 2.21 1.78 1.28<br />
Handan 525 653 811 1,007 1,249 1,488 1,652 1,764 4.33 4.34 4.33 4.32 3.50 2.09 1.32<br />
Hangzhou 1,476 1,887 2,411 3,516 3,860 4,145 4,470 4,735 4.91 4.91 7.55 1.87 1.42 1.51 1.15<br />
Hefei 1,100 1,298 1,532 2,065 2,404 2,626 2,850 3,029 3.32 3.32 5.97 3.04 1.76 1.64 1.22<br />
Hengyang 504 632 793 936 1,099 1,263 1,393 1,488 4.53 4.53 3.31 3.22 2.79 1.95 1.33<br />
Hohhot 635 798 1,005 1,264 1,589 1,907 2,118 2,258 4.59 4.59 4.59 4.57 3.66 2.09 1.28<br />
Huai'an 330 520 818 914 998 1,095 1,195 1,278 9.06 9.06 2.24 1.76 1.85 1.75 1.34<br />
Huaibei 290 423 617 775 962 1,147 1,275 1,364 7.53 7.53 4.55 4.32 3.52 2.12 1.35<br />
Huainan 724 872 1,049 1,212 1,396 1,583 1,738 1,854 3.71 3.71 2.88 2.82 2.52 1.86 1.30<br />
2000-<br />
2005<br />
2005-<br />
2010<br />
2010-<br />
2015<br />
2015-<br />
2020<br />
2020-<br />
2025
Country/City<br />
Table 4<br />
City Population of<br />
Urban Agglomerations (’000)<br />
1990 1995 2000 2005 2010 2015 2020 2025<br />
131<br />
1990-<br />
1995<br />
1995-<br />
2000<br />
City Population Growth Rate of<br />
Urban Agglomerations (%)<br />
2000-<br />
2005<br />
2005-<br />
2010<br />
2010-<br />
2015<br />
Statistical Annex<br />
City population and city population growth rate of urban agglomerations with 750,000 Inhabitants or More in 2009,<br />
by Country, 1950-2025 (thousands)<br />
Huizhou 205 336 551 1,212 1,384 1,562 1,713 1,828 9.90 9.91 15.77 2.66 2.42 1.84 1.30<br />
Huludao 351 431 529 648 795 940 1,045 1,120 4.09 4.09 4.08 4.07 3.36 2.11 1.38<br />
Jiamusi 469 539 619 711 817 927 1,020 1,092 2.78 2.78 2.78 2.77 2.52 1.92 1.37<br />
Jiangmen 190 314 519 977 1,103 1,236 1,355 1,448 10.02 10.02 12.67 2.42 2.28 1.84 1.33<br />
Jiaozuo 395 500 631 755 900 1,045 1,155 1,236 4.68 4.68 3.59 3.50 2.99 2.01 1.36<br />
Jieyang 176 327 608 732 855 980 1,081 1,158 12.36 12.37 3.73 3.10 2.73 1.96 1.37<br />
Jilin 1,090 1,251 1,435 1,647 1,888 2,135 2,338 2,489 2.75 2.75 2.75 2.74 2.46 1.81 1.25<br />
Jinan, Shandong 1,923 2,134 2,592 2,951 3,237 3,522 3,813 4,044 2.08 3.89 2.59 1.85 1.69 1.59 1.18<br />
Jingzhou 301 479 761 899 1,039 1,183 1,302 1,392 9.25 9.26 3.33 2.91 2.59 1.91 1.34<br />
Jining, Shandong 343 542 856 972 1,077 1,193 1,304 1,394 9.15 9.16 2.53 2.06 2.04 1.79 1.33<br />
Jinjiang 98 212 456 636 858 1,080 1,216 1,303 15.38 15.38 6.64 5.99 4.61 2.37 1.37<br />
Jinzhou 592 675 770 814 857 918 998 1,068 2.63 2.63 1.12 1.02 1.38 1.67 1.36<br />
Jixi, Heilongjiang 650 732 823 927 1,042 1,166 1,278 1,366 2.36 2.36 2.36 2.36 2.24 1.83 1.34<br />
Kaohsiung 1,372 1,431 1,488 1,548 1,611 1,711 1,850 1,971 0.83 0.79 0.79 0.80 1.20 1.56 1.27<br />
Kunming 1,100 1,679 2,561 2,857 3,116 3,405 3,691 3,915 8.45 8.45 2.19 1.73 1.78 1.61 1.18<br />
Lanzhou 1,290 1,561 1,890 2,085 2,285 2,507 2,724 2,896 3.82 3.82 1.96 1.83 1.85 1.66 1.23<br />
Lianyungang 344 442 567 732 878 1,002 1,105 1,183 4.99 4.99 5.12 3.63 2.65 1.94 1.36<br />
Linyi, Shandong 260 542 1,130 1,297 1,427 1,571 1,713 1,827 14.67 14.67 2.76 1.91 1.93 1.73 1.29<br />
Liuzhou 637 809 1,027 1,183 1,352 1,527 1,675 1,788 4.78 4.78 2.82 2.68 2.43 1.85 1.30<br />
Lufeng 275 391 556 706 889 1,069 1,192 1,276 7.05 7.05 4.78 4.60 3.70 2.17 1.37<br />
Luoyang 725 938 1,213 1,373 1,539 1,716 1,875 1,999 5.14 5.14 2.48 2.29 2.17 1.78 1.28<br />
Luzhou 273 421 649 751 850 955 1,049 1,123 8.67 8.67 2.90 2.49 2.33 1.88 1.37<br />
Maoming 173 327 617 717 803 896 983 1,053 12.69 12.70 2.98 2.28 2.20 1.85 1.37<br />
Mianyang, Sichuan 289 468 758 883 1,006 1,133 1,244 1,331 9.62 9.62 3.07 2.59 2.39 1.87 1.34<br />
Mudanjiang 479 564 665 724 783 855 933 1,000 3.29 3.29 1.69 1.58 1.75 1.76 1.38<br />
Nanchang 912 1,226 1,648 2,380 2,701 2,978 3,236 3,436 5.92 5.92 7.35 2.53 1.95 1.66 1.20<br />
Nanchong 279 411 606 705 808 914 1,006 1,078 7.74 7.74 3.05 2.71 2.48 1.91 1.37<br />
Nanjing, Jiangsu 2,497 2,944 3,472 3,966 4,519 5,076 5,524 5,845 3.30 3.30 2.66 2.61 2.33 1.69 1.13<br />
Nanning 759 1,118 1,445 1,826 2,096 2,306 2,508 2,669 7.74 5.13 4.68 2.76 1.91 1.68 1.24<br />
Nantong 470 534 607 767 1,423 1,586 1,734 1,850 2.55 2.55 4.70 12.36 2.17 1.78 1.29<br />
Nanyang, Henan 228 392 672 774 867 967 1,060 1,135 10.79 10.80 2.83 2.26 2.18 1.84 1.36<br />
Neijiang 415 533 685 781 883 991 1,088 1,165 5.00 5.00 2.63 2.46 2.31 1.87 1.36<br />
Ningbo 634 909 1,303 1,897 2,217 2,536 2,782 2,959 7.20 7.20 7.51 3.12 2.69 1.85 1.23<br />
Panjin 367 467 593 696 813 932 1,028 1,101 4.79 4.79 3.22 3.10 2.73 1.97 1.37<br />
Pingdingshan, Henan 431 606 852 942 1,024 1,120 1,222 1,307 6.81 6.81 2.01 1.68 1.79 1.74 1.34<br />
Puning 76 214 603 763 911 1,060 1,172 1,255 20.76 20.76 4.71 3.55 3.02 2.02 1.36<br />
Putian 311 370 439 1,052 1,085 1,147 1,241 1,327 3.43 3.43 17.48 0.62 1.11 1.58 1.33<br />
Qingdao 1,332 1,882 2,659 3,029 3,323 3,622 3,923 4,159 6.91 6.91 2.61 1.85 1.72 1.59 1.17<br />
Qinhuangdao 358 501 702 800 893 993 1,088 1,165 6.74 6.74 2.61 2.21 2.12 1.82 1.36<br />
Qiqihaer 1,115 1,218 1,331 1,453 1,588 1,740 1,894 2,019 1.77 1.77 1.76 1.77 1.83 1.70 1.28<br />
Quanzhou 174 356 728 898 1,068 1,238 1,367 1,462 14.34 14.34 4.19 3.46 2.95 1.99 1.34<br />
Rizhao 248 390 613 715 816 922 1,014 1,086 9.03 9.03 3.08 2.65 2.44 1.90 1.37<br />
Shanghai 7,823 10,171 13,224 15,184 16,575 17,840 19,094 20,017 5.25 5.25 2.76 1.75 1.47 1.36 0.94<br />
Shantou 724 950 1,247 3,375 3,502 3,704 3,983 4,222 5.43 5.43 19.91 0.74 1.12 1.46 1.16<br />
2015-<br />
2020<br />
2020-<br />
2025
State of the World’s Cities <strong>2012</strong>/<strong>2013</strong><br />
Country/City<br />
Table 4<br />
City population and city population growth rate of urban agglomerations with 750,000 Inhabitants or More in 2009,<br />
by Country, 1950-2025 (thousands)<br />
City Population of<br />
Urban Agglomerations (’000)<br />
1990 1995 2000 2005 2010 2015 2020 2025<br />
132<br />
1990-<br />
1995<br />
1995-<br />
2000<br />
City Population Growth Rate of<br />
Urban Agglomerations (%)<br />
Shaoguan 237 350 517 766 845 914 995 1,066 7.79 7.80 7.86 1.96 1.56 1.71 1.37<br />
Shaoxing 181 332 608 731 853 977 1,077 1,153 12.09 12.09 3.69 3.08 2.71 1.96 1.37<br />
Shenyang 3,651 4,081 4,562 4,788 5,166 5,650 6,108 6,457 2.23 2.23 0.96 1.52 1.79 1.56 1.11<br />
Shenzhen 875 2,304 6,069 7,931 9,005 9,827 10,585 11,146 19.36 19.37 5.35 2.54 1.75 1.49 1.03<br />
Shijiazhuang 1,372 1,621 1,914 2,192 2,487 2,789 3,044 3,235 3.33 3.33 2.71 2.52 2.30 1.75 1.22<br />
Suzhou, Jiangsu 689 952 1,316 1,992 2,398 2,619 2,842 3,021 6.47 6.47 8.29 3.71 1.76 1.64 1.22<br />
Taian, Shandong 367 577 910 1,073 1,239 1,409 1,548 1,653 9.09 9.09 3.30 2.88 2.57 1.89 1.31<br />
Taichung 765 864 978 1,106 1,251 1,403 1,538 1,642 2.45 2.47 2.47 2.46 2.30 1.83 1.31<br />
Tainan 669 697 723 750 777 825 895 959 0.79 0.76 0.71 0.72 1.19 1.64 1.38<br />
Taipei 2,737 2,698 2,630 2,627 2,633 2,725 2,921 3,102 -0.29 -0.51 -0.02 0.04 0.68 1.39 1.20<br />
Taiyuan, Shanxi 1,637 2,024 2,503 2,819 3,154 3,504 3,812 4,043 4.25 4.25 2.38 2.24 2.11 1.68 1.18<br />
Taizhou, Jiangsu 158 290 535 662 795 928 1,028 1,101 12.23 12.24 4.24 3.66 3.10 2.05 1.38<br />
Taizhou, Zhejiang 912 1,042 1,190 1,259 1,338 1,442 1,566 1,671 2.66 2.66 1.13 1.21 1.49 1.64 1.30<br />
Tangshan, Hebei 996 1,177 1,390 1,614 1,870 2,130 2,335 2,487 3.33 3.33 2.99 2.95 2.59 1.85 1.26<br />
Tianjin 4,558 5,513 6,670 7,278 7,884 8,559 9,216 9,713 3.81 3.81 1.75 1.60 1.64 1.48 1.05<br />
Ürümqi (Wulumqi) 1,149 1,399 1,705 2,025 2,398 2,767 3,040 3,231 3.95 3.95 3.43 3.39 2.86 1.88 1.22<br />
Weifang 634 885 1,235 1,457 1,698 1,941 2,131 2,271 6.67 6.67 3.31 3.06 2.67 1.87 1.27<br />
Wenzhou 1,111 1,318 1,565 2,187 2,659 3,119 3,436 3,650 3.43 3.43 6.69 3.90 3.19 1.94 1.21<br />
Wuhan 3,417 4,763 6,638 7,204 7,681 8,253 8,868 9,347 6.64 6.64 1.64 1.28 1.44 1.44 1.05<br />
Wuhu, Anhui 442 529 634 759 908 1,057 1,169 1,252 3.60 3.60 3.60 3.59 3.04 2.02 1.36<br />
Wuxi, Jiangsu 992 1,182 1,409 2,435 2,682 2,951 3,206 3,405 3.51 3.51 10.94 1.93 1.91 1.66 1.20<br />
Xiamen 639 952 1,416 1,765 2,207 2,641 2,926 3,112 7.95 7.95 4.40 4.47 3.59 2.04 1.24<br />
Xi'an, Shaanxi 2,157 2,821 3,690 4,382 4,747 5,038 5,414 5,726 5.37 5.37 3.43 1.60 1.19 1.44 1.12<br />
Xiangfan, Hubei 554 685 847 1,278 1,399 1,536 1,674 1,786 4.25 4.25 8.21 1.81 1.87 1.72 1.30<br />
Xiangtan, Hunan 456 564 698 806 926 1,050 1,155 1,236 4.25 4.25 2.88 2.78 2.52 1.91 1.36<br />
Xianyang, Shaanxi 317 500 790 908 1,019 1,138 1,247 1,334 9.14 9.14 2.77 2.32 2.21 1.83 1.34<br />
Xining 592 707 844 1,032 1,261 1,488 1,649 1,761 3.55 3.55 4.00 4.02 3.31 2.05 1.31<br />
Xinxiang 450 586 762 884 1,016 1,152 1,267 1,355 5.26 5.26 2.96 2.79 2.52 1.90 1.34<br />
Xuzhou 781 1,033 1,367 1,715 2,142 2,559 2,833 3,015 5.60 5.60 4.54 4.44 3.56 2.04 1.24<br />
Yancheng, Jiangsu 392 513 671 1,071 1,289 1,474 1,622 1,731 5.38 5.38 9.33 3.72 2.68 1.91 1.31<br />
Yangzhou 455 565 702 871 1,080 1,287 1,430 1,529 4.33 4.33 4.33 4.31 3.50 2.10 1.34<br />
Yantai 422 717 1,218 1,383 1,526 1,684 1,836 1,958 10.59 10.59 2.55 1.97 1.97 1.73 1.28<br />
Yichang 492 583 692 879 959 1,039 1,132 1,210 3.40 3.40 4.79 1.74 1.61 1.71 1.35<br />
Yichun, Heilongjiang 855 835 815 796 779 795 856 917 -0.47 -0.47 -0.47 -0.45 0.43 1.47 1.37<br />
Yinchuan 384 468 571 720 911 1,099 1,225 1,312 3.97 3.97 4.66 4.69 3.76 2.18 1.36<br />
Yingkou 458 535 624 728 848 972 1,072 1,148 3.08 3.08 3.08 3.07 2.71 1.96 1.37<br />
Yiyang, Hunan 191 360 678 760 820 892 974 1,043 12.69 12.69 2.26 1.52 1.70 1.74 1.37<br />
Yueyang 305 518 881 997 1,096 1,206 1,317 1,408 10.62 10.62 2.47 1.89 1.93 1.76 1.33<br />
Zaozhuang 303 508 853 1,014 1,175 1,339 1,473 1,574 10.36 10.36 3.45 2.95 2.62 1.90 1.32<br />
Zhangjiakou 558 667 797 913 1,043 1,178 1,294 1,384 3.56 3.56 2.72 2.66 2.43 1.88 1.34<br />
Zhanjiang 486 630 818 908 996 1,097 1,198 1,281 5.21 5.21 2.08 1.86 1.92 1.77 1.34<br />
Zhengzhou 1,134 1,663 2,438 2,715 2,966 3,245 3,519 3,734 7.65 7.65 2.16 1.76 1.80 1.62 1.19<br />
Zhenjiang, Jiangsu 328 472 679 832 1,007 1,181 1,308 1,399 7.27 7.27 4.06 3.82 3.19 2.04 1.35<br />
Zhongshan 393 736 1,376 1,768 2,211 2,643 2,927 3,114 12.51 12.52 5.02 4.47 3.57 2.04 1.24<br />
2000-<br />
2005<br />
2005-<br />
2010<br />
2010-<br />
2015<br />
2015-<br />
2020<br />
2020-<br />
2025
Country/City<br />
City Population of<br />
Urban Agglomerations (’000)<br />
1990 1995 2000 2005 2010 2015 2020 2025<br />
133<br />
1990-<br />
1995<br />
1995-<br />
2000<br />
City Population Growth Rate of<br />
Urban Agglomerations (%)<br />
2000-<br />
2005<br />
2005-<br />
2010<br />
2010-<br />
2015<br />
Statistical Annex<br />
Zhuhai 220 419 799 1,224 1,252 1,315 1,420 1,516 12.89 12.90 8.55 0.44 0.98 1.54 1.31<br />
Zhuzhou 430 593 819 923 1,025 1,137 1,244 1,330 6.45 6.45 2.39 2.10 2.07 1.80 1.34<br />
Zibo 777 1,207 1,874 2,168 2,456 2,752 3,004 3,192 8.80 8.80 2.92 2.49 2.28 1.75 1.22<br />
Zigong 368 467 592 847 918 982 1,067 1,142 4.75 4.75 7.17 1.62 1.35 1.65 1.35<br />
Zunyi 250 368 541 679 843 1,005 1,118 1,198 7.72 7.72 4.55 4.31 3.52 2.14 1.37<br />
CHInA, HOng kOng SAR<br />
Hong Kong 5,677 6,214 6,667 6,883 7,069 7,398 7,701 7,969 1.81 1.41 0.64 0.54 0.91 0.80 0.68<br />
COLOmBIA<br />
Barranquilla 1,229 1,363 1,531 1,719 1,867 2,015 2,145 2,255 2.06 2.32 2.32 1.65 1.53 1.25 1.00<br />
Bogotá 4,740 5,494 6,356 7,353 8,500 9,521 10,129 10,537 2.95 2.92 2.91 2.90 2.27 1.24 0.79<br />
Bucaramanga 650 759 855 964 1,092 1,213 1,303 1,375 3.08 2.39 2.39 2.49 2.11 1.43 1.08<br />
Cali 1,552 1,757 1,950 2,164 2,401 2,627 2,800 2,938 2.48 2.08 2.08 2.08 1.80 1.28 0.97<br />
Cartagena 561 645 737 842 962 1,076 1,158 1,223 2.77 2.68 2.67 2.66 2.23 1.47 1.10<br />
Cúcuta 506 571 632 700 774 848 910 963 2.41 2.04 2.03 2.03 1.82 1.41 1.13<br />
Medellín 2,135 2,372 2,724 3,127 3,594 4,019 4,294 4,494 2.11 2.76 2.76 2.78 2.24 1.33 0.91<br />
COngO<br />
Brazzaville 704 830 986 1,172 1,323 1,504 1,703 1,878 3.31 3.44 3.46 2.42 2.55 2.49 1.95<br />
COSTA RICA<br />
San José 737 867 1,032 1,232 1,461 1,655 1,799 1,923 3.25 3.48 3.54 3.41 2.50 1.67 1.33<br />
CôTE D'IvOIRE<br />
Abidjan 2,102 2,535 3,032 3,564 4,125 4,788 5,550 6,321 3.74 3.58 3.24 2.92 2.98 2.95 2.60<br />
Yamoussoukro 136 218 348 556 885 1,273 1,559 1,797 9.36 9.37 9.36 9.32 7.27 4.06 2.83<br />
CUBA<br />
La Habana (Havana) 2,108 2,151 2,187 2,187 2,130 2,100 2,095 2,094 0.40 0.33 0.00 -0.53 -0.28 -0.05 -0.00<br />
CzECH REPUBLIC<br />
Praha (Prague) 1,212 1,194 1,172 1,164 1,162 1,165 1,168 1,173 -0.29 -0.38 -0.14 -0.02 0.04 0.06 0.08<br />
DEm. PEOPLE’S REPUBLIC <strong>OF</strong> kOREA<br />
P’yongyang 2,526 2,749 2,777 2,805 2,833 2,859 2,894 2,941 1.70 0.20 0.20 0.20 0.18 0.24 0.33<br />
DEmOCRATIC REPUBLIC <strong>OF</strong> <strong>THE</strong> COngO<br />
Kananga 353 451 552 705 878 1,087 1,324 1,583 4.92 4.03 4.89 4.40 4.26 3.95 3.57<br />
Kinshasa 3,564 4,590 5,611 7,106 8,754 10,668 12,788 15,041 5.06 4.02 4.72 4.17 3.96 3.62 3.25<br />
Kisangani 362 450 535 664 812 1,002 1,221 1,461 4.34 3.45 4.32 4.03 4.19 3.96 3.58<br />
Lubumbashi 655 826 995 1,252 1,543 1,899 2,304 2,744 4.62 3.73 4.60 4.17 4.15 3.87 3.49<br />
Mbuji-Mayi 580 749 924 1,190 1,488 1,838 2,232 2,658 5.09 4.20 5.06 4.48 4.22 3.88 3.50<br />
DEnmARk<br />
København (Copenhagen) 1,035 1,048 1,077 1,125 1,186 1,228 1,238 1,238 0.25 0.54 0.87 1.05 0.70 0.16 0.01<br />
DOmInICAn REPUBLIC<br />
Santo Domingo 1,522 1,661 1,813 1,981 2,180 2,381 2,552 2,691 1.74 1.76 1.77 1.92 1.76 1.39 1.06<br />
ECUADOR<br />
Table 4<br />
City population and city population growth rate of urban agglomerations with 750,000 Inhabitants or More in 2009,<br />
by Country, 1950-2025 (thousands)<br />
Guayaquil 1,572 1,808 2,077 2,386 2,690 2,941 3,153 3,328 2.80 2.78 2.77 2.39 1.79 1.39 1.08<br />
Quito 1,088 1,217 1,357 1,593 1,846 2,035 2,188 2,316 2.25 2.18 3.20 2.95 1.95 1.45 1.13<br />
2015-<br />
2020<br />
2020-<br />
2025
State of the World’s Cities <strong>2012</strong>/<strong>2013</strong><br />
Country/City<br />
EgyPT<br />
Table 4<br />
City population and city population growth rate of urban agglomerations with 750,000 Inhabitants or More in 2009,<br />
by Country, 1950-2025 (thousands)<br />
City Population of<br />
Urban Agglomerations (’000)<br />
1990 1995 2000 2005 2010 2015 2020 2025<br />
134<br />
1990-<br />
1995<br />
1995-<br />
2000<br />
City Population Growth Rate of<br />
Urban Agglomerations (%)<br />
Al-Iskandariyah<br />
(Alexandria)<br />
3,063 3,277 3,592 3,973 4,387 4,791 5,201 5,648 1.35 1.83 2.02 1.98 1.76 1.64 1.65<br />
Al-Qahirah (Cairo)<br />
EL SALvADOR<br />
9,061 9,707 10,170 10,565 11,001 11,663 12,540 13,531 1.38 0.93 0.76 0.81 1.17 1.45 1.52<br />
San Salvador<br />
ETHIOPIA<br />
970 1,112 1,248 1,401 1,565 1,691 1,789 1,891 2.73 2.32 2.32 2.21 1.55 1.13 1.10<br />
Addis Ababa<br />
FInLAnD<br />
1,791 2,144 2,376 2,633 2,930 3,365 3,981 4,757 3.60 2.05 2.05 2.13 2.77 3.36 3.56<br />
Helsinki<br />
FRAnCE<br />
871 943 1,019 1,067 1,117 1,153 1,170 1,174 1.58 1.56 0.92 0.91 0.65 0.28 0.07<br />
Bordeaux 698 730 763 799 838 875 899 913 0.88 0.89 0.93 0.95 0.86 0.55 0.29<br />
Lille 961 984 1,004 1,015 1,033 1,066 1,092 1,107 0.47 0.41 0.22 0.35 0.62 0.50 0.26<br />
Lyon 1,265 1,313 1,362 1,412 1,468 1,523 1,559 1,575 0.74 0.73 0.73 0.77 0.74 0.46 0.21<br />
Marseille-Aix-en-Provence 1,305 1,331 1,363 1,413 1,469 1,524 1,560 1,577 0.39 0.48 0.73 0.77 0.74 0.46 0.21<br />
Nice-Cannes 854 874 899 936 977 1,018 1,045 1,059 0.46 0.56 0.82 0.86 0.81 0.52 0.27<br />
Paris 9,330 9,510 9,739 10,105 10,485 10,777 10,880 10,884 0.38 0.48 0.74 0.74 0.55 0.19 0.01<br />
Toulouse<br />
gEORgIA<br />
654 714 778 844 912 962 989 1,003 1.75 1.72 1.63 1.55 1.07 0.55 0.28<br />
Tbilisi<br />
gERmAny<br />
1,224 1,160 1,100 1,093 1,120 1,136 1,138 1,138 -1.07 -1.07 -0.12 0.48 0.28 0.05 0.00<br />
Berlin 3,422 3,471 3,384 3,391 3,450 3,489 3,498 3,499 0.29 -0.51 0.04 0.34 0.23 0.05 0.00<br />
Hamburg 1,639 1,707 1,710 1,739 1,786 1,818 1,825 1,825 0.81 0.04 0.34 0.53 0.35 0.08 0.00<br />
Köln (Cologne) 950 965 963 976 1,001 1,015 1,018 1,018 0.31 -0.04 0.28 0.50 0.26 0.06 0.00<br />
München (Munich)<br />
gHAnA<br />
1,218 1,241 1,202 1,254 1,349 1,401 1,412 1,413 0.37 -0.62 0.85 1.46 0.75 0.17 0.01<br />
Accra<br />
gHAnA<br />
1,197 1,415 1,674 1,985 2,342 2,722 3,110 3,497 3.35 3.35 3.41 3.30 3.01 2.66 2.35<br />
Kumasi<br />
gREECE<br />
696 909 1,187 1,519 1,834 2,139 2,448 2,757 5.34 5.34 4.94 3.76 3.08 2.70 2.38<br />
Athínai (Athens) 3,070 3,122 3,179 3,230 3,257 3,283 3,312 3,346 0.34 0.37 0.31 0.17 0.16 0.17 0.21<br />
Thessaloniki<br />
gUATEmALA<br />
746 771 797 821 837 853 868 886 0.66 0.67 0.60 0.40 0.36 0.37 0.40<br />
Ciudad de Guatemala<br />
(Guatemala City)<br />
gUInEA<br />
803 839 908 984 1,104 1,281 1,481 1,690 0.89 1.57 1.62 2.30 2.97 2.90 2.64<br />
Conakry<br />
HAITI<br />
895 1,045 1,219 1,411 1,653 2,004 2,427 2,906 3.11 3.08 2.92 3.17 3.84 3.83 3.61<br />
Port-au-Prince<br />
HOnDURAS<br />
1,134 1,427 1,693 2,171 2,143 2,481 2,868 3,246 4.60 3.42 4.96 -0.25 2.93 2.90 2.48<br />
Tegucigalpa<br />
HUngARy<br />
578 677 793 901 1,028 1,181 1,339 1,493 3.16 3.16 2.57 2.63 2.77 2.51 2.18<br />
Budapest 2,005 1,893 1,787 1,698 1,706 1,711 1,711 1,711 -1.15 -1.15 -1.02 0.09 0.05 0.01 0.00<br />
2000-<br />
2005<br />
2005-<br />
2010<br />
2010-<br />
2015<br />
2015-<br />
2020<br />
2020-<br />
2025
Country/City<br />
InDIA<br />
Table 4<br />
City Population of<br />
Urban Agglomerations (’000)<br />
1990 1995 2000 2005 2010 2015 2020 2025<br />
135<br />
1990-<br />
1995<br />
1995-<br />
2000<br />
City Population Growth Rate of<br />
Urban Agglomerations (%)<br />
2000-<br />
2005<br />
2005-<br />
2010<br />
2010-<br />
2015<br />
Statistical Annex<br />
City population and city population growth rate of urban agglomerations with 750,000 Inhabitants or More in 2009,<br />
by Country, 1950-2025 (thousands)<br />
Agra 933 1,095 1,293 1,511 1,703 1,886 2,089 2,313 3.20 3.32 3.13 2.38 2.04 2.04 2.04<br />
Ahmadabad 3,255 3,790 4,427 5,122 5,717 6,277 6,892 7,567 3.04 3.11 2.92 2.20 1.87 1.87 1.87<br />
Aligarh 468 554 653 763 863 960 1,068 1,189 3.39 3.29 3.11 2.44 2.14 2.14 2.14<br />
Allahabad 830 928 1,035 1,152 1,277 1,415 1,570 1,742 2.23 2.17 2.15 2.06 2.05 2.08 2.08<br />
Amritsar 726 844 990 1,152 1,297 1,439 1,597 1,771 3.00 3.20 3.02 2.37 2.08 2.08 2.08<br />
Asansol 727 891 1,065 1,258 1,423 1,579 1,751 1,941 4.06 3.56 3.33 2.47 2.08 2.07 2.06<br />
Aurangabad 568 708 868 1,049 1,198 1,331 1,478 1,641 4.38 4.09 3.79 2.65 2.12 2.09 2.09<br />
Bangalore 4,036 4,744 5,567 6,465 7,218 7,913 8,674 9,507 3.23 3.20 2.99 2.20 1.84 1.84 1.83<br />
Bareilly 604 664 722 787 868 963 1,072 1,192 1.87 1.67 1.73 1.95 2.09 2.14 2.13<br />
Bhiwandi 362 479 603 745 859 957 1,066 1,186 5.62 4.60 4.23 2.84 2.18 2.14 2.14<br />
Bhopal 1,046 1,228 1,426 1,644 1,843 2,039 2,257 2,497 3.21 3.00 2.85 2.28 2.02 2.03 2.03<br />
Bhubaneswar 395 504 637 790 912 1,017 1,131 1,258 4.90 4.69 4.30 2.86 2.17 2.13 2.13<br />
Chandigarh 564 667 791 928 1,049 1,166 1,296 1,440 3.36 3.40 3.20 2.46 2.11 2.11 2.11<br />
Chennai (Madras) 5,338 5,836 6,353 6,919 7,547 8,253 9,043 9,909 1.78 1.70 1.71 1.74 1.79 1.83 1.83<br />
Coimbatore 1,088 1,239 1,420 1,619 1,807 1,999 2,212 2,449 2.60 2.73 2.62 2.20 2.02 2.03 2.03<br />
Delhi 9,726 12,407 15,730 19,493 22,157 24,160 26,272 28,568 4.87 4.75 4.29 2.56 1.73 1.68 1.68<br />
Dhanbad 805 915 1,046 1,189 1,328 1,472 1,633 1,812 2.56 2.67 2.58 2.21 2.06 2.08 2.07<br />
Durg-Bhilainagar 670 780 905 1,044 1,172 1,301 1,445 1,604 3.03 2.98 2.84 2.32 2.09 2.10 2.09<br />
Guwahati (Gauhati) 564 675 797 932 1,053 1,170 1,300 1,445 3.60 3.32 3.14 2.43 2.11 2.11 2.11<br />
Gwalior 706 779 855 940 1,039 1,152 1,280 1,423 1.97 1.88 1.90 1.99 2.07 2.11 2.11<br />
Hubli-Dharwad 639 705 776 855 946 1,050 1,168 1,299 1.95 1.93 1.95 2.02 2.08 2.13 2.12<br />
Hyderabad 4,193 4,825 5,445 6,117 6,751 7,396 8,110 8,894 2.81 2.42 2.33 1.97 1.83 1.85 1.84<br />
Indore 1,088 1,314 1,597 1,914 2,173 2,405 2,659 2,939 3.77 3.91 3.62 2.54 2.03 2.01 2.00<br />
Jabalpur 879 981 1,100 1,231 1,367 1,514 1,679 1,862 2.19 2.29 2.25 2.09 2.04 2.07 2.07<br />
Jaipur 1,478 1,826 2,259 2,748 3,131 3,458 3,813 4,205 4.23 4.26 3.91 2.61 1.99 1.96 1.95<br />
Jalandhar 502 588 694 811 917 1,020 1,134 1,262 3.16 3.31 3.13 2.44 2.13 2.13 2.13<br />
Jammu 356 458 588 739 857 956 1,064 1,184 5.00 5.01 4.58 2.97 2.19 2.14 2.14<br />
Jamshedpur 817 938 1,081 1,239 1,387 1,537 1,705 1,891 2.75 2.84 2.72 2.26 2.06 2.07 2.07<br />
Jodhpur 654 743 842 951 1,061 1,177 1,308 1,454 2.54 2.51 2.44 2.18 2.09 2.11 2.11<br />
Kanpur 2,001 2,294 2,641 3,020 3,364 3,706 4,084 4,501 2.73 2.82 2.68 2.16 1.93 1.94 1.94<br />
Kochi (Cochin) 1,103 1,229 1,340 1,464 1,610 1,779 1,971 2,184 2.17 1.73 1.76 1.90 2.00 2.05 2.05<br />
Kolkata (Calcutta) 10,890 11,924 13,058 14,284 15,552 16,924 18,449 20,112 1.82 1.82 1.79 1.70 1.69 1.73 1.73<br />
Kota 523 604 692 789 884 982 1,093 1,216 2.89 2.71 2.62 2.26 2.12 2.14 2.13<br />
Kozhikode (Calicut) 781 835 875 924 1,007 1,115 1,240 1,378 1.33 0.94 1.10 1.71 2.05 2.12 2.11<br />
Lucknow 1,614 1,906 2,221 2,567 2,873 3,169 3,497 3,858 3.33 3.06 2.89 2.25 1.96 1.97 1.97<br />
Ludhiana 1,006 1,183 1,368 1,572 1,760 1,947 2,156 2,387 3.24 2.91 2.78 2.26 2.03 2.04 2.03<br />
Madurai 1,073 1,132 1,187 1,255 1,365 1,509 1,674 1,856 1.07 0.95 1.11 1.68 2.00 2.07 2.07<br />
Meerut 824 975 1,143 1,328 1,494 1,656 1,836 2,035 3.36 3.18 3.00 2.35 2.06 2.06 2.06<br />
Moradabad 436 520 626 744 845 941 1,048 1,166 3.53 3.68 3.45 2.56 2.15 2.14 2.14<br />
Mumbai (Bombay) 12,308 14,111 16,086 18,205 20,041 21,797 23,719 25,810 2.73 2.62 2.48 1.92 1.68 1.69 1.69<br />
Mysore 640 708 776 853 942 1,045 1,163 1,293 2.01 1.85 1.88 1.99 2.08 2.13 2.12<br />
Nagpur 1,637 1,849 2,089 2,351 2,607 2,875 3,175 3,505 2.44 2.44 2.36 2.07 1.96 1.98 1.98<br />
Nashik 700 886 1,117 1,381 1,588 1,763 1,954 2,165 4.71 4.63 4.24 2.79 2.09 2.05 2.05<br />
2015-<br />
2020<br />
2020-<br />
2025
State of the World’s Cities <strong>2012</strong>/<strong>2013</strong><br />
Country/City<br />
City Population of<br />
Urban Agglomerations (’000)<br />
1990 1995 2000 2005 2010 2015 2020 2025<br />
136<br />
1990-<br />
1995<br />
1995-<br />
2000<br />
City Population Growth Rate of<br />
Urban Agglomerations (%)<br />
Patna 1,087 1,331 1,658 2,030 2,321 2,569 2,839 3,137 4.05 4.40 4.04 2.68 2.03 2.00 1.99<br />
Pune (Poona) 2,430 2,978 3,655 4,412 5,002 5,505 6,050 6,649 4.07 4.09 3.76 2.51 1.92 1.89 1.89<br />
Raipur 453 553 680 824 943 1,050 1,167 1,298 4.00 4.13 3.83 2.69 2.15 2.13 2.12<br />
Rajkot 638 787 974 1,186 1,357 1,508 1,672 1,855 4.21 4.26 3.93 2.69 2.11 2.07 2.07<br />
Ranchi 607 712 844 990 1,119 1,243 1,380 1,533 3.21 3.39 3.19 2.45 2.11 2.10 2.10<br />
Salem 574 647 736 834 932 1,035 1,152 1,281 2.38 2.58 2.51 2.22 2.11 2.13 2.12<br />
Solapur 613 720 853 1,002 1,133 1,258 1,398 1,552 3.20 3.41 3.21 2.45 2.10 2.10 2.10<br />
Srinagar 730 833 954 1,088 1,216 1,349 1,497 1,662 2.62 2.72 2.62 2.23 2.07 2.09 2.09<br />
Surat 1,468 1,984 2,699 3,558 4,168 4,607 5,071 5,579 6.01 6.16 5.53 3.16 2.01 1.92 1.91<br />
Thiruvananthapuram 801 853 885 927 1,006 1,114 1,239 1,377 1.25 0.73 0.93 1.65 2.04 2.12 2.11<br />
Tiruchirappalli 705 768 837 916 1,010 1,120 1,245 1,383 1.71 1.74 1.79 1.95 2.07 2.12 2.11<br />
Tiruppur 299 392 523 678 795 888 989 1,101 5.43 5.73 5.19 3.19 2.22 2.15 2.15<br />
Vadodara 1,096 1,273 1,465 1,676 1,872 2,071 2,292 2,536 2.99 2.81 2.69 2.22 2.02 2.03 2.03<br />
Varanasi (Benares) 1,013 1,106 1,199 1,303 1,432 1,584 1,756 1,947 1.75 1.62 1.67 1.88 2.02 2.07 2.06<br />
Vijayawada 821 914 999 1,095 1,207 1,337 1,484 1,647 2.14 1.79 1.82 1.95 2.05 2.09 2.09<br />
Visakhapatnam 1,018 1,168 1,309 1,465 1,625 1,798 1,992 2,206 2.73 2.29 2.25 2.07 2.02 2.05 2.05<br />
InDOnESIA<br />
Bandar Lampung 454 578 743 790 799 842 903 972 4.84 5.01 1.22 0.23 1.03 1.41 1.47<br />
Bandung 2,035 2,097 2,138 2,280 2,412 2,568 2,739 2,925 0.59 0.39 1.29 1.13 1.25 1.29 1.31<br />
Bogor 596 668 751 880 1,044 1,162 1,251 1,344 2.26 2.36 3.17 3.41 2.14 1.48 1.43<br />
Jakarta 8,175 8,322 8,390 8,795 9,210 9,709 10,256 10,850 0.36 0.16 0.94 0.92 1.05 1.10 1.13<br />
Malang 689 725 757 773 786 830 891 959 1.03 0.88 0.40 0.35 1.08 1.42 1.48<br />
Medan 1,718 1,816 1,912 2,023 2,131 2,266 2,419 2,586 1.11 1.03 1.13 1.04 1.23 1.30 1.33<br />
Palembang 1,130 1,287 1,459 1,331 1,244 1,271 1,356 1,456 2.59 2.51 -1.83 -1.35 0.43 1.30 1.41<br />
Pekan Baru 389 481 588 699 769 834 898 967 4.26 4.02 3.47 1.89 1.63 1.47 1.48<br />
Semarang 1,243 1,333 1,427 1,359 1,296 1,334 1,424 1,528 1.40 1.36 -0.98 -0.94 0.57 1.31 1.41<br />
Surabaya 2,467 2,544 2,611 2,623 2,509 2,576 2,738 2,923 0.62 0.51 0.09 -0.89 0.53 1.22 1.31<br />
Ujung Pandang 816 918 1,031 1,159 1,294 1,409 1,512 1,621 2.35 2.34 2.34 2.21 1.69 1.41 1.40<br />
IRAn (ISLAmIC REPUBLIC <strong>OF</strong>)<br />
Ahvaz 685 784 868 960 1,060 1,160 1,249 1,317 2.69 2.03 2.01 1.99 1.80 1.48 1.07<br />
Esfahan 1,094 1,230 1,382 1,553 1,742 1,914 2,056 2,161 2.33 2.33 2.34 2.29 1.89 1.43 1.00<br />
Karaj 693 903 1,087 1,317 1,584 1,796 1,937 2,038 5.30 3.70 3.84 3.69 2.52 1.52 1.01<br />
Kermanshah 608 675 729 781 837 905 974 1,029 2.11 1.55 1.36 1.40 1.55 1.48 1.10<br />
Mashhad 1,680 1,854 2,073 2,348 2,652 2,919 3,128 3,277 1.97 2.23 2.50 2.43 1.92 1.38 0.94<br />
Qom 622 744 843 938 1,042 1,143 1,232 1,299 3.56 2.49 2.14 2.11 1.85 1.49 1.07<br />
Shiraz 946 1,030 1,115 1,203 1,299 1,406 1,510 1,590 1.70 1.58 1.52 1.54 1.58 1.42 1.04<br />
Tabriz 1,058 1,165 1,264 1,369 1,483 1,606 1,724 1,814 1.91 1.64 1.59 1.60 1.60 1.41 1.02<br />
Tehran 6,365 6,687 6,880 7,044 7,241 7,614 8,059 8,387 0.99 0.57 0.47 0.55 1.00 1.14 0.80<br />
IRAQ<br />
Table 4<br />
City population and city population growth rate of urban agglomerations with 750,000 Inhabitants or More in 2009,<br />
by Country, 1950-2025 (thousands)<br />
Al-Basrah (Basra) 474 631 759 837 923 1,023 1,139 1,267 5.71 3.68 1.96 1.96 2.05 2.15 2.14<br />
Al-Mawsil (Mosul) 736 889 1,056 1,236 1,447 1,676 1,885 2,092 3.78 3.44 3.15 3.15 2.94 2.35 2.08<br />
Baghdad 4,092 4,598 5,200 5,327 5,891 6,614 7,321 8,043 2.34 2.46 0.48 2.01 2.32 2.03 1.88<br />
Irbil (Erbil) 536 644 757 874 1,009 1,158 1,301 1,447 3.65 3.23 2.88 2.88 2.74 2.33 2.13<br />
Sulaimaniya 402 483 580 696 836 988 1,121 1,249 3.66 3.66 3.66 3.66 3.34 2.52 2.17<br />
2000-<br />
2005<br />
2005-<br />
2010<br />
2010-<br />
2015<br />
2015-<br />
2020<br />
2020-<br />
2025
Country/City<br />
IRELAnD<br />
City Population of<br />
Urban Agglomerations (’000)<br />
1990 1995 2000 2005 2010 2015 2020 2025<br />
137<br />
1990-<br />
1995<br />
1995-<br />
2000<br />
City Population Growth Rate of<br />
Urban Agglomerations (%)<br />
2000-<br />
2005<br />
2005-<br />
2010<br />
2010-<br />
2015<br />
Statistical Annex<br />
Dublin 916 946 989 1,037 1,099 1,179 1,261 1,337 0.65 0.87 0.96 1.15 1.42 1.34 1.17<br />
ISRAEL<br />
Hefa (Haifa) 582 775 888 992 1,036 1,089 1,144 1,195 5.74 2.73 2.22 0.87 0.98 0.99 0.87<br />
Jerusalem 522 610 651 712 782 850 901 944 3.12 1.31 1.76 1.89 1.66 1.17 0.92<br />
Tel Aviv-Yafo<br />
(Tel Aviv-Jaffa)<br />
ITALy<br />
2015-<br />
2020<br />
2,026 2,442 2,752 3,012 3,272 3,515 3,689 3,823 3.73 2.39 1.81 1.65 1.44 0.96 0.71<br />
Milano (Milan) 3,063 3,020 2,985 2,956 2,967 2,980 2,981 2,981 -0.28 -0.23 -0.19 0.07 0.09 0.00 0.00<br />
Napoli (Naples) 2,208 2,218 2,232 2,248 2,276 2,292 2,293 2,293 0.09 0.13 0.14 0.24 0.14 0.01 0.00<br />
Palermo 844 850 855 861 875 887 891 896 0.14 0.12 0.15 0.32 0.27 0.10 0.09<br />
Roma (Rome) 3,450 3,425 3,385 3,352 3,362 3,375 3,376 3,376 -0.14 -0.24 -0.20 0.06 0.08 0.00 0.00<br />
Torino (Turin) 1,775 1,733 1,694 1,662 1,665 1,678 1,679 1,680 -0.48 -0.45 -0.38 0.03 0.15 0.02 0.01<br />
jAPAn<br />
Fukuoka-Kitakyushu 2,487 2,619 2,716 2,771 2,816 2,833 2,834 2,834 1.04 0.73 0.40 0.33 0.12 0.01 0.00<br />
Hiroshima 1,986 2,040 2,044 2,063 2,081 2,088 2,088 2,088 0.54 0.04 0.19 0.17 0.06 0.01 0.00<br />
Kyoto 1,760 1,804 1,806 1,805 1,804 1,804 1,804 1,804 0.49 0.02 -0.01 -0.01 -0.00 -0.00 —<br />
Nagoya 2,947 3,055 3,122 3,199 3,267 3,292 3,295 3,295 0.71 0.44 0.49 0.42 0.15 0.02 0.00<br />
Osaka-Kobe 11,035 11,052 11,165 11,258 11,337 11,365 11,368 11,368 0.03 0.20 0.17 0.14 0.05 0.01 0.00<br />
Sapporo 2,319 2,476 2,508 2,601 2,687 2,718 2,721 2,721 1.31 0.26 0.73 0.65 0.23 0.02 0.00<br />
Sendai 2,021 2,135 2,184 2,284 2,376 2,410 2,413 2,413 1.09 0.46 0.90 0.79 0.28 0.03 0.00<br />
Tokyo 32,530 33,587 34,450 35,622 36,669 37,049 37,088 37,088 0.64 0.51 0.67 0.58 0.21 0.02 0.00<br />
jORDAn<br />
Amman 851 973 1,007 1,042 1,105 1,186 1,272 1,364 2.67 0.68 0.68 1.19 1.41 1.39 1.40<br />
kAzAkHSTAn<br />
Almaty 1,080 1,109 1,159 1,267 1,383 1,482 1,554 1,612 0.52 0.90 1.78 1.75 1.38 0.95 0.72<br />
kEnyA<br />
Mombasa 476 572 687 830 1,003 1,216 1,479 1,795 3.65 3.67 3.79 3.78 3.86 3.91 3.87<br />
Nairobi 1,380 1,755 2,230 2,814 3,523 4,303 5,192 6,246 4.81 4.79 4.65 4.50 4.00 3.76 3.69<br />
kUWAIT<br />
Al Kuwayt (Kuwait City) 1,392 1,190 1,499 1,888 2,305 2,592 2,790 2,956 -3.13 4.62 4.61 3.99 2.35 1.47 1.16<br />
kyRgyzSTAn<br />
Bishkek 635 703 770 820 864 912 967 1,034 2.03 1.82 1.27 1.03 1.08 1.17 1.36<br />
LAO PEOPLE’S DEmOCRATIC REPUBLIC<br />
Vientiane 451 533 612 702 831 1,035 1,270 1,501 3.32 2.75 2.75 3.39 4.39 4.08 3.35<br />
LEBAnOn<br />
Bayrut (Beirut) 1,293 1,268 1,487 1,777 1,937 2,033 2,090 2,135 -0.39 3.19 3.57 1.72 0.97 0.55 0.42<br />
LIBERIA<br />
Table 4<br />
City population and city population growth rate of urban agglomerations with 750,000 Inhabitants or More in 2009,<br />
by Country, 1950-2025 (thousands)<br />
Monrovia 1,042 464 836 1,202 827 728 807 932 -16.18 11.76 7.27 -7.47 -2.56 2.06 2.88<br />
LIByAn ARAB jAmAHIRIyA<br />
Tarabulus (Tripoli) 862 984 1,022 1,059 1,108 1,192 1,286 1,364 2.64 0.77 0.71 0.89 1.48 1.51 1.17<br />
mADAgASCAR<br />
Antananarivo 948 1,169 1,361 1,590 1,879 2,235 2,658 3,148 4.20 3.04 3.10 3.34 3.47 3.46 3.39<br />
2020-<br />
2025
State of the World’s Cities <strong>2012</strong>/<strong>2013</strong><br />
Country/City<br />
mALAWI<br />
City Population of<br />
Urban Agglomerations (’000)<br />
1990 1995 2000 2005 2010 2015 2020 2025<br />
138<br />
1990-<br />
1995<br />
1995-<br />
2000<br />
City Population Growth Rate of<br />
Urban Agglomerations (%)<br />
Blantyre-Limbe 370 446 538 667 856 1,103 1,407 1,766 3.73 3.74 4.30 4.99 5.06 4.87 4.55<br />
Lilongwe 266 362 493 662 865 1,115 1,422 1,784 6.17 6.17 5.89 5.35 5.08 4.87 4.54<br />
mALAySIA<br />
Johore Bharu 417 516 630 797 999 1,175 1,295 1,382 4.28 4.01 4.68 4.53 3.25 1.94 1.31<br />
Klang 345 466 631 849 1,128 1,361 1,503 1,603 6.01 6.07 5.93 5.68 3.75 1.99 1.29<br />
Kuala Lumpur 1,120 1,213 1,306 1,405 1,519 1,670 1,820 1,938 1.58 1.47 1.47 1.56 1.89 1.72 1.26<br />
mALI<br />
Bamako 746 910 1,110 1,368 1,699 2,086 2,514 2,971 3.96 3.97 4.19 4.32 4.11 3.73 3.35<br />
mExICO<br />
Table 4<br />
City population and city population growth rate of urban agglomerations with 750,000 Inhabitants or More in 2009,<br />
by Country, 1950-2025 (thousands)<br />
Aguascalientes 552 631 734 829 926 995 1,039 1,073 2.69 3.02 2.42 2.23 1.43 0.86 0.66<br />
Chihuahua 539 625 683 760 840 899 939 971 2.94 1.77 2.15 2.00 1.36 0.87 0.67<br />
Ciudad de México<br />
(Mexico City)<br />
15,312 16,811 18,022 18,735 19,460 20,078 20,476 20,713 1.87 1.39 0.78 0.76 0.62 0.39 0.23<br />
Ciudad Juárez 809 997 1,225 1,308 1,394 1,470 1,528 1,575 4.19 4.11 1.32 1.28 1.05 0.77 0.60<br />
Culiacán 606 690 749 791 836 881 918 950 2.60 1.63 1.10 1.11 1.04 0.84 0.68<br />
Guadalajara 3,011 3,431 3,703 4,051 4,402 4,648 4,796 4,902 2.61 1.53 1.80 1.66 1.08 0.63 0.44<br />
Hermosillo 454 552 616 697 781 840 878 909 3.89 2.19 2.48 2.28 1.46 0.89 0.68<br />
León de los Aldamas 961 1,127 1,290 1,429 1,571 1,673 1,739 1,791 3.19 2.70 2.04 1.90 1.26 0.78 0.58<br />
Mérida 664 765 848 931 1,015 1,081 1,127 1,164 2.83 2.06 1.85 1.74 1.25 0.83 0.65<br />
Mexicali 607 690 770 851 934 997 1,040 1,075 2.57 2.21 1.99 1.86 1.30 0.85 0.66<br />
Monterrey 2,594 2,961 3,266 3,579 3,896 4,118 4,253 4,351 2.65 1.96 1.83 1.70 1.11 0.65 0.46<br />
Puebla 1,686 1,692 1,907 2,109 2,315 2,460 2,551 2,620 0.07 2.40 2.02 1.86 1.22 0.72 0.53<br />
Querétaro 561 671 795 911 1,031 1,111 1,160 1,198 3.58 3.39 2.71 2.47 1.51 0.86 0.64<br />
Saltillo 491 577 643 720 801 859 897 928 3.21 2.16 2.28 2.11 1.40 0.88 0.68<br />
San Luis Potosí 665 774 858 952 1,049 1,120 1,168 1,206 3.04 2.06 2.09 1.94 1.32 0.84 0.64<br />
Tampico 563 609 659 709 761 806 842 871 1.54 1.60 1.46 1.41 1.16 0.86 0.69<br />
Tijuana 760 1,017 1,287 1,472 1,664 1,789 1,861 1,915 5.82 4.71 2.69 2.44 1.45 0.79 0.58<br />
Toluca de Lerdo 835 981 1,417 1,498 1,582 1,661 1,725 1,776 3.22 7.35 1.11 1.10 0.98 0.75 0.59<br />
Torreón<br />
mOngOLIA<br />
882 954 1,014 1,105 1,199 1,273 1,325 1,367 1.55 1.22 1.73 1.63 1.19 0.81 0.62<br />
Ulaanbaatar<br />
mOROCCO<br />
572 661 764 873 966 1,050 1,129 1,202 2.90 2.90 2.67 2.03 1.66 1.47 1.25<br />
Agadir 403 536 609 693 783 869 948 1,020 5.70 2.58 2.57 2.44 2.07 1.75 1.46<br />
Dar-el-Beida (Casablanca) 2,682 2,951 3,043 3,138 3,284 3,537 3,816 4,065 1.91 0.62 0.62 0.91 1.49 1.52 1.26<br />
Fès 685 785 870 963 1,065 1,173 1,277 1,371 2.72 2.04 2.04 2.02 1.92 1.70 1.42<br />
Marrakech 578 681 755 837 928 1,023 1,114 1,198 3.26 2.07 2.07 2.06 1.95 1.72 1.44<br />
Rabat 1,174 1,379 1,507 1,647 1,802 1,973 2,139 2,288 3.22 1.77 1.77 1.80 1.81 1.62 1.35<br />
Tanger<br />
mOzAmBIQUE<br />
423 510 591 686 788 877 958 1,030 3.73 2.98 2.98 2.75 2.16 1.75 1.46<br />
Maputo 776 921 1,096 1,341 1,655 1,994 2,350 2,722 3.43 3.47 4.03 4.21 3.73 3.29 2.94<br />
Matola 319 401 504 636 793 961 1,139 1,326 4.55 4.56 4.68 4.41 3.84 3.39 3.04<br />
2000-<br />
2005<br />
2005-<br />
2010<br />
2010-<br />
2015<br />
2015-<br />
2020<br />
2020-<br />
2025
Country/City<br />
myAnmAR<br />
City Population of<br />
Urban Agglomerations (’000)<br />
1990 1995 2000 2005 2010 2015 2020 2025<br />
139<br />
1990-<br />
1995<br />
1995-<br />
2000<br />
City Population Growth Rate of<br />
Urban Agglomerations (%)<br />
2000-<br />
2005<br />
2005-<br />
2010<br />
2010-<br />
2015<br />
Statistical Annex<br />
Mandalay 636 718 810 915 1,034 1,176 1,331 1,484 2.43 2.43 2.43 2.45 2.57 2.48 2.18<br />
Nay Pyi Taw — — — 57 1,024 1,185 1,344 1,499 — — — 57.77 2.92 2.52 2.18<br />
Yangon 2,907 3,213 3,553 3,928 4,350 4,873 5,456 6,022 2.01 2.01 2.01 2.04 2.27 2.26 1.98<br />
nEPAL<br />
Kathmandu 398 509 644 817 1,037 1,295 1,589 1,915 4.92 4.70 4.76 4.78 4.44 4.10 3.73<br />
nE<strong>THE</strong>RLAnDS<br />
Amsterdam 936 988 1,005 1,023 1,049 1,076 1,097 1,110 1.09 0.34 0.37 0.49 0.50 0.40 0.23<br />
Rotterdam 951 981 991 1,000 1,010 1,026 1,044 1,057 0.62 0.19 0.19 0.19 0.31 0.36 0.24<br />
nEW zEALAnD<br />
Auckland 870 976 1,063 1,189 1,404 1,566 1,631 1,671 2.30 1.71 2.24 3.33 2.17 0.82 0.48<br />
nICARAgUA<br />
Managua 735 865 887 909 944 1,015 1,103 1,192 3.26 0.50 0.50 0.74 1.46 1.67 1.54<br />
nIgER<br />
Niamey 432 542 680 848 1,048 1,302 1,643 2,105 4.54 4.55 4.42 4.22 4.35 4.65 4.96<br />
nIgERIA<br />
Aba 484 545 614 691 785 914 1,058 1,203 2.38 2.38 2.38 2.55 3.04 2.93 2.57<br />
Abuja 330 526 832 1,315 1,995 2,563 2,977 3,361 9.31 9.16 9.16 8.33 5.01 3.00 2.43<br />
Benin City 689 845 975 1,124 1,302 1,523 1,758 1,992 4.08 2.85 2.85 2.95 3.13 2.88 2.50<br />
Ibadan 1,739 1,993 2,236 2,509 2,837 3,276 3,760 4,237 2.73 2.30 2.30 2.46 2.88 2.75 2.39<br />
Ilorin 515 580 653 735 835 972 1,125 1,279 2.38 2.38 2.38 2.55 3.03 2.92 2.56<br />
Jos 493 556 627 706 802 934 1,081 1,229 2.39 2.39 2.39 2.56 3.04 2.93 2.57<br />
Kaduna 961 1,083 1,220 1,375 1,561 1,811 2,087 2,362 2.39 2.39 2.39 2.55 2.97 2.84 2.48<br />
Kano 2,095 2,360 2,658 2,993 3,395 3,922 4,495 5,060 2.38 2.38 2.38 2.52 2.89 2.73 2.37<br />
Lagos 4,764 5,966 7,233 8,767 10,578 12,427 14,162 15,810 4.50 3.85 3.85 3.76 3.22 2.61 2.20<br />
Maiduguri 598 673 758 854 970 1,127 1,303 1,480 2.37 2.37 2.37 2.54 3.01 2.90 2.54<br />
Ogbomosho 622 704 798 904 1,032 1,201 1,389 1,576 2.49 2.49 2.49 2.65 3.04 2.90 2.53<br />
Port Harcourt 680 766 863 972 1,104 1,283 1,482 1,681 2.38 2.38 2.38 2.55 3.00 2.88 2.52<br />
Zaria 592 667 752 847 963 1,120 1,295 1,471 2.39 2.39 2.39 2.56 3.02 2.90 2.54<br />
nORWAy<br />
Oslo 684 729 774 818 888 946 985 1,019 1.28 1.19 1.12 1.64 1.25 0.82 0.68<br />
PAkISTAn<br />
Table 4<br />
City population and city population growth rate of urban agglomerations with 750,000 Inhabitants or More in 2009,<br />
by Country, 1950-2025 (thousands)<br />
Faisalabad 1,520 1,804 2,140 2,496 2,849 3,252 3,704 4,200 3.43 3.41 3.08 2.64 2.65 2.60 2.51<br />
Gujranwala 848 1,019 1,224 1,441 1,652 1,893 2,165 2,464 3.69 3.67 3.26 2.74 2.72 2.68 2.59<br />
Hyderabad 950 1,077 1,222 1,394 1,590 1,822 2,084 2,373 2.51 2.52 2.64 2.64 2.73 2.68 2.60<br />
Islamabad 343 452 595 737 856 985 1,132 1,295 5.54 5.47 4.28 3.00 2.83 2.77 2.68<br />
Karachi 7,147 8,467 10,021 11,618 13,125 14,818 16,693 18,725 3.39 3.37 2.96 2.44 2.43 2.38 2.30<br />
Lahore 3,970 4,653 5,449 6,294 7,132 8,087 9,150 10,308 3.17 3.16 2.88 2.50 2.51 2.47 2.38<br />
Multan 953 1,097 1,263 1,453 1,659 1,901 2,174 2,474 2.82 2.83 2.80 2.66 2.72 2.68 2.59<br />
Peshawar 769 905 1,066 1,242 1,422 1,632 1,868 2,128 3.27 3.27 3.05 2.72 2.74 2.70 2.61<br />
Quetta 414 504 614 729 841 968 1,113 1,272 3.96 3.93 3.45 2.85 2.82 2.78 2.69<br />
Rawalpindi 1,087 1,286 1,520 1,772 2,026 2,318 2,646 3,008 3.36 3.34 3.07 2.68 2.69 2.65 2.56<br />
2015-<br />
2020<br />
2020-<br />
2025
State of the World’s Cities <strong>2012</strong>/<strong>2013</strong><br />
Country/City<br />
PAnAmA<br />
Table 4<br />
City population and city population growth rate of urban agglomerations with 750,000 Inhabitants or More in 2009,<br />
by Country, 1950-2025 (thousands)<br />
City Population of<br />
Urban Agglomerations (’000)<br />
1990 1995 2000 2005 2010 2015 2020 2025<br />
140<br />
1990-<br />
1995<br />
1995-<br />
2000<br />
City Population Growth Rate of<br />
Urban Agglomerations (%)<br />
Ciudad de Panamá<br />
(Panama City)<br />
PARAgUAy<br />
847 953 1,072 1,216 1,378 1,527 1,652 1,758 2.36 2.36 2.51 2.51 2.04 1.59 1.24<br />
Asunción<br />
PERU<br />
1,091 1,287 1,507 1,762 2,030 2,277 2,505 2,715 3.32 3.15 3.13 2.83 2.30 1.91 1.61<br />
Arequipa 564 628 678 732 789 848 903 953 2.17 1.52 1.52 1.52 1.43 1.25 1.09<br />
Lima<br />
PHILIPPInES<br />
5,837 6,582 7,294 8,081 8,941 9,659 10,145 10,530 2.40 2.05 2.05 2.02 1.55 0.98 0.75<br />
Cebu 612 661 721 787 860 945 1,046 1,162 1.53 1.75 1.76 1.77 1.89 2.04 2.09<br />
Davao 854 1,001 1,152 1,325 1,519 1,701 1,881 2,080 3.17 2.81 2.80 2.72 2.27 2.02 2.01<br />
Manila 7,973 9,401 9,958 10,761 11,628 12,587 13,687 14,916 3.30 1.15 1.55 1.55 1.58 1.68 1.72<br />
Zamboanga<br />
POLAnD<br />
444 509 605 721 854 973 1,082 1,201 2.71 3.47 3.50 3.38 2.61 2.13 2.09<br />
Kraków (Cracow) 735 748 756 757 756 756 756 756 0.35 0.21 0.04 -0.03 -0.01 -0.00 -0.00<br />
Warszawa (Warsaw)<br />
PORTUgAL<br />
1,628 1,652 1,666 1,693 1,712 1,720 1,722 1,722 0.29 0.17 0.33 0.22 0.09 0.02 0.00<br />
Lisboa (Lisbon) 2,537 2,600 2,672 2,747 2,824 2,907 2,973 3,009 0.49 0.55 0.55 0.55 0.58 0.45 0.24<br />
Porto<br />
PUERTO RICO<br />
1,164 1,206 1,254 1,303 1,355 1,407 1,448 1,473 0.72 0.77 0.77 0.77 0.76 0.57 0.35<br />
San Juan<br />
REPUBLIC <strong>OF</strong> kOREA<br />
1,539 1,855 2,237 2,601 2,743 2,763 2,763 2,763 3.74 3.74 3.01 1.07 0.14 0.00 —<br />
Bucheon 651 771 763 833 909 948 960 961 3.39 -0.23 1.77 1.73 0.85 0.24 0.03<br />
Busan 3,778 3,813 3,673 3,533 3,425 3,407 3,409 3,409 0.18 -0.75 -0.78 -0.62 -0.11 0.01 0.00<br />
Daegu 2,215 2,434 2,478 2,466 2,458 2,474 2,481 2,481 1.88 0.36 -0.10 -0.06 0.12 0.06 0.00<br />
Daejon 1,036 1,256 1,362 1,438 1,509 1,550 1,562 1,562 3.85 1.62 1.09 0.97 0.54 0.15 0.01<br />
Goyang 241 493 744 859 961 1,012 1,025 1,026 14.28 8.25 2.88 2.23 1.03 0.25 0.02<br />
Gwangju 1,122 1,249 1,346 1,413 1,476 1,513 1,524 1,525 2.16 1.49 0.97 0.86 0.50 0.15 0.01<br />
Incheon 1,785 2,271 2,464 2,527 2,583 2,621 2,630 2,631 4.82 1.62 0.51 0.43 0.29 0.07 0.00<br />
Seongnam 534 842 911 934 955 974 983 984 9.10 1.59 0.48 0.45 0.39 0.19 0.02<br />
Seoul 10,544 10,256 9,917 9,825 9,773 9,767 9,767 9,767 -0.55 -0.67 -0.19 -0.11 -0.01 -0.00 -0.00<br />
Suweon 628 748 932 1,037 1,132 1,180 1,193 1,194 3.50 4.42 2.13 1.74 0.84 0.21 0.01<br />
Ulsan<br />
ROmAnIA<br />
673 945 1,011 1,047 1,081 1,106 1,116 1,117 6.80 1.36 0.69 0.65 0.45 0.18 0.02<br />
Bucuresti (Bucharest)<br />
RUSSIAn FEDERATIOn<br />
2,040 2,018 1,949 1,931 1,934 1,947 1,959 1,963 -0.21 -0.69 -0.19 0.03 0.12 0.13 0.05<br />
Chelyabinsk 1,129 1,104 1,082 1,094 1,094 1,095 1,095 1,095 -0.45 -0.40 0.21 0.01 0.01 0.00 0.00<br />
Kazan 1,092 1,092 1,096 1,112 1,140 1,159 1,164 1,164 -0.01 0.07 0.29 0.49 0.35 0.08 0.00<br />
Krasnoyarsk 910 911 911 920 961 991 998 999 0.02 0.02 0.18 0.88 0.62 0.14 0.01<br />
Moskva (Moscow) 8,987 9,201 10,005 10,418 10,550 10,641 10,662 10,663 0.47 1.67 0.81 0.25 0.17 0.04 0.00<br />
Nizhniy Novgorod 1,420 1,375 1,331 1,286 1,267 1,256 1,253 1,253 -0.65 -0.65 -0.69 -0.29 -0.19 -0.04 -0.00<br />
Novosibirsk 1,430 1,428 1,426 1,400 1,397 1,397 1,398 1,398 -0.03 -0.03 -0.38 -0.04 0.00 0.00 0.00<br />
Omsk 1,144 1,140 1,136 1,140 1,124 1,114 1,112 1,112 -0.07 -0.07 0.08 -0.28 -0.18 -0.04 -0.00<br />
Perm 1,076 1,044 1,014 992 982 974 972 972 -0.59 -0.59 -0.43 -0.20 -0.16 -0.04 -0.00<br />
Rostov-na-Donu<br />
(Rostov-on-Don)<br />
1,022 1,041 1,061 1,056 1,046 1,040 1,038 1,038 0.38 0.38 -0.10 -0.19 -0.12 -0.03 -0.00<br />
2000-<br />
2005<br />
2005-<br />
2010<br />
2010-<br />
2015<br />
2015-<br />
2020<br />
2020-<br />
2025
Country/City<br />
Table 4<br />
City Population of<br />
Urban Agglomerations (’000)<br />
1990 1995 2000 2005 2010 2015 2020 2025<br />
141<br />
1990-<br />
1995<br />
1995-<br />
2000<br />
City Population Growth Rate of<br />
Urban Agglomerations (%)<br />
2000-<br />
2005<br />
2005-<br />
2010<br />
2010-<br />
2015<br />
Statistical Annex<br />
City population and city population growth rate of urban agglomerations with 750,000 Inhabitants or More in 2009,<br />
by Country, 1950-2025 (thousands)<br />
Samara 1,244 1,208 1,173 1,146 1,131 1,121 1,119 1,119 -0.58 -0.58 -0.48 -0.27 -0.16 -0.04 -0.00<br />
Sankt Peterburg<br />
(Saint Petersburg)<br />
4,989 4,836 4,719 4,598 4,575 4,561 4,557 4,557 -0.62 -0.49 -0.52 -0.10 -0.06 -0.01 -0.00<br />
Saratov 901 890 878 853 822 802 798 797 -0.25 -0.25 -0.60 -0.74 -0.49 -0.11 -0.01<br />
Ufa 1,078 1,063 1,049 1,032 1,023 1,017 1,016 1,016 -0.27 -0.27 -0.33 -0.18 -0.10 -0.02 -0.00<br />
Volgograd 999 1,005 1,010 994 977 967 965 964 0.11 0.11 -0.32 -0.34 -0.21 -0.05 -0.00<br />
Voronezh 880 867 854 847 842 839 838 838 -0.30 -0.30 -0.17 -0.12 -0.07 -0.02 -0.00<br />
Yekaterinburg<br />
RWAnDA<br />
1,350 1,326 1,303 1,307 1,344 1,370 1,376 1,377 -0.35 -0.35 0.06 0.56 0.39 0.09 0.00<br />
Kigali<br />
SAUDI ARABIA<br />
219 278 497 775 939 1,138 1,392 1,690 4.77 11.63 8.86 3.85 3.84 4.02 3.88<br />
Ad-Dammam 409 533 639 766 902 1,013 1,109 1,197 5.30 3.63 3.62 3.26 2.33 1.80 1.53<br />
Al-Madinah (Medina) 529 669 795 944 1,104 1,236 1,351 1,456 4.69 3.45 3.45 3.12 2.27 1.77 1.50<br />
Ar-Riyadh (Riyadh) 2,325 3,035 3,567 4,193 4,848 5,373 5,809 6,196 5.33 3.23 3.23 2.90 2.06 1.56 1.29<br />
Jiddah 1,742 2,200 2,509 2,860 3,234 3,569 3,868 4,138 4.66 2.63 2.62 2.46 1.97 1.61 1.35<br />
Makkah (Mecca)<br />
SEnEgAL<br />
856 1,033 1,168 1,319 1,484 1,642 1,789 1,924 3.76 2.45 2.45 2.35 2.02 1.72 1.46<br />
Dakar<br />
SERBIA<br />
1,405 1,688 2,029 2,434 2,863 3,308 3,796 4,338 3.67 3.68 3.64 3.25 2.89 2.75 2.67<br />
Beograd (Belgrade)<br />
SIERRA LEOnE<br />
1,130 1,128 1,122 1,116 1,117 1,131 1,149 1,168 -0.03 -0.11 -0.11 0.03 0.25 0.31 0.32<br />
Freetown<br />
SIngAPORE<br />
529 603 688 785 901 1,046 1,219 1,420 2.62 2.63 2.62 2.76 2.99 3.06 3.05<br />
Singapore<br />
SOmALIA<br />
3,016 3,480 4,018 4,267 4,837 5,059 5,219 5,362 2.86 2.88 1.20 2.51 0.90 0.63 0.54<br />
Muqdisho (Mogadishu)<br />
SOUTH AFRICA<br />
1,035 1,147 1,201 1,415 1,500 1,795 2,156 2,588 2.04 0.92 3.28 1.17 3.59 3.67 3.66<br />
Cape Town 2,155 2,394 2,715 3,091 3,405 3,579 3,701 3,824 2.10 2.52 2.59 1.93 1.00 0.67 0.65<br />
Durban 1,723 2,081 2,370 2,638 2,879 3,026 3,133 3,241 3.77 2.60 2.15 1.75 1.00 0.69 0.68<br />
Ekurhuleni (East Rand) 1,531 1,894 2,326 2,824 3,202 3,380 3,497 3,614 4.26 4.11 3.88 2.51 1.08 0.68 0.66<br />
Johannesburg 1,898 2,265 2,732 3,263 3,670 3,867 3,996 4,127 3.53 3.75 3.55 2.35 1.05 0.66 0.64<br />
Port Elizabeth 828 911 958 1,002 1,068 1,126 1,173 1,222 1.93 1.00 0.90 1.27 1.06 0.83 0.82<br />
Pretoria 911 951 1,084 1,274 1,429 1,514 1,575 1,637 0.85 2.61 3.24 2.29 1.16 0.79 0.77<br />
Vereeniging<br />
SPAIn<br />
743 800 897 1,029 1,143 1,211 1,262 1,313 1.48 2.30 2.75 2.09 1.16 0.82 0.81<br />
Barcelona 4,101 4,318 4,560 4,815 5,083 5,315 5,443 5,477 1.03 1.09 1.09 1.09 0.89 0.48 0.12<br />
Madrid 4,414 4,688 5,014 5,409 5,851 6,213 6,379 6,412 1.20 1.35 1.52 1.57 1.20 0.53 0.10<br />
Valencia<br />
SUDAn<br />
776 785 795 804 814 832 857 873 0.25 0.24 0.24 0.24 0.44 0.58 0.38<br />
Al-Khartum (Khartoum)<br />
SWEDEn<br />
2,360 3,242 3,949 4,518 5,172 6,046 7,005 7,953 6.35 3.95 2.69 2.70 3.12 2.95 2.54<br />
Stockholm<br />
SWITzERLAnD<br />
1,038 1,138 1,206 1,248 1,285 1,309 1,327 1,345 1.83 1.16 0.69 0.59 0.36 0.28 0.26<br />
Zürich (Zurich) 1,006 1,048 1,078 1,114 1,150 1,177 1,196 1,217 0.83 0.56 0.65 0.64 0.45 0.32 0.35<br />
2015-<br />
2020<br />
2020-<br />
2025
State of the World’s Cities <strong>2012</strong>/<strong>2013</strong><br />
Country/City<br />
SyRIAn ARAB REPUBLIC<br />
City Population of<br />
Urban Agglomerations (’000)<br />
1990 1995 2000 2005 2010 2015 2020 2025<br />
142<br />
1990-<br />
1995<br />
1995-<br />
2000<br />
City Population Growth Rate of<br />
Urban Agglomerations (%)<br />
Dimashq (Damascus) 1,691 1,854 2,063 2,294 2,597 2,918 3,213 3,534 1.85 2.13 2.13 2.48 2.33 1.93 1.90<br />
Halab (Aleppo) 1,554 1,864 2,204 2,605 3,087 3,510 3,864 4,244 3.64 3.35 3.35 3.39 2.57 1.92 1.88<br />
Hamah 309 361 495 676 897 1,060 1,180 1,307 3.12 6.27 6.26 5.65 3.34 2.14 2.05<br />
Hims (Homs) 565 684 856 1,072 1,328 1,536 1,702 1,881 3.83 4.49 4.49 4.29 2.91 2.06 1.99<br />
THAILAnD<br />
Krung Thep (Bangkok) 5,888 6,106 6,332 6,614 6,976 7,399 7,902 8,470 0.73 0.73 0.87 1.07 1.18 1.31 1.39<br />
TOgO<br />
Lomé 619 795 1,020 1,310 1,667 2,036 2,398 2,763 5.00 5.00 5.00 4.82 4.00 3.27 2.84<br />
TUnISIA<br />
Tunis 644 682 711 734 767 814 864 911 1.16 0.84 0.63 0.87 1.21 1.19 1.04<br />
TURkEy<br />
Adana 907 1,011 1,123 1,245 1,361 1,465 1,556 1,635 2.18 2.10 2.06 1.79 1.46 1.21 0.99<br />
Ankara 2,561 2,842 3,179 3,572 3,906 4,174 4,401 4,591 2.08 2.25 2.33 1.79 1.33 1.06 0.85<br />
Antalya 370 471 595 736 838 909 969 1,022 4.83 4.67 4.26 2.62 1.61 1.28 1.06<br />
Bursa 819 981 1,180 1,413 1,588 1,711 1,816 1,906 3.62 3.69 3.60 2.33 1.50 1.19 0.97<br />
Gaziantep 595 710 844 992 1,109 1,197 1,274 1,341 3.54 3.47 3.22 2.22 1.53 1.24 1.02<br />
Istanbul 6,552 7,665 8,744 9,710 10,525 11,164 11,689 12,108 3.14 2.63 2.10 1.61 1.18 0.92 0.70<br />
Izmir 1,741 1,966 2,216 2,487 2,723 2,917 3,083 3,224 2.43 2.39 2.31 1.81 1.38 1.11 0.90<br />
Konya 508 610 734 871 978 1,057 1,125 1,186 3.66 3.69 3.42 2.31 1.56 1.26 1.04<br />
UgAnDA<br />
Kampala 755 912 1,097 1,318 1,598 1,982 2,504 3,189 3.79 3.68 3.68 3.85 4.31 4.67 4.83<br />
UkRAInE<br />
Table 4<br />
City population and city population growth rate of urban agglomerations with 750,000 Inhabitants or More in 2009,<br />
by Country, 1950-2025 (thousands)<br />
Dnipropetrovsk 1,162 1,119 1,077 1,052 1,004 974 967 967 -0.77 -0.77 -0.47 -0.93 -0.61 -0.14 -0.01<br />
Donetsk 1,097 1,061 1,026 997 966 946 941 941 -0.67 -0.67 -0.57 -0.64 -0.41 -0.09 -0.01<br />
Kharkiv 1,586 1,534 1,484 1,464 1,453 1,446 1,444 1,444 -0.66 -0.66 -0.28 -0.15 -0.10 -0.02 -0.00<br />
Kyiv (Kiev) 2,574 2,590 2,606 2,673 2,805 2,894 2,914 2,915 0.13 0.13 0.51 0.96 0.63 0.14 0.01<br />
Odesa 1,092 1,064 1,037 1,007 1,009 1,010 1,011 1,011 -0.52 -0.52 -0.57 0.04 0.02 0.01 0.00<br />
Zaporizhzhya 873 847 822 797 775 761 758 758 -0.60 -0.60 -0.61 -0.56 -0.36 -0.08 -0.00<br />
UnITED ARAB EmIRATES<br />
Dubayy (Dubai) 473 650 906 1,264 1,567 1,772 1,934 2,076 6.36 6.64 6.67 4.30 2.46 1.76 1.42<br />
Sharjah 229 311 444 637 809 926 1,016 1,096 6.11 7.12 7.22 4.78 2.69 1.86 1.51<br />
UnITED kIngDOm<br />
Birmingham 2,301 2,291 2,285 2,283 2,302 2,337 2,375 2,415 -0.09 -0.05 -0.02 0.17 0.30 0.32 0.33<br />
Glasgow 1,217 1,186 1,171 1,160 1,170 1,193 1,218 1,245 -0.52 -0.26 -0.19 0.17 0.39 0.42 0.43<br />
Liverpool 831 829 818 811 819 837 857 878 -0.05 -0.26 -0.18 0.21 0.44 0.47 0.48<br />
London 7,654 7,908 8,225 8,506 8,631 8,693 8,753 8,816 0.65 0.79 0.67 0.29 0.14 0.14 0.14<br />
Manchester 2,282 2,264 2,248 2,237 2,253 2,287 2,325 2,364 -0.16 -0.14 -0.10 0.14 0.30 0.33 0.33<br />
Newcastle upon Tyne 877 883 880 880 891 911 932 954 0.14 -0.07 -0.01 0.26 0.43 0.46 0.47<br />
West Yorkshire 1,449 1,468 1,495 1,521 1,547 1,575 1,606 1,637 0.27 0.36 0.34 0.34 0.37 0.38 0.39<br />
UnITED REPUBLIC <strong>OF</strong> TAnzAnIA<br />
Dar es Salaam 1,316 1,668 2,116 2,680 3,349 4,153 5,103 6,202 4.75 4.75 4.73 4.46 4.30 4.12 3.90<br />
2000-<br />
2005<br />
2005-<br />
2010<br />
2010-<br />
2015<br />
2015-<br />
2020<br />
2020-<br />
2025
Country/City<br />
Table 4<br />
City Population of<br />
Urban Agglomerations (’000)<br />
1990 1995 2000 2005 2010 2015 2020 2025<br />
143<br />
1990-<br />
1995<br />
1995-<br />
2000<br />
City Population Growth Rate of<br />
Urban Agglomerations (%)<br />
2000-<br />
2005<br />
2005-<br />
2010<br />
2010-<br />
2015<br />
Statistical Annex<br />
City population and city population growth rate of urban agglomerations with 750,000 Inhabitants or More in 2009,<br />
by Country, 1950-2025 (thousands)<br />
UnITED <strong>STATE</strong>S <strong>OF</strong> AmERICA<br />
Atlanta 2,184 2,781 3,542 4,306 4,691 4,886 5,036 5,153 4.84 4.84 3.90 1.72 0.81 0.60 0.46<br />
Austin 569 720 913 1,107 1,215 1,277 1,329 1,373 4.73 4.73 3.87 1.85 1.00 0.80 0.65<br />
Baltimore 1,849 1,962 2,083 2,206 2,320 2,421 2,508 2,579 1.19 1.19 1.15 1.01 0.85 0.70 0.56<br />
Boston 3,428 3,726 4,049 4,363 4,593 4,773 4,920 5,034 1.66 1.66 1.49 1.03 0.77 0.61 0.46<br />
Bridgeport-Stamford 714 799 894 987 1,055 1,108 1,154 1,193 2.25 2.25 1.99 1.32 0.98 0.82 0.67<br />
Buffalo 955 966 977 1,000 1,045 1,096 1,142 1,181 0.23 0.23 0.45 0.89 0.95 0.82 0.67<br />
Charlotte 461 596 769 946 1,043 1,098 1,144 1,183 5.10 5.10 4.16 1.94 1.03 0.82 0.67<br />
Chicago 7,374 7,839 8,333 8,818 9,204 9,513 9,758 9,936 1.22 1.22 1.13 0.86 0.66 0.51 0.36<br />
Cincinnati 1,335 1,419 1,508 1,600 1,686 1,764 1,831 1,887 1.22 1.22 1.19 1.05 0.90 0.75 0.60<br />
Cleveland 1,680 1,734 1,789 1,856 1,942 2,029 2,104 2,166 0.63 0.63 0.73 0.90 0.87 0.73 0.58<br />
Columbus, Ohio 950 1,040 1,138 1,236 1,313 1,376 1,432 1,478 1.81 1.81 1.65 1.21 0.95 0.79 0.64<br />
Dallas-Fort Worth 3,219 3,665 4,172 4,657 4,951 5,145 5,301 5,421 2.59 2.59 2.20 1.22 0.77 0.60 0.45<br />
Dayton 616 659 706 754 800 841 878 909 1.37 1.37 1.33 1.17 1.01 0.86 0.71<br />
Denver-Aurora 1,528 1,747 1,998 2,240 2,394 2,501 2,590 2,662 2.68 2.68 2.29 1.33 0.87 0.70 0.55<br />
Detroit 3,703 3,804 3,909 4,036 4,200 4,363 4,500 4,608 0.54 0.54 0.64 0.80 0.76 0.62 0.47<br />
El Paso 573 623 678 732 779 820 856 887 1.67 1.67 1.56 1.23 1.02 0.86 0.71<br />
Hartford 783 818 853 894 942 989 1,031 1,067 0.86 0.86 0.93 1.04 0.98 0.83 0.68<br />
Honolulu 635 676 720 767 812 854 891 923 1.27 1.27 1.25 1.14 1.00 0.85 0.71<br />
Houston 2,922 3,353 3,849 4,322 4,605 4,789 4,937 5,051 2.76 2.76 2.32 1.27 0.78 0.61 0.46<br />
Indianapolis 921 1,063 1,228 1,387 1,490 1,562 1,623 1,674 2.87 2.87 2.45 1.42 0.94 0.77 0.62<br />
Jacksonville, Florida 742 811 886 962 1,022 1,074 1,119 1,157 1.78 1.78 1.63 1.23 0.98 0.82 0.67<br />
Kansas City 1,233 1,297 1,365 1,438 1,513 1,584 1,645 1,697 1.02 1.02 1.04 1.02 0.91 0.77 0.62<br />
Las Vegas 708 973 1,335 1,721 1,916 2,011 2,086 2,147 6.34 6.34 5.08 2.14 0.97 0.73 0.58<br />
Los Angeles-<br />
Long Beach-Santa Ana<br />
10,883 11,339 11,814 12,303 12,762 13,156 13,463 13,677 0.82 0.82 0.81 0.73 0.61 0.46 0.32<br />
Louisville 757 810 866 925 979 1,028 1,071 1,108 1.34 1.34 1.30 1.14 0.98 0.83 0.68<br />
McAllen 268 377 532 701 789 833 870 901 6.87 6.87 5.51 2.36 1.10 0.86 0.71<br />
Memphis 829 899 976 1,053 1,117 1,173 1,221 1,262 1.64 1.64 1.52 1.19 0.97 0.81 0.66<br />
Miami 3,969 4,431 4,946 5,436 5,750 5,967 6,142 6,275 2.20 2.20 1.89 1.12 0.74 0.58 0.43<br />
Milwaukee 1,228 1,269 1,311 1,362 1,428 1,495 1,554 1,603 0.65 0.65 0.76 0.94 0.91 0.77 0.63<br />
Minneapolis-St. Paul 2,087 2,236 2,397 2,557 2,693 2,808 2,905 2,984 1.38 1.39 1.30 1.03 0.84 0.68 0.54<br />
Nashville-Davidson 577 660 755 848 911 958 999 1,034 2.69 2.69 2.32 1.44 1.01 0.84 0.69<br />
New Orleans 1,039 1,024 1,009 996 858 921 984 1,044 -0.30 -0.30 -0.26 -2.99 1.43 1.33 1.18<br />
New York-Newark 16,086 16,943 17,846 18,727 19,425 19,968 20,374 20,636 1.04 1.04 0.96 0.73 0.55 0.40 0.26<br />
Oklahoma City 711 729 748 773 812 854 891 923 0.51 0.51 0.67 0.98 0.99 0.85 0.71<br />
Orlando 893 1,020 1,165 1,306 1,400 1,468 1,526 1,575 2.66 2.66 2.29 1.38 0.95 0.78 0.63<br />
Philadelphia 4,725 4,938 5,160 5,395 5,626 5,833 6,004 6,135 0.88 0.88 0.89 0.84 0.72 0.58 0.43<br />
Phoenix-Mesa 2,025 2,437 2,934 3,418 3,684 3,840 3,965 4,063 3.71 3.71 3.05 1.50 0.83 0.64 0.49<br />
Pittsburgh 1,681 1,717 1,755 1,807 1,887 1,971 2,045 2,106 0.43 0.43 0.58 0.87 0.87 0.73 0.59<br />
Portland 1,181 1,372 1,595 1,811 1,944 2,035 2,110 2,173 3.01 3.01 2.54 1.42 0.91 0.73 0.58<br />
Providence 1,047 1,111 1,178 1,249 1,317 1,380 1,435 1,482 1.18 1.18 1.16 1.07 0.93 0.79 0.64<br />
Raleigh 310 413 549 692 769 812 848 879 5.71 5.71 4.63 2.11 1.08 0.86 0.71<br />
Richmond 696 757 822 888 944 991 1,034 1,070 1.66 1.66 1.54 1.21 0.99 0.83 0.68<br />
2015-<br />
2020<br />
2020-<br />
2025
State of the World’s Cities <strong>2012</strong>/<strong>2013</strong><br />
Country/City<br />
City Population of<br />
Urban Agglomerations (’000)<br />
1990 1995 2000 2005 2010 2015 2020 2025<br />
144<br />
1990-<br />
1995<br />
1995-<br />
2000<br />
City Population Growth Rate of<br />
Urban Agglomerations (%)<br />
Riverside-San Bernardino 1,178 1,336 1,516 1,691 1,807 1,891 1,962 2,021 2.53 2.53 2.18 1.32 0.91 0.74 0.59<br />
Rochester 621 658 696 738 780 820 857 888 1.14 1.14 1.15 1.12 1.01 0.86 0.71<br />
Sacramento 1,104 1,244 1,402 1,555 1,660 1,739 1,805 1,861 2.39 2.39 2.08 1.30 0.92 0.75 0.60<br />
Salt Lake City 792 840 890 944 997 1,047 1,091 1,129 1.17 1.17 1.17 1.10 0.97 0.83 0.68<br />
San Antonio 1,134 1,229 1,333 1,436 1,521 1,593 1,655 1,707 1.62 1.62 1.49 1.15 0.92 0.77 0.62<br />
San Diego 2,356 2,514 2,683 2,853 2,999 3,125 3,231 3,316 1.30 1.30 1.23 1.00 0.82 0.67 0.52<br />
San Francisco-Oakland 2,961 3,095 3,236 3,386 3,541 3,683 3,804 3,900 0.89 0.89 0.91 0.89 0.79 0.64 0.50<br />
San Jose 1,376 1,457 1,543 1,632 1,718 1,797 1,865 1,922 1.14 1.14 1.13 1.03 0.90 0.75 0.60<br />
Seattle 2,206 2,453 2,727 2,991 3,171 3,305 3,415 3,504 2.12 2.12 1.85 1.17 0.83 0.66 0.51<br />
St. Louis 1,950 2,014 2,081 2,160 2,259 2,357 2,442 2,511 0.65 0.65 0.74 0.89 0.85 0.71 0.56<br />
Tampa-St. Petersburg 1,717 1,886 2,072 2,253 2,387 2,492 2,581 2,653 1.88 1.88 1.68 1.15 0.86 0.70 0.55<br />
Tucson 582 649 724 798 853 898 936 970 2.18 2.18 1.94 1.33 1.01 0.85 0.70<br />
Virginia Beach 1,286 1,341 1,397 1,461 1,534 1,605 1,668 1,720 0.83 0.83 0.89 0.97 0.91 0.76 0.62<br />
Washington, D.C. 3,376 3,651 3,949 4,239 4,460 4,635 4,779 4,891 1.57 1.57 1.42 1.01 0.77 0.61 0.46<br />
URUgUAy<br />
Montevideo 1,546 1,584 1,605 1,622 1,635 1,644 1,653 1,657 0.49 0.26 0.21 0.16 0.11 0.11 0.04<br />
UzBEkISTAn<br />
Tashkent 2,100 2,116 2,135 2,169 2,210 2,279 2,420 2,616 0.15 0.17 0.32 0.37 0.62 1.20 1.55<br />
vEnEzUELA (BOLIvARIAn REPUBLIC <strong>OF</strong>)<br />
Barquisimeto 742 838 946 1,067 1,180 1,273 1,350 1,413 2.42 2.43 2.39 2.02 1.52 1.17 0.92<br />
Caracas 2,767 2,816 2,864 2,929 3,090 3,292 3,467 3,605 0.35 0.34 0.45 1.07 1.27 1.03 0.78<br />
Maracaibo 1,303 1,501 1,724 1,973 2,192 2,357 2,488 2,593 2.82 2.77 2.70 2.10 1.45 1.08 0.83<br />
Maracay 760 831 898 973 1,057 1,138 1,208 1,266 1.77 1.56 1.59 1.67 1.48 1.19 0.93<br />
Valencia 1,053 1,213 1,392 1,592 1,770 1,905 2,014 2,103 2.82 2.76 2.69 2.12 1.48 1.11 0.86<br />
vIET nAm<br />
Table 4<br />
City population and city population growth rate of urban agglomerations with 750,000 Inhabitants or More in 2009,<br />
by Country, 1950-2025 (thousands)<br />
Da Nang - CP 388 470 570 692 838 997 1,146 1,291 3.86 3.86 3.85 3.85 3.47 2.78 2.38<br />
Hà Noi 1,136 1,344 1,631 2,144 2,814 3,516 4,056 4,530 3.35 3.88 5.46 5.44 4.45 2.86 2.21<br />
Hai Phòng 1,474 1,585 1,704 1,831 1,970 2,164 2,432 2,722 1.45 1.45 1.45 1.46 1.88 2.34 2.25<br />
Thành Pho Ho Chí Minh<br />
(Ho Chi Minh City)<br />
yEmEn<br />
3,411 3,802 4,336 5,264 6,167 7,140 8,067 8,957 2.17 2.63 3.88 3.17 2.93 2.44 2.09<br />
Sana'a'<br />
zAmBIA<br />
653 1,034 1,365 1,801 2,342 2,934 3,585 4,296 9.18 5.55 5.54 5.26 4.51 4.01 3.62<br />
Lusaka<br />
zImBABWE<br />
757 902 1,073 1,265 1,451 1,666 1,941 2,267 3.49 3.49 3.29 2.74 2.77 3.05 3.10<br />
Harare 1,047 1,255 1,379 1,513 1,632 1,856 2,170 2,467 3.62 1.89 1.85 1.51 2.57 3.13 2.57<br />
Source: United Nations Department of Economic and Social Affairs, Population Division (2010) World Urbanization Prospects: The 2009 Revision, United Nations, New York.<br />
2000-<br />
2005<br />
2005-<br />
2010<br />
2010-<br />
2015<br />
2015-<br />
2020<br />
2020-<br />
2025
Urban Population (’000) Level of urbanization (%)<br />
145<br />
Statistical Annex<br />
Country 1990 2000 2010 2020 2030 1990 2000 2010 2020 2030<br />
AFRICA<br />
Table 5<br />
Urban Population and Urbanization by Country, 1990-2030<br />
Algeria 13,168 18,246 23,555 29,194 34,097 52.1 59.8 66.5 71.9 76.2<br />
Angola 3,960 6,995 11,112 16,184 21,784 37.1 49.0 58.5 66.0 71.6<br />
Benin 1,654 2,553 3,873 5,751 8,275 34.5 38.3 42.0 47.2 53.7<br />
Botswana 567 917 1,209 1,506 1,769 41.9 53.2 61.1 67.6 72.7<br />
Burkina Faso 1,218 2,083 4,184 7,523 11,958 13.8 17.8 25.7 34.4 42.8<br />
Burundi 356 536 937 1,524 2,362 6.3 8.3 11.0 14.8 19.8<br />
Cameroon 4,981 7,910 11,655 15,941 20,304 40.7 49.9 58.4 65.5 71.0<br />
Cape Verde 156 235 313 394 468 44.1 53.4 61.1 67.4 72.5<br />
Central African Republic 1,078 1,410 1,755 2,268 2,978 36.8 37.6 38.9 42.5 48.4<br />
Chad 1,271 1,964 3,179 5,054 7,843 20.8 23.4 27.6 33.9 41.2<br />
Comoros 122 155 195 259 356 27.9 28.1 28.2 30.8 36.5<br />
Congo 1,329 1,770 2,335 3,118 3,883 54.3 58.3 62.1 66.3 70.9<br />
Côte d'Ivoire 5,011 7,524 10,906 15,574 20,873 39.7 43.5 50.6 57.8 64.1<br />
Democratic Republic of the Congo 10,299 15,168 23,887 36,834 53,382 27.8 29.8 35.2 42.0 49.2<br />
Djibouti 424 555 670 798 956 75.7 76.0 76.2 77.6 80.2<br />
Egypt 25,124 30,032 36,664 45,301 56,477 43.5 42.8 43.4 45.9 50.9<br />
Equatorial Guinea 132 205 275 379 527 34.7 38.8 39.7 43.3 49.4<br />
Eritrea 499 650 1,127 1,845 2,780 15.8 17.8 21.6 27.5 34.4<br />
Ethiopia 6,095 9,762 14,158 20,800 31,383 12.6 14.9 16.7 19.3 23.9<br />
Gabon 641 989 1,292 1,579 1,853 69.1 80.1 86.0 88.8 90.6<br />
Gambia 343 639 1,018 1,449 1,943 38.3 49.1 58.1 65.0 71.0<br />
Ghana 5,454 8,584 12,524 17,274 22,565 36.4 44.0 51.5 58.4 64.7<br />
Guinea 1,723 2,603 3,651 5,580 8,219 28.0 31.0 35.4 41.4 48.6<br />
Guinea-Bissau 288 387 494 678 979 28.1 29.7 30.0 32.8 38.6<br />
Kenya 4,271 6,204 9,064 13,826 20,884 18.2 19.7 22.2 26.6 33.0<br />
Lesotho 224 377 560 775 999 14.0 20.0 26.9 34.5 42.4<br />
Liberia 887 1,252 1,961 2,739 3,725 40.9 44.3 47.8 52.1 57.6<br />
Libyan Arab Jamahiriya 3,305 4,083 5,098 6,181 7,060 75.7 76.4 77.9 80.3 82.9<br />
Madagascar 2,657 4,143 6,082 8,953 13,048 23.6 27.1 30.2 34.9 41.4<br />
Malawi 1,093 1,796 3,102 5,240 8,395 11.6 15.2 19.8 25.5 32.4<br />
Mali 2,018 2,982 4,777 7,325 10,491 23.3 28.3 35.9 43.7 51.3<br />
Mauritania 789 1,041 1,395 1,859 2,478 39.7 40.0 41.4 45.4 51.7<br />
Mauritius 464 510 542 595 681 43.9 42.7 41.8 43.4 48.0<br />
Mayotte 33 71 100 129 168 36.1 47.7 50.1 51.6 55.7<br />
Morocco 12,005 15,375 18,859 23,158 27,157 48.4 53.3 58.2 64.0 69.2<br />
Mozambique 2,857 5,601 8,996 13,208 18,199 21.1 30.7 38.4 46.3 53.7<br />
Namibia 392 590 840 1,161 1,541 27.7 32.4 38.0 44.4 51.5<br />
Niger 1,215 1,785 2,719 4,417 7,641 15.4 16.2 17.1 19.3 23.5<br />
Nigeria 34,343 53,078 78,818 109,859 144,116 35.3 42.5 49.8 56.8 63.6<br />
Réunion 491 650 787 891 972 81.2 89.9 94.0 95.7 96.3<br />
Rwanda 387 1,096 1,938 2,993 4,550 5.4 13.8 18.9 22.6 28.3<br />
Saint Helena 2 2 2 2 2 41.6 39.7 39.7 41.7 46.4<br />
Sao Tome and Principe 51 75 103 136 173 43.6 53.4 62.2 69.0 74.0<br />
Senegal 2,932 3,995 5,450 7,524 10,269 38.9 40.3 42.4 46.5 52.5<br />
Seychelles 35 41 47 54 62 49.3 51.0 55.3 61.1 66.6<br />
Sierra Leone 1,345 1,501 2,241 3,134 4,384 32.9 35.5 38.4 42.8 49.0
State of the World’s Cities <strong>2012</strong>/<strong>2013</strong><br />
Urban Population (’000) Level of urbanization (%)<br />
Country 1990 2000 2010 2020 2030 1990 2000 2010 2020 2030<br />
Somalia 1,956 2,458 3,505 5,268 7,851 29.7 33.2 37.4 43.0 49.9<br />
South Africa 19,121 25,528 31,155 35,060 39,032 52.0 56.9 61.7 66.6 71.3<br />
Sudan 7,211 11,661 17,322 24,804 33,267 26.6 33.4 40.1 47.4 54.5<br />
Swaziland 198 244 257 307 400 22.9 22.6 21.4 22.3 26.2<br />
Togo 1,182 1,917 2,945 4,261 5,795 30.1 36.5 43.4 50.5 57.3<br />
Tunisia 4,760 5,996 6,980 8,096 9,115 57.9 63.4 67.3 71.2 75.2<br />
Uganda 1,964 2,952 4,493 7,381 12,503 11.1 12.1 13.3 15.9 20.6<br />
United Republic of Tanzania 4,807 7,614 11,883 18,945 29,190 18.9 22.3 26.4 31.8 38.7<br />
Western Sahara 190 264 434 606 704 86.2 83.9 81.8 83.9 85.9<br />
Zambia 3,117 3,643 4,733 6,584 9,340 39.4 34.8 35.7 38.9 44.7<br />
Zimbabwe 3,033 4,205 4,837 6,839 9,086 29.0 33.8 38.3 43.9 50.7<br />
ASIA<br />
Table 5<br />
Urban Population and Urbanization by Country, 1990-2030<br />
Afghanistan 2,277 4,148 6,581 10,450 16,296 18.1 20.2 22.6 26.4 32.2<br />
Armenia 2,390 1,989 1,984 2,087 2,186 67.4 64.7 64.2 65.7 69.0<br />
Azerbaijan 3,876 4,158 4,639 5,332 6,044 53.7 51.2 51.9 54.2 58.6<br />
Bahrain 434 574 715 852 984 88.1 88.4 88.6 89.4 90.6<br />
Bangladesh 22,908 33,208 46,149 62,886 83,408 19.8 23.6 28.1 33.9 41.0<br />
Bhutan 90 143 246 348 451 16.4 25.4 34.7 42.4 50.0<br />
Brunei Darussalam 169 237 308 379 450 65.8 71.1 75.7 79.3 82.3<br />
Cambodia 1,221 2,157 3,027 4,214 5,870 12.6 16.9 20.1 23.8 29.2<br />
China 301,995 453,029 635,839 786,761 905,449 26.4 35.8 47.0 55.0 61.9<br />
China, Hong Kong SAR 5,677 6,667 7,069 7,701 8,185 99.5 100.0 100.0 100.0 100.0<br />
China, Macao SAR 371 441 548 588 611 99.8 100.0 100.0 100.0 100.0<br />
Cyprus 454 540 619 705 797 66.8 68.6 70.3 72.7 75.7<br />
Dem. People’s Republic of Korea 11,760 13,581 14,446 15,413 16,633 58.4 59.4 60.2 62.1 65.7<br />
Georgia 3,005 2,498 2,225 2,177 2,218 55.0 52.6 52.7 54.7 58.7<br />
India 220,260 288,430 364,459 463,328 590,091 25.5 27.7 30.0 33.9 39.7<br />
Indonesia 54,252 86,219 102,960 122,257 145,776 30.6 42.0 44.3 48.1 53.7<br />
Iran (Islamic Republic of) 31,958 42,952 53,120 63,596 71,767 56.3 64.2 70.8 75.9 79.8<br />
Iraq 12,602 16,722 20,822 26,772 33,930 69.7 67.8 66.2 66.6 69.4<br />
Israel 4,079 5,563 6,692 7,673 8,583 90.4 91.4 91.9 92.4 93.1<br />
Japan 77,726 82,633 84,875 85,848 85,700 63.1 65.2 66.8 69.4 73.0<br />
Jordan 2,350 3,798 5,083 5,998 7,063 72.2 78.3 78.5 79.8 82.0<br />
Kazakhstan 9,301 8,417 9,217 10,417 11,525 56.3 56.3 58.5 62.3 66.8<br />
Kuwait 2,100 2,188 3,001 3,637 4,218 98.0 98.2 98.4 98.6 98.7<br />
Kyrgyzstan 1,660 1,744 1,918 2,202 2,625 37.8 35.2 34.5 35.7 40.1<br />
Lao People’s Democratic Republic 649 1,187 2,136 3,381 4,699 15.4 22.0 33.2 44.2 53.1<br />
Lebanon 2,472 3,244 3,712 4,065 4,374 83.1 86.0 87.2 88.6 90.0<br />
Malaysia 9,014 14,424 20,146 25,128 28,999 49.8 62.0 72.2 78.5 82.2<br />
Maldives 56 75 126 186 242 25.8 27.7 40.1 51.5 60.1<br />
Mongolia 1,264 1,358 1,675 2,010 2,316 57.0 56.9 62.0 67.0 71.6<br />
Myanmar 10,092 12,956 16,990 22,570 28,545 24.7 27.8 33.6 40.7 48.1<br />
Nepal 1,692 3,281 5,559 8,739 12,902 8.9 13.4 18.6 24.8 31.7<br />
Occupied Palestinian Territory 1,462 2,267 3,269 4,447 5,810 67.9 72.0 74.1 76.6 79.4<br />
Oman 1,218 1,719 2,122 2,645 3,184 66.1 71.6 73.0 75.7 78.7<br />
Pakistan 35,400 49,088 66,318 90,199 121,218 30.6 33.1 35.9 39.9 45.6<br />
Philippines 30,333 37,283 45,781 57,657 72,555 48.6 48.0 48.9 52.6 58.3<br />
146
Urban Population (’000) Level of urbanization (%)<br />
147<br />
Statistical Annex<br />
Country 1990 2000 2010 2020 2030 1990 2000 2010 2020 2030<br />
Qatar 431 586 1,445 1,679 1,891 92.2 94.9 95.8 96.5 96.9<br />
Republic of Korea 31,740 36,967 40,235 42,362 43,086 73.8 79.6 83.0 85.6 87.7<br />
Saudi Arabia 12,451 16,615 21,541 26,617 31,516 76.6 79.8 82.1 84.2 86.2<br />
Singapore 3,016 4,018 4,837 5,219 5,460 100.0 100.0 100.0 100.0 100.0<br />
Sri Lanka 3,217 2,971 2,921 3,360 4,339 18.6 15.8 14.3 15.5 19.6<br />
Syrian Arab Republic 6,224 8,577 12,545 15,948 19,976 48.9 51.9 55.7 60.2 65.4<br />
Tajikistan 1,679 1,635 1,862 2,364 3,121 31.7 26.5 26.3 28.0 32.5<br />
Thailand 16,675 19,417 23,142 27,800 33,624 29.4 31.1 34.0 38.9 45.8<br />
Timor-Leste 154 198 329 538 848 20.8 24.3 28.1 33.2 39.9<br />
Turkey 33,204 43,027 52,728 62,033 70,247 59.2 64.7 69.6 74.0 77.7<br />
Turkmenistan 1,653 2,062 2,562 3,175 3,793 45.1 45.8 49.5 54.6 60.4<br />
United Arab Emirates 1,476 2,599 3,956 4,915 5,821 79.1 80.3 84.1 86.8 88.8<br />
Uzbekistan 8,241 9,273 10,075 11,789 14,500 40.2 37.4 36.2 37.8 42.7<br />
Viet Nam 13,418 19,263 27,046 36,269 46,585 20.3 24.5 30.4 37.0 44.2<br />
Yemen 2,577 4,776 7,714 12,082 17,844 20.9 26.3 31.8 38.2 45.3<br />
EUROPE<br />
Table 5<br />
Urban Population and Urbanization by Country, 1990-2030<br />
Albania 1,198 1,280 1,645 2,027 2,301 36.4 41.7 51.9 60.7 67.4<br />
Andorra 50 61 76 85 96 94.7 92.4 88.0 84.9 85.1<br />
Austria 5,045 5,267 5,666 6,003 6,372 65.8 65.8 67.6 70.3 73.8<br />
Belarus 6,769 7,030 7,162 7,219 7,070 66.0 69.9 74.7 79.2 82.6<br />
Belgium 9,573 9,899 10,421 10,792 11,070 96.4 97.1 97.4 97.7 97.9<br />
Bosnia and Herzegovina 1,691 1,597 1,828 2,028 2,170 39.2 43.2 48.6 55.2 61.7<br />
Bulgaria 5,854 5,516 5,357 5,215 5,012 66.4 68.9 71.5 74.3 77.5<br />
Channel Islands 45 45 47 52 59 31.4 30.5 31.4 34.2 39.1<br />
Croatia 2,441 2,504 2,546 2,657 2,781 54.0 55.6 57.7 61.5 66.5<br />
Czech Republic 7,750 7,565 7,656 7,929 8,202 75.2 74.0 73.5 75.0 78.0<br />
Denmark 4,361 4,540 4,761 4,923 5,058 84.8 85.1 86.9 88.6 90.1<br />
Estonia 1,115 951 931 942 955 71.1 69.4 69.5 70.7 73.4<br />
Faeroe Islands 14 17 20 23 26 30.6 36.3 40.3 42.2 46.6<br />
Finland 3,958 4,252 4,549 4,805 4,947 79.4 82.2 85.1 87.4 89.2<br />
France 42,095 45,466 53,398 58,267 61,043 74.1 76.9 85.3 89.7 91.8<br />
Germany 58,080 59,970 60,598 60,827 60,993 73.1 73.1 73.8 75.6 78.3<br />
Gibraltar 28 29 31 32 31 100.0 100.0 100.0 100.0 100.0<br />
Greece 5,979 6,537 6,868 7,307 7,785 58.8 59.7 61.4 64.8 69.3<br />
Holy See 1 1 1 1 1 100.0 100.0 100.0 100.0 100.0<br />
Hungary 6,824 6,596 6,791 7,011 7,180 65.8 64.6 68.1 71.8 75.5<br />
Iceland 231 260 308 349 372 90.8 92.4 93.4 94.3 95.0<br />
Ireland 2,000 2,250 2,842 3,370 3,889 56.9 59.1 61.9 65.5 69.8<br />
Isle of Man 36 40 41 41 43 51.7 51.8 50.6 51.2 53.9<br />
Italy 38,032 38,395 41,083 42,840 44,395 66.7 67.2 68.4 70.9 74.6<br />
Latvia 1,844 1,616 1,517 1,471 1,453 69.3 68.1 67.7 68.4 70.9<br />
Liechtenstein 5 5 5 6 7 16.9 15.1 14.3 15.0 18.0<br />
Lithuania 2,499 2,345 2,181 2,096 2,080 67.6 67.0 67.0 68.5 71.5<br />
Luxembourg 309 366 419 480 547 80.9 83.8 85.2 87.4 89.1<br />
Malta 325 359 388 405 413 90.4 92.4 94.7 96.0 96.6<br />
Monaco 29 32 33 34 35 100.0 100.0 100.0 100.0 100.0<br />
Montenegro 282 387 384 394 417 48.0 58.5 61.5 62.4 65.7
State of the World’s Cities <strong>2012</strong>/<strong>2013</strong><br />
Table 5<br />
Urban Population and Urbanization by Country, 1990-2030<br />
Urban Population (’000) Level of urbanization (%)<br />
Country 1990 2000 2010 2020 2030 1990 2000 2010 2020 2030<br />
Netherlands 10,270 12,222 13,799 14,824 15,501 68.7 76.8 82.9 86.5 88.6<br />
Norway 3,052 3,411 3,856 4,297 4,700 72.0 76.1 79.4 82.6 85.2<br />
Poland 23,351 23,719 23,187 23,135 23,481 61.3 61.7 61.0 61.7 64.9<br />
Portugal 4,782 5,563 6,515 7,148 7,585 47.9 54.4 60.7 66.4 71.4<br />
Republic of Moldova 2,041 1,828 1,679 1,833 1,938 46.8 44.6 47.0 54.2 60.9<br />
Romania 12,350 11,734 12,177 12,839 13,296 53.2 53.0 57.5 63.0 68.2<br />
Russian Federation 108,670 107,582 102,702 100,892 99,153 73.4 73.4 73.2 74.5 76.9<br />
San Marino 22 25 30 31 32 90.4 93.4 94.1 94.4 94.9<br />
Serbia 4,822 5,369 5,525 5,871 6,252 50.4 53.0 56.1 60.0 64.8<br />
Slovakia 2,969 3,025 2,975 3,031 3,168 56.5 56.2 55.0 55.7 59.2<br />
Slovenia 971 1,008 1,002 1,035 1,110 50.4 50.8 49.5 50.4 54.5<br />
Spain 29,266 30,707 35,073 38,542 40,774 75.4 76.3 77.4 79.4 81.9<br />
Sweden 7,112 7,445 7,870 8,333 8,799 83.1 84.0 84.7 85.8 87.3<br />
Switzerland 4,914 5,268 5,591 5,922 6,336 73.2 73.3 73.6 75.2 77.8<br />
TFYR Macedonia 1,103 1,194 1,212 1,260 1,331 57.8 59.4 59.3 61.6 66.0<br />
Ukraine 34,435 32,814 31,252 30,860 30,243 66.8 67.1 68.8 71.9 75.3<br />
United Kingdom 44,726 46,331 49,295 53,001 56,901 78.1 78.7 79.6 81.4 83.7<br />
LATIn AmERICA AnD <strong>THE</strong> CARIBBEAn<br />
Anguilla 8 11 15 18 19 100.0 100.0 100.0 100.0 100.0<br />
Antigua and Barbuda 22 25 27 32 40 35.4 32.1 30.3 32.5 38.4<br />
Argentina 28,268 33,291 37,572 41,554 44,726 87.0 90.1 92.4 93.8 94.6<br />
Aruba 32 42 50 54 59 50.3 46.7 46.9 48.8 52.5<br />
Bahamas 204 250 291 331 367 79.8 82.0 84.1 86.1 87.9<br />
Barbados 85 97 114 134 151 32.7 38.3 44.5 51.1 57.9<br />
Belize 90 120 164 213 268 47.5 47.8 52.2 56.9 62.3<br />
Bolivia 3,707 5,143 6,675 8,265 9,799 55.6 61.8 66.5 71.0 75.2<br />
Brazil 110,565 141,416 169,098 187,104 197,874 73.9 81.2 86.5 89.5 91.1<br />
British Virgin Islands 6 8 10 11 14 37.8 39.4 41.0 45.2 51.6<br />
Cayman Islands 26 40 57 61 65 100.0 100.0 100.0 100.0 100.0<br />
Chile 10,984 13,252 15,251 16,958 18,247 83.3 85.9 89.0 91.0 92.3<br />
Colombia 22,670 28,666 34,758 40,800 46,357 68.3 72.1 75.1 78.0 81.0<br />
Costa Rica 1,560 2,321 2,989 3,643 4,259 50.7 59.0 64.4 69.4 73.9<br />
Cuba 7,767 8,382 8,429 8,462 8,550 73.4 75.6 75.2 75.6 77.6<br />
Dominica 47 46 45 47 50 67.7 67.2 67.2 69.4 73.1<br />
Dominican Republic 4,072 5,452 7,074 8,560 9,793 55.2 61.7 69.2 74.8 78.8<br />
Ecuador 5,662 7,423 9,222 11,152 12,813 55.1 60.3 66.9 72.5 76.8<br />
El Salvador 2,624 3,503 3,983 4,583 5,287 49.2 58.9 64.3 69.3 73.7<br />
Falkland Islands (Malvinas) 2 2 2 2 3 74.2 67.6 73.6 78.2 81.6<br />
French Guiana 87 124 177 229 288 74.5 75.1 76.4 78.6 81.4<br />
Grenada 32 37 41 48 55 33.4 35.9 39.3 44.5 51.2<br />
Guadeloupe 381 422 460 476 485 98.6 98.4 98.4 98.5 98.6<br />
Guatemala 3,664 5,068 7,111 9,893 13,153 41.1 45.1 49.5 54.7 60.6<br />
Guyana 222 217 218 233 265 29.6 28.7 28.6 31.3 37.2<br />
Haiti 2,026 3,079 5,307 7,546 9,450 28.5 35.6 52.1 64.4 71.6<br />
Honduras 1,983 2,832 3,930 5,263 6,656 40.5 45.5 51.6 57.6 63.4<br />
Jamaica 1,169 1,330 1,420 1,521 1,660 49.4 51.8 52.0 53.7 57.8<br />
Martinique 310 345 362 370 376 86.3 89.7 89.0 89.1 90.0<br />
Mexico 59,566 74,372 86,113 96,558 105,300 71.4 74.7 77.8 80.7 83.3<br />
148
Urban Population (’000) Level of urbanization (%)<br />
149<br />
Statistical Annex<br />
Country 1990 2000 2010 2020 2030 1990 2000 2010 2020 2030<br />
Montserrat 1 1 1 1 1 12.5 11.0 14.3 16.9 21.6<br />
Netherlands Antilles 163 163 187 199 200 85.6 90.2 93.2 94.7 95.5<br />
Nicaragua 2,166 2,792 3,337 4,077 4,860 52.3 54.7 57.3 61.0 65.8<br />
Panama 1,300 1,941 2,624 3,233 3,751 53.9 65.8 74.8 80.3 83.6<br />
Paraguay 2,069 2,960 3,972 5,051 6,102 48.7 55.3 61.5 67.1 71.9<br />
Peru 15,004 18,994 22,688 26,389 29,902 68.9 73.0 76.9 80.3 83.0<br />
Puerto Rico 2,546 3,614 3,949 4,112 4,178 72.2 94.6 98.8 99.5 99.6<br />
Saint Kitts and Nevis 14 15 17 21 26 34.6 32.8 32.4 35.4 41.6<br />
Saint Lucia 41 44 49 58 74 29.3 28.0 28.0 30.6 36.1<br />
Saint Vincent and the Grenadines 44 49 54 60 68 41.4 45.2 49.3 54.6 60.7<br />
Suriname 244 303 364 418 466 60.0 64.9 69.4 73.5 77.3<br />
Trinidad and Tobago 104 140 186 250 328 8.5 10.8 13.9 18.1 23.7<br />
Turks and Caicos Islands 9 16 31 35 38 74.3 84.6 93.3 96.5 97.4<br />
United States Virgin Islands 91 101 104 102 96 87.7 92.6 95.3 96.5 97.0<br />
Uruguay 2,767 3,033 3,119 3,264 3,382 89.0 91.3 92.5 93.4 94.3<br />
Venezuela (Bolivarian Republic of) 16,638 21,940 27,113 31,755 35,588 84.3 89.9 93.4 95.0 95.8<br />
nOR<strong>THE</strong>Rn AmERICA<br />
Bermuda 60 63 65 66 66 100.0 100.0 100.0 100.0 100.0<br />
Canada 21,214 24,389 27,309 30,426 33,680 76.6 79.5 80.6 82.0 84.0<br />
Greenland 44 46 48 49 49 79.7 81.6 84.2 86.5 88.4<br />
Saint Pierre and Miquelon 6 6 5 6 6 88.9 89.1 90.6 91.8 92.8<br />
United States of America 191,914 227,651 261,375 293,732 321,698 75.3 79.1 82.3 84.9 87.0<br />
OCEAnIA<br />
Table 5<br />
Urban Population and Urbanization by Country, 1990-2030<br />
American Samoa 38 51 64 76 87 80.9 88.8 93.0 94.8 95.6<br />
Australia 14,596 16,710 19,169 21,459 23,566 85.4 87.2 89.1 90.6 91.9<br />
Cook Islands 10 11 15 17 19 57.7 65.2 75.3 81.4 84.9<br />
Fiji 301 384 443 501 566 41.6 47.9 51.9 56.4 61.7<br />
French Polynesia 109 124 140 160 186 55.9 52.4 51.4 52.7 56.6<br />
Guam 122 144 168 188 208 90.8 93.1 93.2 93.5 94.2<br />
Kiribati 25 36 44 54 67 35.0 43.0 43.9 46.5 51.7<br />
Marshall Islands 31 36 45 56 65 65.1 68.4 71.8 75.3 78.8<br />
Micronesia (Fed. States of) 25 24 25 29 38 25.8 22.3 22.7 25.1 30.3<br />
Nauru 9 10 10 11 11 100.0 100.0 100.0 100.0 100.0<br />
New Caledonia 102 127 146 169 200 59.5 59.2 57.4 58.5 62.7<br />
New Zealand 2,869 3,314 3,710 4,058 4,382 84.7 85.7 86.2 86.9 88.1<br />
Niue 1 1 1 1 1 30.9 33.1 37.5 43.0 49.4<br />
Northern Mariana Islands 39 62 81 96 111 89.7 90.2 91.3 92.4 93.3<br />
Palau 10 13 17 20 23 69.6 70.0 83.4 89.6 92.0<br />
Papua New Guinea 619 711 863 1,194 1,828 15.0 13.2 12.5 14.1 18.2<br />
Pitcairn — — — — — — — — — —<br />
Samoa 34 39 36 38 46 21.2 22.0 20.2 20.5 24.0<br />
Solomon Islands 43 65 99 152 230 13.7 15.7 18.6 23.0 29.2<br />
Tokelau — — — — — — — — — —<br />
Tonga 21 23 24 28 35 22.7 23.0 23.4 25.6 30.4<br />
Tuvalu 4 4 5 6 7 40.7 46.0 50.4 55.6 61.5<br />
Vanuatu 28 41 63 95 140 18.7 21.7 25.6 31.0 38.0<br />
Wallis and Futuna Islands — — — — — — — — — —<br />
Source: United Nations Department of Economic and Social Affairs, Population Division (2010) World Urbanization Prospects: The 2009 Revision, United Nations, New York.
<strong>STATE</strong> <strong>OF</strong> <strong>THE</strong><br />
WORLD’S <strong>CITIES</strong><br />
<strong>2012</strong>/<strong>2013</strong><br />
<strong>Prosperity</strong> of Cities<br />
The City is the Home of <strong>Prosperity</strong>. It is the place where human beings find satisfaction of basic needs<br />
and access to essential public goods. The city is also where ambitions, aspirations and other material<br />
and immaterial aspects of life are realized, providing contentment and happiness. It is a locus at<br />
which e prospects of prosperity and individual and collective well-being can be increased.<br />
However, when prosperity is restricted to some groups, when it is used to pursue specific interests, or<br />
when it is a justification for financial gains for the few to the detriment of the majority, the city becomes<br />
the arena where the right to shared prosperity is claimed and fought for. As people in the latter part<br />
of 2011 gathered in Cairo’s Tahrir Square, in Madrid’s Puerta del Sol, in front of London’s St Paul’s<br />
cathedral, or in New York’s Zuccotti Park, they were not only demanding more equality and inclusion;<br />
they were also expressing the need for prosperity to be shared across all segments of society.<br />
What this new edition of State of the World’s Cities shows is that prosperity for all has been<br />
compromised by a narrow focus on economic growth. UN-Habitat suggests a fresh approach to<br />
prosperity beyond the solely economic emphasis, including other vital dimensions such as quality of<br />
life, adequate infrastructures, equity and environmental sustainability. The Report proposes a new<br />
tool – the City <strong>Prosperity</strong> Index – together with a conceptual matrix, the Wheel of <strong>Prosperity</strong>, both of<br />
which are meant to assist decision makers to design clear policy interventions.<br />
The Report advocates for the need of cities to enhance the public realm, expand public goods and<br />
consolidate rights to the ‘commons’ for all as a way to expand prosperity. This comes in response to<br />
the observed trend of enclosing or restricting these goods and commons in enclaves of prosperity, or<br />
depleting them through unsustainable use.<br />
The Report maps out major policy steps to promote a new type of city – the city of the 21st century – that<br />
is a ‘good’, people-centred city. One that is capable of integrating the tangible and more intangible aspects<br />
of prosperity, and in the process shedding off the inefficient, unsustainable forms and functionalities of the<br />
city of the previous century. By doing this, UN-Habitat plays a pivotal role in ensuring that urban planning,<br />
legal, regulatory and institutional frameworks become instruments of prosperity and well-being.<br />
United Nations Human Settlements<br />
Programme (UN-HABITAT)<br />
P.O. Box 30030, Nairobi, Kenya<br />
Tel: +254 20 7621 234<br />
Fax: +254 20 7624 266/7


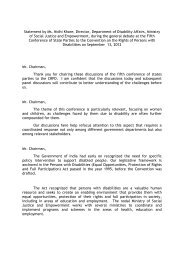
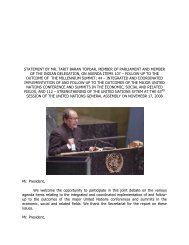

![1 statement by dr.[mrs] kakoli ghosh dastidar - Member States Portal](https://img.yumpu.com/27526598/1/190x245/1-statement-by-drmrs-kakoli-ghosh-dastidar-member-states-portal.jpg?quality=85)