- Page 1 and 2:
xxiv TEXAS Equations and Inequaliti
- Page 3 and 4:
TEKS 1.1 a.1, a.6 Key Vocabulary
- Page 5 and 6:
4 Chapter 1 Equations and Inequalit
- Page 7 and 8:
1.1 EXERCISES EXAMPLE 1 on p. 2 for
- Page 9 and 10:
EXAMPLE 2 on p. 3 for Exs. 57-59 EX
- Page 11 and 12:
TEKS 1.2 a.1, a.2, 2A.2.A, A.4.B Ke
- Page 13 and 14:
AVOID ERRORS The terms 3p 2 and p a
- Page 15 and 16:
EXAMPLE 2 on p. 11 for Exs. 16-24 E
- Page 17 and 18:
REVIEW Skills Review Handbook p. 98
- Page 19 and 20:
TEKS 1.3 a.2, a.5, 2A.2.A, A.7.A Ke
- Page 21 and 22:
AVOID ERRORS Be sure to multiply bo
- Page 23 and 24:
EXAMPLE 4 on p. 20 for Exs. 33-40 E
- Page 25 and 26:
EXAMPLE 5 on p. 20 for Exs. 75-77 R
- Page 27 and 28:
TEKS 1.4 a.1, a.2, a.4, 2A.2.A Key
- Page 29 and 30:
AVOID ERRORS When dividing each sid
- Page 31 and 32:
1.4 EXERCISES EXAMPLES 1 and 2 on p
- Page 33 and 34:
REVIEW Skills Review Handbook p. 99
- Page 35 and 36:
TEKS 1.5 a.5, a.6, 2A.2.A, A.7.A Ke
- Page 37 and 38:
✓ GUIDED PRACTICE for Examples 2,
- Page 39 and 40:
EXAMPLE 1 on p. 34 for Exs. 24-26 E
- Page 41 and 42:
REVIEW Skills Review Handbook p. 99
- Page 43 and 44:
ANOTHER WAY For alternative methods
- Page 45 and 46:
USE A FORMULA In Example 7, use the
- Page 47 and 48:
EXAMPLE 3 on p. 42 for Exs. 52-53 P
- Page 49 and 50:
LESSON 1.6 TEKS a.5, a.6, 2A.2.A P
- Page 51 and 52:
Investigating g g Algebra ACTIVITY
- Page 53 and 54:
AVOID ERRORS Always check your solu
- Page 55 and 56:
READING Tolerance is the maximum ac
- Page 57 and 58:
EXAMPLES 4 and 5 on pp. 53-54 for E
- Page 59 and 60:
REVIEW TAKS Preparation p. 66; TAKS
- Page 61 and 62:
1 TEKS TEKS TEKS Big Idea 1 2A.2.A
- Page 63 and 64:
1 1.2 EXAMPLES 3 and 4 on pp. 11-12
- Page 65 and 66:
1 1.6 EXAMPLES 1, 2, 3, and 4 on pp
- Page 67 and 68:
1 TEXAS TAKS PREPARATION TAKS Obj.
- Page 69 and 70:
1 TAKS PRACTICE PRACTICE FOR TAKS O
- Page 71 and 72:
70 TEXAS Linear Equations and Funct
- Page 73 and 74:
TEKS 2.1 a.1, a.3, a.5, 2A.1.A Key
- Page 75 and 76:
READING GRAPHS The zigzag symbol on
- Page 77 and 78:
76 Chapter 2 Linear Equations and F
- Page 79 and 80:
EXAMPLE 5 on p. 75 for Exs. 34-39 E
- Page 81 and 82:
Extension Use after Lesson 2.1 Key
- Page 83 and 84:
TEKS 2.2 a.1, a.4, a.5 Key Vocabula
- Page 85 and 86:
84 Chapter 2 Linear Equations and F
- Page 87 and 88:
2.2 EXERCISES EXAMPLES 2 and 3 on p
- Page 89 and 90:
REVIEW Lesson 1.5; TAKS Workbook RE
- Page 91 and 92:
ANOTHER WAY Because 2 2 } 3 5 2 } 2
- Page 93 and 94:
ANOTHER WAY You can also graph 5x 1
- Page 95 and 96:
EXAMPLE 3 on p. 91 for Exs. 59-62 9
- Page 97 and 98:
REVIEW Skills Review Handbook p. 99
- Page 99 and 100:
TEKS 2.4 a.1, a.3, a.4, 2A.2.A Key
- Page 101 and 102:
ANOTHER WAY For an alternative meth
- Page 103 and 104:
EXAMPLE 3 on p. 99 for Exs. 20-26 E
- Page 105 and 106:
REVIEW Skills Review Handbook p. 99
- Page 107 and 108:
MIXED REVIEW FOR TEKS TAKS PRACTICE
- Page 109 and 110:
AVOID ERRORS For real-world data, t
- Page 111 and 112:
EXAMPLE 3 on p. 108 for Exs. 31-34
- Page 113 and 114:
Investigating g g Algebra QUESTION
- Page 115 and 116:
114 Chapter 2 Linear Equations and
- Page 117 and 118:
FIND CORRELATION If your calculator
- Page 119 and 120: EXAMPLES 3 and 4 on pp. 115-116 for
- Page 121 and 122: REVIEW TAKS Preparation p. 66; TAKS
- Page 123 and 124: EXAMPLE 3 Graph y 5 a⏐x⏐ where
- Page 125 and 126: INTERPRET FUNCTIONS To identify the
- Page 127 and 128: AVOID ERRORS In Example 5, part (b)
- Page 129 and 130: EXAMPLE 1 on p. 124 for Ex. 36 EXAM
- Page 131 and 132: Extension Use after Lesson 2.7 Key
- Page 133 and 134: TEKS 2.8 a.5 Key Vocabulary • lin
- Page 135 and 136: ✓ GUIDED PRACTICE for Examples 2
- Page 137 and 138: EXAMPLE 5 on p. 135 for Exs. 22-28
- Page 139 and 140: REVIEW Lesson 2.4; TAKS Workbook RE
- Page 141 and 142: 2 TEKS TEKS TEKS Big Idea 1 2A.1.A
- Page 143 and 144: 2 Find 2.2 EXAMPLE 2 on p. 82 for E
- Page 145 and 146: 2 2.7 EXAMPLES 1, 2, 3, and 4 on pp
- Page 147 and 148: 2 TEXAS TAKS PREPARATION TAKS Obj.
- Page 149 and 150: 2 TAKS PRACTICE PRACTICE FOR TAKS O
- Page 151 and 152: 150 Linear Systems and Matrices 33.
- Page 153 and 154: Investigating g g Algebra 3.1 Solvi
- Page 155 and 156: CHECK SOLUTION To check your soluti
- Page 157 and 158: 3.1 EXERCISES EXAMPLE 1 on p. 153 f
- Page 159 and 160: REVIEW Lesson 2.4; TAKS Workbook RE
- Page 161 and 162: TEKS 3.2 a.5, 2A.3.A, 2A.3.B, 2A.3.
- Page 163 and 164: AVOID ERRORS Choice D gives the num
- Page 165 and 166: 3.2 EXERCISES EXAMPLES 1 and 4 on p
- Page 167 and 168: 166 57. TAKS REASONIN G A company p
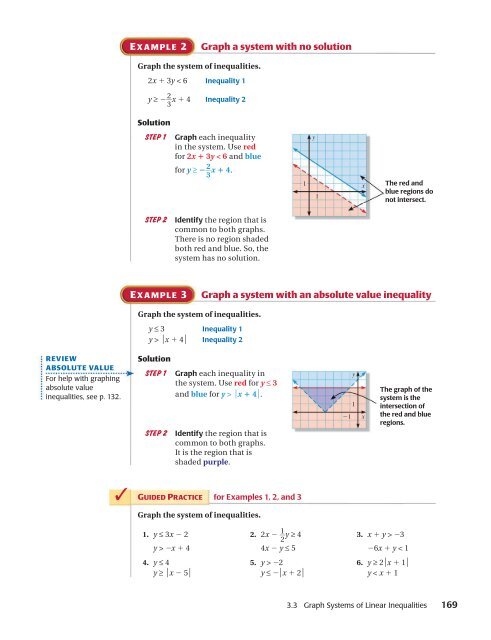
- Page 169: TEKS 3.3 a.5, 2A.3.A, 2A.3.B, 2A.3.
- Page 173 and 174: EXAMPLE 4 on p. 170 for Exs. 34-39
- Page 175 and 176: Extension Use Linear Programming Us
- Page 177 and 178: EXAMPLES 1 and 2 on p. 175 for Exs.
- Page 179 and 180: TEKS 3.4 a.5, 2A.3.A, 2A.3.B, 2A.3.
- Page 181 and 182: REVIEW SYSTEMS For help with solvin
- Page 183 and 184: 3.4 EXERCISES EXAMPLES 1, 2, and 3
- Page 185 and 186: EXAMPLE 4 on p. 181 for Exs. 42-47
- Page 187 and 188: MIXED REVIEW FOR TEKS TAKS PRACTICE
- Page 189 and 190: COMPARE ORDER OF OPERATIONS The ord
- Page 191 and 192: ✓ GUIDED PRACTICE for Examples 3
- Page 193 and 194: EXAMPLE 3 on p. 189 for Exs. 31-34
- Page 195 and 196: Graphing Calculator ACTIVITY g p g
- Page 197 and 198: AVOID ERRORS Order is important whe
- Page 199 and 200: 198 Chapter 3 Linear Systems and Ma
- Page 201 and 202: EXAMPLE 3 on p. 197 for Exs. 22-29
- Page 203 and 204: REVIEW Lesson 2.2; TAKS Workbook RE
- Page 205 and 206: 204 Chapter 3 Linear Systems and Ma
- Page 207 and 208: SOLVE SYSTEMS As with Cramer’s ru
- Page 209 and 210: EXAMPLE 2 on p. 204 for Exs. 22-28
- Page 211 and 212: TEKS 3.8 2A.2.A, 2A.3.A, 2A.3.B, 2A
- Page 213 and 214: SOLVE SYSTEMS You can use the metho
- Page 215 and 216: 3.8 EXERCISES EXAMPLE 1 on p. 210 f
- Page 217 and 218: 216 45. MULTIPLE REPRESENTATIONS A
- Page 219 and 220: LESSON 3.8 TEKS 2A.3.A, 2A.3.B, 2A.
- Page 221 and 222:
MIXED REVIEW FOR TEKS TAKS PRACTICE
- Page 223 and 224:
3 REVIEW KEY VOCABULARY VOCABULARY
- Page 225 and 226:
3 Solve 3.4 EXAMPLES 1 and 4 on pp.
- Page 227 and 228:
3 Evaluate 3.7 EXAMPLES 1 and 2 on
- Page 229 and 230:
3 TEXAS TAKS PREPARATION TAKS Obj.
- Page 231 and 232:
TAKS PRACTICE 3 PRACTICE FOR TAKS O
- Page 233 and 234:
3 Chapters CUMULATIVE REVIEW 1-3 Si
- Page 235 and 236:
234 TEXAS 44.1 Graph Quadratic Func
- Page 237 and 238:
TEKS 4.1 2A.4.A, 2A.4.B, 2A.6.B, 2A
- Page 239 and 240:
AVOID ERRORS Be sure to include the
- Page 241 and 242:
4.1 EXERCISES EXAMPLE 1 on p. 236 f
- Page 243 and 244:
EXAMPLE 5 on p. 239 for Exs. 55-58
- Page 245 and 246:
Graphing Calculator ACTIVITY g p g
- Page 247 and 248:
E XAMPLE 2 Use a quadratic model in
- Page 249 and 250:
REVIEW FOIL For help with using the
- Page 251 and 252:
EXAMPLES 2 and 4 on pp. 246-247 for
- Page 253 and 254:
TEKS 4.3 Solve x 2 1 bx 1 c 5 0 by
- Page 255 and 256:
UNDERSTAND ANSWER CHOICES Sometimes
- Page 257 and 258:
EXAMPLE 2 on p. 253 for Exs. 15-23
- Page 259 and 260:
REVIEW Lesson 2.2; TAKS Workbook RE
- Page 261 and 262:
✓ GUIDED PRACTICE for Examples 1
- Page 263 and 264:
FACTORING AND ZEROS To find the max
- Page 265 and 266:
EXAMPLE 6 on p. 261 for Exs. 62-63
- Page 267 and 268:
TEKS 4.5 2A.6.A, 2A.6.B, 2A.8.A, 2A
- Page 269 and 270:
E XAMPLE 4 TAKS PRACTICE: Multiple
- Page 271 and 272:
EXAMPLES 3 and 4 on pp. 267-268 for
- Page 273 and 274:
LESSON 4.5 TEKS 2A.6.B, 2A.8.A, 2A.
- Page 275 and 276:
Lessons 4.1-4.5 MULTIPLE CHOICE 1.
- Page 277 and 278:
COMPLEX NUMBERS Acomplex number wri
- Page 279 and 280:
REWRITE QUOTIENTS When a quotient h
- Page 281 and 282:
EXAMPLES 4 and 5 on pp. 277-278 for
- Page 283 and 284:
REVIEW Skills Review Handbook p. 99
- Page 285 and 286:
TEKS 4.7 2A.2.B, 2A.5.E, 2A.8.A, 2A
- Page 287 and 288:
ELIMINATE CHOICES You can eliminate
- Page 289 and 290:
4.7 EXERCISES EXAMPLE 1 on p. 284 f
- Page 291 and 292:
EXAMPLE 7 on p. 287 for Exs. 62-65
- Page 293 and 294:
TEKS 4.8 2A.8.A, 2A.8.B, 2A.8.C, 2A
- Page 295 and 296:
DISCRIMINANT In the quadratic formu
- Page 297 and 298:
4.8 EXERCISES EXAMPLES 1, 2, and 3
- Page 299 and 300:
EXAMPLE 5 on p. 295 for Exs. 68-69
- Page 301 and 302:
TEKS 4.9 2A.3.A, 2A.3.B, 2A.8.A, 2A
- Page 303 and 304:
MAKE A TABLE To give the exact solu
- Page 305 and 306:
4.9 EXERCISES EXAMPLE 1 on p. 300 f
- Page 307 and 308:
EXAMPLE 2 on p. 301 for Exs. 70-71
- Page 309 and 310:
Investigating g g Algebra QUESTION
- Page 311 and 312:
REVIEW SYSTEMS OF EQUATIONS For hel
- Page 313 and 314:
4.10 EXERCISES EXAMPLE 1 on p. 309
- Page 315 and 316:
EXAMPLES 1 and 3 on pp. 309-310 for
- Page 317 and 318:
MIXED REVIEW FOR TEKS TAKS PRACTICE
- Page 319 and 320:
4 CHAPTER REVIEW REVIEW KEY VOCABUL
- Page 321 and 322:
4 4.4 EXAMPLE 5 on p. 261 for Exs.
- Page 323 and 324:
4 4.9 EXAMPLE 5 on p. 302 for Exs.
- Page 325 and 326:
4 TEXAS TAKS PREPARATION TAKS Obj.
- Page 327 and 328:
4 TAKS PRACTICE PRACTICE FOR TAKS O