l - CALFED Bay-Delta Program - State of California
l - CALFED Bay-Delta Program - State of California
l - CALFED Bay-Delta Program - State of California

You also want an ePaper? Increase the reach of your titles
YUMPU automatically turns print PDFs into web optimized ePapers that Google loves.
: i<br />
I<br />
I<br />
<strong>State</strong> <strong>of</strong> <strong>California</strong><br />
The Resources Agency<br />
Department <strong>of</strong> Water Resources<br />
Division <strong>of</strong> Local Assistance<br />
ANNUAL REPORT<br />
OF THE<br />
MUNICIPAL WATER QUALITY<br />
I INVESTIGATIONS PROGRAM<br />
I<br />
I<br />
- I<br />
1<br />
Summary <strong>of</strong><br />
Monitoring Results<br />
January 1990 - December 1990<br />
February 1993<br />
I Douglas P. Wheeler Pete Wilson David N. Kennedy<br />
Secretary for Resources Governor Director<br />
The Resources Agency <strong>State</strong> <strong>of</strong> <strong>California</strong> Department <strong>of</strong> Water Resources<br />
i<br />
I<br />
C--03061 8<br />
C-030618
i<br />
<strong>State</strong> <strong>of</strong> <strong>California</strong><br />
The Resources Agency<br />
Department <strong>of</strong> Water Resources<br />
Division <strong>of</strong> Local Assistance<br />
ANNUAL REPORT<br />
OF THE<br />
MUNICIPAL WATER QUALITY<br />
INVESTIGATIONS PROGRAM<br />
Summary <strong>of</strong><br />
Monitoring Results<br />
January 1990 - December 1990<br />
February 1993<br />
I Douglas P. Wheeler Pete Wilson David N. Kennedy<br />
Secretary for Resources Governor Director<br />
The Resources Agency <strong>State</strong> <strong>of</strong> <strong>California</strong> Department <strong>of</strong> Water Resources<br />
I<br />
C--03061 9<br />
C-030619
FOREWORD<br />
In 1990 the <strong>California</strong> Department <strong>of</strong> Water Resources unified its drinking water<br />
quality studies in the Sacramento-San Joaquin <strong>Delta</strong> into the Municipal Water Quality<br />
Investigations <strong>Program</strong>. The new <strong>Program</strong> combined the Interagency <strong>Delta</strong> Health<br />
Aspects Monitoring <strong>Program</strong>, the <strong>Delta</strong> Islands Drainage Investigation, and ancillary<br />
studies into one study.<br />
The MWQI <strong>Program</strong>’s major goal is to assist water agencies in the protection and<br />
improvement <strong>of</strong> <strong>Delta</strong> drinking water supplies. <strong>Program</strong> staff examine the major sources<br />
and causes <strong>of</strong> water quality changes in the <strong>Delta</strong> that affect drinking water quality. They<br />
monitor key <strong>Delta</strong> channel and river stations and agricultural drains for contaminants<br />
such as pesticides, selenium, sodium, and trihalomethane formation potential.<br />
This MWQI <strong>Program</strong> report focuses on data collected during 1990. The report<br />
includes a brief summary <strong>of</strong> the relationships found among different water quality<br />
parameters.<br />
Further information about the Municipal Water Quality Investigations <strong>Program</strong> is<br />
available from Mr. Bruce Agee at the Division <strong>of</strong> Local Assistance, DWR. He can be<br />
reached by phone at (916) 327-1677.<br />
Carlos Ma~~dri, Chief<br />
Division <strong>of</strong> Local Assistance<br />
IIi<br />
C--030620<br />
(3-030620
CONTENTS<br />
FOREWORD iii<br />
SUMMARY ...................................................... 1<br />
PROGRAM DESCRIPTION .......................................... 5<br />
A. Purpose .................................................. 5<br />
B. <strong>Program</strong> Advisors ........................................... 6<br />
C. Monitoring Stations .......................................... 9<br />
D. Field Sampling Methods ..................................... 15<br />
E. Analytical Methods ......................................... 15<br />
MONITORING RESULTS .......................................... 17<br />
A. Monthly Observations ....................................... 17<br />
1. <strong>Delta</strong> Outflow and River Inflows ..........................17<br />
2. Sodium .............................................. 20<br />
3. Trihalomethane Formation Potential .......................22<br />
B. Water Quality Relationships .................................. 26<br />
1. Bromide and Chloride Concentrations ......................33<br />
2. Chloride and EC ...................................... 33<br />
3. Bromide and EC ...................................... 33<br />
4. TTHMFP and Bromide ................................. 34<br />
5. TTHMFP and Color ................................... 34<br />
6. qqTztMFP and UVA-254nm .............................. 34<br />
7. UVA and DOC ....................................... 39<br />
8. TI’HMFP and DOC ................................... 39<br />
9. TFPC and DOC ...................................... 39<br />
10. TFPC and UVA 45<br />
11. TI’I-/MFP vs. Bromide and DOC ......................... 45<br />
12. TH-IMFP vs. Chloride and UVA ......................... 45<br />
13. "ITI-IMFP vs. Bromide and UVA ......................... 45<br />
14. TFPC vs. Bromide and UVA ............................ 46<br />
15. TFPC vs. Chloride and UVA ............................ 46<br />
C. TFPC Range <strong>of</strong> Observations ................................. 46<br />
D. Sea Water Bromide Intrusion ................................. 46<br />
E. Drainage Sampling ......................................... 55<br />
F. Water Characterization Studies ................................57<br />
Appendix A: TFPC Cumulative Relative Frequency ’ 63<br />
Appendix B: Monitoring <strong>Program</strong> Data .................................<br />
71<br />
C--0306~i<br />
(3-030621
FIGURES<br />
Figure 1. Channel Stations .......................................... 13<br />
Figure 2. A~ricultural Drain Sampling Stations ........................... 14<br />
Figure 3. <strong>Delta</strong> Flows for Water Year 1990 .............................. 18<br />
Figure 4. Electrical Conductivity 1990 .................................. 19<br />
Figure 5. Sodium Concentrations (rag/L) 1990 ........................... 21<br />
Figure 6. T’FHMFP Concentrations 1990 ................................ 24<br />
Figure 7. THM Formation Potential Carbon (TFPC) 1990 ................... 25<br />
Figure 8. TYHMFP Range at Bouldin Island ............................. 36<br />
Figure 9. UVA-254nm Range at Bouldin Island ........................... 37<br />
Figure 10. UVA-TI’HMFP Regression at Bouldin Island ..................... 38<br />
Figure 11. UVA-DOC Regression at Bouldin Island ........................ 41<br />
Figure 12. DOC Range at Bouldin Island ................................ 42<br />
Figure 13. TFHMFP-DOC Power Regression at Bouldin Island ............... 43<br />
Figure 14. TI’HMFP-DOC Log Regression at Bouldin Island ................. 44<br />
Figure 15. Channel E.C. Values ........................................ 49<br />
Figure 16. Drainage E.C. Values ...................................... 50<br />
Figure 17. Drainage Br and C1 (mg/1) .................................. 51<br />
Figure 18. Channel Br and C1 (mg/1) ................................... 52<br />
Figure 19. Channel Br:C1 Ratios ...................................... 53<br />
Figure 20. Drainage Br:C1 Ratios ..................................... 54<br />
Figure 21. Trilinear Diagrams - North & Central <strong>Delta</strong> ...................... 60<br />
Figure 22. Trilinear Diagrams - Central & Southern <strong>Delta</strong> ................... 61<br />
Figure 23. Trilinear Diagrams - Agricultural Drainage Areas ................. 62<br />
TABLES<br />
Table 1. <strong>Program</strong> Advisors and Participants During 1990 ..................... 7<br />
Table 2. Monitoring Stations ......................................... 11<br />
Table 3. R-Squared Regression Results ................................. 28<br />
Table 4. Monthly Average Br to C1 Concentration Ratios (x 104) .............. 48<br />
Table 5. 1990 q-THMFP at Drainage Stations " 56<br />
C--030622<br />
(3-030622
ORGANIZATION<br />
<strong>State</strong> <strong>of</strong> <strong>California</strong><br />
PETE WILSON, GOVERNOR<br />
The Resources Agency<br />
DOUGLAS P. WHEELER, Secretary for Resources<br />
Department <strong>of</strong> Water Resources<br />
DAVID N. KENNEDY, Director<br />
John J. Silveira Robert G. Potter Carroll M. Hamon<br />
Deputy Director Chief Deputy Director Deputy Director<br />
L. Lucinda Chipponeri Susan N. Weber<br />
Assistant Director Chief Counsel<br />
for Legislation<br />
DIVISION OF LOCAL ASSISTANCE<br />
Carlos Madrid, Chief<br />
Water Resources Assessment <strong>Program</strong><br />
Richard P. Woodard, Staff Toxicologist<br />
<strong>Program</strong> Manager ........................................... Bruce Agee<br />
Field Lead Michael Sutliff<br />
Data Management .......................................... Lori Weisser<br />
Data Analysis and Report Preparation ........................... Marvin Jung<br />
B.J. Archer<br />
Laboratory Performance Review ................................ Judith Heath<br />
David Gonzalez<br />
Supporting Staff Walt Lambert William McCune Tracy Eaton<br />
Rita Cheng Nan Singhasemanon<br />
This report was prepared under contract B-56213 by Marvin Jung & Associates, Inc.,<br />
Sacramento.<br />
vii<br />
C=O 30 6 2 3<br />
C-030623
SUMMARY<br />
The drought persisted through 1990 with low Sacramento and San Joaquin River<br />
flows to the <strong>Delta</strong>. Sacramento River flows at Freeport averaged less than 15,000 cubic<br />
feet per second after January 1990 storms had passed. San Joaquin River flows near<br />
Vernalis remained nearly constant, averaging about 1300 cfs. Net <strong>Delta</strong> outflows at<br />
Chipps Island (computed <strong>Delta</strong> Outflow using the DWR DAYFLOW model) fell below<br />
5,000 cfs during the summer.<br />
Sodium concentrations at the Harvey O. Banks Pumping Plant Headworks did not<br />
exceed the 100 mg/L recommended limit for persons on restricted sodium diets.<br />
However, sodium levels in Rock Slough (at Old River), east <strong>of</strong> the Contra Costa Water<br />
District intake, were over 100 mg/L in April, and again during the fall. The increased<br />
sodium concentrations, as well as chloride and EC increases, are due to the low flow<br />
conditions and sea water intrusion into the western <strong>Delta</strong>. Sodium levels at the<br />
Sacramento River at Greene’s Landing station averaged 10 mg/L.<br />
During 1990, the main source <strong>of</strong> fresh water into the <strong>Delta</strong> was the Sacramento<br />
River. Pumping by the federal Tracy Pumping Plant caused most San Joaquin River<br />
flow to be diverted into the <strong>Delta</strong> Mendota Canal.<br />
The extent <strong>of</strong> sea water intrusion caused by low fresh water <strong>Delta</strong> outflows can be<br />
monitored by measuring concentrations <strong>of</strong> bromide, a constituent <strong>of</strong> sea water. During<br />
1990, the bromide to chloride concentration ratios in southwestern <strong>Delta</strong> waters were<br />
generally similar to sea water. However, bromide to chloride ratios varied in <strong>Delta</strong><br />
agricultural drainage. The ratios also varied in channels to the north and east <strong>of</strong> the<br />
segment <strong>of</strong> Old River where the DMC intake and Rock Slough are located. Bromide to<br />
chloride ratios should change as a result <strong>of</strong> reduced sea water intrusion in wetter years.<br />
The main conclusion is that sea water has been the primary source <strong>of</strong> bromide to the<br />
<strong>Delta</strong> during the dry years 1987-1990.<br />
The 1990 observations confirmed earlier data and conclusions about the<br />
significantly higher total trihalomethane formation potential (TI’HMFP) concentrations<br />
in agricultural drain water, as compared to the <strong>Delta</strong> channels. Again observed in 1990<br />
was a geographic pattern <strong>of</strong> progressively increasing TTHMFP southward from Greene’s<br />
Landing toward the export pumps in the southwestern <strong>Delta</strong>.<br />
The impact <strong>of</strong> reduced agricultural drainage on <strong>Delta</strong> water quality will be studied<br />
in 1991. Many acres <strong>of</strong> land will lay fallow due to the sale Of irrigation water to the<br />
<strong>State</strong> water bank program.<br />
C--030624<br />
(3-030624
Water Ouali _ty Relationships<br />
Staff performed statistical tests to determine water quality relationships and<br />
trends. The range <strong>of</strong> correlation values (R-squared) in the data set shows a wide range<br />
<strong>of</strong> factors that affect water quality across the <strong>Delta</strong>.<br />
Some parameters correlated well with others, but no single regression model or<br />
equation worked for all stations. Statistical determinations were inconclusive because <strong>of</strong><br />
limited data on some water quality parameters at some stations. Unique sets <strong>of</strong><br />
correlations and model equations may be required to represent each station or region <strong>of</strong><br />
the <strong>Delta</strong> because <strong>of</strong> the complexities <strong>of</strong> water movement, sources, and soil types.<br />
However, until more data are collected, the results <strong>of</strong> the statistical analyses presented in<br />
this report are considered to be preliminary. The low number <strong>of</strong> observations (< 30) at<br />
some stations can result in incorrect estimates <strong>of</strong> the strength <strong>of</strong> the correlations tested.<br />
Also, it cannot be determined if the data fit a normal distribution pattern until more<br />
data are collected. A normal distribution and other assumptions are the basis for the<br />
statistical tests that were performed.<br />
Of special interest are water quality parameters that may predict "ITHMFP. The<br />
best correlations included measurements <strong>of</strong> bromide concentration and organic<br />
trihalomethane (THM) precursor. Ultraviolet absorbance (UVA) measurements at 254<br />
nanometers (nm) yielded better correlations with TrHMFP and THM Formation<br />
Potential as Carbon (TFPC) than "Iq’HMFP with Dissolved Organic Carbon (DOC).<br />
This is because UVA-254 is a specific measurement <strong>of</strong> the humic fraction <strong>of</strong> DOC, which<br />
contains THM precursors. DOC, on the other hand, may consist <strong>of</strong> nonhumic as well as<br />
humic matter.<br />
In most cases, agricultural drainages from peat soil areas had the highest and<br />
most consistent correlations between different water quality parameters. These areas<br />
include Empire Tract, King Island, Bouldin Island, Bacon Island, Webb Tract, and<br />
Rindge Tract. UVA and bromide measurements may be used alone or in combination<br />
to estimate TTHMFP concentrations in these drainages.<br />
The correlations <strong>of</strong> some water quality parameters at the San Joaquin River at<br />
Maze Road station were similar to those found at the agricultural drainage stations.<br />
This reflects upstream discharges <strong>of</strong> Central Valley farm drainage into the San Joaquin<br />
River above Maze Road.<br />
Correlations at channel stations to predict qTHMFP from other water quality<br />
data were poor. This is likely due to the dynamic hydrology at these stations and<br />
seasonal influences on water quality from storms, drainage discharges, upstream releases<br />
and diversions, tides, and other factors.<br />
There may be strong seasonal "Iq’I-IMFP-UVA-Br relationships that may not be<br />
,<br />
C--030625<br />
(3-030625
evident when the data are collectively tested. Presently, there are too few data points at<br />
some statiom, especially, at the channel stations, to test for seasonal differences.<br />
The possible interference <strong>of</strong> UVA measurements by other water quality<br />
comtituents (e.g., bromides, nitrites, nitrates, iron, manganese) needs to be examined in<br />
the laboratory. It may explain some <strong>of</strong> the poor ’IqqqMFP-UVA correlations.<br />
Statistical analyses are continuing as new data are obtained to confirm and refine<br />
the preliminary mathematical relatiomhips.<br />
Cm030626<br />
C-030626
PROGRAM DESCRIPTION<br />
A. Purpose<br />
In 1989, DWR established the Municipal Water Quality Investigations <strong>Program</strong>.<br />
The <strong>Program</strong> unified DWR drinking water quality studies in the Sacramento-San Joaquin<br />
<strong>Delta</strong>. The previous studies included the Interagency <strong>Delta</strong> Health Aspects Monitoring<br />
<strong>Program</strong>, the <strong>Delta</strong> Island Drainage Investigation, and special studies to monitor<br />
bromide and sea water intrusion.<br />
Department staff monitor and assess the major sources <strong>of</strong> water quality impacts in<br />
the <strong>Delta</strong>. Included are the <strong>Bay</strong>-<strong>Delta</strong> estuary, river inflows, drainages from land<br />
surfaces, the <strong>Delta</strong> channels, and weather-related events.<br />
The data areusedto: (1) Alert water agencies about potential contaminant sources to<br />
<strong>Delta</strong> water supplies,<br />
(2) Document water quality under a variety <strong>of</strong> hydrologic<br />
conditions for studying water transfer alternatives, water<br />
quality standards, and predictive modeling capabilities,<br />
(3) Determine the influence <strong>of</strong> sea water intrusion, local and<br />
external sources <strong>of</strong> farm drainage, river input, in-channel<br />
processes, weather, and <strong>State</strong> Water Project and Central<br />
Valley Project operations on <strong>Delta</strong> drinking water quality.<br />
Selenium, bromide, and other inorganic constituents are used<br />
to trace the movement and mixing <strong>of</strong> water from different<br />
sources, and<br />
(4) Assist water agencies in planning, protecting, and improving<br />
drinking water facilities.<br />
Over the intervening years, several water-borne contaminants and pollutants were<br />
monitored. These include asbestos, salinity, selenium, pesticides, and trihalomethane<br />
precursors. Special sampling runs are made when additional water quality concerns<br />
arise.<br />
The evaluation <strong>of</strong> monitoring data enables an understanding <strong>of</strong> the shifts in water<br />
quality due to a variety <strong>of</strong> environmental conditions and water management operations.<br />
In summary, MWQI data are used for planning and protecting <strong>Delta</strong> water<br />
resources. This is the first project report <strong>of</strong> the Municipal Water Quality Investigations <strong>Program</strong>.<br />
C--030627<br />
(3-030627
B. <strong>Program</strong> Advisors<br />
Advice on the program’s direction and technical expertise is provided by two<br />
advisory committees and a subcommittee (Table 1). A Municipal Water Quality<br />
Advisory Committee and Technical Subcommitee provide close coordination and<br />
communication between the MWQI Pr.ogram staff and major water agencies and<br />
regulatory agencies. The Advisory Committee provides policy level guidance and<br />
recommends program modifications as needed to respond to changing drinking water<br />
quality concerns.<br />
The Technical Subcommittee provides a variety <strong>of</strong> expertise, including: knowledge<br />
about the latest analytical methods, water treatment practices, proposed drinking water<br />
standards, interpretation <strong>of</strong> monitoring data, and implemention <strong>of</strong> program changes as<br />
recommended by the Advisory Committee.<br />
A <strong>Delta</strong> Lands Advisory Committee assists the Department in gaining access for<br />
monitoring agricultural drainages in the <strong>Delta</strong>, and provides information about farming<br />
operations and practices that may affect <strong>Delta</strong> water use.<br />
The advisory bodies review and comment on program reports.<br />
C--030628<br />
(3-030628
I Table 1. <strong>Program</strong> Advisors and Participants During 1990<br />
!<br />
Municipal Water Ouality Advisory Committee<br />
Chair: James U. McDaniel ............ <strong>California</strong> Department <strong>of</strong> Water Resources<br />
Dennis Allen .............................. East <strong>Bay</strong> Municipal Utility District<br />
James Baetge ........................... <strong>State</strong> Water Resources Control Board<br />
George Baumli .................................... <strong>State</strong> Water Contractors<br />
Doug Chun ................................. Alameda County Water District<br />
Duane Georgeson .......... The Metropolitan Water District <strong>of</strong> Southern <strong>California</strong><br />
Jerome B. Gilbert .......................... East <strong>Bay</strong> Municipal Utility District<br />
Lyle N. Hoag .............................. <strong>California</strong> Urban Water Agencies<br />
Roger James .............................. Santa Clara Valley Water District<br />
Bruce W. Kuebler ........... City <strong>of</strong> Los Angeles Department <strong>of</strong> Water and Power<br />
Austin Nelson .................................. Contra Costa Water District<br />
Peter A. Rogers <strong>California</strong> Department <strong>of</strong> Health Services<br />
Leo Winternitz .......................... <strong>State</strong> Water Resources Control Board<br />
Technical Subcommittee<br />
Chair: Richard P. Woodard <strong>California</strong> Department <strong>of</strong> Water Resources<br />
Keith Carns ......................... East <strong>Bay</strong> Municipal Water Quality District<br />
John Coburn ...................................... <strong>State</strong> Water Contractors<br />
Andrew Florendo .................... Alameda County Flood Control and Water<br />
Conservation District, Zone 7<br />
Greg Gartrell ................................... Contra Costa Water District<br />
Lyle N. Hoag .............................. <strong>California</strong> Urban Water Agencies<br />
Stuart Krasner ............. The Metropolitan Water District <strong>of</strong> Southern <strong>California</strong><br />
Michael Lanier .............................. Alameda County Water District<br />
Bruce Macler .......................... U. S. Environmental Protection Agency<br />
Edward Means ............. The Metropolitan Water District <strong>of</strong> Southern <strong>California</strong><br />
Alexis Milea ........................ <strong>California</strong> Department <strong>of</strong> Health Services<br />
Hoover Ng ................. City <strong>of</strong> Los Angeles Department <strong>of</strong> Water and Power<br />
Walt Wadlow .............................. Santa Clara Valley Water District<br />
C--030629<br />
(3-030629
<strong>Delta</strong> Lands Advisory_ Committee<br />
Chair: Richard P. Woodard ............<strong>California</strong> Department <strong>of</strong> Water Resources<br />
Jack Baber ...................................... Reclamation District 1004<br />
Mike Catino ................. <strong>California</strong> Central Valley Flood Control Association<br />
Thomas M. Hardesty .............................. Reclamation District 2068<br />
Alex Hildebrand .........Reclamation District 2075 and South <strong>Delta</strong> Water Agency<br />
Donald Kienlan ......................... Murray, Burns, and Kienlen Engineers<br />
James Shanks ...................................... Reclamation District 38<br />
John Winther ........................................ <strong>Delta</strong> Wetlands, Inc.<br />
.<br />
(~--030630
C. Monitoring Stations<br />
The MWQI <strong>Program</strong> staff coordinate several monitoring tasks. These include the<br />
monthly monitoring <strong>of</strong> key <strong>Delta</strong> stations, synoptic surveys to study sea water intrusion,<br />
and <strong>Delta</strong> island drainage sampling.<br />
Water quality is a public health concern at major water supply intakes in the<br />
<strong>Delta</strong>. Five such stations that are monitored routinely include the:<br />
(1) American River Water Treatment Plant intake that serves the City <strong>of</strong><br />
Sacramento (Station 1).<br />
(2) North <strong>Bay</strong> Pumping Plant (Station 87) that serves Solano and Napa<br />
Counties.<br />
(3) Rock Slough at Old River (Station 9), 4 miles east <strong>of</strong> the Contra Costa<br />
Water District intake.<br />
(4) Harvey O. Banks <strong>Delta</strong> Pumping Plant Headworks (Station 12), which is<br />
the headworks <strong>of</strong> the <strong>California</strong> Aqueduct.<br />
(5) <strong>Delta</strong> Mendota Canal Intake at Lindemann Road (Station 11), which is<br />
upstream <strong>of</strong> the Tracy Pumping Plant for the <strong>Delta</strong>-Mendota Canal.<br />
In addition to these stations, other monitoring locations in the <strong>Delta</strong> provide<br />
information about the sources <strong>of</strong> <strong>Delta</strong> waters, and enable a more comprehensive<br />
evaluation <strong>of</strong> water quality conditions.<br />
Synoptic surveys were frequently made in the western <strong>Delta</strong> along Old River.<br />
These surveys tracked the movement <strong>of</strong> sea water entering the SWP, CVP, and CCWD<br />
pumping facilities. The relationship <strong>of</strong> bromide to chloride was examined for modeling<br />
purposes.<br />
Drainage sampling expanded to include Webb Tract, Holland Tract, and Bacon<br />
Island. Access to these lands by permission <strong>of</strong> the <strong>Delta</strong> Wetlands Corporation is<br />
providing the opportunity to compare the drainage quality <strong>of</strong> peat soil areas in the<br />
western <strong>Delta</strong> to other <strong>Delta</strong> islands. Some previously sampled drains were abandoned<br />
because <strong>of</strong> urbanization; new homes have been constructed at Mossdale Tract and a new<br />
golf course has been built at Moss Tract.<br />
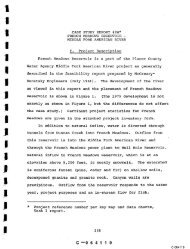
Water quality monitoring stations that were sampled during 1990 are listed in<br />
Table 2. The Station Identification Number (assigned for convenient reference), <strong>of</strong>ficial<br />
DWR Station Number, <strong>of</strong>ficial Station Name, abbreviated station name, and station type<br />
(drainage or non-drainage) are shown.<br />
" C--030631<br />
9<br />
(3-030631
Most channel or export facility monitoring stations were sampled once each<br />
month. Drainage stations were sampled during periods <strong>of</strong> major farming activity that<br />
would have increased drainage volume and affected drain water quality (e.g., summer<br />
irrigation and winter field leaching months). Some channel stations were sampled twice<br />
per month in the southwestern <strong>Delta</strong> to study bromide concentrations due to sea water<br />
intrusion.<br />
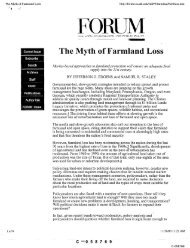
The channel stations within the <strong>Delta</strong> are shown in Figure 1. Agricultural drain<br />
sampling stations are shown in Figure 2.<br />
C--030632<br />
,0
Table 2. Monitoring Stations<br />
STATIOM I)MR<br />
ID STATION# STATION NAIIE STATION ABBREV. TYPE<br />
1A0714010 American Riven at Water Treatment Plant ARERICAN HF<br />
2 B9082071327 Sacramento River at Greene’s Landing GREENES HF<br />
5 B9V81171~69 Ag Drain on Grand Island AGDGRAND N)<br />
7 B9980371300 Littte Connection St. a Empire Tract LCONNECT HF<br />
8 B9V80361299 Ag Drain on Empire Tract, W.end8-Ri. Rd. AGDERPIRE AD<br />
9 B9075841348 Rock Slough ~ Old River ROCKSL HF<br />
10 KAO00000 Clifton Court Intake CLIFTON HF<br />
11B9C74901336 DRC Intake ~ Lindemann Rd. DRC HF<br />
12 KA000331 <strong>Delta</strong> P.P. Headworks BANKS HF<br />
15 B9075351293 Riddle R. ~ Borden H~y. RIDDLER HF<br />
14 B0702000 San Joaquin R. nr. Vernatis VERNAL%S HF<br />
17 EOB80261551 Sacramento River ~ Rattard Island RALLARDI$ NF<br />
20 AOV83681312 Natomas Rain Drain NATONAS AD<br />
21B9VS0541310 Ag Drain on Bouldin Tract, PP. No. 1 BOULDIN1 AD<br />
22 B9V80611335 Ag Drain nn Boutdin Tract, PP. No. 2 BOULDIN2 AD<br />
25 B9V80461224 Ag Drain on King Island, PP. No. 1 KINGISPP01<br />
26 B9VS0271262 Ag Drain on King Island, PP. No. 2 KINGISPP02 AD<br />
27 B9VS0331275 Ag Drain on King Istand~ PP. No. 3 KINGISPP03 AD<br />
44 B9V74811246 Ag Drain on Pescadero Tr., PP. No. 1 PESCADERO01 AD<br />
45 Bgv74811241 Ag Drain on Pescadero Tr., PP. No. 2 PESCADERO02 AD<br />
46 B9V74821231 Ag Drain on Pescadero Tr., PP. No. 3 PESCADERO03 AD<br />
47 B9V81801307 Ag Drain on Pierson Tr., PP. No. 1 PIERSONPP01 AD<br />
50 B9VSO001255 Ag Drain on Rindge Tract, PP. No. 1 RINDGEPP01 AD<br />
51B9VS0271282 Ag Drain on Rindge Tract, PP. NO. 2 RINDGEPP02 AD<br />
59 B9V75441298 Ag Drain on Upper Jones Tr., PP. No. 1 UPJONESPP01 AD<br />
60 B9V75641318 Ag Drain on Upper Jones Tr.w PP. No. 2 UPJONESPP02 AD<br />
61B9VS0671368 Ag Drain on Brannan Island, PP. No. 1 BRANNANPP01 AD<br />
62 B9V80711377 Ag Drain on Brannan Island, PP. No. 2 BRANNANPP02 AD<br />
63 B9V80721385 Ag Drain on Brannan Island, PP. No. 3 BRANNANPP03 AD<br />
64 B9VS0741398 Ag Drain on Brannan Island, PP. No. 4 BRANNANPP04 AD<br />
65 B9V74961340 Ag Drain on Clifton Court AGDCL[FTON AD<br />
68 B9V74781220 Ag Drain on Pescadero Tract, PP. No. 4 PESCADERO04 AD<br />
69 B9V74661251 Ag Drain on Pescadero Tract, PP. No. 5 PESCADERO05 AD<br />
75 B0704000 San Joaquin R. ~ Raze Rd. Bridge MAZE HF<br />
80 KA007089 CA Aqueduct, Ck 13, O’Neill Outlet CHECK 15 HF<br />
85 KA007089 O~NEILL FOREBAY CHECK 13 CHECK13 HF<br />
87 89081661478 Barker St ~ North <strong>Bay</strong> PP BARKERNOBAY HF<br />
88 B9DS0961411 Sacramento River a Rio Vista Bridge SACRRIOVISTA HF<br />
91 89080361275 Honker Cut at Atherton Road Bridge HONKER HF<br />
100 B9075891348 Old R. N/O Rock St (St 4b) STATIONO4B HF<br />
103 B9D75351342 Old R. nr. Byron (St 9) STATION09 HF<br />
105 B9074971331 West Canal at Clifton Court FB Intake WSTCANCLIFT HF<br />
107 B9081481305 <strong>Delta</strong> Cross Channel Gate nr Walnut Grove DELTACRCHAN HF<br />
108 B9081441309 Georgiana Slough at Walnut Grove Bridge 6EORGSLWALNUT HF<br />
110 B9075741317 Riddle River at Bacon Island 8ridge RRIVBACON HF<br />
111B9D75011229 Riddle River at Ro~ry Bridge (Undine Rd) . RIDROkl~Y HF<br />
112 B9075881285 Turner Cut at RcDonatd Island Ferry TURNEROJT HF<br />
113 B9DS0191348 Old River at Sand Round Slough SANDMOUND HF<br />
114 B9D80011307 Riddle River nr Latham St (Ferry Site) LATHAN HF<br />
115 B9080031294 Connection SI. at Randevitte Isl Bridge CONNHAND HF<br />
117 B9075651333 Santa Fe-Bacon Island Cut nr Old River SANTAFEBACON HF<br />
118 B9075481334 Wood~ard/N. Victoria Canal nr Old River NV[CI~O00 HF<br />
119 B9075171329 North Canal nr Old River NORTHCAN HF<br />
121 B9074931328 Grant Line/Fabian/Belt Canals nr Old R. GRANTOLD HF<br />
122 B9074891331 Old River U/S froet DRC Intake OLDR[VDRC HF<br />
123 B9VS0451387 Ag Drain on Webb Tract, PP. No. 1 WEBB01 AD<br />
124 B9V80381361 Ag Drain on Webb Tract, PP. No. 2 WEBB02 AD<br />
125 B9V75931350 Ag Drain on Holland Tract, PP. No. 1 HOLLAND01 AD<br />
126 B9V80011348 Ag Drain on Holland Tract, PP. No. 2 HOLLAND02 AD<br />
127 B9VS0111361 Ag Drain on Holland Tractw PP. No. 3 HOLLAND03 AD<br />
128 B9V75881342 Ag Drain on Bacon Island, PP. No. 1 BACON01 AD<br />
C--030633<br />
11<br />
C-030633
Table 2 (cont.). Monitoring Stations<br />
STATION<br />
ID STATION# STATION NANE STATION A88REV. TYPE<br />
129 Bgv80031328 AO Drain on Bacon Island, PP. No. 2 BACON02 AD<br />
130 B9080311415 San Joaquin River at Jersey Point SJRJERSEY HF<br />
131 B9080301377 False River at Southerly Tip <strong>of</strong> Webb Tr. FALSETIP-tiEBB HF<br />
132 B9074951331 Old River 6/10 mile below DNC intake. OLDR-DNC-CLIFT HF<br />
133 BgO7586XXXX Contra Costa Pt~ping Plant a Rock Slough CONCOSPP1 HF<br />
411B9080771345 Noketumne R. beto~ Georgiana St NOKGEORGIANA HF<br />
413 B9080691298 L. Potato Slough a Terminous LPOTTERN HF<br />
602 B907471118~ San Joaquin R. a Nossdale Bridge SJRNOSSDALE HF<br />
604 B9074731285 Old River nr Tracy OLDRTRACY HF<br />
605 B9075291273 Niddle R<br />
606 B9074921269 Grant Ln Can a Tracy Rd Bdg GRANTLNCAN HF<br />
Type Code: AD refers to agricultural drain<br />
HF refers to non-drainage station<br />
C--030634<br />
I<br />
I<br />
C-030634
S T . ABBREV I ATED<br />
~ ID# STATION NAME<br />
2 GREENES<br />
87 BARKERN~BAY<br />
3 CACHE<br />
i 9<br />
BARKER<br />
4 LINDSEY<br />
~ ~<br />
107<br />
108<br />
DELTACRCHAN<br />
GIORGSLWALNUT<br />
....... ~).%<br />
88<br />
411<br />
413<br />
S IO¥I STA<br />
IANA<br />
L OTTERM<br />
14 OTATOWHI TE<br />
BARKER TRACT<br />
cross<br />
13 0 3 R I ER S EY<br />
SET I P-WEB<br />
LCONNECT<br />
19 4 ~ ~,~,oo, o .... .E..o.E 1 HONKER<br />
~’ANTIOCH<br />
133"<br />
S T . A B B R E V I A 1<br />
ID# STAT ION Nt<br />
33 PP1<br />
100 S TAT I O’N._O *B<br />
12 TURNERC~IT<br />
I01 S TAT I ON’Ok5 A<br />
,,L^.o~ .~<br />
02 S T AT I O N 0 _6 A~ ~----~-./--~_<br />
117 SANTAFEBACON<br />
~:<br />
~ 4 0 5 S J OAQHWY4 LOD["<br />
o,scov~v<br />
"~4t4<br />
LOWER JONES STOCKTON<br />
11 S NV I CWOOD<br />
103 STAT ION09<br />
13 MI DDLER<br />
605 MRIVTI~<br />
1 19 NORT] ~AN<br />
10 C L I F 10<br />
105 ~NCL, 606 ......<br />
121 GRANTOLD 121<br />
6 06 GRANTLNCAN ~’o’<br />
111 MI DMOWRY "~ ~°’<br />
132 OLDR- DMC - CL I.~<br />
11 DMC<br />
12 BANKS 602<br />
i 2 2 OLDR I VDMC<br />
604 OLDRTRACY Fsour.<br />
602 S IRMOSSDALE<br />
14 VERNAL I S TRACY<br />
F~ure 1. Chan~el Stations<br />
C--030635<br />
(3-030635
62 BRANNANPP<br />
63 BRANNANP P ~<br />
64 BRANNANPP~4’<br />
2 1 B OU L D I N 1 / o,scov~v ,..c~ "<br />
2 2 BOULD I N2<br />
25 KINGISPP0/1<br />
26 KINGI SPPff2<br />
27 KINGI S P~ 3 ...... ’ .....<br />
50 RIN~01<br />
51<br />
123<br />
124<br />
RIN~GEPP02<br />
WE~01<br />
WEBB02<br />
~ ~’~ ’~<br />
,s~.o<br />
125 HOLLAND01<br />
126 HOLLAND02<br />
127<br />
128<br />
HOLLAND03<br />
BACON01<br />
UpESCADERO01P JONESPP<br />
4460<br />
45 PESCADERO02<br />
4 6 P E S C A D E R O 0 3 .u~om¢ PLANT<br />
Figure<br />
C--030636<br />
T~AGY<br />
(3-030636
D. Field Sampling Methods<br />
Samples are collected in a specially designed stainless steel bucket, developed by<br />
DWR. The sample bucket is equipped with two Teflon* valves to dispense the collected<br />
water. This is especially useful for filling volatile organic analyses (VOA) vials for<br />
"ITHMFP determinations. Before the bucket is used, it is washed in detergent, rimed in<br />
tap water, and air dried. For some analyses the samples are filtered in the field with a<br />
0.45/~m filter using a peristaltic pump with Teflon* tubing.<br />
A Yellow Springs Instrument~ (YSI) electrical conductivity/temperature meter is<br />
used to record EC and temperature. The Hellige* colorimetric pH kit or a Beckman ~<br />
model 10 portable pH meter was used to determine pH. Dissolved oxygen was<br />
measured with a Yellow Springs Instruments~ Model 50 dissolved oxygen meter. All<br />
electrical conductivity meters are calibrated before use on each data collection run.<br />
Filtered samples for VOA were collected in 40 ml. glass vials. Sample containers<br />
were completely filled to eliminate air space and air bubbles. The caps <strong>of</strong> the 40 ml.<br />
vials were fitted with Teflon* coated septa, as specified by the U.S. Environmental<br />
Protection Agency. Samples were kept on ice, or refrigerated and delivered to the<br />
laboratory within 24 hours <strong>of</strong> collection. ¯<br />
Separate sample containers were collected for laboratory measurements <strong>of</strong><br />
bromide and UVA.<br />
At least one field duplicate was collected on each sampling run (usually one<br />
duplicate in seven to ten samples). The duplicates were submitted to the laboratories<br />
with the regular samples as a quality assurance check.<br />
E. Analytical Methods<br />
At the receiving laboratory, water samples for T1MMFP analysis were chlorinated<br />
(inoculated) with about 120 mg/L chlorine. This high dosage was used to assure a<br />
chlorine residual after the 7-day incubation period at 25 degrees Celsius. At the end <strong>of</strong><br />
7 days, the chlorine residual was determined. The residual chlorine was then quenched<br />
using sodium thiosulfate, and the sample was analyzed for trihalomethanes by the gas<br />
chromatograph purge and trap methodology <strong>of</strong> EPA Method 502.2. THM analyses were<br />
performed at DWR’s Bryte Laboratory.<br />
Bryte Laboratory performed mineral, trace element, and nutrient analyses<br />
following EPA Method 600-4-79-020, Methods for Chemical’ Analysis <strong>of</strong> Wa~¢r and<br />
Wastes (Revised March, 1983) and the U.S. Geological Survey’s Methods for<br />
Determination <strong>of</strong> Inorganic Substances in Water and Fluvial Sedimen~;,s. Further detail<br />
about laboratory methods used by Bryte Laboratory may be found in The <strong>Delta</strong> As A<br />
Source<strong>of</strong> Drinking Water, Monitoring Results 1983-1987, published by DWR.<br />
C--030637<br />
(3-030637
Quality assurance procedures were in accordance with the DWR B _ryte Chemical<br />
Laboratory. Ouality Assurance Prod, ram document dated April 4, 1990.<br />
-<br />
A Quality Assurance Project Plan is being adhered to by Department staff to<br />
emure data integrity in the MWQI <strong>Program</strong>.<br />
C--030638
MONITORING RESULTS<br />
A. Monthly Observations<br />
Drought conditions occurred in water year 1987 (beginning October 1, 1986) and<br />
continued through 1990. Consequently, <strong>Delta</strong> water quality has reflected the prolonged<br />
dry weather hydrology.<br />
1, <strong>Delta</strong> Outflow and River lnfl0w8<br />
Dry year conditions stretched into 1990 with low Sacramento and San Joaquin<br />
River flows to the <strong>Delta</strong>. The Sacramento River flows at Freeport averaged less than<br />
15,000 cfs after January 1990 storms had passed. San Joaquin River flows near Vernalis<br />
remained nearly constant, averaging about 1300 cfs. The Net <strong>Delta</strong> outflows at Chipps<br />
Island (computed <strong>Delta</strong> Outflow using DWR DAYFLOW model) were also low, under<br />
5,000 cfs during the 1990 summer. The monthly mean flows, as estimated by the<br />
Department’s DAYFLOW computer model, are shown in Figure 3 for water year 1990.<br />
As has been true in previous dry years, the primary source <strong>of</strong> fresh water into the<br />
<strong>Delta</strong> export facilities has been the Sacramento River. San Joaquin River flows into the<br />
<strong>Delta</strong> have been extremely low and have been largely diverted to the DMC intake.<br />
USGS gaging stations measure flows at Freeport (Sacramento River) and Vernalis<br />
(San Joaquin River). Net <strong>Delta</strong> outflow at Chipps Island is a computed estimate based<br />
on DAYFLOW model assumptions for precipitation run<strong>of</strong>f and consumptive use. Daily<br />
weather measurements at Stockton Fire Station No. 4 are used for precipitation values.<br />
The model assumes that the entire <strong>Delta</strong> receives uniform rainfall, and that the run<strong>of</strong>f is<br />
evenly distributed over a period <strong>of</strong> five days beginning at the initial storm rainfall.<br />
Consumptive use estimates, also referred to as the <strong>Delta</strong>wide Gross Channel Depletion<br />
Estimate, are fixed average values assigned to each calendar month, regardless <strong>of</strong><br />
meteorological or hydrological conditions. Therefore, the computed DAYFLOW net<br />
<strong>Delta</strong> outflow estimate is subject to the limitations <strong>of</strong> the model assumptions.<br />
Electrical conductivity observations are summarized for the key channel stations<br />
in Figure 4.<br />
C--030639<br />
(3-030639
Figure 3<br />
<strong>Delta</strong> Flows for Water Year 1990<br />
Based on DWR DAYFLOW <strong>Program</strong> model run 3/25/91<br />
Flow (cfs)<br />
20,000<br />
5 000<br />
0,000<br />
5,000<br />
Monthly mean flows<br />
Oct Nov Dec Jan Feb Mar Apt May Jun Jul Aug Sep<br />
Month ] 989-90<br />
S JR<br />
~ Sac. River Cal.c. <strong>Delta</strong> Outflow<br />
O<br />
O
~<br />
E.C. (u$/cm)<br />
Figure 4<br />
Electrical Conductivity 1990<br />
Monthly Average<br />
1,400<br />
18,000<br />
1,300<br />
1,200<br />
16,000<br />
1,100 14,000<br />
1,000<br />
9.00<br />
12,000<br />
800<br />
700<br />
600<br />
~<br />
i~/<br />
10,000<br />
8,000<br />
500<br />
400<br />
6,000<br />
30O<br />
J F M A M J J A S O N D<br />
Month<br />
4,000<br />
Mallard Isl.<br />
Based on grab samples<br />
Use right scale for Mallard Isl.<br />
Left scale for other stations<br />
~ Rock SI. ~-~ Banks Hdwrks. ~-~ DMC Intake SJR Vernalis
2., Sodium<br />
High levels <strong>of</strong> sodium can harm crops, corrode pipes, and make water unpalatable<br />
to drink. Excess sodium in the diet can cause health problems for people with heart<br />
conditions and high blood pressure.<br />
The National Academy <strong>of</strong> Sciences has two advisories for sodium: 20 mg/L for<br />
people on severely restricted sodium diets, and 100 mg/L for those on moderately<br />
restricted diets. There are no federal or <strong>State</strong> drinking water standards for sodium at<br />
this time. EPA is unlikely to set a sodium standard soon, as agency staff have removed<br />
sodium from the Drinking Water Priority List. Currently, evidence is inconclusive as to<br />
whether elevated blood pressure is linked to sodium intake from drinking water; also<br />
most sodium intake comes from food.<br />
Current EPA regulation requires all public water suppliers to monitor sodium in<br />
their drinking water and to report the levels to local authorities (40 CFR 141.41). When<br />
sodium levels are high, water suppliers must notify the <strong>State</strong> Department <strong>of</strong> Health<br />
Services which, in turn, coordinates with local health authorities to inform the public.<br />
The major sources <strong>of</strong> sodium in the <strong>Delta</strong> are:<br />
1. sea water intruding into the <strong>Delta</strong>,<br />
2. local <strong>Delta</strong> drainages containing elevated salt concentrations<br />
due to the evaporation <strong>of</strong> applied irrigation water, and<br />
3. Central Valley drainage discharged into the San Joaquin<br />
River.<br />
Because San Joaquin River flows have been low (averaging less than 1300 cfs),<br />
most <strong>of</strong> the water returns to the Central Valley by way <strong>of</strong> the <strong>Delta</strong> Mendota Canal.<br />
Sodium impacts from the San Joaquin River, if any, are probably localized to the<br />
southern <strong>Delta</strong> region along Old River, and Grant Line, Fabian, and Bell canals.<br />
Sodium concentrations at stations near drinking water supply intakes are shown<br />
Figure 5. Sodium concentrations were above 100 mg/L at the Rock Slough at Old River<br />
station in April, and again during fall 1990. In contrast, sodium averaged 10 mg/L at the<br />
Sacramento River at Greene’s Landing station during the year.<br />
C--030642<br />
,o !<br />
(3-030642
Figure 5 ~<br />
Sodium Concentrations (mg/L) 1990<br />
Sodium (rag/k)<br />
140 o’<br />
120 -<br />
100 ," ", ¯<br />
80 "~ ,’ "’" " ,"<br />
¯ / ~ "~ , /"<br />
60 ~’"<br />
~<br />
Month 1990<br />
Greenes Landing Rock SI. Banks Headworks American WTP No. <strong>Bay</strong> PP<br />
Monthly mean <strong>of</strong> grab samples
3, Trihalomethane Formation Potential<br />
Disinfection <strong>of</strong> water supplies is a standard practice <strong>of</strong> water agencies distributing<br />
drinking water to the public. The addition <strong>of</strong> chlorine is widely used as a highly reliable<br />
and economical method <strong>of</strong> disinfection. During the chlorination process, chlorine reacts<br />
with certain complex organic compounds and bromide ions in the water to form<br />
disinfection byproduct compounds including THMs. The total THM levels in drinking<br />
water are regulated by the <strong>State</strong> and federal governments.<br />
Four trihalomethanes are found in drinking water: chlor<strong>of</strong>orm (CHC13) ,<br />
dichlorobromomethane (CHC12Br), dibromochloromethane (CHC1Br2), and brom<strong>of</strong>orm<br />
(CHBr3). Of these, chlor<strong>of</strong>orm is classified as a carcinogen. Currently, the Maximum<br />
Contaminant Level for total THMs is 0.100 mg/L (equivalent to 100/~g/L or parts per<br />
billion) in treated water samples, computed as an arithmetic sum <strong>of</strong> the concentrations <strong>of</strong><br />
the four THM chemical species. Compliance is determined as a running annual average<br />
<strong>of</strong> quarterly samples taken from representative points in the drinking water distribution<br />
system.<br />
Since 1983, TI~MFP <strong>of</strong> <strong>Delta</strong> waters has been measured by DWR to better<br />
understand the sources and distribution <strong>of</strong> THM precursors in the <strong>Delta</strong>. The TI’HMFP<br />
test is an assay designed to measure the maximum concentration <strong>of</strong> THMs that would be<br />
formed if chlorine dosage and reaction times were essentially unlimited. The purpose <strong>of</strong><br />
the assay is to enable a comparison <strong>of</strong> untreated source water supplies with respect to<br />
their capacity to form THMs.<br />
Water samples are collected and initially spiked with a high dosage <strong>of</strong> chlorine<br />
(120 mg/L) to ensure a chlorine residual for a seven-day reaction (incubation) period.<br />
The high dose maximizes the conversion <strong>of</strong> THM precursor material in the samples to<br />
the four THM compounds. The samples are quenched at the end <strong>of</strong> the incubation<br />
period using sodium thiosulfate. Standard EPA methodology is used to analyze the<br />
water after the incubation period. While the analytical procedures are consistent with<br />
EPA methods, they are not intended to simulate the chlorination practices at water<br />
treatment facilities. The TTHMFP measured in a source water sample cannot be<br />
compared with THMs produced in a drinking water system.<br />
No direct mathematical relationship has been developed between the results <strong>of</strong><br />
the TI’HMPF assay and THM concentrations that might be expected from chlorination<br />
practices and THM control used by treatment plants. One reason is that treatment<br />
practices and raw water quality vary from one purveyor to the next, so a comparison is<br />
not necessarily possible. However, it is generally true that the amount <strong>of</strong> THMs formed<br />
during normal disinfection is related to the amount <strong>of</strong> precursor materials available<br />
initially. Water supplies low in THM precursors are generally more easily and<br />
C--030644<br />
C-030644<br />
!
!<br />
inexpensively treated to meet drinking water standards. THM concentrations are<br />
generally low in drinking water produced from sources containing low levels <strong>of</strong> THM<br />
precursors.<br />
The TFHMFP concentrations measured during 1990 are shown in Figure 6.<br />
The amount <strong>of</strong> carbon associated with THM formation was computed. This<br />
carbon is referred to as the THM formation potential expressed as carbon, or TFPC. It<br />
is calculated from the concentration (mg/L) and percentage <strong>of</strong> carbon in each <strong>of</strong> the<br />
four THM compounds formed during the TI’HMFP test. Monthly averages <strong>of</strong> TFPC<br />
during 1990 are shown in Figure 7.<br />
The shifts in "ITHMFP concentrations at the Rock Slough station paralleled those<br />
from the Greene’s Landing station. However, Rock Slough TFHMFP was higher by<br />
about 150 ~zg/L or 15 ~g/L TFPC higher than at Greene’s Landing. As stated in the<br />
report, <strong>Delta</strong> Island Drainage Investigation (DWR, June 1990), <strong>Delta</strong> island drainage<br />
discharges are a significant source <strong>of</strong> organic THM precursor material. The TH-IMFP at<br />
the Banks Headworks ranged from 500 to 600 ~g/L (38 to 50/~g/L TFPC). Drainage<br />
THtMFP data are presented and discussed in Section E <strong>of</strong> this report.<br />
C--030645<br />
(3-030645
seldtues qeJl~ |0 ueeuJ ~lq),uolN<br />
dd ~B8 "ON dJ.AA ueopeLuv S)lJo~PeeH S)IUEE] "IS )IOOEI 5u}pueq seueeJE)<br />
066 L q},uo~<br />
r r IAI V ~ :I r<br />
066 I. suo!|eJlueouoo d:llN H.L<br />
9 aan~!~l<br />
000’ I.
Figure 7<br />
THM Formation Potential Carbon (TFPC) 1990<br />
TFPC (ug/L)<br />
100<br />
0 I I I I I I I i I I I I<br />
J F M A M J J A S O N D<br />
Month 1990<br />
Greenes Landing Rock SI. Banks Headworks American WTP No. <strong>Bay</strong> PP<br />
Monthly mean ~ grab samples<br />
O
B. Water Quality Relationships<br />
Statistical analyses were performed on the data set to determine if any<br />
relationships among different water quality measurements could predict total THM<br />
formation potential. If consistent and proven relationships could be determined,<br />
surrogate parameters could be measured which would have the potential <strong>of</strong> reducing<br />
laboratory analytical costs. Data on surrogate parameters could also be used to model<br />
THM formation potential in the <strong>Delta</strong>. All data collected at the major stations were<br />
evaluated. However, most <strong>of</strong> the correlations that were tested were limited to 1990 data.<br />
This is because earlier measurements did not ~nclude bromide and UVA.<br />
Statistical analyses were performed on the data for each monitoring station or, in<br />
the case <strong>of</strong> agricultural drains, all data collected from an island or tract. A station-bystation<br />
or tract-by-tract analysis was necessary because <strong>of</strong> the nonhomogeneity <strong>of</strong> data<br />
sets resulting from island drainage monitoring. The combining <strong>of</strong> data sets from peat<br />
soil islands with mineral soil islands was considered but was not done in this first round<br />
<strong>of</strong> statistical analyses. The reasons were:<br />
(1) The total number <strong>of</strong> observations and time <strong>of</strong> sampling<br />
varied among the stations; the results, if grouped, would be<br />
skewed and biased.<br />
(2) Because <strong>of</strong> the geographical spread <strong>of</strong> the stations, the data<br />
would reflect differences in channel (siphon) water quality, as<br />
well as the multitude <strong>of</strong> soil variations between mineral and<br />
organic soils. Therefore, the grouped data would be more<br />
scattered and more difficult to interpret.<br />
(3) The decision was made to wait for more data to be collected.<br />
Permission was granted to sample more drain sites in 1991.<br />
Data collected from these new monitoring sites will be<br />
evaluated in 1992 along with data from existing sites.<br />
R-squared (R2) values were calculated for each regression analysis. The strength<br />
<strong>of</strong> the tested correlation increases as the R-squared value approaches 1.0 and "decreases<br />
as it approaches 0.0. High R-squared values do not necessarily show a cause and effect<br />
relationship but are one <strong>of</strong> many statistical tools used to study data and determine<br />
possible relationships. R-squared values are generally estimated incorrectly when sample<br />
sizes are small, and may also yield incorrect estimates when multiple variables are tested.<br />
Therefore, until more data are collected at some stations, descriptive statistics (e.g.,<br />
mean, range) and regression results (e.g., R-squared) for small sample sizes (less than<br />
30) should be evaluated with caution. The basis for testing hypotheses about the<br />
existence <strong>of</strong> a relationship between variables (e.g., EC vs. CI) is the assumption that the<br />
data has a normal distribution. The determination <strong>of</strong> a normal distribution relies on<br />
C--030648<br />
C-030648<br />
!
increasing the number <strong>of</strong> observations taken.<br />
Poor correlations may result from collective treatment <strong>of</strong> data from different<br />
points in the <strong>Delta</strong>. Since water quality in the <strong>Delta</strong> changes with season, there can also<br />
be seasonal relationships that may not be evident when the data are collectively tested.<br />
Presently, these seasonal correlations, especially at the channel stations, could not be<br />
tested because <strong>of</strong> too few data points. Until more data are collected, the following<br />
results are limited in the depth <strong>of</strong> analysis and must be considered preliminary.<br />
The R-squared results <strong>of</strong> the statistical analyses are summarized in Table 3. Low<br />
R-squared values for linear models (e.g., Y = a + bX) do not necessarily indicate a lack<br />
<strong>of</strong> relationship between variables. A nonlinear relationship such as curvilinear might<br />
exist. High R-squared values may indicat~ a possible relationship but other statistical<br />
considerations must be evaluated. These include sample size, type <strong>of</strong> model tested (e.g.,<br />
linear, power, exponential), residuals (the difference between the observed value and the<br />
predicted value from the regression equation), degree <strong>of</strong> normal distribution, and the<br />
result <strong>of</strong> other statistical tests (e.g., t-test, F ratio). Some R-squared values may be<br />
overestimated if the variability <strong>of</strong> the dependent variable increases as the dependent<br />
variable increases or if the data are clustered. This would be a heteroscedastic<br />
correlation.<br />
In cases where there are few data points, the intercepts, slopes, and equations<br />
presented may change significantly as more data are collected. Therefore, the<br />
preliminaryregression equations presented reflect the limitedpool <strong>of</strong> observations and<br />
cannot be used to predict future observations.<br />
C--030649<br />
C-030649
Table 3. R-Squared Regression Results<br />
The R 2 r~ress~on results for each station are presented belo~. The n size refers to the ~r <strong>of</strong> d~ta points (s~les) used to test the r~ression<br />
~mx~e[. All results ~t ~ c~i~red preliminary ~a~e <strong>of</strong> the stall s~le sizes (n < 30). The R ~ val~s my ~ overestimted ~ to cl~teri~<br />
aN heteroscedssticity.<br />
Regressio~ Result 1 2 3 4 5 6 7 8 9 10 11 12 13 14 15<br />
Variables Tested Br to Ct Br to TTHMFP TTHMFP TTHNFP UVA TTHMFP TFPC TFPC THMFP TItNFP TTHRFP TFPC TFPC<br />
Ct to EC to 8r to to UVA to to DOC to to to to to to to<br />
Station Sta- conc. EC Color DOC DO(: UVA Br + Cl + Br + Br + Cl +<br />
lion DO(: ~A WA ~A UVA<br />
ID #<br />
~ERICAN I 0.~ * I 0.004 0.6~ 0.~ 0.0~ 0.005 0.437 0.6~ 0.607<br />
n size 4 2 14 6 5 14 14 6 6 6<br />
6REENES 2 0.199 * 0.119 0.017 0.255 0.009 0.443 0.354 0.347 0.033 0.316 0.035 0.024 0.033 0.065<br />
n size 15 15 15 ~4 12 9 20 20 12 12 12 12 12 12<br />
CACHESL 3 * O. 163<br />
n size 15<br />
LINDSEYSL 4 * 0.0/+7 0.021 0.02<br />
n size 68 8 8<br />
AGOGRAND 5 * 0.334 0.803 0.813<br />
n size 58 33 33<br />
AGOTYLER 6 * 0.011 1 1<br />
n size 19 2 2<br />
LCONNECTSL 7 0.085 * 0.286 0.959 0.389 0.367 0.268 0.623 0.629 0.367 1 0.528 1 1 0.534<br />
n size 3 3 3 62 4 4 13 13 4 3 4 3 3 4
Table 3. (continued)<br />
Regression Result 1 2 3 4 5 6 7 8 9 10 11 12 13 14 15<br />
Variables Tested Br to C[ Br to TTHHFP TTHHFP TTHMFP UVA TTHNFP TFPC TFPC THMFP THMFP TTHNFP TFPC TFPC<br />
CI to EC to Br to to UVA to to DOC to to to to to to to<br />
Station Sts- conc. EC Color DOC DOC UVA Br + Cl + Br + Br + Ct +<br />
lion DOC UVA UVA UVA UVA<br />
ID #<br />
AGOEHPIRE 8 0.887 * 0.852 0.788 0.056 0.968 0.996 0.004 0.009 0.95 0.947 0.972 0.971 0,962 0.964<br />
n size 10 10 8 75 7 7 /+6 46 7 8 7 7 7 7<br />
ROCKSL 9 0.938 * 0.939 0.095 0.01 0.009 0.412 0.137 0.155 0 0.459 0.07 0.093 0.001 0.008<br />
n size 29 29 29 77 25 7 15 15 25 10 25 25 25 25<br />
CLIFTON 10 0.129 * 0.11 0.617 0.028 0.238 0.698 0.346 0.297 0.254 0.636 0.529 0.654 0.24 0.415<br />
GATE<br />
n size 10 10 8 76 8 8 13 13 8 8 8 8 9 8<br />
DMC 11 0.829 * 0.747 0.146 0.024 0.007 0.756 0.077 0.113 0.028 0.741 0.135 0.161 0.079 0.055<br />
n size 29 29 28 87 23 9 20 20 23 12 23 23 24 23<br />
BANKS 12 0.874 * 0.87 0.005 0.007 0.17 0.497 0.111 0.133 0.096 0.298 0.191 0.197 0.137 0.29<br />
HDk~KS<br />
n size 29 29 27 93 24 10 16 16 24 10 24 24 26 24<br />
N%DDLE RIV 13 0.926 * 0.905 0.493 0.03 0.288 0.602 0.348 0.318 0.269 0.607 0.439 0.597 0.387 0.286<br />
n size 11 11 11 91 9 9 38 38 9 10 9 9 9 9<br />
VERNALIS 14 0.49 * 0.337 0.032 0.034 0.314 0.43 0.39 0.41 0.332 0.39 0.318 0.318 0.18/+ 0.353<br />
n size 16 16 15 91 13 10 34 37 13 11 13 13 14 13
Table 3. (continued)<br />
Regression Resutt 1 2 3 4 5 6 7 8 9 10 11 12 13 14 15<br />
Variables Tested Br to C[ Br to TTHHFP TTNHFP TTHNFP UVA TTNNFP TFPC TFPC THHFP THNFP TTHNFP TFPC I"FPC<br />
Cl to EC to Br to to UVA to to DOC to to to to to to to<br />
Station Sta- c~. EC Color DOC DO(; IJVA Br + Cl + Br + Br + Cl +<br />
t i on<br />
DOC UVA UVA UVA UVA<br />
ID #<br />
NALLARD 17 0.~ * 0.876 0.001 0.005 0.091 0.5 0.035 0.006 0.108 0.115 0.I~ 0.143 0.117 0.128<br />
ISL.<br />
n size 28 28 28 61 25 9 17 17 17 10 25 24 24 25<br />
NO BAY 18 * 0.284<br />
n size 46<br />
BARKER SL 19 * 0.193<br />
n size 13<br />
NATONAS DR 20 0.677 * 0.727 0.169 0.038 0.783 0.832 0.197 0.207 0.77 0.227 0.785 0.765 0.782<br />
n size 10 10 10 44 12 10 40 40 12 8 12 9 12<br />
I~AZE 75 0.408 * 0.45 0.208 0.147 0.804 0.835 0.357 0.373 0.831 0.518 0.806 0.804 0.833 0.84<br />
n size 14 14 14 35 10 9 24 24 10 13 10 10 10 10<br />
BKR NO BAY 87 0.405 * 0.338 0.187 0.146 0.493 0 0.359 0.238 0.518 0.35 0.38 0.184 0.165 0.746<br />
n size 12 12 11 32 12 9 15 15 12 9 13 11 11 12<br />
SACRIO- 88 0.15 * 0.126 0.001 0.378 0.008 0.429 0.529 0.551 0.009 0.773 0.038 0,053 0.0~ 0.068<br />
VISTA<br />
n size 27 27 26 27 25 10 16 16 25 9 26 24 24 25<br />
BA~ 1000 0.~I * 0.498 0.003 0.292 0.~6 0.94 0.4~ 0.515 0.~5 0.~ 0.~7 0.964 0.736 0.~7<br />
DRAINS<br />
n size 9 9 8 13 8 10 13 13 8 8 8 7 8 8<br />
L
Table 3. (continued)<br />
Regression Result 1 2 3 4 5 6 7 8 9 10 11 12 13 14 15<br />
Variables Tested<br />
Station Sta-<br />
tion<br />
ID #<br />
Br to<br />
Cl<br />
conc.<br />
Ct<br />
to<br />
EC<br />
Br to<br />
EC<br />
TTHHFP<br />
to Br<br />
TTHHFP<br />
to<br />
Color<br />
TTHHFP<br />
to INA<br />
UVA<br />
to<br />
DOC<br />
TTHHFP<br />
to DO(;<br />
TFPC<br />
to<br />
DOC<br />
TFPC<br />
to<br />
UVA<br />
THNFP<br />
to<br />
Br +<br />
DOC<br />
THHFP<br />
to<br />
Cl +<br />
UVA<br />
TTHNFP<br />
to<br />
Br +<br />
UVA<br />
TFPC<br />
to<br />
Br +<br />
UVA<br />
TFPC<br />
to<br />
CI +<br />
WA<br />
BOULDIN 1001 0.45 * 0.488 0.805 0.255 0.903 0.942 0.333 0.308 0.907 0.987 0.932 0.9~ 0.97 0.931<br />
DRS.<br />
n size 12 12 12 79 13 13 67 67 13 12 13 10 10 13<br />
BRANNAN 1002 0.755 * 0.681 0.023 0.13 0.293 0.703 0.462 0.454 0.292 0.475 0.428 0.371 0.401 0.454<br />
DRS.<br />
n size 13 13 13 88 18 20 43 43 18 13 18 13 13 18<br />
HOLLAND 1003 0.238 * 0.0~+2 0.015 0.195 0.682 0.768 0.549 0.569 0.686 0.327 0.683 0.599 0.602 0.69<br />
DRS.<br />
n size 11 11 11 20 14 17 20 20 14 11 14 10 10 14<br />
KING IS. 100~ 0.935 * 0.749 0.178 0.471 0.867 0.876 0.519 0.54 0.893 0.926 0.915 0.927 0.926 0.917<br />
n size 11 11 11 53 14 13 31 31 14 11 14 11 11 14<br />
PESCADERO 1005 0.93 * 0.962 0.26~ 0.167 0.195 0.684 0.19 0.235 0.317 0.354 0.593 0.66~ 0.6~ 0.582<br />
DRS.<br />
n size 11 11 11 43 14 17 33 33 14 11 14 11 11 14<br />
RINDGE 1006 0.168 * 0.809 0.110 0.193 0.445 0.388 0.426 0.363 0.601 0.877 0.471 0.598 0.624 0.619<br />
DRS.<br />
n size 7 7 7 34 9 9 20 20 9 7 9 7 7 9<br />
UP JO~ES 1007 0.285 * 0.386 0.281 0.402 0.651 0.315 0.901 0.91 0.523 0.368 0.655 1 1 0.542<br />
DRS.<br />
n size 4 4 4 38 5 6 32 32 5 4 5 3 3 5
Table 3. (continued)<br />
Regression Result 1 2 3 4 5 6 7 8 9 10 11 12 13 14 15<br />
Variables Tested Br to Ct Br to TTHI4FP TTHI~FP TTH~4FP IJVA TTHMFP TFPC TFPC THI~FP TH#FP TTHRFP TFPC TFPC<br />
CI to EC to Br to to UVA to to DO(: to to to to to to to<br />
Station Staconc.<br />
EC Color DOC DO(~ UVA Br + Cl + Br + Br + Ct +<br />
lion DOC UVA UVA tJVA LIVA<br />
~BB DRS. 1008 0.212 * 0.216 0.007 0.226 0.928 0.~ 0.781 0.805 0.922 0.~6 0.93 0.945 0.6~ 0.924<br />
n size 10 10 9 11 9 11 11 11 9 9 9 8 9 9<br />
The chloride to EC relationships are specific to each reach <strong>of</strong> the <strong>Delta</strong> and treated as such in mathematical ~ater quality medets <strong>of</strong> the <strong>Delta</strong>.<br />
These correlations uere not catcutated in this evaluation.<br />
I
I 1, Bromide and Chloride Concentrations<br />
I The relationship between two major sea water ions, bromide and chloride, was<br />
examined. Channel stations in the western <strong>Delta</strong> were expected to have the best<br />
bromide to chloride correlations. Stations further inland and less affected by sea water<br />
i intrusion were expected to have poorer bromide to chloride relationships. Island<br />
drainage water samples in the western <strong>Delta</strong>, and samples <strong>of</strong> drainage water overlying<br />
connate ground water, were also expected to have a good bromide to chloride<br />
correlation. The linear model Br (mg/L)= constant + C1 (mg/L) was tested.<br />
I<br />
The following channel stations had R2 values <strong>of</strong> at least 0.8 for about 30<br />
I observations:<br />
Rock Slough: Br = 0.052+ 0.003 C1 I (n -- 29, R2 = 0.94)<br />
DMC intake: Br = 0.003 C1 (n = 29, R2 = 0.83)<br />
Banks<br />
I Headworks: Br = 0.052+0.003 C1 (n = 29; R2 = 0.88)<br />
North <strong>Bay</strong>: Br = 0.003 C1 (n -- 28; R2 -- 0.87)<br />
I<br />
I<br />
The American River station had a 0.966 R2, but it is based on only four samples.<br />
Samples collected at the Clifton Court Forebay intake gate (channel side) correlated<br />
poorly. However, data from the Banks Pumping Plant Headworks correlated well and<br />
these data are representative <strong>of</strong> water entering the SWP.<br />
2. Chloride and EC<br />
! The chloride to EC relationships are specific to each reach <strong>of</strong> the Delt~ and are<br />
treated as such in mathematical water quality models <strong>of</strong> the <strong>Delta</strong>. These correlations<br />
I were not calculated for this evaluation.<br />
I<br />
I<br />
I<br />
I<br />
3, Bromide and EC<br />
The linear model Br (rag/L) = constant + EC (#S/cm) was tested. The<br />
correlations <strong>of</strong> bromide to electrical conducti.vity (EC) were similar to those <strong>of</strong> bromide<br />
to chloride. This probably reflects sea water influence during the 1990 drought year.<br />
The following stations had R-squared values greater than 0.80 based on about 30<br />
observations:<br />
Rock Slough: Br = -0.087+0.001 EC (n = 29; R2 = 0.94)<br />
I<br />
Banks<br />
Headworks: Br = 0.001 EC<br />
Mallard Island: Br = 0.001 EC<br />
(n = 29; R2 = 0.87)<br />
(n = 28; R2 = 0.88)<br />
I<br />
I<br />
C--030655<br />
33<br />
C-030655
Results for the other stations are shown in Table 3.<br />
4, T/’HMFP and Bromide<br />
The correlation <strong>of</strong> bromide concentrations to total THM formation potential<br />
concentrations was computed. Correlations were poor for the linear model TI’HMFP<br />
(/~g/L) = constant + Br (mg/L). These results agreed with work by Amy, Chadick, and<br />
Chowdhury (1987).<br />
5. TI’HMFP and Color<br />
Color in water may result from the presence <strong>of</strong> humus and peat materials, algae,<br />
minerals, metals, plants, and wastes. Since humic substances are well documented THM<br />
precursors, color measurements and TI’HMFP data were compared.<br />
The linear model THIMFP (/~g/L) = constant + Color (units) was tested. The<br />
regression analyses showed extremely poor correlations between T’FHMFP and color in<br />
all water samples. Color is, therefore, not a useful indicator <strong>of</strong> TI’I-IMFP.<br />
Consideration may be given to eliminating color measurements from the sampling<br />
program. However, color measurements <strong>of</strong> the source water can be useful to water<br />
treatment operators who must deal with color problems.<br />
6. TFHMFP and UVA-254nm<br />
Aromatic organic compounds (e.g., humic substances) and compounds having<br />
conjugated double bonds will absorb ultraviolet light. UVA measurements at 254 nm<br />
indicate the amount <strong>of</strong> naturally occurring organic matter, such as humic acid and fulvic<br />
acid, present in a water sample. UVA data were, therefore, compared to TI’HMFP<br />
data. The linear model T1MMFP (/,g/L) = constant + UVA-254 nm was tested.<br />
The strongest correlations between TTHMFP and UVA were from drain water<br />
samples collected from Empire Tract (R2 = 0.968), Bacon Island (0.956), Bouldin<br />
(0.903), King Island (0.867), and Webb Tract. (0.928). The San Joaquin River at Maze<br />
Road station had the highest R2 (0.804) <strong>of</strong> all channel stations. However, the data<br />
collected at the Maze station reflects upstream discharges <strong>of</strong> agricultural drainage into<br />
the San Joaquin River.<br />
The correlations suggest that UVA-254 may be a good surrogate for TI’HMFP for<br />
drain water samples collected from peat island areas. Data collected from drains on<br />
Bouldin Island are shown in Figures 8 - 10. Figure 8 shows the range <strong>of</strong> TFHMFP<br />
concentrations by month (1987-90). Figure 9 shows the range in UVA-254 nm<br />
measurements at the same location by month. UVA measurements began in 1990.<br />
Figure 10 shows the linear regression line between UVA and TI’HMFP.<br />
C--030656<br />
(3-030656
It is unclear if UVA can be used successfully to predict TI’HMFP in <strong>Delta</strong><br />
channel waters. The correlations vary widely. Interferences in UVA may occur because<br />
<strong>of</strong> certain inorganics, such as nitrite and bromide, that absorb light in the UV range<br />
when present in high concentrations. Laboratory experiments that measure the effect <strong>of</strong><br />
bromide and nitrite concentrations on UVA measurements are needed.<br />
13--030657<br />
C-030657
Figure 8<br />
TTHMFP Range at Bouldin Island<br />
All drains by month<br />
TTHMFP (ug/L)<br />
5,000<br />
4,000 ¯ .<br />
3,000 = ~ ~o<br />
8<br />
¯ ¯<br />
¯ 8 o<br />
~,ooo 8 ?<br />
~,ooo<br />
¯<br />
~<br />
¯ 8<br />
¯ 8
UVA<br />
3<br />
0.5<br />
Figure 9 ~<br />
UVA-254nm Range at Bouldin Island<br />
All drains by month<br />
¯<br />
1 2 3 4 5 6 7 8 9 10 11 12<br />
Month<br />
¯<br />
¯
1...<br />
~:L=U<br />
06"0 = p~enb~-I:!<br />
(-11~n) d:IIAIHJ..L<br />
O00’!ii 000’I~ 000’~ 000’~ 000’ I. 0<br />
I,~ - VAn<br />
su!eJp ll~i<br />
puel~l u!plno~! |e uo!ssaJ6al:! d4NHJ.J.- ’~’^n
i 7. UVA ~tnd DOC<br />
UVA-254nm data were also compared against DOC data. In some cases, the<br />
correlations were higher than the R2 values computed for UVA and T’I’HMFP. The<br />
linear model UVA = constant + DOC (mg/L) was tested.<br />
The strongest correlations were from drain water samples taken from Empire<br />
Tract (R 2 = 0.996), Bacon Island (0.94), Bouldin Island (0.942), King Island (0.876),<br />
Webb Tract (0.909), and Natomas Drain (0.832). San Joaquin River at Maze Road had<br />
a R2 <strong>of</strong> 0.835. UVA increased proportionately to DOC. The strong correlation found at<br />
these drains may be due to the high amount and consistent proportion <strong>of</strong> humic material<br />
in the dissolved fraction <strong>of</strong> organic matter. The UVA to DOC regression for Bouldin<br />
Island drains is shown in Figure 11.<br />
Since water supplies contain a mixture <strong>of</strong> UV and non-UVabsorbing<br />
organic<br />
compounds, a UVA <strong>of</strong> zero will not necessarily correspond to a DOC or Total Organic<br />
Carbon (TOC) <strong>of</strong> zero. The poor correlations <strong>of</strong> UVA and DOC at the other stations,<br />
particularly the channel stations, indicate a much lower concentration <strong>of</strong> humic materials<br />
in the water and a variable proportion <strong>of</strong> humics in the DOC, as compared to drainage<br />
samples.<br />
8. TI’HMFP and DOC<br />
The qTHMFP and DOC data sets were compared because humic materials<br />
(THM precursors) are dissolved organic material. The correlation was poor at all<br />
stations except for drain water samples taken from Upper Jones Tract (R2 -- 0.901) and<br />
Webb Tract (0.781). Three models were tested. These were the linear model y -- a ÷<br />
bx, the power regression model y = axb, where a > 0, and logarithmic model y = a +<br />
b(ln X), where y is "Iqq-IMFP, x is DOC, and a and b are constants.<br />
The poor correlation further indicates the type <strong>of</strong> dissolved organic matter is more<br />
important in THM formation than the total amount <strong>of</strong> DOC present. The range <strong>of</strong><br />
DOC by month at Bouldin Island is shown in Figure 12. The power and logarithmic<br />
regression results are shown in Figures 13 and 14.<br />
9, TFPC and DOC<br />
The amount <strong>of</strong> carbon incorporated on a molar basis’into trihalomethanes in the<br />
TFHMFP assay is called the THM Formation Potential Carbon (TFPC). The TFPC<br />
data were compared to the DOC data. The linear model TFPC (#g/L) = constant +<br />
DOC (mg/L) was tested.<br />
C--03066i<br />
(3-030661
The highest correlatiom were found in drain water samples collected from Grand<br />
Island (R2 = 0.813), Upper Jones Tract (0.91), and Webb Tract (0.805). Correlatiom<br />
were poor at all other drain and channel station sites.<br />
The poor correlations again show that the type <strong>of</strong> organic matter, not the total<br />
DOC concentration, affects THM formation.<br />
C--030662
Figure 11 ~<br />
UVA-DOC Regression at Bouldin Island<br />
All drains<br />
UVA-254 nm<br />
3<br />
2.5 @<br />
0.5<br />
1 ¯ o<br />
0 I I I I<br />
0 10 20 30 40 50 60<br />
DOC (mg/L)<br />
R-squared = 0.942<br />
n=13
C--030664<br />
(3-030664
n<br />
Figure 13<br />
TTHMFP - DOC Power Regression at Bouldin Island<br />
TTHMFP (mg/L)<br />
5,000<br />
4,000<br />
3,000<br />
¯<br />
¯<br />
¯<br />
All drains<br />
¯ ¯<br />
¯<br />
g<br />
ooq ¯ ¯ o<br />
2,000 ¯ ~<br />
¯ ¯ I<br />
¯ ¯ o<br />
1,000<br />
¯<br />
0 1 I I<br />
0 20 40 60 80 1 O0<br />
DOC (mg/L)<br />
R-squared = 0.58<br />
n = 67 0.46<br />
TTHMFP = 486.6(DOC)
Figure 14<br />
TTHMFP -. DOC Log Regression at Bouldin Island<br />
All drains<br />
TTHMFP (mg/L)<br />
5,000<br />
4,000<br />
3,000<br />
2,000<br />
1,000<br />
0 I I n n<br />
0 20 40 60 80 1 oo<br />
DOC (mg/L)<br />
R-squared = 0.498<br />
n =67<br />
TTHMFP = -433+842(In DOC)
10, TFPC and UVA<br />
The linear model TFPC (/~g/L) = constant + UVA was tested. The highest<br />
TFPC to UVA correlations were at the following stations: Empire Tract (R2 = 0.950),<br />
Natomas Drain (0.770), San Joaquin River at Maze (0.831), Bacon Island (0.965),<br />
Bouldin Island (0.907), King Island (0.893), and Webb Tract (0.922).<br />
11, TTHMFP vs. Bromide and DOC<br />
Regression testing advanced to testing multiple parameter correlations. The<br />
model TFHMFP = constant + Br + DOC concentrations was tested.<br />
The best correlations were found in data sets for the Bouldin Island drains (R2 =<br />
0.987), King Island drains (0.926), Empire Tract drain (0.947), Rindge Tract drains<br />
(0.877), Webb Tract drains (0.776), Bacon Island drains (0.798), Sacramento River at Rio<br />
Vista (0.773), and DMC (0.741). However, as previously mentioned, the R2 values tend<br />
to be distorted when sample size is small or if the data are clustered. Therefore, the<br />
strength <strong>of</strong> the multiple regressions for these data sets may be overestimated.<br />
12. TTHMFP vs. Chloride and UVA<br />
Regression testing included the model TTHMFP = constant + C1 + UVA.<br />
Chloride concentration was tested because <strong>of</strong> possible bromide to chloride relationships<br />
that exist at some stations. Where bromide concentration data was unavailable, chloride<br />
data might serve as a surrogate for bromide data. UVA was selected because previous<br />
regression testing indicated UVA may be a better measurement <strong>of</strong> THM precursors than<br />
DOC at some stations.<br />
The regressions were in some cases better than the previous model using Br and<br />
DOC to predict TrHMFP. Empire Tract had a R2 <strong>of</strong> 0.972, Natomas Drain 0.785,<br />
Bacon Island 0.957, Bouldin 0.932, King Island 0.915, Webb Tract 0.93, and the San<br />
Joaquin River at Maze Road 0.806.<br />
13, TI’HMFP vs. Bromide and UVA<br />
The model relationship TI’HMFP = constant + Br + UVA was tested since<br />
bromide and UV absorbing substances comprised <strong>of</strong> humic substances areboth<br />
THM<br />
precursors.<br />
The best R2regression values were found for data from the Empire Tract drain<br />
(0.971), San Joaquin River at Maze Road (0.804), Bacon Island drains (0.964), Bouldin<br />
Island drains (0.973), King Island drains (0.927), and Webb Tract (0.945).<br />
C--030667<br />
(3-030667
Regressions for Little Connection Slough and Upper Jones Tract were 1.0, but<br />
were based on 3 samples at each station. Therefore, more data needs to be collected<br />
prior to concluding any correlations at these two locations.<br />
14. TFPC vs. Bromide and UVA<br />
The model TFPC = constant + Br + UVA was tested.<br />
The highest correlations were found in data from Empire Tract (0.962), Natomas<br />
Drain (0.765), San Joaquin River at Maze Road (0.833), Bacon Island (0.756), Bouldin<br />
Island (0.970), and King Island (0.926).<br />
15, TFPC vs. Chloride and UVA<br />
The model TFPC = constant + CI + UVA was tested.<br />
The highest R2 values were in data sets from Empire Tract (0.964), Natomas<br />
Drain (0.782), San Joaquin River at Maze Road (0.840), Barker North <strong>Bay</strong> Pumping<br />
Plant (0.746), Bacon Island (0.967), Bouldin Island (0.931), King Island (0.917), and<br />
Webb Tract (0.924).<br />
C. TFPC Range <strong>of</strong> Observations<br />
Cumulative relative frequency diagrams showing the distribution <strong>of</strong> TFPC at the<br />
key channel stations and drainages in the <strong>Delta</strong> from 1987 to 1990 (four consecutive dry<br />
years) were also prepared. This information is being used to compile a water<br />
characterization database report. The results are presented in Appendix A.<br />
D, Sea Water Bromide Intrusion<br />
The reduction <strong>of</strong> bromide in raw water supplies is beneficial in helping water<br />
treatment plants meet the THM standard. Reduced bromide levels favors lower<br />
production <strong>of</strong> the three brominated methane compounds: brom<strong>of</strong>orm,<br />
bromodichloromethane, and dibromochloromethane.<br />
Sea water is the largest source <strong>of</strong> bromide to the <strong>Delta</strong>. Because <strong>of</strong> the drought<br />
and resulting low <strong>Delta</strong> inflows, the effects <strong>of</strong> sea water intrusion on <strong>Delta</strong> water quality<br />
have been significant.<br />
Ocean water is higher in sodium, chloride, bromide, and electrical conductivity<br />
than fresh water. Although EC is used frequently to track saline water, the proportion <strong>of</strong><br />
fresh water, drain water, and sea water in some regions <strong>of</strong> the <strong>Delta</strong> cannot be easily<br />
C--030668<br />
i<br />
1<br />
(3-030668
discriminated by EC measurements alone. Chemical analyses <strong>of</strong> specific ions such as<br />
sodium, chloride, and bromide serve as chemical tracers <strong>of</strong> different water sources.<br />
Frequent monitoring in the lower western <strong>Delta</strong> was conducted to track the<br />
movement <strong>of</strong> sea water and mixing <strong>of</strong> Sacramento River inflows along Old River enroute<br />
to the pump stations <strong>of</strong> the CCWD, CVP, and SWP. Water samples were analyzed for<br />
bromide, chloride, and EC. The bromide to chloride concentration relationships were<br />
compared by computing the ratio <strong>of</strong> the two concentations.<br />
The ratio <strong>of</strong> bromide to chloride concentrations in open ocean water is about<br />
0.0034. Water quality data at the Sacramento River at Mallard Island station indicate<br />
good agreement with that ratio. The monthly average bromide to chloride concentration<br />
ratios are shown in Table 4.<br />
Figures 15-20 are examples <strong>of</strong> the sea water intrusion monitoring results for EC,<br />
bromide, and the Br:C1 ratios observed on August 20-22, 1990. Comparisons <strong>of</strong> such<br />
plots over time provide an illustrative approach in analyzing the movement and mixing <strong>of</strong><br />
<strong>Delta</strong> waters.<br />
Cm030669<br />
C-030669
Table 4. Monthly Average Br to Cl Concentration Ratios (x i04}<br />
Month American Sacramento Barker No. Sacr~to R~k CLifton H.O. DMC HiddLe San<br />
~1"P River at <strong>Bay</strong> River at Slough at Curt Banka intake at River at Joaquin<br />
intake Greene’s Pumping Na[lard Old River Foret~y Headworks Linde~nn Borden River near<br />
Lndg. PLant Island intake Rd. H~/y. Verneli$<br />
(channel)<br />
Jan 43 36 31 34 3~ 36 15<br />
Feb 3L+ 18 35 32 11 11 13 16 10<br />
Nat 41 22 38 33 35 17 12 37 21<br />
AI 66 27 :36 ~, 17 17 35 19<br />
Nay 50 40 52 ]0 26 51 29 51 ~0<br />
Jun 41 15 3~ ~, 18 55 ~ ~,<br />
Jut ~7 5~ ~5 38 1~ 55 57 ]~ 57<br />
Aug ~ ~J+ 39 39 41 ~1 39 49 38<br />
sep 49 43 43 47 41 37 44 41<br />
oct 25 29 35 38 38 39 35 37 39<br />
Nov
~R<br />
SACRAMENTO - ~AN JOAQUIN DELTA<br />
co~,r.a.a ~<br />
652<br />
Figure 15<br />
Channel E.C. Values<br />
......... August 20-22, 1990<br />
735 ......<br />
"rRACY<br />
E.C. in microSi~mens/cm<br />
at degrees Celsius<br />
sc..E ,...~Es ,~e Maze 1060<br />
C--030671<br />
~,<br />
-<br />
STOCKTON<br />
(3-030671
Natomas Dr. 402 " 4 ~<br />
I’ANTI~<br />
SACRAMENTO - SAN JOAOUIN DELTA<br />
C--030672<br />
Figure 16<br />
Drainage E.C. Values<br />
""°o°~ ....... Aug~ 2o-22, ~<br />
~s,<br />
E.C. in microSiem’ns/cm<br />
at 25 degrees Celsius<br />
(3-030672
i<br />
i<br />
I<br />
i<br />
Natomas Dr.<br />
SACRAMENTO - SAN JOAQUIN DELTA<br />
~<br />
~<br />
. Figure 17<br />
I)r~h~ge Br<br />
~nd CI (m~/L)<br />
August 20-22, i990<br />
Br fast value followed by<br />
C1 after slash<br />
LOW~ JoN~s STOCKTON<br />
I ~.~,’P’~,.T 0.75/187<br />
. 2,O.98/279<br />
C--030673<br />
C-030673
Figure 18<br />
Ch~m~el Br<br />
and C1 (m~/L)<br />
August 20-22, 1990<br />
~ORT. B,, Br value followed by<br />
CI after slash<br />
PUMPING<br />
SACRAMENTO - SAN JOAQUIN DELTA<br />
CROSS.<br />
C--030674<br />
LOWER JONES STOCKTON<br />
o.48i~oa<br />
0.38195 ~’<br />
TRACY<br />
C-030674
C--030675<br />
C-030675
Natomas Dr. 37<br />
BARKER TRACT<br />
PUMPING<br />
¯ANTIOCH<br />
SACRAMENTO - SAN JOAQUIN DELTA<br />
RYER<br />
ISLAND<br />
Walnut<br />
, Br,otwoo~ r36 ......... ~<br />
C--030676<br />
~<br />
Figure 20<br />
Drainage ~<br />
Br:CI Ratios<br />
August 20-22, 1990~<br />
Values shown am Br (mg/L)<br />
to CI multiplied<br />
NEW HOPE<br />
TRACT :<br />
LODI<br />
LOWER JONES STOCKTON<br />
"rRAC~"<br />
C-030676
E. Drainage Sampling<br />
Drainage sampling extended into the central <strong>Delta</strong> with Holland Tract, Webb<br />
Tract, and Bacon Island added to the list <strong>of</strong> monitored areas. Table 5 shows the<br />
monthly range <strong>of</strong> "ITHMFP concentrations at the drainage stations. In most cases,<br />
January and February levels were higher than the corresponding August concentrations.<br />
Differences among drains on the same island or tract were seen (e.g., Brannan Island).<br />
Data collected from <strong>Delta</strong> drains will be used toimprove the precision <strong>of</strong><br />
previous work in modeling the sources and distribution <strong>of</strong> THM organic precursors (e.g.,<br />
TFPC). This work was reported in the DWR’s <strong>Delta</strong> Island Drainage Invcstigati0n<br />
Report dated June 1990.<br />
C--030677<br />
C-030677
Table 5. 1990 TI’HMFP at Drainage Stations I<br />
Units in g/L<br />
STATION JAN FEB APR JUN JUL AUG OCT<br />
AGDCLIFTON 910 1500-3500 1400-1500 1200 1100<br />
AGDENPIRE 3600 3200 2000 1800 1600 2500 4400<br />
BACON01 1200 790 1200 1600 750 740<br />
BACON02 1700-1800 750 980 920 960 970<br />
BOULDIN1 1400 2700 2300 850 1900 1600 2~00<br />
BOULDIN2 3400 2600 2200-2400 1900 3000 1100-1200 4100<br />
BRANNANPP01 2500 1700 1300 1400 1300<br />
BRANNANPP02 1100 1000 1800 1500 810<br />
BRANNANPP03 1300 2000 470 840 1400-1600 1100 1800<br />
BRANNANPP04 3000 2700 2100 1500 3100 2000 1500<br />
HOLLAND01 2400 2100 2100 1900 1900-2500 2400<br />
HOLLAND02 2600 2200 2200 1800 3200 1400<br />
HOLLAND03 1600 2400 3000 810 1300 1000<br />
KINGISPP01 880-920 1100 350 790 740 970<br />
KINGISPP02 1000 1200 1100 880 880 1500 2200<br />
KINGISPP03 1200 1300 470 1100 930 1800 1500<br />
PESCADERO01 320 750 730 420 720<br />
PESCADERO02 250 740 760 960 810<br />
PESCADERO03 300 810 720 910 640<br />
PESCADERO04 650-670 580 710 1400<br />
RINDGEPP01 2600 1900 1500 2000 1900 1300<br />
RINDGEPP02 2700 2400 2100 2200 2100 2200<br />
UPJONESPP01 3900<br />
UPJONESPP02 1300 1000 910 1000 1100-1300<br />
WEBB01 1900 1400 1700 1800 1700<br />
k~EBB02 2900 2500 2900 3600 1600<br />
C--030678<br />
C-030678
I F. Water Characterization Studies<br />
<strong>Delta</strong> water samples are analyzed for minerals as well as TrHMFP. The purpose<br />
<strong>of</strong> performing mineral analyses has been to characterize the major water types (e.g., bay<br />
water, fresh water, drain water) and their sources. By developing a chemical fingerprint<br />
or pr<strong>of</strong>ile <strong>of</strong> specific water types, the movement and degradation <strong>of</strong> water under specific<br />
hydrologic conditions in the <strong>Delta</strong> can be assessed. This information will assist modelers<br />
and planners in the examination <strong>of</strong> alternatives to improve the management and<br />
distribution <strong>of</strong> <strong>Delta</strong> water supplies.<br />
There are several techniques available to characterize water and trace its<br />
movement. Each method has its unique advantages and limitations, and several methods<br />
are used to confirm specific relationships that exist among individual water samples. The<br />
use <strong>of</strong> specific ion ratio comparisons <strong>of</strong> bromide to chloride to track baywater<br />
intrusion<br />
and mixing was described earlier.<br />
Mineralion data for calcium, magnesium, sodium, potassium, chloride, sulfate,<br />
and alkalinity (carbonate and bicarbonate) were plotted on trilinear diagrams for<br />
comparison. Separate diagrams were made for the following monitoring stations (station<br />
name in Figure 1 shown in parentheses):<br />
Station Station<br />
Number Name<br />
2 Sacramento River at Greene’s Landing (GREENES)<br />
17 Sacramento River at Mallard Island (MALLARDIS)<br />
9 Rock Slough at Old River (ROCKSL)<br />
12 H.O. Banks Headworks (BANKS)<br />
13 Middle River at Borden Highway (MIDDLER)<br />
11 <strong>Delta</strong> Mendota Canal intake at Lindemann Road (DMC)<br />
14 San Joaquin River near Vernalis (VERNALIS)<br />
8 Agricultural drain on Empire Tract (AGDEMPIRE)<br />
6 Agricultural drain on Tyler Island (AGDTYLER)<br />
5 Agricultural drain on Grand Island (AGDGRAND)<br />
For comparison, the Central Valley Regional Water Quality Control Board<br />
provided trilinear diagrams <strong>of</strong> agricultural drainage <strong>of</strong> the southern <strong>Delta</strong> islands,<br />
western Stanislaus County, and subsurface tile drainage <strong>of</strong> the Panoche Fan area.<br />
Mineral data collection began in January 1986 for most stations. Record storms resulted<br />
inflooding some parts <strong>of</strong> the <strong>Delta</strong> (e.g., Tyler Island) inFebruary and March 1986.<br />
Following that period, drought conditions persisted through 1990. Therefore, most <strong>of</strong> the<br />
data reflect extreme and prolonged drought conditions.<br />
57<br />
C--030679<br />
(3-030679
Trilinear diagrams combine mineral ion data into two groups <strong>of</strong> cationic and two<br />
groups <strong>of</strong> anionic constituents. The points are expressed as percentages with the sums <strong>of</strong><br />
the cations and anions equaling 100 percent. This is equivalent to specifying two<br />
variables and allows the analysis to be expressed as a single point in a two-coordinate<br />
diagram.<br />
In the following trilinear diagrams (Figures 21, 22, and 23), the anion and cation<br />
triangles occupy positions at the lower left and lower right and have their bases aligned<br />
vertically and their vertices pointing toward each other. The upper central portion <strong>of</strong> the<br />
diagram is diamond shaped.<br />
The proportions <strong>of</strong> cations and anions are plotted as points in each lower triangle.<br />
The points are then extended into the central plotting field by projecting them along<br />
lines parallel to the upper edges <strong>of</strong> the central field. The intersection <strong>of</strong> these<br />
projections represents the composition <strong>of</strong> the water with respect to the combination <strong>of</strong><br />
ions shown. The units are percent <strong>of</strong> total milliequivalents per liter.<br />
The technical details <strong>of</strong> composing and reading actual percentages <strong>of</strong> anion and<br />
cation distribution shown in the trilinear diagrams are not described here. We present<br />
the use <strong>of</strong> trilinear diagrams to graphically summarize the differences between water<br />
types.<br />
The pattern in each trilinear diagram represents the chemical fingerprint <strong>of</strong> the<br />
water at a given location. By overlaying the data points from several stations, we can<br />
compare the similarities and differences and make inferences about the mixing <strong>of</strong> water<br />
types downstream from a distinct source.<br />
As more data are collected under different hydrologic conditions, trilinear<br />
diagrams and other methods <strong>of</strong> expressing data can help determine the consistency or<br />
inconsistency <strong>of</strong> water quality at a station and possible causes for inconsistencies.<br />
Distinct pr<strong>of</strong>iles based on trilinear diagrams <strong>of</strong> major cations and anions were<br />
observed at the major sources <strong>of</strong> water entering the <strong>Delta</strong>. These stations were located<br />
at the Sacramento River at Greene’s Landing, Sacramento River at Mallard Island, and<br />
San Joaquin River near Vernalis. The pr<strong>of</strong>iles characterized Sacramento River fresh<br />
water, sea water, and San Joaquin Valley drainage, respectively.<br />
Water samples taken from agricultural drains on Grand Island and Tyler Island<br />
resembled the mineral pr<strong>of</strong>ile <strong>of</strong> Sacramento River at Greene’s Landing water. These<br />
mineral pr<strong>of</strong>iles are probably similar because the Sacramento River provides the applied<br />
irrigation water source for the two islands.<br />
In the case <strong>of</strong> farm drainage from Empire Tract, the mineral pr<strong>of</strong>ile was unique<br />
and most likely reflects saline connate water source which is believed to lie beneath the<br />
C--030680<br />
(3-030680
island.<br />
Water samples from Rock Slough at Old River reflected bay water intrusion into<br />
the lower western <strong>Delta</strong>. The tdlinear diagram resembled that <strong>of</strong> the Sacramento River<br />
at Mallard Island.<br />
Mineral pr<strong>of</strong>iles <strong>of</strong> water samples taken from the H. O. Banks Headworks<br />
resembled those from Rock Slough at Old River.<br />
Samples collected at the DMC intake at Lindemann Road resembled a mixture <strong>of</strong><br />
water from the San Joaquin River near Vernalis, and from Rock Slough.<br />
Drainage from western Stanislaus County and the southern <strong>Delta</strong> islands was<br />
significantly different in chemical composition from subsurface tile drainage <strong>of</strong> the<br />
Panoche Fan area.<br />
Cm030681<br />
C-030681
Figure 21<br />
~ ~ Trilinear Diagrams ~?~ ,\~<br />
North & Central <strong>Delta</strong><br />
o ’¥’ .~ %.<br />
% °<br />
co<br />
c~ .e % co c~<br />
(;rand Island farm drain Sacramento Ri~er at Greenes Landing<br />
o. .~<br />
.o o.<br />
% Co cl .e %<br />
Sacramento R~yer at Mallard Island<br />
co cl<br />
T~ler Island farm drain<br />
~oo<br />
co ct .e ~<br />
Rod~ ~lough at Old l~iyer<br />
Co .e<br />
60<br />
Empire Tract farm drain<br />
C--030682<br />
C-030682
I<br />
I<br />
I<br />
I<br />
0, .0 O~<br />
Figure 22<br />
Trilinear Diagrams<br />
Central & Southern <strong>Delta</strong><br />
H. O. Banks Headworks Middle River at Borden Hwy.<br />
100 100 100 100<br />
O. .0 O.<br />
"~ c~ c~ -’~ g Ca c~<br />
DMC intake - Lindemann Rd. San Joaquin River - Vernalis<br />
C--030683<br />
I<br />
(3-030683
+--"--t<br />
seeJV elSeu!eJO leJn|lno!JISv<br />
suaeJl~el.O ]eeU!l!Jl<br />
A--- I
Appendix A: TFPC Cumulative Relative Frequency<br />
G--030685<br />
C-030685
I<br />
I<br />
i<br />
|<br />
I "<br />
!<br />
!<br />
I<br />
!<br />
I "<br />
i B<br />
I<br />
~gB~-£99e obmrumt~onm (n =<br />
TFPC (u~/L) at Bankm Hmadwork~<br />
1987-1998 observations<br />
Zee .... + ..................................................... ; ..................................................... , ............................................................................<br />
8e .<br />
~e 40 6~ 8~<br />
TFPC (ug/L) at DHC intake<br />
C--030686<br />
C-0306~6
°°<br />
Cumulat£um Relatiue Frequenc£es<br />
£987-199e (n = 74)<br />
.<br />
e 40 80 120 160 200<br />
TFPC (ug/L) at Bacon Island drains<br />
Cumulmt£um RilaLivl Frmquencie~<br />
L98~-~99~ observations (n = 9~)<br />
e 10~ 2~B ~0~ ~00 N80 I<br />
TFPC (uQ/L) at Bouldim Island drains<br />
C--030687<br />
I<br />
m<br />
m<br />
I<br />
I<br />
I<br />
l<br />
I<br />
C-030687<br />
I
Cumulmtivm Rmlmtium Frmqumn~imm<br />
~gB~-~99e obmmrvationm (n = ~)<br />
Cumulmtiui Relative Friquencie.<br />
100 ~08 300<br />
I 67<br />
C--030688<br />
C-030688
~<br />
60<br />
198~-1998 obsmrvmt~onm (n : 61)<br />
" I<br />
C--030689<br />
I<br />
I<br />
!<br />
I<br />
(3-030689
I<br />
I<br />
~umulmtlum Rmlmtlum<br />
19~?-199~ ob~rv~tion~ (n ~<br />
100 .... ~ ..................................................................... ~ ................................... ~ ...................................= ................................... ~ ..................<br />
40<br />
24 34 44 64 64 94 84<br />
TFPC (ug/L) it Rock SI. at Old Riuir<br />
1987-199e obs~ru~tion~ (n =<br />
{ ’ ’ , i ", , , I ’ ’’ " ’ ’<br />
I ,. ~ , 1 ~ . ~ , I , .~ , , , , !<br />
TFPC (u~/L) ~t Ue~nal;~ - San Ooaquin<br />
I 69<br />
C--030690<br />
(3-030690
_Appendix B: Monitoring <strong>Program</strong> Data<br />
C--030691<br />
C-030691
MONITORING PROGRAM DATA<br />
Data for the Interagency <strong>Delta</strong> Health Aspects Monitoring <strong>Program</strong><br />
are divided into three tables: THM Data Report, Mineral Data<br />
Report, and Minor Elements Data Report.<br />
The THM DATA REPORT primarily contains laboratory results <strong>of</strong><br />
trihalomethane formation potential analyses. The four THM<br />
species are included. In addition, basic reference information<br />
about each sample is included. The records include:<br />
LAB# - laboratory sample identification number<br />
STA. NAME - abbreviated station name<br />
SAMP. DATE - sampling date<br />
TIME - sampling time (24-hour clock)<br />
TEMP °C - field water temperature (Celsius degrees)<br />
PH - field pH <strong>of</strong> water sample<br />
DO mg/L - field dissolved oxygen measurement<br />
(milligrams per liter)<br />
EC ~S/cm - laboratory measured electrical conductivity<br />
<strong>of</strong> water sample (microSiemens per centimeter<br />
corrected to 25 degrees Celsius).<br />
TURB T.U. - laboratory turbidity measurement (turbidity<br />
units)<br />
COLOR C.U. - laboratory measured color (color units)<br />
TOC mg/L - laboratory measured total organic carbon<br />
(milligrams per liter)<br />
THM Formation Potential<br />
CHCL3 - chlor<strong>of</strong>orm (micrograms per liter)<br />
CHBRCL2 - dichlorobromomethane (micrograms per<br />
liter)<br />
CHBRCL - dibromochloromethane(micrograms per<br />
liter)<br />
CHBR3 - brom<strong>of</strong>orm (micrograms per liter)<br />
TTHMFP - total trihalomethane formation potential<br />
(micrograms per liter)<br />
Flow cfs - average river or stream measured flow (cubic<br />
feet per second) at that station for that<br />
sampling date. Flow at most stations is<br />
not measured.<br />
C--030692<br />
73<br />
C-030692
The MINERAL DATA REPORT primarily contains data on the<br />
mineral composition <strong>of</strong> the water samples. The table includes<br />
data on water hardness and concentrations <strong>of</strong> sodium, chloride,<br />
selenium, asbestos, calcium, magnesium, potassium, alkalinity,<br />
sulfate, nitrate, boron, and total dissolved solids. The table<br />
includes:<br />
LAB# - laboratory sample identification number<br />
STA. NAME - abbreviated station name<br />
SAMP. DATE - sampling date<br />
TIME - sampling time (24-hour clock)<br />
TEMP °C - field water temperature (degrees Celsius)<br />
PH - field pH <strong>of</strong> water sample<br />
DO mg/L - field dissolved oxygen measurement<br />
(milligrams per liter)<br />
EC ~S/cm - laboratory measured electrical conductivity<br />
<strong>of</strong> water sample (microSiemens per centimeter<br />
corrected to 25 degrees Celsius)<br />
NA mg/L - sodium concentration (milligrams per liter)<br />
CL mg/L - chloride concentration (milligrams per liter)<br />
Se mg/L - selenium concentration (milligrams per liter)<br />
Asbest MF/L - asbestos concentration (million fibers per<br />
liter)<br />
Hard. - water hardness (milligrams per liter as<br />
calcium carbonate)<br />
Ca - calcium concentration (milligrams per liter)<br />
Mg - magnesium concentration (milligrams per<br />
liter)<br />
K - potassium concentration (milligrams per<br />
liter)<br />
ALK - total alkalinity (milligrams per liter as<br />
calcium carbonate)<br />
SO4 - sulfate concentration (milligrams per liter)<br />
NO3 - nitrate concentration (milligrams per liter<br />
as nitrogen)<br />
B - boron concentration (milligrams per liter)<br />
TDS - total dissolved solids (milligrams per liter)<br />
dried at 180 degrees C.<br />
Flow cfs - average river or stream measured flow (cubic<br />
feet per second) at that station for that<br />
sampling date. Flow at most stations is<br />
not measured.<br />
C--030693<br />
(3-030693<br />
!
The MINOR ELEMENTS DATA REPORT provides the results <strong>of</strong> trace<br />
element analyses. The table lists the dissolved concentrations<br />
<strong>of</strong> barium, iron, chromium, copper, manganese, mercury, zinc,<br />
lithium, and nickel.<br />
LAB# - laboratory sample identification number<br />
STA. NAME - abbreviated station name<br />
SAMP. DATE - sampling date<br />
TIME - sampling time (24-hour clock)<br />
TEMP °C - field water temperature (Celsius degrees)<br />
PH - field pH <strong>of</strong> water sample<br />
DO mg/L - field dissolved oxygen measurement<br />
(milligrams per liter)<br />
EC ~S/cm - laboratory measured electrical conductivity<br />
<strong>of</strong> water sample (microSiemens per centimeter<br />
corrected to 25 degrees Celsius)<br />
Ba mg/L - barium concentration (milligramsper<br />
liter)<br />
Fe mg/L - iron concentration (milligrams per<br />
liter)<br />
Cr mg/L - chromium concentration (milligrams per<br />
liter)<br />
Cu mg/L - copper concentration (milligrams per<br />
liter)<br />
Mn mg/L - manganese concentration (milligrams per<br />
liter)<br />
Hg mg/L - mercury concentration (milligrams per<br />
liter)<br />
Zn mg/L - zinc concentration (milligrams per<br />
liter)<br />
Li mg/L - lithium concentration (milligrams per<br />
liter)<br />
Ni mg/L - nickel concentration (milligrams per<br />
liter)<br />
C--030694<br />
C-030694
TFPC DATA REPORT<br />
TEMP pH DO EC TURB ,COLOR DOC UVA THMFP TFPC<br />
LAB# STA. NAME SAMP.DATE TIME oC mg/L uS/cm T.U. C.U. mg/L mg/L ug/L ug/L<br />
900019 AGDCLIFTON 01/23/90 9:50 15.4 7.4 5.2 6090 38 30 6.2 910 61<br />
900143 AGDCLIFTON 02/27/90 12:00 15.0 6.8 8.2 6150 64 50 8.7 1500 97<br />
900200 AGDCLIFTON 04/24/90 10:40 17.5 7.4 9.0 6270 26 140 7.4 0.317 1400 91<br />
900261 AGDCLIFTON 05/23/90 i0:00 17.5 7.5 7.7 2530 63 80 13.0 0.392 1500 130<br />
900303 AGDCLIFTON 06/27/90 i0:00 21.0 6.7 4.6 3690 15 50 9.0 0.323<br />
900386 AGDCLIFTON 07/25/90 ii:i0 22.0 7.5 7.5 2640 29 50 12.0 0.295 1200 91<br />
900764 AGDCLIFTON 10/23/90 8:50 19.0 7.4 5.8 5790 23 25 6.1 0.970 ii00 74<br />
900016 AGDEMPIRE 01/22/90 i0:00 7.8 6.8 7.7 2310 9 160 42.0 3600 330<br />
900116 AGDEMPIRE 02/19/90 10:50 6.8 7.1 ii.i 2320 ii 120 30.0 3200 300<br />
900197 AGDEMPIRE 04/23/90 10:25 18.0 6.8 5.9 680 13 120 24.0 1.000 2000 190<br />
900256 AGDEMPIRE 05/23/90 7:29 17.9 7.5 2.6 761 15 160 24.0<br />
900269 AGDEMPIRE 05/23/90 7:29 17.9 7.5 2.6 24.0<br />
900309 AGDEMPIRE 06/28/90 7:00 21.2- 7.1 3.7 1060 93 160 18.0 0.696 1800 170 ~<br />
900381 AGDEMPIRE 07/24/90 11:29 25.3 1.7 593 15 i00 15.0 0.711 1600 160 0%<br />
900493 AGDEMPIRE 08/20/90 11:28 24.4 7.1 3.3 590 21 200 24.0 1.049 2500 250<br />
900759 AGDEMPIRE 10/22/90 10:05 16.8 6.9 3.9 1710 7 400 68.0 3.228 4400 420 ~<br />
900158 AMERICAN 03/21/90 13:50 17.2 8.0 10.2 77 1 5 1.5 0.023 190 19<br />
900265 AMERICAN 05/22/90 6:25 15.9 7.4 9.4 78 2 5 2.1 0.051 240 23<br />
900278 AMERICAN 06/26/90 13:15 19.2 8.1 10.3 70 1 5 2,0 0.030 210 21 ~<br />
900851 AMERICAN 11/13/90 7:30 13.0 8.6 9.5 58 1 0 1.6 0.033 220 22<br />
900920 AMERICAN 12/11/90 6:30 10.2 9.2 9.5 62 1 i0 2.3 0.047 230 23 O<br />
900033 BACON01 01/23/90 16:01 11.6 6.7 3.4 894 58 160 ii.0 1200 120 ~<br />
900131 BACON01 02/23/90 9:30 11.5 7.3 4.4 834 60 70 10.0 790 76<br />
900210 BACON01 04/24/90 15:07 20.9 7.5 11.4 652 23 120 i0.0 0.462 1200 120 ~<br />
900296 BACON01 06/26/90 13:55 24.2 7.0 5.7 416 23 80 ,9.3 0.270<br />
900394 BACON01 ~ 07/25/90 9:15 26.8 6.6 9.5 735 9 i00 18.0 0.810 1700 160<br />
900506 BACON01 08/21/90 12:01 23.9 6.4 485 13 60 4.1 0.175 750 67<br />
900772 BACON01 10/23/90 10:25 18.4 9.8 5.5 794 22 i00 4.0 0.165 740 61<br />
900035 BACON02 01/23/90 15:20 12.2 6.7 7.3 950 23 140 18.0 1800 180<br />
900034 BACON02 01/23/90 15:20 12.2 6.7 7.3 949 24 140 18.0 1700 170<br />
900132 BACON02 02/23/90 9:50 11.5 6.8 8.4 ii00 31 120 19.0 750 72<br />
900211 BACON02 04/24/90 16:50 20.9 7.4 7.8 573 Ii 50 7.0 0.301 980 91<br />
900297 BACON02 06/26/90 14:25 25.0 7.0 5.9 394 28 80 6.8 0.273<br />
900395 BACON02 07/25/90 9:45 23.6 6.9 8.7 491 14 50 8.4 0.350 920 89<br />
900507 BACON02 08/21/90 11:07 22.7 5.4 454 21 125 6.5 0.300 970 91<br />
900773 BACON02 10/23/90 9:55 18.8 8.8 5.4 642 22 50 5.9 0.240 980 88<br />
Note: "
TFPC DATA REPORT<br />
TEMP pH DO EC TURB COLOR DOC UVA THMFP TFPC<br />
LAB# STA. NAME SAMP.DATE TIME oC mg/L uS/cm T.U. C.U. mg/L mg/L ug/L ug/L<br />
900037 BANKS 01/24/90 9:20 9.0 7.4 10.6 710 i0 25 3.9 530 43<br />
900096 BANKS 02/21/90 9:21 9.0 8.1 12.6 482 i0 25 4.0 500 44<br />
900152 BANKS 03/20/90 Ii:00 16.7 8.4 i0.i 453 7 25 3.4 0.I00 470 42<br />
900218 BANKS 04/25/90 8:00 18.3 7.7 8.9 683 9 30 2.6 0.077 450 36<br />
900259 BANKS 05/23/90 10:35 18.2 8.3 9.1 671 15 40 3.0 0.089 540 43<br />
900298 BANKS 06/27/90 9:15 20.4 8.1 8.2 570 i0 30 3.3 0.092<br />
900326 BANKS 07/09/90 15:40 22.5 8.3 7.8 518 7 3.5 630 55<br />
900346 BANKS 07/16/90 10:30 24.5 8.4 7.4 391 9 3.2 0.098 650 59<br />
900402 BANKS 07/26/90 I0:i0 23.0 7.4 i0.i 440 13 15 2.9 0.096 360 32<br />
900436 BANKS 07/30/90 ii:00 24.2 7.3 7.6 523 ii 2.9 0.093 490 43<br />
900456 BANKS 08/06/90 9:30 25.9 7.4 6.6 437 7 2.8 0.097 650 58<br />
900548 BANKS 08/13/90 9:20 25.2 7.8 6.5 490 8 2.9 0.095 530 46<br />
900514 BANKS 08/22/90 12:40 24.5 7.2 397 7 30 2.8 0.092 520 46 ~<br />
900567 BANKS 08/27/90 10:24 22.7 7.8 397 8 2.7 0.089 420 39 O5<br />
900590 BANKS 09/04/90 13:00 22.7 8.3 389 7 3.0 0.090 540 48<br />
900610 BANKS 09/10/90 10:55 24.0 8.0 7.1 438 6 2.8 0.092 580 51 ~<br />
900630 BANKS 09/18/90 12:10 21.9 8.1 7.8 424 5 3.8 0.i01 600 53 O<br />
900671 BANKS 09/24/90 ii:00 20.6 7.9 8.1 512 6 30 3.5 0.097 510 43<br />
900693 BANKS 10/01/90 12:05 20.9 7.7 8.2 484 6 3.5 0.i01 520 45 ~<br />
900718 BANKS 10/10/90 9:30 19.3 7.7 6.8 604 5 3.2 0.i01 560 46 O<br />
900738 BANKS 10/16/90 8:45 18.9 8.6 8.0 639 6 3.3 0.096 430 38 ~<br />
900796 BANKS 10/24/90 8:58 17.7 7.0 7.8 691 5 25 3.2 0.107 630 52<br />
900816 BANKS 10/30/90 12:00 18.3 7.8 8.8 725 4 3.3 0.105 550 43 O<br />
900863 BANKS 11/13/90 12:25 15.0 7.9 9.3 739 4 15 3.0 0.091 440 36<br />
900875 BANKS 11/27/90 11:30 11.2 7.6 i0.i 768 4 3.2 0.091 490 38<br />
900914 BANKS 12/11/90 12:10 10.8 7.2 8.5 806 3 15 3.5 0.117 600 48<br />
900027 BARKERNOBAY 01/23/90 8:44 6.3 7.7 9.9 457 i0 40 5.7 840 83<br />
900103 BARKERNOBAY 02/21/90 14:22 11.3 6.9 11.3 405 52 70 7.4 590 49<br />
900164 BARKERNOBAY 03/21/90 7:45 14.9 7.7 8.7 494 14 30 0.124 550 53<br />
900207 BARKERNOBAY 04/24/90 8:50 16.6 8.0 8.3 484 13 35 5.8 0.140 570 55<br />
900272 BARKERNOBAY 05/22/90 12:07 21.6 8.5 7.4 454 25 50 5.3 0.135 520 49<br />
900277 BARKERNOBAY 06/26/90 7:35 21.4 8.4 8.0 381 29 50 0.185 590 57<br />
900390 BARKERNOBAY 07/25/90 14:25 24.8 7.4 9.6 315 30 25 4.4 0.138 460 44<br />
900502 BARKERNOBAY 08/21/90 7:20 19.7 6.8 258 27 70 3.6 0.235 530 52<br />
900638 BARKERNOBAY 09/25/90 8:00 19.3 7.0 6.7 286 16 50 3.5 0.109 450 44<br />
900769 BARKERNOBAY 10/23/90 6:20 15.6 9.7 8.3 317 14 40 3.7 0.107 230 23<br />
Note: "
TFPC DATA REPORT<br />
TEMP pH DO EC TURB COLOR DOC UVA THMFP TFPC<br />
LAB# STA. NAME SAMP.DATE TIME oC mg/L uS/cm T.U. C.U. mg/L mg/L ug/L ug/L<br />
900853 BARKERNOBAY 11/13/90 11:45 13.9 8.0 9.6 283 13 20 2.9 0.083 370 36<br />
900922 BARKERNOBAY 12/11/90 9:00 8.8 9.0 9.2 292 i0 15 0.074 330 32<br />
900009 BOULDINI 01/22/90 12:15 8.6 7.1 i0.i 372 16 80 13.0 1400 140<br />
900129 BOULDINI 02/23/90 8:15 11.7 7.2 6.2 1300 13 240 67.0 2700 230<br />
900198 BOULDINI 04/23/90 12:10 20.4 6.9 5.9 289 7 160 20.0 1.030 2300 230<br />
900316 BOULDINI 06/28/90 9:30 20.5 6.9 5.2 247 i0 60 Ii.0 0.343 850 84<br />
900382 BOULDINI 07/24/90 12:33 24.8 2.1 282 5 120 18.0 0.933 1900 190<br />
900494 BOULDINI 08/20/90 13:23 24.4 7.8 5.4 242 I0 I00 ii.0 0.540 1600 160<br />
900760 BOULDINI 10/22/90 11:05 18.0 7.1 4.1 384 4 200 29.0 1.254 2900 300<br />
900010 BOULDIN2 01/22/90 11:30 7.2 6.2 6.0 486 I0 240 45.0 3400 340<br />
900128 BOULDIN2 02/23/90 7:50 9.3 7.0 9.5 478 13 200 34.0 2600 260<br />
900191 BOULDIN2 04/23/90 12:40 18.3 6.2 4.3 257 ii 240 29.0 1.560 2300 230<br />
900317 BOULDIN2 06/28/90 9:15 20.9 6.8 5.8 266 16 160 22.0 0.925 1900 190 ~<br />
900377 BOULDIN2 07/24/90 13:03 24.5 1.8 309 i0 160 46.0 1.795 3000 300<br />
900487 BOULDIN2 08/20/90 13:54 26.0 8.7 5.8 178 9 60 8.1 0.397 1100 120 O5<br />
900761 BOULDIN2 10/22/90 11:45 18.0 7.1 4.1 391 7 250 52.0 2.448 4100 410 ~<br />
900001 BRANNANPPOI 01/22/90 9:30 12.1 6.6 3.5 622 9 140 25.0 2500 250<br />
900118 BRANNANPP01 02/19/90 14:20 11.5 7.9 7.6 876 ii 160 32.0 O<br />
900190 BRANNANPP01 04/23/90 15:30 19.8 7.3 7.3 429 20 120 18.0 0.844 1700 170 ~<br />
900286 BRANNANPPOI 06/26/90 11:30 24.0 7.1 5.2 317 22 i00 12.0 0.522<br />
900374 BRANNANPP01 07/24/90 13:50 24.5 7.0 4.5 246 16 60 13.0 0.597 1400 140 O<br />
900486 BRANNANPP01 08/20/90 13:00 23.8 4.0 300 13 75 i0.0 0.471 1400 140 ~<br />
900752 BRANNANPP01 10/22/90 12:55 16.7 8.3 4.2 369 9 120 12.0 0.623 1300 140<br />
900002 BRANNANPP02 01/22/90 9:30 i0.i 6.4 2.1 628 72 240 15.0 ii00 ii0 ~<br />
900119 BRANNANPP02 02/19/90 14:45 i0.i 6.3 2.1 673 60 140 14.0 I000 98<br />
900285 BRANNANPP02 06/26/90 11:18 20.4 6.6 2.5 613 31 200 20.0 0.923<br />
900373 BRANNANPP02 07/24/90 13:30 21.5 6.9 1.6 479 25 200 18.0 0.797 1800 180<br />
900485 BRANNANPP02 08/20/90 12:40 22.2 1.8 524 14 175 18.0 1.191 1500 150<br />
900751 BRANNANPP02 10/22/90 12:40 16.7 8.3 4.2 517 220 350 14.0 1.248 820 76<br />
900003 BRANNANPP03 01/22/90 10:15 9.9 6.5 2.6 1130 81 320 17.0 1300 130<br />
900120 BRANNANPP03 02/19/90 15:05 9.7 6.5 6.6 ii00 21 200 30.0 2000 200<br />
900188 BRANNANPP03 04/23/90 15:00 19.0 6.9 12.8 1370 46 30 9.5 0.299 470 41<br />
900284 BRANNANPP03 06/26/90 11:05 24.3 6.8 4.7 817 72 160 i0.0 0.403 840 80<br />
900365 BRANNANPP03 07/24/90 12:50 23.5 6.9 4.9 299 18 140 14.0 0.717 1400 140<br />
900484 BRANNANPP03 08/20/90 12:20 22.6 13.1 1160 16 200 20.0 0.379 ii00 98<br />
900750 BRANNANPP03 10/22/90 12:25 19.2 9.0 2.4 1040 76 300 42.0 2.084 1800 180<br />
Note: "
TFPC DATA REPORT<br />
TEMP pH DO EC TURB COLOR DOC UVA THMFP TFPC<br />
LAB# STA. NAME SAMP.DATE TIME oC mg/L uS/cm T.U. C.U. mg/L mg/L ug/L ug/L<br />
900004 BRANNANPP04 01/22/90 10:45 9.9 6.4 6.2 973 i0 160 34.0 3000 300<br />
900121 BRANNANPP04 02/19/90 15:30 10.9 7.4 1230 12 160 38.0 2700 270<br />
900187 BRANNANPP04 04/23/90 14:40 18.5 7.3 4.8 736 15 120 19.0 0.930 2100 210<br />
900283 BRANNANPP04 06/26/90 10:50 22.4 7.5 6.2 528 21 120 23.0 0.696 1500 160<br />
900371 BRANNANPP04 07/24/90 12:30 23.5 7.2 5.3 456 15 200 29.0 1.514 3100 320<br />
900483 BRANNANPP04 08/20/90 11:50 23.2 4.9 366 15 i00 15.0 0.780 2000 210<br />
900749 BRANNANPP04 10/22/90 12:05 18.1 9.2 1.3 636 7 60 12.0 0.652 1500 150<br />
900476 CHECK 13 08/06/90 9:50 23.0 8.7 8.2 589 3 3.1 0.073 440 38<br />
900588 CHECK 13 08/13/90 9:00 24.0 8.4 7.4 557 3 3.0 0.082 480 40<br />
900862 CHECK 13 11/13/90 10:30 15.0 8.1 9.1 750 4 i0 3.0 0.091 420 34<br />
900913 CHECK 13 12/11/90 10:25 10.5 7.0 8.7 815 4 15 3.1 0.096 500 39<br />
900097 CLIFTON 02/21/90 10:35 9.4 7.0 12.6 472 8 30 3.8 540 48<br />
900154 CLIFTON 03/20/90 12:00 15.8 7.8 9.7 404 7 20 3.4 0.114 450 42 ~O<br />
900203 CLIFTON 04/24/90 11:15 18.8 7.9 8.6 532 6 20 2.4 0.080 420 35<br />
900262 CLIFTON 05/23/90 i0:i0 19.4 7.8 8.1 654 12 30 2.9 0.087 460 38 O5<br />
900304 CLIFTON 06/27/90 I0:i0 23.0 7.7 5.6 786 9 30 3.4 0.098 ~<br />
900387 CLIFTON 07/25/90 11:40 24.5 7.9 7.4 457 9 i0 3.6 0.093 390 34 ~<br />
900499 CLIFTON 08/21/90 9:30 23.6 8.0 7.9 397 5 25 2.6 0.085 450 39 O<br />
900673 CLIFTON 09/24/90 9:45 21.4 8.3 8.2 504 I0 25 3.2 0.098 510 44 ~<br />
900765 CLIFTON 10/23/90 9:15 18.7 7.8 8.1 710 5 15 3.7 0.099 680 56<br />
900864 CLIFTON 11/13/90 13:20 16.0 7.8 9.0 689 4 i0 3.2 0.093 430 35 O<br />
900915 CLIFTON 12/11/90 12:45 11.5 7.5 8.4 853 4 15 4.0 0.122 630 49 ~<br />
900692 CONCOSPPI 10/01/90 i0:i0 18.6 7.3 7.8 636 i0 2.7 0.098 480 39<br />
900055 CONNMAND 01/24/90 10:15 8.6 7.9 9.8 474 i0 40 4.5 640 58 ~<br />
900237 CONNMAND 04/25/90 6:50 17.5 8.2 8.8 367 8 20 2.6 0.060 300 26<br />
900423 CONNMAND 07/26/90 8:10 24.1 7.9 7.2 396 7 i0 3.5 0.080 430 37<br />
900535 CONNMAND 08/22/90 8:30 23.4 7.8 8.1 279 5 20 2.5 0.082 510 46<br />
900782 CONNMAND 10/24/90 9:25 18.0 7.8 8.4 700 2 5 2.6 0.089 570 45<br />
900052 DELTACRCHAN 01/24/90 10:55 8.9 7.5 207 14 30 3.4 410 41<br />
900233 DELTACRCHAN 04/25/90 10:28 18.3 6.1 8.8 136 6 5 3.6 0.054 230 23<br />
900417 DELTACRCHAN 07/26/90 11:20 24.0 7.6 6.5 133 9 5 1.7 0.036 240 24<br />
900529 DELTACRCHAN 08/22/90 12:30 24.4 7.6 9.3 178 8 15 1.8 0.042 290 28<br />
900811 DELTACRCHAN 10/24/90 12:05 19.6 7.6 8.3 162 3 I0 1.7 0.039 200 19<br />
900038 DMC 01/24/90 9:53 8.5 7.6 9.7 787 i0 25 4.4 540 46<br />
900102 DMC 02/21/90 9:57 9.4 7.3 11.9 873 i0 25 3.7 540 -46<br />
900153 DMC 03/20/90 11:35 15.6 7.8 10.6 358 8 25 4.2 0.108 440 41<br />
Note: "
TFPC DATA REPORT<br />
TEMP pH DO EC TURB COLOR DOC UVA THMFP TFPC<br />
LAB# STA. NAME SAMP.DATE TIME oC mg/L uS/cm T.U. C.U. mg/L mg/L ug/L ug/L<br />
900219 DMC 04/25/90 8:38 17.6 6.8 9.1 467 9 30 2.5 0.077 390 33<br />
900302 DMC 06/27/90 10:30 22.9 8.0 5.4 399 12 30 3.4 0.102 360 36<br />
900327 DMC 07/09/90 16:15 24.9 8.0 6.7 878 4.2 730 62<br />
900347 DMC 07/16/90 11:06 24.1 7.8 7.2 770 19 3.2 0.086 620 51<br />
900403 DMC 07/26/90 10:45 24.5 7.2 9.3 395 14 15 2.9 0.i01 360 32<br />
900437 DMC 07/30/90 11:15 25.1 7.5 6.9 818 19 3.5 0.ii0 550 47<br />
900455 DMC 08/06/90 i0:00 26.1 7.8 6.1 306 ii 2.9 0.109 580 54<br />
900549 DMC 08/13/90 9:35 25.9 7.7 5.3 770 14 3.3 0.093 570 49<br />
900515 DMC 08/22/90 13:20 25.3 6.8 670 13 30 3.2 0.092 560 48<br />
900569 DMC 08/27/90 9:52 22.0 8.8 7.2 876 17 3.3 0.089 770 64<br />
900591 DMC 09/04/90 13:30 23.8 8.3 837 13 3.4 0.091 640 54<br />
900611 DMC 09/10/90 10:45 24.0 7.9 7.0 375 9 3.1 0.I01 600 54 O5<br />
900631 DMC 09/18/90 11:45 23.8 7.7 7.0 668 6 3.3 0.104 650 57<br />
900672 DMC 09/24/90 11:30 21.4 8.1 8.0 414 9 30 3.5 0.107 490 44 O5<br />
900694 DMC 10/01/90 12:35 22.1 7.4 8.0 522 8 3.8 0.076 630 56 ~<br />
900719 DMC 10/10/90 10:15 19.8 7.5 6.8 660 12 3.3 0.I00 580 48<br />
900739 DMC 10/16/90 9:15 18.9 7.9 633 8 3.3 0.103 560 46 O<br />
900797 DMC 10/24/90 9:27 17.9 7.1 8.1 870 i0 30 3.3 0.i00 600 50 i~<br />
900818 DMC 10/30/90 12:30 18.0 8.0 9.0 894 8 3.4 0.091 540 43 I<br />
900865 DMC 11/13/90 13:55 14.6 7.8 9.0 698 7 i0 3.1 0.094 420 35 O<br />
900876 DMC 11/27/90 12:00 10.9 7.8 10.7 850 3 2.9 0.069 440 35 ~<br />
900910 DMC 12/11/90 13:15 ii.0 7.5 8.5 782 6 15 3.8 580 46<br />
900334 FALSETIP-WEBB 07/10/90 7:35 22.3 8.1 7.6 610 9 2.5 0.071 ~<br />
900351 FALSETIP-WEBB 07/16/90 8:25 22.9 8.3 7.4 449 9 2.3 0.062 460 39<br />
900421 FALSETIP-WEBB 07/26/90 7:40 22.6 8.2 7.8 849 11 i0 3.1 0.069 460 35<br />
900444 FALSETIP-WEBB 07/31/90 8:05 22.2 7.5 7.8 415 8 2.2 0.064 390 32<br />
900464 FALSETIP-WEBB 08/07/90 8:10 22.5 7.9 8.1 651 9 2.0 0.060 420 32<br />
900555 FALSETIP-WEBB 08/13/90 8:00 19.4 8.6 7.5 580 8 2.4 0.066 400 33<br />
900533 FALSETIP-WEBB 08/22/90 9:20 22.7 8.0 8.5 537 9 25 2.1 0.065 570 47<br />
900575 FALSETIP-WEBB 08/28/90 8:20 22.0 7.9 530 7 2.3 0.071 510 42<br />
900597 FALSETIP-WEBB 09/05/90 8:45 21.8 7.5 7.6 408 7 2.3 0.087 490 43<br />
900617 FALSETIP-WEBB 09/11/90 8:40 21.7 7.4 8.8 577 6 2.3 0.068 560 47<br />
900644 FALSETIP-WEBB 09/17/90 9:10 21.1 8.0 7.7 619 6 2.3 0.067 590 48<br />
900658 FALSETIP-WEBB 09/25/90 I0:i0 21.1 8.1 7.7 975 8 2.3 0.069 480 35<br />
900680 FALSETIP-WEBB 10/02/90 9:00 20.7 7.7 7.7 508 7 2.3 0.066 330 27<br />
900705 FALSETIP-WEBB 10/09/90 9:00 18.3 8.0 8.1 977 6 2.6 0.068 510 37<br />
Note: "
TFPC DATA REPORT<br />
TEMP pH DO EC TURB COLOR DOC UVA THMFP TFPC<br />
LAB# STA. NAME SAMP.DATE TIME oC mg/L uS/cm T.U. C.U. mg/L mg/L ug/L ug/L<br />
900725 FALSETIP-WEBB 10/15/90 9:15 18.3 8.1 11.2 ii00 4 2.4 0.067 540 38<br />
900780 FALSETIP-WEBB 10/24/90 8:50 17.6 7.7 8.6 1450 5 i0 2.6 0.075 590 40<br />
900824 FALSETIP-WEBB 10/31/90 9:58 17.1 7.8 9.4 ii00 4 2.4 0.063 520 36<br />
900838 FALSETIP-WEBB 11/14/90 I0:00 13.6 7.9 1430 3 2.4 0.069 550 39<br />
900882 FALSETIP-WEBB 11/28/90 9:50 11.2 7.8 9.5 Iii0 3 2.8 0.077 520 37<br />
900930 FALSETIP-WEBB 12/12/90 i0:00 9.9 7.6 7.9 2070 4 2.7 0.082 620 39<br />
900051 GEORGSLWALNUT 01/24/90 10:41 9.4 7.3 200 13 30 3.5 400 40<br />
900232 GEORGSLWALNUT 04/25/90 10:07 18.6 6.3 8.7 136 5 5 3.6 0.052 240 24<br />
900416 GEORGSLWALNUT 07/26/90 10:55 23.8 7.9 6.5 132 7 5 1.8 0.038 220 22<br />
900528 GEORGSLWALNUT 08/22/90 12:00 24.1 7.6 9.1 180 8 15 1.8 0.044 330 32<br />
900804 GEORGSLWALNUT 10/24/90 10:45 17.9 7.6 8.6 156 3 i0 1.7 0.066 280 27<br />
900040 GRANTLNCAN 01/24/90 10:43 9.3 7.7 8.9 1200 13 20 4.6 520 43<br />
900221 GRANTLNCAN 04/25/90 9:30 18.2 7.1 8.5 839 Ii 35 3.8 0.113 480 42<br />
900405 GRANTLNCAN 07/26/90 8:40 22.8 7.5 9.7 843 18 i0 3.5 0.082 400 34 O<br />
900517 GRANTLNCAN 08/22/90 11:45 25.5 6.7 735 18 35 4.2 0.085 490 43 O<br />
900799 GRANTLNCAN 10/24/90 10:24 18.8 7.2 8.1 1030 9 30 2.9 0.075 500 41<br />
900064 GRANTOLD 01/24/90 12:25 8.7 7.9 10.2 ii00 ii 25 5.0 590 52 ~<br />
900246 GRANTOLD 04/25/90 9:00 18.4 7.9 8.1 671 I0 35 3.3 0.096 400 34 O<br />
900343 GRANTOLD 07/10/90 9:20 24.9 7.9 7.0 367 9 3.1 0.094 720 66<br />
900363 GRANTOLD 07/17/90 10:45 26.3 7.7 5.9 777 16 3.6 0.082 550 47 ~<br />
900433 GRANTOLD 07/26/90 10:45 24.0 8.0 7.1 396 9 i0 2.8 0.094 470 42<br />
900453 GRANTOLD 07/31/90 i0:00 25.3 7.0 6.4 828 15 3.5 0.102 570 49<br />
900473 GRANTOLD 08/07/90 9:55 25.4 7.6 6.0 482 13 4.5 0.082 450 39 ~<br />
900565 GRANTOLD 08/13/90 9:52 25.0 7.8 5.9 672 16 3.3 0.095 810 70 O<br />
900545 GRANTOLD 08/22/90 12:00 25.2 8.3 7.7 652 ii 30 3.4 0.094 720 62<br />
900585 GRANTOLD 08/28/90 ii:00 23.6 7.6 644 ii 3.5 0.096 690 60<br />
900607 GRANTOLD 09/05/90 12:00 23.2 7.5 6.3 816 13 3.4 0.091 640 54<br />
900627 GRANTOLD 09/11/90 ii:i0 22.8 7.5 8.7 397 4 3.0 0.102 600 54<br />
900654 GRANTOLD 09/17/90 11:35 22.6 7.8 7.4 422 16 3.3 0.104 570 51<br />
900668 GRANTOLD 09/25/90 12:15 22.1 7.6 7.2 447 7 3.3 0.i00 440 39<br />
900690 GRANTOLD 10/02./90 11:35 22.9 7.5 6.6 595 13 3.4 0.098 490 42<br />
900715 GRANTOLD 10/09/90 11:20 19.5 7.9 7.7 631 8 3.2 0.106 630 53<br />
900735 GRANTOLD 10/15/90 11:20 18.8 8.1 11.8 761 9 3.6 0.098 660 54<br />
900792 GRANTOLD 10/24/90 11:30 18.4 7.6 8.0 703 4 5 3.7 0.106 580 47<br />
900834 GRANTOLD 10/31/90 12:35 18.1 7.7 9.0 817 6 3.3 0.087 600 47<br />
900848 GRANTOLD 11/14/90 11:50 13.5 7.9 715 6 3.1 0.086 590 48<br />
Note: "
TFPC DATA REPORT<br />
TEMP pH DO EC TURB COLOR DOC UVA THMFP TFPC<br />
LAB# STA. NAME SAMP.DATE TIME oC mg/L uS/cm T.U. C.U. mg/L mg/L ug/L ug/L<br />
900892 GRANTOLD 11/28/90 12:00 10.2 7.9 9.9 829 7 2.8 0.055 360 29<br />
900940 GRANTOLD 12/12/90 12:05 9.4 7.4 8.2 781 3 3.9 0.119 680 54<br />
900053 GREENES 01/24/90 11:25 10.5 7.1 175 13 25 3.2 440 43<br />
900127 GREENES 02/23/90 7:00 8.5 7.9 13.1 193 14 30 3.5 430 42<br />
900160 GREENES 03/21/90 7:25 16.7 8.5 9.4 200 5 i0 2.0 0.055 220 22<br />
900234 GREENES 04/25/90 ii:00 19.5 6.1 8.7 141 6 5 4.0 0.051 210 21<br />
900268 GREENES 05/22/90 7:50 18.8 7.7 I0.0 166 6 5. 1.8 190 19<br />
900318 GREENES 06/28/90 11:30 24.4 6.3 6.1 188 6 5 1.9 0.033 210 20<br />
900418 GREENES 07/26/90 11:50 24.3 7.6 6.5 136 6 5 1.7 0.034 230 23<br />
900475 GREENES 08/06/90 13:10 25.0 7.5 7.0 150 6 1.9 0.040 240 24<br />
900530 GREENES 08/22/90 13:05 24.5 7.5 9.5 186 7 i0 1.9 0.043 310 30<br />
900641 GREENES 09/25/90 12:30 22.5 7.2 7.3 191 6 20 1.9 0.037 210 20<br />
900812 GREENES 10/24/90 12:40 19.0 7.6 8.9 165 3 i0 1.7 0.038 190 18<br />
900850 GREENES 11/13/90 10:05 14.0 8.1 7.2 175 4 5 1.9 0.046 240 24<br />
900925 GREENES 12/11/90 13:40 10.8 8.5 9.3 161 4 5 2.2 0.056 250 25<br />
900028 HOLLAND01 01/23/90 11:43 9.0 7.4 7.3 1600 3 i00 19.0 2400 220<br />
900134 HOLLAND01 02/23/90 12:10 11.6 6.6 5.7 1370 14 200 25.0 2100 210<br />
900186 HOLLARD01 04/23/90 11:25 18.8 7.5 4.6 1280 7 140 17.0 0.813 2100 200<br />
900292 HOLLAND01 06/26/90 10:45 21.0 6.9 2.9 629 14 160 16.0 0.881<br />
900370 HOLLAND01 07/24/90 10:50 22.0 7.0 3.6 928 5 i00 18.0 0.796 1900 190<br />
900477 HOLLAND01 08/20/90 9:30 23.3 4.9 805 7 75 15.0 0.656 1900 190<br />
900748 HOLLAND01 10/22/90 10:55 17.0 7.9 2.5 1150 3 120 7.8 0.765 2400 230 O<br />
900029 HOLLAND02 01/23/90 11:04 9.4 7.1 9.7 1640 6 140 21.0 2600 240<br />
900135 HOLLAND02 02/23/90 11:45 12.8 6.8 11.2 1560 10 100 20.0 2200 210<br />
900185 HOLLAND02 04/23/90 10:40 17.6 7.2 6.6 894 14 160 19.0 0.948 2200 210<br />
900291 HOLLAND02 06/26/90 10:15 20.7 7.0 4.5 592 11 120 12.0 0.613<br />
900369 HOLLAND02 07/24/90 10:25 22.0 7.3 9.4 796 19 120 15.0 0.656 1800 180<br />
900481 HOLLAND02 08/20/90 9:15 21.2 1.6 1020 2 175 26.0 1.329 3200 310<br />
900747 HOLLAND02 10/22/90 10:30 15.2 7.8 3.6 802 13 160 13.0 0.556 1500 140<br />
900030 HOLLAND03 01/23/90 10:31 11.0 7.0 3.0 991 25 140 14.0 1600 160<br />
900136 HOLLAND03 02/23/90 11:30 12.0 6.7 10.0 2000 8 100 22.0 2400 230<br />
900181 HOLLAND03 04/23/90 9:35 17.5 7.4 6.0 1090 7 200 29.0 1.430 3000 300<br />
900290 HOLLAND03 06/26/90 9:40 18.9 7.3 4.1 845 16 120 14.0 0.670<br />
900368 HOLLAND03 07/24/90 9:55 19.0 7.2 1.4 848 80 120 5.8 0.680 810 71<br />
900480 HOLLAND03 08/20/90 8:45 19.5 2.6 946 13 100 8.4 0.411 1300 120<br />
900746 HOLLAND03 10/22/90 10:15 16.0 7.2 6.6 888 40 80 17.0 0.590 1000 91<br />
Note: "
TFPC DATA REPORT<br />
TEMP pH DO EC TURB COLOR DOC UVA THMFP TFPC<br />
LAB# STA. NAME SAMP.DATE TIME oC mg/L uS/cm T.U. C.U. mg/L mg/L ug/L ug/L<br />
900047 HONKER 01/24/90 6:50 7.2 7.1 197 12 50 4.9 630 62<br />
900226 HONKER 04/25/90 7:45 17.2 6.2 9.2 161 4 5 2.0 0.054 280 28<br />
900412 HONKER 07/26/90 7:35 23.5 7.7 6.8 190 7 20 2.9 0.094 370 36<br />
900524 HONKER 08/22/90 8:05 23.3 7.6 9.0 213 5 25 3.5 0.126 550 53<br />
900806 HONKER 10/24/90 8:15 17.6 7.8 8.6 239 2 20 2.4 0.074 320 30<br />
900013 KINGISPPOI 01/22/90 i0:00 9.9 7.3 2.9 409 9 50 7.0 920 89<br />
900017 KINGISPPOI 01/22/90 I0:00 9.9 7.3 2.9 430 8 60 6.8 880 85<br />
900113 KINGISPPOI 02/19/90 10:05 9.5 7.2 4.3 460 7 60 9.4 Ii00 ii0<br />
900195 KINGISPPOI 04/23/90 i0:00 19.1 7.2 7.8 271 6 25 3.1 0.108 350 33<br />
900313 KINGISPP01 06/28/90 7:45 19.3 7.1 8.2 425 12 60 7.7 0.326 800 78<br />
900379 KINGISPPOI 07/24/90 9:47 20.8 1.7 346 8 60 6.3 0.275 740 73<br />
900757 KINGISPPOI 10/22/90 7:06 15.7 7.5 2.9 363 8 50 6.9 0.300 980 96<br />
900014 KINGISPP02 01/22/90 9:30 8.6 7.3 5.9 460 17 60 7.4 I000 98<br />
900112 KINGISPP02 02/19/90 9:35 6.7 7.4 9.5 557 i0 60 9.4 1200 120<br />
900194 KINGISPP02 04/23/90 9:10 17.2 7.1 4.4 473 5 60 9.7 0.439 ii00 ii0<br />
900312 KINGISPP02 06/28/90 8:45 20.6 6.9 7.3 450 21 80 8.8 0.332 880 86<br />
900378 KINGISPP02 07/24/90 9:10 22.6 0.6 447 22 80 7.8 0.456 880 86<br />
900490 KINGISPP02 08/20/90 10:05 22.1 6~8 1.6 469 19 125 13.0 0.759 1500 150<br />
900756 KINGISPP02 10/22/90 9:00 16.0 7.1 4.7 772 7 140 26.0 0.944 2200 220<br />
900015 KINGISPP03 01/22/90 10:30 6.4 7.6 8.0 1200 7 40 7.0 1200 98<br />
900114 KINGISPP03 02/19/90 10:30 6.0 7.6 9.1 1150 7 50 9.0 1300 120<br />
900196 KINGISPP03 04/23/90 9:40 18.0 7.2 7.3 459 6 25 3.8 0.146 470 42<br />
900314 KINGISPP03 06/28/90 8:15 20.5 7.0 3.1 616 190 160 ii.0 0.424 ii00 ii0<br />
900380 KINGISPP03 07/24/90 10:14 22.2 1.4 733 13 60 8.4 0.338 930 84<br />
900492 KINGISPP03 08/20/90 11:52 25.0 7.8 5.3 805 18 I00 15.0 0.604 1800 170<br />
900758 KINGISPP03 10/22/90 9:40 17.0 7.9 7.0 810 8 80 12.0 0.446 1500 140<br />
900056 LATHAM 01/24/90 I0:00 8.7 7.7 10.7 455 i0 35 4.4 640 59<br />
900238 LATHAM 04/25/90 7:00 17.4 8.1 8.7 336 6 25 4.1 0.072 280 25<br />
900424 LATHAM 07/26/90 8:20 24.0 7.9 7.0 270 7 i0 8.0 0.070 330 31<br />
900536 LATHAM 08/22/90 8:00 23.1 7.4 8.2 259 6 20 2.5 0.077 510 47<br />
900783 LATHAM 10/24/90 9:35 18.0 7.7 7.9 492 2 5 2.9 0.095 520 45<br />
900046 LCONNECT 01/24/90 5:55 7.5 7.4 204 13 60 5.8 680 67<br />
900227 LCONNECT 04/25/90 7:00 17.9 6.4 9.3 164 3 5 1.9 0.112 .250 25<br />
900411 LCONNECT 07/26/90 6:45 23.3 7.9 6.3 160 7 i0 3.0 0.067 270 27<br />
900523 LCONNECT 08/22/90 7:10 22.4 7.9 9.4 178 5 20 2.2 0.065 380 37<br />
900805 LCONNECT 10/24/90 7:45 17.1 7.6 8.5 191 3 15 2.1 0.065 300 30<br />
Note: "
TFPC DATA REPORT<br />
TEMP pH DO EC TURB COLOR DOC UVA THMFP TFPC<br />
LAB# STA. NAME SAMP.DATE TIME oC mg/L uS/cm T.U. C.U. mg/L mg/L ug/L ug/L<br />
900048 LPOTTERM 01/24/90 8:35 8.6 7.1 206 12 50 5.2 650 64<br />
900229 LPOTTERM 04/25/90 8:30 18.6 6.3 9.1 159 4 5 2.3 0.053 270 27<br />
900410 LPOTTERM 07/26/90 8:15 24.2 7.7 7.5 138 8 5 1.8 0.043 220 22<br />
900525 LPOTTERM 08/22/90 9:15 25.1 7.6 7.8 182 6 20 2.4 0.066 370 37<br />
900807 LPOTTERM 10/24/90 8:55 18.2 7.7 8.0 168 3 10 2.0 0.057 220 22<br />
900005 MALLARDIS 01/22/90 9:50 9.5 7.9 10.3 4900 15 30 3.2 1100 63<br />
900105 MALLARDIS 02/21/90 12:11 12.2 7.3 12.3 9780 12 25 3.2 690 38<br />
900162 MALLARDIS 03/21/90 10:05 17.0 7.5 8.8 10400 12 20 3.0 0.089 1200 64<br />
900208 MALLARDIS 04/24/90 12:05 17.8 7.8 9.0 7340 31 50 2.3 0.078 900 49<br />
900270 MALLARDIS 05/22/90 10:40 18.8 8.0 8.5 8340 20 20 3.4 0.074 700 38<br />
900282 MALLARDIS 06/26/90 9:50 22.4 ~ 7.9 8.3 7700 21 20 2.6 0.073 890 48 ~<br />
900329 MALLARDIS 07/09/90 12:15 22.0 8.0 8.0 5740 13 4.2 ii00 64<br />
900345 MALLARDIS 07/16/90 9:06 23.0 6.7 8.4 26 2.9 0.076 880 47 O<br />
900392 MALLARDIS 07/25/90 12:00 24.5 7.6 9.4 6660 21 i0 4.3 0.083 740 41 ~<br />
900439 MALLARDIS 07/30/90 9:30 22.2 7.5 8.5 9060 26 4.5 0.154 1200 64<br />
900459 MALLARDIS 08/06/90 8:00 21.0 8.0 8.2 7570 16 3.1 0.087 540 30 O<br />
900547 MALLARDIS 08/13/90 8:00 22.5 8.1 7.0 7410 14 2.4 0.075 820 43 ~<br />
900504 MALLARDIS 08/21/90 9:14 22.1 7.6 7000 19 35 2.4 0.076 830 46<br />
900571 MALLARDIS 08/27/90 8:42 21.6 8.2 7560 15 2.4 0.072 970 54 O<br />
900593 MALLARDIS 09/04/90 9:50 22.0 8.3 576~ i0 2.4 0.068 880 51 I<br />
900613 MALLARDIS 09/10/90 8:30 21.5 7.9 8.2 11600 20 1.9 810 43<br />
900633 MALLARDIS 09/18/90 9:35 21.1 7.3 7.9 6260 13 2.~ 0.075 860 49 O<br />
900676 MALLARDIS 09/24/90 8:30 21.0 8.1 8.4 13600 12 20 2.5 0.066 900 47<br />
900696 MALLARDIS 10/01/90 9:00 20.1 7.6 8.3 9710 10 2.3 0.073 950 50<br />
900721 MALLARDIS 10/10/90 8:10 19.5 7.9 6.9 15300 13 1.9 0.069 1200 60<br />
900737 MALLARDIS 10/16/90 7:30 19.8 7.9 7.8 11200 8 2.2 0.075 860 45<br />
900770 MALLARDIS 10/23/90 7:45 17.4 9.5 8.9 15400 9 20 1.9 0.074 1000 53<br />
900820 MALLARDIS 10/30/90 10:00 18.1 7.9 9.2 14200 6 1.8 0.068 860 44<br />
900855 MALLARDIS 11/13/90 13:45 16.8 7.6 9.7 15500 7 5 2.0 0.070 720 37<br />
900878 MALLARDIS 11/27/90 9:45 12.4 7.5 9.7 16400 5 2.3 0.076 860 44<br />
900924 MALLARDIS 12/11/90 10:40 11.1 8.3 9.1 17800 14 5 2.2 0.072 960 51<br />
900020 MAZE 01/23/90 11:00 9.1 8.1 9.6 1520 15 20 4.1 700 57<br />
900095 MAZE 02/21/90 7:57 8.6 7.6 11.4 1270 38 30 5.0 670 58<br />
900151 MAZE 03/20/90 9:00 17.3 6.7 7.4 1470 7 20 4.0 0.098 570 46<br />
900205 MAZE 04/24/90 13:25 19.4 8.0 8.4 1290 23 40 6.2 0.172 910 79<br />
900258 MAZE 05/23/90 11:45 19.4 8.3 8.3 1330 35 40 3.6 0.091 570 44<br />
Note: "
TFPC DATA REPORT<br />
TEMP pH DO EC TURB COLOR DOC UVA THMFP TFPC<br />
LAB# STA. NAME SAMP.DATE TIME oC mg/L uS/cm T.U. C.U. mg/L mg/L ug/L ug/L<br />
900300 MAZE 06/27/90 8:10 21.3 8.1 5.8 1390 60 40 4.5 0.097 530 42<br />
900389 MAZE 07/25/90 14:05 26.0 9.3 1190 85 25 6.5 0.130 570 47<br />
900501 MAZE 08/21/90 ii:00 23.0 8.5 6.9 1060 44 60 4.1 0.Ii0 720 59<br />
900640 MAZE 09/25/90 10:45 21.7 6.9 7.0 1030 12 30 3.6 0.099 570 47<br />
900762 MAZE 10/23/90 7:10 15.9 7.8 7.6 i000 6 20 3.0 560 46<br />
900859 MAZE 11/13/90 8:50 13.0 7.8 8.8 1070 7 i0 2.6 410 34<br />
900912 MAZE 12/11/90 9:00 10.5 7.6 7.7 1160 8 i0 2.7 0.063 370 29<br />
900042 MIDDLER 01/24/90 11:40 9.1 7.4 10.2 460 9 30 4.7 580 52<br />
900133 MIDDLER 02/23/90 10:30 9.8 7.1 12.1 386 8 20 3.9 510 48<br />
900156 MIDDLER 03/20/90 13:50 18.0 8.0 8.5 307 6 25 3.4 0.112 450 42<br />
900223 MIDDLER 04/25/90 10:45 18.6 7.3 8.5 371 6 30 2.4 0.078 320 28<br />
900264 MIDDLER 05/23/90 8:30 19.4 8.0 8.3 448 I0 30 3.2 0.II0 430 38<br />
900294 MIDDLER 06/26/90 12:50 25.0 7.7 7.0 341 7 25 3.6 0.105 ~<br />
900407 MIDDLER 07/26/90 11:40 26.5 7.2 8.8 313 7 15 3.1 0.099 350 32<br />
900519 MIDDLER 08/22/90 10:40 26.2 6.1 286 5 20 2.9 0.096 550 51 O<br />
900674 MIDDLER 09/24/90 12:40 22.6 8.0 7.9 362 4 25 3.4 0.103 560 53<br />
900801 MIDDLER 10/24/90 11:24 19.6 7.1 8.0 596 5 25 3.2 0.107 650 56 ~<br />
900857 MIDDLER 11/13/90 15:20 17.6 7.7 9.4 659 4 15 4.0 0.102 600 47 O<br />
900926 MIDDLER 12/11/90 11:55 10.6 8.7 8.8 626 3 i0 4.0 0.133 600 51<br />
900041 MIDMOWRY 01/24/90 ii:i0 7.5 7.6 11.5 660 6 20 4.4 540 48 ~<br />
900222 MIDMOWRY 04/25/90 I0:00 18.5 7.0 9.4 909 9 30 3.5 0.105 460 39 O<br />
900406 MIDMOWRY 07/26/90 9:05 22.5 7.4 8.3 795 30 15 4.8 0.114 480 42 ~<br />
900518 MIDMOWRY 08/22/90 i1:15 26.1 6.3 718 19 25 3.2 0.082 530 45<br />
900800 MIDMOWRY 10/24/90 10:48 19.2 7.6 9.6 921 33 20 2.8 0.075 610 52 ~<br />
900701 MOKELUMNE 10/01/90 8:10 22.8 7.8 8.6 54 2 2.0 0.044 270 27<br />
900698 MOKELUMNE 10/01/90 8:10 22.8 7.8 8.6 53 2 2.0 230 23<br />
900049 MOKGEORGIANA 01/24/90 9:08 8.6 7.1 190 12 35 3.8 480 48<br />
900230 MOKGEORGIANA 04/25/90 9:00 19.5 6.2 9.1 138 5 5 2.0 0.045 240 24<br />
900414 MOKGEORGIANA 07/26/90 9:00 25.3 7.9 6.6 137 7 5 1.7 0.041 210 21<br />
900526 MOKGEORGIANA 08/22/90 9:50 21.4 7.7 9.4 174 9 15 2.2 0.046 250 25<br />
900808 MOKGEORGIANA 10/24/90 9:20 18.2 7.6 7.7 165 4 15 1.8 0.048 220 21<br />
900043 MRIVBACON 01/24/90 12:16 9.2 7.3 i0.0 420 8 30 4.7 620 57<br />
900224 MRIVBACON 04/25/90 11:15 18.5 7.3 9.2 349 6 25 2.3 0.075 330 29<br />
900328 MRIVBACON 07/09/90 14:15 23.0 8.0 7.5 330 6 4.6 640 60<br />
900348 MRIVBACON 07/16/90 12:15 25.7 8.2 7.9 303 6 2.9 0.089 590 55<br />
900408 MRIVBACON 07/26/90 12:25 28.0 7.3 8.9 286 6 20 3.0 0.i00 350 33<br />
Note: "
TFPC DATA REPORT<br />
TEMP pH DO EC TURB COLOR DOC UVA THMFP TFPC<br />
LAB# STA. NAME SAMP.DATE TIME oC mg/L uS/cm T.U. C.U. mg/L mg/L ug/L ug/L<br />
900435 MRIVBACON 07/30/90 12:00 25.6 7.4 7.9 278 6 2.8 0.093 460 43<br />
900458 MRIVBACON 08/06/90 10:50 26.1 6.9 7.0 458 12 2.7 0.109 650 58<br />
900550 MRIVBACON 08/13/90 10:30 25.8 7.5 6.8 296 5 2.7 0.092 430 39<br />
900520 MRIVBACON 08/22/90 10:00 25.6 6.5 269 5 25 3.0 0.107 540 51<br />
900570 MRIVBACON 08/27/90 11:34 23.9 6.9 267 6 3.0 0.093 630 59<br />
900592 MRIVBACON 09/04/90 12:00 23.7 7.7 293 5 3.1 0.112 580 54<br />
900609 MRIVBACON 09/10/90 11:05 24.9 7.9 7.5 301 7 3.4 0.119 550 52<br />
900632 MRIVBACON 09/18/90 13:05 23.7 7.9 7.2 327 5 3.5 0.122 580 55<br />
900670 MRIVBACON 09/24/90 13:00 23.6 7.9 8.7 368 4 35 3.7 0.126 460 43<br />
900700 MRIVBACON 10/01/90 10:10 23.4 8.3 8.5 437 5 3.6 0.124 550 50<br />
900720 MRIVBACON 10/10/90 12:05 22.4 7.4 6.9 481 5 3.4 0.110 580 51<br />
900740 MRIVBACON 10/16/90 I0:00 20.6 7.9 542 5 4.6 0.118 540 48 ~<br />
900802 MRIVBACON 10/24/90 12:06 19.3 7.1 7.9 585 3 20 3.3 0.108 620 54 O<br />
900819 MRIVBACON 10/30/90 13:30 18.5 7.7 8.3 656 4 3.6 0.103 610 51<br />
900858 MRIVBACON 11/13/90 15:45 15.7 8.1 8.6 625 7 25 4.2 0.149 550 49 ~<br />
900874 MRIVBACON 11/27/90 12:50 11.8 7.4 i0.0 620 2 3.3 0.111 490 41 O<br />
900927 MRIVBACON 12/11/90 12:30 10.5 8.5 8.8 542 3 10 4.2 0.129 630 55<br />
900018 NATOMAS 01/23/90 7:00 7.2 7.5 8.6 638 37 80 6.6 880 86 ~<br />
900139 NATOMAS 02/27/90 7:15 12.9 8.1 8.6 764 46 30 600 57 O<br />
900157 NATOMAS 03/21/90 13:20 22.0 8.3 8.2 877 44 25 3.8 0.080 400 37<br />
900201 NATOMAS 04/24/90 7:10 16.5 7.8 281 24 i00 6.8 0.160 610 60 ~<br />
900267 NATOMAS 05/22/90 7:07 19.2 7.9 9.7 439 19 40 5.2 0.133 630 62 O<br />
900279 NATOMAS 06/26/90 12:55 27.4 8.0 7.2 545 22 40 6.6 0.155 650 64<br />
900384 NATOMAS 07/25/90 8:50 22.5 7.9 5.6 562 26 20 8.2 0.151 690 67<br />
900497 NATOMAS 08/21/90 5:30 21.2 8.0 4.6 402 16 50 4.6 0.125 580 57<br />
900636 NATOMAS- 09/25/90 6:35 20.5 6.9 6.0 502 52 60 4.2 0.109 500 48<br />
900763 NATOMAS 10/23/90 11:46 18.5 7.7 7.1 452 31 75 4.9 0.112 630 62<br />
900852 NATOMAS 11/13/90 8:35 12.5 7.5 8.0 455 21 35 3.0 0.083 430 42<br />
900919 NATOMAS 12/11/90 7:55 7.9 8.8 9.4 526 24 20 4.0 750 72<br />
900062 NORTHCAN 01/24/90 11:50 8.7 7.4 10.9 473 9 30 4.0 630 52<br />
900244 NORTHCAN 04/25/90 8:35 18.1 7.9 8.4 392 8 25 2.4 0.072 330 28<br />
900340 NORTHCAN 07/10/90 8:55 24.6 7.9 6.6 320 7 3.3 0.099 730 68<br />
900360 NORTHCAN 07/17/90 10:20 26.3 8.0 6.7 303 6 3.3 0.094 500 47<br />
900430 NORTHCAN 07/26/90 10:20 24.2 7.7 6.9 315 11 10 2.9 0.095 430 39<br />
900450 NORTHCAN 07/31/90 9:35 24.7 7.1 6.0 307 6 3.0 0.107 700 66<br />
900470 NORTHCAN 08/07/90 9:30 25.2 7.7 6.9 330 6 3.8 0.086 470 43<br />
Note: "
TFPC DATA REPORT<br />
TEMP pH DO ’EC TURB COLOR DOC UVA THMFP TFPC<br />
LAB# STA. NAME SAMP.DATE TIME oC mg/L uS/cm T.U. C.U. mg/L mg/L ug/L ug/L<br />
900553 NORTHCAN 08/13/90 9:30 25.1 7.8 6.4 319 6 3.2 0.096 490 48<br />
900542 NORTHCAN 08/22/90 11:15 25.9 8.2 7.7 292 6 25 2.8 0.094 670 61<br />
900582 NORTHCAN 08/28/90 10:30 23.3 7.5 281 6 0.104 420 40<br />
900604 NORTHCAN 09/05/90 10:45 23.9 7.4 6.5 294 4 3.0 0.098 630 59<br />
900615 NORTHCAN 09/11/90 10:30 23.0 7.3 8.0 316 5 3.2 0.ii0 560 53<br />
900651 NORTHCAN 09/17/90 Ii:00 22.5 7.8 7.1 331 5 3.2 0.ii0 510 48<br />
900665 NORTHCAN 09/25/90 11:45 22.0 7.7 7.1 366 6 3.6 0.109 440 41<br />
900687 NORTHCAN 10/02/90 11:07 22.5 7.5 7.0 406 6 3.6 0.113 540 50<br />
900703 NORTHCAN 10/09/90 10:45 19.5 7.7 7.5 482 5 3.4 0.118 500 45<br />
900732 NORTHCAN 10/15/90 10:50 18.8 8.0 11.2 539 4 3.6 0.110 580 51<br />
900789 NORTHCAN 10/24/90 10:55 18.6 7.6 8.0 590 3 I0 3.4 0.106 600 51<br />
900831 NORTHCAN 10/31/90 12:05 18.0 7.5 8.5 613 4 3.3 0.103 490 40<br />
900836 NORTHCAN 11/14/90 11:25 13.6 7.9 604 3 3.2 0.098 500 42<br />
900889 NORTHCAN 11/28/90 11:30 10.5 7.6 9.6 638 3 6.6 0.107 490 41 ~<br />
900937 NORTHCAN 12/12/90 11:40 9.5 7.4 8.0 622 3 4.4 0.136 650 56 O<br />
900060 NVICWOOD 01/24/90 11:25 8.7 7.5 11.2 451 9 30 4.4 590 53<br />
900242 NVICWOOD 04/25/90 8:10 18.0 7.9 8.5 388 5 25 2.4 0.ii0 300 26 ~<br />
900338 NVICWOOD 07/10/90 8:30 24.4 7.9 6.6 317 6 3.0 0.102 640 59 O<br />
900358 NVICWOOD 07/17/90 9:50 25.7 8.2 6.8 329 7 3.0 0.088 520 48<br />
900428 NVICWOOD 07/26/90 9:15 24.0 7.8 6.6 311 i0 i0 3.0 0.094 450 41 ~<br />
900441 NVICWOOD 07/31/90 9:10 24.0 7.4 6.5 342 I0 2.8 0.i00 480 44<br />
900468 NVICWOOD 08/07/90 9:10 24.5 7.7 6.7 318 7 2.9 0.081 510 47<br />
900560 NVICWOOD 08/13/90 9:08 25.4 7.7 6.7 440 6 2.5 0.082 600 53 ~<br />
900540 NVICWOOD 08/22/90 10:50 25.5 8.2 8.0 287 5 30 3.0 0.106 710 65 (~<br />
900573 NVICWOOD 08/28/90 10:05 22.9 7.7 381 5 2.6 0.084 540 47<br />
900602 NVICWOOD 09/05/90 10:45 23.2 7.7 6.7 294 5 2.9 0.099 590 55<br />
900622 NVICWOOD 09/11/90 i0:00 23.3 7.4 8.5 316 5 3.2 0.113 590 55<br />
900649 NVICWOOD 09/17/90 10:25 22.9 7.8 7.5 404 5 3.1 0.099 580 52<br />
900663 NVICWOOD 09/25/90 11:20 22.1 7.8 6.8 359 4 3.4 0.108 590 56<br />
900685 NVICWOOD 10/02/90 10:35 22.1 7.6 7.3 534 0 2.9 0.090 480 40<br />
900710 NVICWOOD 10/09/90 I0:I0 18.6 7.9 8.0 716 4 2.9 0.092 540 43<br />
900730 NVICWOOD 10/15/90 10:25 19.0 7.9 11.6 706 4 3.1 0.094 610 49<br />
900787 NVICWOOD 10/24/90 10:30 18.4 7.5 7.9 715 3 15 4.4 0.138 650 54<br />
900829 NVICWOOD 10/31/90 11:35 18.3 7.5 8.6 746 2 3.1 0.I00 580 45<br />
900843 NVlCWOOD 11/14/90 ii:00 13.6 7.9 755 3 3.0 0.093 580 46<br />
900887 NVICWOOD 11/28/90 ii:I0 10.6 7.9 9.8 743 3 4.3 0.098 570 46<br />
Note: "
TFPC DATA REPORT<br />
TEMP pH DO EC TURB COLOR DOC UVA THMFP TFPC<br />
LAB# STA. NAME SAMP.DATE TIME oC mg/L uS/cm T.U. C.U. mg/L mg/L ug/L ug/L<br />
900935 NVICWOOD 12/12/90 11:15 9.6 7.4 8.0 624 3 4.6 0.150 700 61<br />
900342 OLDR-DMC-CLIFT 07/10/90 9:15 24.7 7.9 6.8 366 8 0.094 730 67<br />
900362 OLDR-DMC-CLIFT 07/17/90 10:40 26.1 7.8 6.4 571 15 3.1 0.084 530 47<br />
900432 OLDR-DMC-CLIFT 07/26/90 10:40 24.1 7.9 7.2 411 ii i0 2.9 0.091 470 41<br />
900452 OLDR-DMC-CLIFT 07/31/90 9:50 25.2 7.0 6.6 822 13 3.5 0.103 570 49<br />
900472 OLDR-DMC-CLIFT 08/07/90 9:50 25.3 7.6 6.7 465 14 3.5 510 45<br />
900584 OLDR-DMC-CLIFT 08/28/90 10:50 23.8 7.6 360 8 2.8 610 54<br />
900595 OLDR-DMC-CLIFT 09/05/90 11:45 23.2 7.5 6.6 558 7 3.0 0.088 580 51<br />
900626 OLDR-DMC-CLIFT 09/11/90 ii:00 22.5 7.5 8.7 426 7 3.3 0.094 600 53<br />
900653 OLDR-DMC-CLIFT 09/17/90 11:25 22.4 7.9 7.3 413 14 3.4 0.132 640 58<br />
900667 OLDR-DMC-CLIFT 09/25/90 12:08 22.1 7.7 7.0 467 7 3.6 0.098 530 46<br />
900689 OLDR-DMC-CLIFT 10/02/90 11:25 23.2 7.5 6.8 594 13 3.4 0.095 500 43 ~<br />
900714 OLDR-DMC-CLIFT 10/09/90 11:15 19.3 7.8 7.6 626 8 3.4 0.103 600 50<br />
900734 OLDR-DMC-CLIFT 10/15/90 ii:I0 18.9 8.2 11.3 683 i0 3.4 0.099 650 54 O<br />
900778 OLDR-DMC-CLIFT 10/24/90 11:15 18.1 7.6 8.0 718 5 20 3.4 0.108 730 62 ~<br />
900833 OLDR-DMC-CLIFT 10/31/90 12:20 18.1 7.6 8.8 745 6 3.2 0.092 520 41<br />
900847 OLDR-DMC-CLIFT 11/14/90 11:45 13.5 7.8 706 5 3.0 0.087 470 39 O<br />
900891 OLDR-DMC-CLIFT 11/28/90 11:50 10.4 7.9 i0.I 809 4 4.2 0.072 480 39 ~<br />
900939 OLDR-DMC-CLIFT 12/12/90 12:00 9.4 7.3 8.2 828 3 3.8 0.112 660 51<br />
900065 OLDRIVDMC 01/24/90 12:40 8.8 7.7 10.4 849 9 25 4.6 550 49 O<br />
900247 OLDRIVDMC 04/25/90 9:15 18.3 8.0 8.3 503 i0 30 2.5 0.080 360 30 ~<br />
900344 OLDRIVDMC 07/10/90 9:35 25.3 8.0 7.1 380 8 3.0 0.092 580 53<br />
900364 OLDRIVDMC 07/17/90 II:00 26.3 7.4 5.4 872 20 3.8 0.082 560 48 O<br />
900434 OLDRIVDMC 07/26/90 10:55 24.2 7.9 7.1 392 9 i0 3.0 0.092 480 43<br />
900454 OLDRIVDMC 07/31/90 I0:I0 24.7 7.1 6.4 935 14 4.0 0.124 670 58<br />
900474 OLDRIVDMC 08/07/90 10:05 25.5 7.7 6.5 495 7 3.6 0.085 440 37<br />
900564 OLDRIVDMC 08/13/90 9:47 24.4 7.7 6.2 546 7 3.2 770 68<br />
900566 OLDRIVDMC 08/13/90 i0:00 25.4 7.8 5.8 734 15 3.3 0.095 800 69<br />
900544 OLDRIVDMC 08/22/90 11:45 25.5 8.3 8.0 404 9 25 2.8 610 55<br />
900546 OLDRIVDMC 08~22/90 12:15 25.3 8.4 8.0 568 ii 30 3.1 0.090 660 58<br />
900586 OLDRIVDMC 08/28/90 11:20 23.5 7.7 692 7 3.2 0.093 690 59<br />
900608 OLDRIVDMC 09/05/90 12:30 23.1 7.5 7.0 644 ii 3.1 0.090 680 59<br />
900628 OLDRIVDMC 09/11/90 11:20 22.7 7.3 8.5 407 7 3.0 0.098 560 49<br />
900655 OLDRIVDMC 09/17/90 11:50 22.7 7.8 7.2 445 12 3.1 0.107 580 52<br />
900669 OLDRIVDMC 09/25/90 12:25 21.7 7.8 7.1 452 6 3.2 0.103 450 39<br />
900691 OLDRIVDMC 10/02/90 11:40 23.0 7.5 7.0 763 ii 3.7 0.098 530 45<br />
Note: "
TEMP pH DO EC TURB COLOR DOC UVA THMFP TFPC<br />
LAB# STA. NAME SAMP.DATE TIME oC mg/L uS/cm T.U. C.U. . mg/L mg/L ug/L ug/L<br />
900716 OLDRIVDMC 10/09/90 11:40 19.5 7.9 8.1 716 5 3.6 0.102 630 53<br />
900736 OLDRIVDMC 10/15/90 11:30 18.5 8.2 11.9 806 10 3.7 0.102 570 47<br />
900793 OLDRIVDMC 10/24/90 11:40 18.4 7.6 7.9 702 4 5 3.3 0.104 700 57<br />
900835 OLDRIVDMC 10/31/90 12:50 18.1 7.7 8.9 752 6 3.1 0.093 550 43<br />
900849 OLDRIVDMC 11/14/90 12:00 13.4 7.9 776 6 3.1 0.088 510 42<br />
900893 OLDRIVDMC 11/28/90 12:10 10.3 7.9 9.8 823 4 2.4 0.053 380 31<br />
900941 OLDRIVDMC 12/12/90 12:15 9.4 7.4 8.2 816 4 3.8 0.116 740 58<br />
900039 OLDRTRACY 01/24/90 10:26 8.8 7.6 8.8 1190 13 25 5.2 530 45<br />
900220 OLDRTRACY 04/25/90 9:15 18.1 6.7 8.4 1120 14 40 3.8 470 40<br />
900404 OLDRTRACY 07/26/90 8:20 22.8 7.5 8.6 916 20 15 3.9 0.101 460 38<br />
900516 OLDRTRACY 08/22/90 12:05 25.6 6.3 857 19 40 3.5 0.088 .620 52<br />
900798 OLDRTRACY 10/24/90 10:05 18.8 7.2 7.2 1140 12 35 3.4 0.089 600 48<br />
900022 PESCADERO01 01/23/90 13:00 9.6 7.2 8.3 1900 23 25 3.0 320 26<br />
900213 PESCADERO01 04/24/90 17:55 20.1 8.2 16.8 2290 17 60 4.5 0.115 750 54 ~O<br />
900305 PESCADERO01 06/27/90 11:10 23.1 7.9 5.6 1430 24 70 .8.5 0.203 O<br />
900396 PESCADERO01 07/25/90 7:30 20.2 8.2 10.0 1580 75 30 5.9 0.146 730 58<br />
900508 PESCADERO01 08/21/90 13:55 25.9 6.3 1150 14 60 14.0 0.203 420 35 ~<br />
900774 PESCADERO01 10/23/90 11:25 18.2 9.5 8.0 2090 48 140 5.0 0.098 720 54<br />
900023 PESCADERO02 01/23/90 13:25 11.2 7.1 7.0 1460 34 30 2.2 250 20<br />
900212 PESCADERO02 04/24/90 17:40 19.7 7.8 12.7 2280 22 80 4.4 0.105 740 54 ~<br />
900306 PESCADERO02 06/27/90 11:20 23.2 7.5 5.0 1370 12 80 11.0 0.293<br />
900397 pESCADERO02 07/25/90 8:00 20.2 7.6 9.4 2000 36 35 6.2 0.152 760 58 O<br />
900509 PESCADERO02 08/21/90 14:10 25.4 5.2 1230 17 60 12.0 0.225 960 82 ’ ~<br />
900775 PESCADERO02 10/23/90 11:40 19.4 10.0 12.9 1960 23 60 5.0 0.110 810 60 ~)<br />
900024 PESCADERO03 01/23/90 13:40 8.8 7.4 9.0 2160 28 20 2.9 300 23<br />
900214 PESCADERO03 04/24/90 17:15 19.7 8.1 13.1 1950 23 60 4.5 0.115 810 61<br />
900307 PESCADERO03 06/27/90 11:40 23.3 8.2 8.5 1600 7.4 0.190<br />
900398 PESCADERO03 07/25/90 8:25 20.9 7.9 8.8 1560 36 50 7.6 0.183 720 58<br />
900510 PESCADERO03 08/21/90 14:29 25.7 8.2 1720 23 70 6.9 0.149 910 72<br />
900776 PESCADERO03 10/23/90 11:55 20.2 10.2 9.4 2280 21 100 4.5 0.096 640 47<br />
900025 PESCADERO04 01/23/90 14:20 12.4 8.4 10.0 3060 18 25 4.0 650 42<br />
900026 PESCADERO04 01/23/90 14:20 12.4 8.4 10.0 3070 17 25 3.9 670 44<br />
900117 PESCADERO04 02/19/90 12:55 10.0 8.1 9.7 2210 14 20 6.2 580 43<br />
900399 PESCADERO04 07/25/90 8:50 19.2 7.9 9.5 1540 22 35 6.2 0.166 710 57<br />
900777 PESCADERO04 10/23/90 12:20 18.7 10.2 3.6 2480 124 50 8.7 0.241 1400 110<br />
900011 RINDGEPP01 01/22/90 6:30 9.1 6.7 3.9 1380 7 120 29.0 2600 250<br />
Note: "
TFPC DATA REPORT<br />
TEMP pH DO EC TURB COLOR DOC UVA THMFP TFPC<br />
LAB# STA. NAME SAMP.DATE TIME oC mg/L uS/cm T.U. C.U. mg/L mg/L ug/L ug/L<br />
900110 RINDGEPP01 02/19/90 8:00 7.3 7.2 8.2 1660 7 80 18.0 1900 180<br />
900192 RINDGEPP01 04/23/90 7:40 18.1 7.1 3.8 1240 11 70 12.0 0.459 1500 140<br />
900375 RINDGEPP01 07/24/90 6:56 19.2 1.2 663 20 80 20.0 0.939 2000 200<br />
900488 RINDGEPP01 08/20/90 8:20 21.5 6.4 3.1 728 8 100 19.0 0.845 1900 180<br />
900754 RINDGEPP01 10/22/90 7:00 14.4 6.9 2.5 688 18 120 9.5 0.568 1300 130<br />
900012 RINDGEPP02 "01/22/90 8:45 7.8 6.7 2.7 797 6 160 37.0 2700 270<br />
900111 RINDGEPP02 02/19/90 8:45 7.8 6.5 6.4 1340 5 100 26.0 2400 230<br />
900193 RINDGEPP02 04/23/90 8:15 16.6 6.4 6.1 711 10 120 24.0 1.060 2100 210<br />
900376 RINDGEPP02 07/24/90 8:20 22.1 2.1 514 9 100 22.0 1.067 2200 220<br />
900489 RINDGEPP02 08/20/90 9:15 22.1 6.2 3.1 485 3 150 27.0 1.270 2100 210<br />
900753 RINDGEPP02 10/22/90 8:00 14.9 7.1 3.3 890 8 160 28.0 0.562 2200 200<br />
900054 ROCKSL 01/24/90 8:50 8.3 7.8 10.5 962 8 25 3.5 710 56 ~<br />
900138 ROCKSL 02/23/90 12:25 10.8 7.0 12.5 600 7 20 3.7 580 49<br />
900155 ROCKSL 03/20/90 13:00 16.7 7.9 10.7 548 5 20 3.3 0.113 460 39 O<br />
900236 ROCKSL 04/25/90 11:20 864 4 20 3.0 0.077 440 33 ~<br />
900263 ROCKSL 05/23/90 9:15 19.3 8.2 8.3 660 13 30 2.4 0.071 420 33<br />
900287 ROCKSL 06/26/90 11:15 23.0 7.8 6.8 376 9 25 3.2 0.080 490 44 O<br />
900332 ROCKSL 07/10/90 6:25 23.1 8.1 8.0 449 7 0.085 440 38 ~<br />
900352 ROCKSL 07/17/90 9:25 24.3 7.5 6.9 441 8 2.6 0.077 680 59<br />
900426 ROCKSL 07/26/90 8:45 23.8 8.0 7.7 572 8 i0 3.1 0.073 420 34 O<br />
900442 ROCKSL 07/31/90 8:40 23.2 7.7 7.6 547 6 3.2 0.079 520 42 ~<br />
900462 ROCKSL 08/07/90 8:45 23.7 7.8 7.5 635 7 2.2 0.078 480 37<br />
900558 ROCKSL 08/13/90 8:35 24.0 8.1 6.4 508 6 3.0 ¯ 0.080 410 32 ~<br />
900538 ROCKSL 08/22/90 10:25 25.0 8.4 8.3 477 6 20 2.3 0.071 580 48<br />
900578 ROCKSL 08/28/90 9:20 22.6 7.8 461 6 2.4 0.075 570 48<br />
900600 ROCKSL 09/05/90 9:30 22.9 7.5 6.8 483 6 ¯ 2.6 0.072 550 46<br />
900620 ROCKSL 09/11/90 9:10 22.6 7.6 9.0 510 4 0.077 580 48<br />
900642 ROCKSL 09/17/90 9:55 21.9 7.9 7.4 547 5 2.6 0.078 260 47<br />
900661 ROCKSL 09/25/90 10:45 21.5 7.9 7.4 583 4 2.6 0.071 440 35<br />
900683 ROCKSL 10/02/90 10:00 21.8 7.6 7.3 618 6 2.6 0.079 420 34<br />
900708 ROCKSL 10/09/90 9:40 19.4 7.8 7.9 816 5 2.6 0.076 650 50<br />
900728 ROCKSL 10/15/90 9:50 18.9 8.1 11.2 847 4 2.7 0.078 570 43<br />
900785 ROCKSL 10/24/90 10:05 17.9 7.8 8.4 960 2 10 2.7 0.077 610 45<br />
900827 ROCKSL 10/31/90 10:40 17.5 7.6 9.1 828 3 2.7 0.077 480 34<br />
900841 ROCKSL 11/14/90 10:35 13.5 7.9 848 2 3.0 0.081 470 37<br />
900885 ROCKSL 11/28/90 10:45 10.6 7.8 9.9 949 3 3.0 0.095 470 35<br />
Note: "
TFPC DATA REPORT O<br />
TEMP pH DO EC TURB COLOR DOC UVA THMFP TFPC<br />
LAB# STA. NAME SAMP.DATE TIME oC mg/L uS/cm T.U. C.U. mg/L mg/L ug/L ug/L<br />
900928 ROCKSL 12/12/90 10:35 9.5 7.5 8.4 ii00 3 3.3 740 54<br />
900050 SACRRIOVISTA 01/24/90 9:35 12.6 7.2 214 18 50 4.3 560 56<br />
900104 SACRRIOVISTA 02/21/90 13:12 11.7 7.4 12.3 314 26 35 3.8 900 89<br />
900163 SACRRIOVISTA 03/21/90 11:05 17.2 7.7 7.7 391 I0 20 2.6 0.078 360 33<br />
900231 SACRRIOVISTA 04/25/90 9:26 18.1 6.1 8.7 180 8 I0 3.3 0.058 260 25<br />
900271 SACRRIOVISTA 05/22/90 9:50 18.0 7.5 7.6 212 12 20 1.9 0.047 210 20<br />
900281 SACRRIOVlSTA 06/26/90 8:35 21.2 8.1 8.2 257 15 20 2.7 0.056 290 28<br />
900325 SACRRIOVISTA 07/09/90 9:30 22.0 7.9 7.9 208 9 3.5 280 27<br />
900350 SACRRIOVISTA 07/16/90 7:40 23.0 7.5 7.5 166 9 1.9 0.054 320 31<br />
900415 SACRRIOVISTA 07/26/90 9:35 23.6 8.0 6.3 155 9 5 1.7 0.047 250 25<br />
900440 SACRRIOVISTA 07/30/90 7:10 23.0 7.5 8.7 154 8 2.0 0.046 330 32<br />
900460 SACRRIOVISTA 08/06/90 6:50 23.0 7.5 8.5 159 9 1.8 0.065 400 39<br />
900552 SACRRIOVISTA 08/13/90 6:50 24.2 7.2 7.5 168 7 1.9 0.048 230 23<br />
900522 SACRRIOVISTA 08/22/90 10:35 23.6 7.8 9.6 176 9 20 1.8 0.045 220 21<br />
900572 SACRRIOVlSTA 08/27/90 7:24 22.0 7.5 7.8 200 6 2.0 0.050 380 38<br />
900589 SACRRIOVISTA 09/04/90 8:20 22.0 8.2 217 7 2.5 0.058 390 39<br />
900614 SACRRIOVISTA 09/10/90 7:45 20.9 7.9 7.5 243 7 0.058 390 38<br />
900629 SACRRIOVISTA 09/18/90 8:05 20.2 7.7 8.0 223 8 2.1 0.054 250 24<br />
900677 SACRRIOVISTA 09/24/90 7:40 22.0 7.7 7.6 234 8 20 2.3 0.044 320 31<br />
900697 SACRRIOVISTA 10/01/90 7:50 20.0 7.2 7.8 206 8 2.1 0.046 300 29<br />
900717 SACRRIOVISTA 10/10/90 6:40 17.8 7.6 8.1 254 9 2.1 0.051 290 27<br />
900742 SACRRIOVISTA 10/16/90 6:30 19.5 7.6 7.9 297 9 2.1 0.057 290 26<br />
900809 SACRRIOVISTA .10/24/90 9:55 18.3 7.9 8.8 432 6 I0 1.7 0.052 280 22<br />
900821 SACRRIOVISTA 10/30/90 8:35 17.0 7.8 9.3 200 6 1.9 0.084 210 21<br />
900854 SACRRIOVISTA 11/13/90 ii:00 14.0 7.5 9.4 289 7 i0 1.9 0.048 290 27<br />
900879 SACRRIOVISTA 11/27/90 9:30 12.3 7.5 9.7 238 4 2.1 0.054 260 25<br />
900923 SACRRIOVISTA 12/11/90 9:40 9.5 8.8 9~7 197 7 5 1.9 0.054 200 20<br />
900057 SANDMOUND 01/24/90 10:35 8.2 7.9 10.4 842 9 30 4.0 640 52<br />
900235 SANDMOUND 04/25/90 7:25 17.0 8.2 8.9 989 6 20 2.5 0.080 410 30<br />
900335 SANDMOUND 07/10/90 7:55 22.9 8.1 7.6 475 7 2.6 0.077 490 41<br />
900355 SANDMOUND 07/17/90 9:00 23.5" 8.1 7.1 498 9 2.6 0.072 580 51<br />
900419 SANDMOUND 07/26/90 7:55 22.9 8.3 7.8 475 9 10 2.6 0.069 440 37<br />
900445 SANDMOUND 07/31/90 8:20 22.6 7.6 7.5 558 7 2.4 0.087 540 44<br />
900465 SANDMOUND 08/07/90 8:20 22.9 7.8 7.9 539 5 2.1 0.068 440 35<br />
900556 SANDMOUND 08/13/90 8:15 24.0 8.1 7.0 471 6 2.3 0.068 610 51<br />
900534 SANDMOUND 08/22/90 10:00 24.7 7.9 8.2 424 7 20 2.4 0.068 540 46<br />
Note: "
TFPC DATA REPORT<br />
TEMP pH DO EC TURB COLOR DOC UVA THMFP TFPC<br />
LAB# STA. NAME SAMP.DATE TIME OC mg/L uS/cm T.U. C.U. mg/L mg/L ug/L ug/L<br />
900576 SANDMOUND 08/28/90 8:40 22.0 7.8 425 6 2.3 0.070 530 46<br />
900598 SANDMOUND 09/05/90 9:05 22.4 7.7 7.0 463 6 2.4 0.071 530 45<br />
900618 SANDMOUND 09/11/90 8:50 21.9 7.5 8.8 519 5 2.5 0.070 570 48<br />
900645 SANDMOUND 09/17/90 9:25 21.7 7.9 7.5 481 4 2.3 0.067 3100 310<br />
900659 SANDMOUND 09/25/90 10:24 21.1 8.0 7.5 580 5 2.5 0.071 480 39<br />
900681 SANDMOUND 10/02/90 9:20 21.6 7.7 7.8 585 4 2.6 0.076 400 32<br />
900706 SANDMOUND 10/09/90 9:15 18.0 8.1 8.1 832 3 2.5- 0.070 530 41<br />
900726 SANDMOUND 10/15/90 9:25 18.7 8.2 11.6 857 3 2.7 0.072 550 41<br />
900781 SANDMOUND 10/24/90 9:05 17.9 7.8 8.4 912 3 5 2.4 0.078 570 43<br />
900839 SANDMOUND 11/14/90 10:15 13.6 7.9 823 2 2.6 0.078 520 40<br />
900883 SANDMOUND 11/28/90 10:10 10.1 7.9 9.9 967 2 2.7 0.081 600 44<br />
900931 SANDMOUND 12/12/90 10:15 9.5 7.6 8.3 998 3 3.1 0.089 590 43 T-<br />
900059 SANTAFEBACON 01/24/90 11:10 8.3 7.7 11.7 594 8 30 4.1 630 54<br />
900241 SANTAFEBACON 04/25/90 7:55 17.9 8.0 8.7 403 7 20 2.9 0.066 320 27 T-<br />
900337 SANTAFEBACON 07/10/90 8:20 24.1 7.9 6.9 307 5 3.0 0.093 630 59 ~<br />
900357 SANTAFEBACON 07/17/90 9:40 25.3 7.9 6.7 405 7 2.6 0.077 520 46<br />
900427 SANTAFEBACON 07/26/90 9:00 24.2 7.9 7.3 312 7 i0 3.4 0.091 410 37 O<br />
900447 SANTAFEBACON 07/31/90 9:00 23.9 7.7 7.7 494 7 2.6 0.104 530 44 [~<br />
900467 SANTAFEBACON 08/07/90 9:00 24.5 7.7 7.0 340 6 2.5 0.075 520 47<br />
900559 SANTAFEBACON 08/13/90 9:00 22.0 7.5 6.7 477 6 2.7 0.082 550 47 O<br />
900539 SANTAFEBACON 08/22/90 10:35 25.2 8.3 8.2 307 4 20 2.6 0.090 640 59 ~<br />
900579 SANTAFEBACON 08/28/90 9:50 22.9 7.7 420 6 2.5 0.079 550 48<br />
900601 SANTAFEBACON 09/05/90 10:05 23.2 7.5 6.2 358 4 2.7 0.088 530 47 ~<br />
900621 SANTAFEBACON 09/11/90 9:50 22.6 7.4 8.7 395 6 2.7 0.090 570 51<br />
900648 SANTAFEBACON 09/17/90 10:15 22.5 7.8 7.3 460 4 2.7 0.088 520 45<br />
900662 SANTAFEBACON 09/25/90 11:09 22.0 7.6 6.8 368 3 3.2 0.105 400 37<br />
900678 SANTAFEBACON 10/02/90 10:20 22.2 7.5 7.3 563 7 2.8 440 37<br />
900709 SANTAFEBACON 10/09/90 10:00 18.8 7.9 8.0 710 4 2.9 0.086 550 44<br />
900723 SANTAFEBACON 10/15/90 10:10 19.1 7.9 11.4 763 3 3.0 0.087 490 37<br />
900786 SANTAFEBACON 10/24/90 10:20 18.4 7~6 7.8 639 2 10 3.3 0.099 730 61<br />
900828 SANTAFEBACON 10/31/90 11:20 18.2 7.6 8.6 785 2 2.8 0.085 460 34.<br />
900842 SANTAFEBACON 11/14/90 10:50 13.5 7.9 786 3 2.8 0.083 440 35<br />
900886 SANTAFEBACON 11/28/90 11:00 10.7 7.8 9.8 850 2 3.0 0.088 550 42<br />
900934 SANTAFEBACON 12/12/90 11:05 9.5 7.4 8.0 711 2 3.6 0.111 730 61<br />
900331 SJRJERSEY 07/10/90 7:10 22.2 8.3 7.5 1640 10 2.7 0.082 540 37<br />
900353 SJRJERSEY 07/17/90 8:10 23.1 8.1 7.8 705 9 2.6 0.069 620 50<br />
Note: "
TFPC DATA REPORT O<br />
TEMP pH DO EC TURB COLOR DOC UVA THMFP TFPC<br />
LAB# STA. NAME SAMP.DATE TIME oC mg/L uS/cm T.U. C.U. mg/L mg/L ug/L ug/L<br />
900420 SJRJERSEY 07/26/90 7:25 22.7 8.3 8.0 1590 12 i0 3.4 0.074 560 38<br />
900443 SJRJERSEY 07/31/90 7:50 22.2 7.0 7.8 670 9 2.2 0.073 530 41<br />
900463 SJRJERSEY 08/07/90 7:55 22.4 7.8 8.3 917 i0 2.1 0.060 520 38<br />
900554 SJRJERSEY 08/13/90 7:50 19.4 8.6 7.6 637 8 2.7 0.059 360 28<br />
900531 SJRJERSEY 08/22/90 9:00 22.6 7.9 8.3 730 8 20 2.1 0.059 620 46<br />
900574 SJRJERSEY 08/28/90 7:55 21.8 8.1 8.0 610 6 0.072 640 52<br />
900596 SJRJERSEY 09/05/90 8:10 21.5 7.8 7.9 958 i0 2.8 0.071 670 51<br />
900616 SJRJERSEY 09/11/90 8:15 21.1 7.0 8.8 884 7 2.5 0.072 640 50<br />
900643 SJRJERSEY 09/17/90 8:50 20.7 8.3 7.7 957 i0 2.4 0.074 600 45<br />
900656 SJRJERSEY 09/25/90 9:50 21.1 8.3 7.7 1460 ii 2.5 0.071 570 39<br />
900679 SJRJERSEY 10/02/90 8:40 20.9 7.8 8.0 1170 3 2.5 0.069 470 33<br />
900704 SJRJERSEY 10/09/90 8:40 18.5 8.1 8.0 1630 7 2.4 0.068 600 40<br />
900724 SJRJERSEY 10/15/90 9:00 18.6 8.0 11.2 7 2.5 0.068 570 37<br />
900779 SJRJERSEY 10/24/90 8:25 17.7 7.9 8.5 2140 6 I0 2.4 0.074 920 61<br />
900823 SJRJERSEY 10/31/90 9:30 17.1 7.8 9.3 1380 4 2.4 0.062 500 34<br />
900837 SJRJERSEY 11/14/90 9:45 13.8 7.8 2150 3 2.5 0.067 570 38<br />
900881 SJRJERSEY 11/28/90 9:40 ii.0 8.0 1750 3 3.8 0.073 560 37<br />
900929 SJRJERSEY 12/12/90 9:40 10.1 7.6 8.0 2790 6 2.8 0.080 730 45<br />
900036 SJRMOSSDALE 01/24/90 8:30 8.2 7.8 10.3 1310 15 20 3.8 490 40<br />
900216 SJRMOSSDALE 04/25/90 7:05 17.0 7.6 9.0 820 12 35 4.2 0.107 670 60<br />
900400 SJRMOSSDALE 07/26/90 7:40 23.0. 7.6 9.2 858 19 I0 3.1 0.080 400 33<br />
900513 SJRMOSSDALE 08/22/90 14:05 26.3 7.2 738 23 35 2.7 0.075 650 54<br />
900794 SJRMOSSDALE 10/24/90 7:58 17.9 7.0 8.0 732 14 30 2.4 0.062 490 41<br />
900058 STATION04B 01/24/90 10:55 8.3 7.9 8.6 804 9 30 4.2 630 51<br />
900240 STATION04B 04/25/90 7:40 17.6 8.1 8.9 905 5 25 3.4 0.072 440 33<br />
900336 STATION04B 07/10/90 8:06 23.9 8.1 7.4 408 7 2.6 0.080 610 54<br />
900356 STATION04B 07/17/90 9:15 24.4 8.0 7.2 450 8 2.5 0.075 540 46<br />
900425 STATION04B 07/26/90 8:35 24.0 8.0 7.2 524 8 10 2.6 0.072 410 34<br />
900446 STATION04B 07/31/90 8:30 23.2 7.8 7.5 533 7 2.4 0.082 460 37<br />
900466 STATION04B 08/07/90 8:35 23.3 7.8 7.7 595 7 2.3 0.068 480 38<br />
900557 STATION04B - 08/13/90 8:25 24.0 8.1 6.9 504 6 2.3 0.069 380 30<br />
900537 STATION04B 08/22/90 10:15 24.9 8.2 8.3 463 5 20 2.3 0.077 600 50<br />
900577 STATION04B 08/28/90 9:10 22.3 7.7 464 6 2.3 0.072 530 44<br />
900599 STATION04B 09/05/90 9:15 22.8 7.4 7.0 474 6 2.4 0.071 570 48<br />
900619 STATION04B 09/11/90 9:00 22.3 7.8 8.7 527 5 2.4 0.075 540 46<br />
900646 STATION04B 09/17/90 9:45 21.8 8.0 7.5 544 6 2.6 0.078 540 45<br />
Note: "
TFPC DATA REPORT<br />
TEMP pH DO EC TURB COLOR DOC UVA THMFP TFPC<br />
LAB# STA. NAME SAMP.DATE TIME oC mg/L uS/cm T.U. C.U. mg/L mg/L ug/L ug/L<br />
900660 STATION04B 09/25/90 10:35 21.4 8.0 7.4 573 4 2.6 0.075 450 36<br />
900682 STATION04B 10/02/90 9:35 21.8 7.6 7.6 613 4 2.7 0.077 410 33<br />
900707 STATION04B 10/09/90 9:30 18.2 7.9 8.1 836 5 2.5 0.075 500 37<br />
900727 STATION04B 10/15/90 9:40 18.9 8.1 11.5 863 3 2.6 0.073 570 43<br />
900784 STATION04B 10/24/90 9:55 18.1 7.8 8.3 921 2 5 2.6 0.081 650 49<br />
900826 STATION04B 10/31/90 10:30 17.5 7.7 9.4 832 2 2.6 0.077 480 35<br />
900840 STATION04B 11/14/90 10:25 13.6 7.9 859 3 2.8 0.077 520 40<br />
900884 STATION04B 11/28/90 10:20 10.6 7.8 9.7 959 3 2.9 0.086 470 35<br />
900932 STATION04B 12/12/90 10:25 9.5 7.6 8.2 1060 3 3.2 0.104 600 44<br />
900061 STATION09 01/24/90 11:35 8.3 7.6 8.7 726 9 25 3.7 610 50<br />
900243 STATION09 04/25/90 8:20 18.0 7.9 8.5 712 6 20 3.0 0.076 380 29<br />
900339 STATION09 07/10/90 8:40 24.4 7.9 7.0 371 8 3.2 0.090 690 63 ~<br />
900359 STATION09 07/17/90 10:05 25.3 8.2 7.0 399 7 2.9 0.088 510 46<br />
900429 STATION09 07/26/90 9:25 24.1 8.1 7.3 489 12 i0 2.5 0.083 420 36 T-<br />
900449 STATION09 07/31/90 9:20 24.3 6.9 7.1 479 6 2.5 0.084 510 43 ~<br />
900461 STATION09 08/07/90 9:20 24.9 7.7 7.4 537 7 4.0 580 48<br />
900561 STATION09 08/13/90 9:15 23.8 7.8 6.6 455 7 2.5 0.083 540 47 O<br />
900541 STATION09 08/22/90 ii:00 24.9 8.3 8.2 413 5 20 2.5 0.079 660 56 ~<br />
900581 STATION09 08/28/90 10:20 23.2 7.7 421 6 2.6 0.086 560 49<br />
900603 STATION09 09/05/90 10:30 23.8 " 7.5 6.9 423 5 2.6 0.081 610 53 O<br />
900623 STATION09 09/11/90 10:15 22.8 7.7 8.7 468 6 2.6 0.085 610 53 ~<br />
900650 STATION09 09/17/90 10:45 22.9 7.8 7.4 474 5 2.9 0.090 600 52<br />
900664 STATION09 09/25/90 11:30 22.4 7.8 7.0 510 7 2.8 0.088 480 41 ~<br />
900686 STATION09 10/02/90 10:50 22.6 7.6 7.3 533 5 2.9 0.092 430 36<br />
900711 STATION09 10/09/90 10:25 19.1 7.7 7.8 677 5 3.0 0.095 560 45<br />
900731 STATION09 10/15/90 10:35 19.0 " 8.0 11.4 726 4 3.0 0.089 610 49<br />
900788 STATION09 10/24/90 10:40 18.0 7.6 8.0 800 4 10 3.4 0.103 580 46<br />
900830 STATION09 10/31/90 11:50 18.3 7.6 8.7 773 4 3.1 0.094 600 46<br />
900844 STATION09 11/14/90 11:10 13.5 7.9 771 4 3.0. 0.088 520 41<br />
900880 STATION09 11/28/90 11:20 10.6 7.8 9.6 846 3 3.0 0.092 560 43<br />
900936 STATION09 12/12/90 11:25 9.4 7.4 8.2 910 4 3.7 0.114 630 48<br />
900044 TURNERCUT 01/24/90 12:52 9.4 7.4 9.8 363 8 30 5.2 600 56<br />
900045 TURNERCUT 01/24/90 12:52 9.4 7.4 9.8 367 7 30 5.1 650 61<br />
900225 TURNERCUT 04/25/90 12:00 18.7 7.2 8.8 288 6 25 2.4 0.078 310 28<br />
900409 TURNERCUT 07/26/90 12:40 27.2 7.3 8.1 264 6 15 2.9 0.097 340 32<br />
900512 TURNERCUT 08/22/90 9:00 23.1 7.1 256 5 25 3.2 0.110 610 58<br />
Note: "
TFPC DATA REPORT O<br />
TEMP pH DO EC TURB COLOR DOC UV~ THMFP TFPC<br />
LAB# STA. NAME SAMP.DATE TIME oC mg/L uS/cm T.U. C.U. mg/L mg/L ug/L ug/L<br />
900803 TURNERCUT 10/24/90 12:48 20.2 7.1 7.5 786 3 20 3.5 0.103 660 57<br />
900031 UPJONESPP01 01/23/90 ii:00 37.0 3900 390<br />
900032 UPJONESPP02 01/23/90 14:44 12.2 7.1 8.9 980 22 80 8.7 1300 120<br />
900130 UPJONESPP02 02/23/90 9:10 Ii.0 7.2 8.2 968 50 50 9.5 ii00 ii0<br />
900206 UPJONESPP02 04/24/90 14:10 18.3 7.3 4.6 765 20 I00 8.0 0.336 i000 94<br />
900295 UPJONESPP02 06/26/90 13:20 25.2 7.1 5.1 864 22 i00 8.0 0.317<br />
900393 UPJONESPP02 07/25/90 8:45 19.9 6.8 9.4 750 27 50 8.2 0.315 910 85<br />
900505 UPJONESPP02 08/21/90 12:33 22.9 3.0 697 19 80 7.5 0.310 i000 94<br />
900768 UPJONESPP02 10/23/90 9:15 16.5 8.8 4.1 836 56 ,-120 8.6 Ii00 ii0<br />
900021 VERNALIS 01/23/90 11:45 9.2 8.1 9.9 1320 Ii 15 3.7 600 49<br />
900094 VERNALIS 02/21/90 7:25 8.7 8.4 14.7 1180 34 35 5.6 650 58<br />
900149 VERNALIS 03/20/90 7:50 16.3 6.2 8.0 968 12 15 3.4 0.075 610 52<br />
900204 VERNALIS 04/24/90 13:00 19.0 8.0 8.8 802 18 30 4.4 0.115 640 57<br />
900257 VERNALIS 05/23/90 12:00 19.4 8.4 8.7 919 19 30 0.072 430 35 ~<br />
900299 VERNALIS 06/27/90 7:20 20.1 8.1 6.1 865 30 40 4.7 0.075<br />
900388 VERNALIS 07/25/90 13:30 25.5 9.3 826 26 20 4.0 0.089 430 36 T-<br />
900496 VERNALIS 08/21/90 10:20 23.0 7.9 7.3 793 31 50 3.1 0.088 560 47 ~<br />
900635 VERNALIS 09/25/90 10:05 21.2 7.4 7.5 849 13 30 3.3 0.088 520 43<br />
900699 VERNALIS 10/01/90 ii:30 22.0 7.5 8.0 988 18 3.2 0.083 570 45 O<br />
900766 VERNALIS 10/23/90 6:20 16.3 7.9 7.7 714 6 20 2.9 0.059 620 53 ~<br />
900860 VERNALIS 11/13/90 8:15 12.5 7.9 9.1 774 4 5 2.2 0.058 280 23<br />
900911 VERNALIS 12/11/90 8:25 10.5 7.7 8.1 983 6 i0 2.4 0.057 370 30 O<br />
900141 WEBB01 02/27/90 9:30 13.0 5.8 4.7 2530 6 80 33.0 1900 190 ~<br />
900182 WEBB01 04/23/90 8:35 19.7 7.6 2.5 1350 80 30 18.0 0.524 1400 140<br />
900288 WEBB01 06/26/90 7:10 19.5 6.9 4.9 945 26 160 22.0 0.733 (~<br />
900366 WEBB01 " 07/24/90 7:30 19.5 7.1 4.3 819 17 80 17.0 0.695 1700 170<br />
900478 WEBB01 08/20/90 7:15 19.7 7.4 5.2 781 31 200 16.0 0.683 1800 170<br />
900743 WEBB01 10/22/90 7:40 15.4 8.0 4.9 742 92 350 14.0 0.841 1900 180<br />
900142 WEBB02 02/27/90 10:00 12.0 6.2 7.6 2240 7 160 47.0 2900 290<br />
900183 WEBB02 04/23/90 9:00 20.0 9.2 4.6 1080 19 30 30.0 1.330 2500 240<br />
900289 WEBB02 06/26/90 7:55 19.7 6.8 7.1 896 25 320 36.0 1.633<br />
900367 WEBB02 07/24/90 8:15 20.5 6.9 4.3 614 16 200 28.0 1.445 2900 290<br />
900479 WEBB02 08/20/90 7:50 20.5 7.2 4.5 669 10 350 57.0 2.540 3600 360<br />
900745 WEBB02 10/22/90 8:10 15.5 7.7 7.0 568 17 80 10.0 0.466 1600 160<br />
900063 WSTCANCLIFT 01/24/90 12:15 8.5 7.7 11.2 703 9 30 3.9 630 52<br />
900245 WSTCANCLIFT 04/25/90 8:50 18.2 7.9 8.6 610 8 30 2.3 0.084 360 29<br />
Note: "
TFPC DATA REPORT<br />
TEMP pH DO EC TURB COLOR DOC UVA THMFP TFPC<br />
LAB# STA. NAME SAMP.DATE TIME oC mg/L uS/cm T.U. C.U. mg/L mg/L ug/L ug/L<br />
900341 WSTCANCLIFT 07/10/90 9:10 24.7 7.8 7.0 379 9 3.1 0.092 640 58<br />
900361 WSTCANCLIFT 07/17/90 10:30 26.0 7.8 6.2 529 13 3.1 0.085 500 45<br />
900431 WSTCANCLIFT 07/26/90 10:35 24.1 7.9 7.1 475 13 i0 3.2 0.093 480 41<br />
900451 WSTCANCLIFT 07/31/90 9:45 25.0 7.0 6.6 496 9 3.1 0.098 i000 96<br />
900471 WSTCANCLIFT 08/07/90 9:45 25.4 7.6 6.8 418 i0 4.2 0.087 470 41<br />
900563 WSTCANCLIFT 08/13/90 9:45 25.4 7.6 6.3 492 12 3.2 0.093 800 72<br />
900543 WSTCANCLIFT 08/22/90 11:30 25.5 8.3 7.9 387 7 20 2.6 0.081 570 49<br />
900583 WSTCANCLIFT 08/28/90 10:45 23.3 7.7 360 6 2.7 0.090 540 48<br />
900605 WSTCANCLIFT 09/05/90 ii:00 23.5 7.5 6.7 392 8 2.7 0.091 650 58<br />
900625 WSTCANCLIFT 09/11/90 10:55 22.7 7.6 8.8 430 7 2.8 0.095 580 51<br />
900652 WSTCANCLIFT 09/17/90 11:15 22.6 7.8 7.3 412 7 3.2 0.104 610 55<br />
900666 WSTCANCLIFT 09/25/90 12:00 22.0 7.7 6.9 474 7 3.2 0.100 490 44<br />
900688 WSTCANCLIFT 10/02/90 11:20 22.9 7.5 7.0 481 8 3.6 0.098 450 40<br />
900713 WSTCANCLIFT 10/09/90 ii:00 18.9 7.8 7.6 592 9 3.2 570 47<br />
900733 WSTCANCLIFT 10/15/90 11:05 18.9 8.1 11.4 621 3 3.3 0.I01 630 52<br />
900790 WSTCANCLIFT 10/24/90 ii:i0 18.4 7.6 7.9 718<br />
900822 WSTCANCLIFT 10/31/90 12:15 18.0 7.6 8.7 665<br />
900832 WSTCANCLIFT 10/31/90 12:15 18.0 7.6 8.7 662<br />
900846 WSTCANCLIFT 11/14/90 11:40 13.6 7.8 707<br />
900890 WSTCANCLIFT 11/28/90 11:45 10.6 7.8 9.6 771<br />
900938 WSTCANCLIFT 12/12/90 11:55 9.4 7.4 8.3 831 3 3.7 0.144 710 55<br />
Note: "
I<br />
I<br />
NINERAL DATA REPORT<br />
TB~ pH m~ EC Na l~ Br Se A~best Hard. ~<br />
I<br />
I<br />
I<br />
900019<br />
900143<br />
900200<br />
900261<br />
900386<br />
900764<br />
900016<br />
903116<br />
kGOCLIFTON<br />
AGDCLIFTON<br />
AGOCLIFTOH<br />
/~OCLIFTON<br />
kGOCLIFTOH<br />
AGOCLIFTO#<br />
kGIX].IFTON<br />
kGOEI~IRE<br />
kGDDI~IRE<br />
01/23/90 9:50 15.4 7.4 5.2<br />
02/27/90 12:00 15.0 6.8 8,2<br />
04/24/90 10:40 17.5 7.4 9.0<br />
05/23/90 lO:O0 17.5 7.5 7.7<br />
06/27/90 10:00 21.0 6.7 4.6<br />
07/25/90 11:10 22.0 7.5 7.5<br />
10/23/90 8:50 19.0 7.4 5.8<br />
01/22/90 10:00 7.8 6.8 7.7<br />
02/19/90 10:50 6.8 7.1 ll.!<br />
6090<br />
6150<br />
6270<br />
2530<br />
3680<br />
2640<br />
5790<br />
2310<br />
2320<br />
1110 1420<br />
1110 1520<br />
998 1510<br />
352 526<br />
602 810<br />
406 603<br />
1030 1320<br />
186 523<br />
202 556<br />
1.20<br />
2.20<br />
1.80<br />
4.20<br />
1.80<br />
0,003<br />
0.002<br />
0.002<br />
O.OOl<br />
~HE~ ~TA R~T I<br />
T~ ~ ~ EC Na C] Br ~ ~t~rd. ~ ~ K ~ ~ B<br />
LABI ~k. ~ ~.~TE T[~ ~ ~ ~ ~ ~ ~ ~ < ~’<br />
’ I<br />
~Z8 ~KS ~ 8:~Z8.3 7.7 8.9 ~ ~ HI 0.~ ~.~t H5 Z8 Z7 4.2 ~ ~ 0A<br />
~ ~KS ~ ]0:~ ]8.2 8.3 9.1 ~1 ~ 1~ 0.42 ~.~1 114 19 16 4.2 ~ ~ 0.2 ~ l<br />
~ ~KS ~ 9:]5~.4 8A 8.2 ~ ~ ~ 0.~ ~.~] ]~ ]8 ]5 3.6 ~ ~ 0.2 316 I<br />
~ ~KS ~ 15:~ ~.5 8.3 7.8 518 ~ ~ 0.~ l~ ~ 14<br />
~ ~KS ~/1~ 10:~ 24.5 8.4 7.4 ~1 ~ ~ 0.21 ~ 16 12<br />
~ ~KS ~ 10:10~.0 7.4 10.1 ~ ~ ~ 0.~ ~.~1 ~ 15 12 2.9 ~ 24 0.1 2~<br />
~ ~KS ~ 11:~24.2 7.3 7.6 ~ ~ 1~ 0.~ 87 15 12<br />
~ ~KS ~ 9:~.9 7.4 6.6 ~ 51 ~ 0.~ ~ 14 12<br />
~ ~KS ~1~ 9:~.2 7.8 6.5 ~ ~ ~ 0.~ ~ 13 12<br />
~14 ~KS ~ 12:~ 24.5 7.2 ~ 45 ~ 0.~ ~.~1 ~ 14 11 2.6 61 ~ ~.1<br />
~ ~[S ~ 10:24 ~.7 7.8 ~ 45 ~ 0.~ ~ 15<br />
~ ~KS ~13:~.7 8.3 ~ ~ ~ 0.24 ~ 14 11<br />
~10 ~KS ~1~ lO:~ 24.0 8.0 7.1 ~ 51 ~ 0.~ ~ 14 12<br />
~ ~K$ ~1~ 12:10 21.9 8.1 7.8 424 ~ ~ 0.~ ~ 16 12<br />
~1 ~KS ~4~ 11:~ ~.6 7.9 8.1 512 ~ ~ 0.~ ~.~1 ~ 17 13 3.1 ~ ~ 0.1 ~8<br />
~ ~S 1~1~ 12:~ ~.9 7.7 8.2 ~ ~ ~ 0.~ 1~ 18 14<br />
~18 ~KS 1~1~ 9:~ 19.3 7.7 6.8 ~ ~ 114 0.~ 114 19 16<br />
~ ~KS 1~1~ 8:45 18.9 8.6 8.0 ~ ~ 1~ 0.~ 114 19 16<br />
~ ~KS 1~4~ 8:~ 17.7 7.0 7.8 ~1 ~ 1~ 0.~ ~.~1 1~ 21 17 4.4 ~ ~ 0.2<br />
~16 ~KS 1~ 12:~ 18.3 7.8 8.8 ~ 91 1~ 0.~ 1~ ~ 18<br />
~ ~KS 11/1~ 12:~ 15.0 7.9 9.3 ~ ~ 1~ 0.~ ~.~1 1~ 21 18 4.6 ~ 42 0.2<br />
~ ~KS 11~7~ 11:~ 11.2 7.6 10.1 ~ ~ 1~ 0.~ 1~ 21 18<br />
~14 ~KS 1~11~ 12:10 10.8 7.2 8.5 ~ 91 1~ 0.~ ~.~1 142 24 ~ 5. ~ ~ 0.2<br />
~ ~E~Y 01~ 8:~ 6.3 7.7 9.9 4~ ~ 47 1~ 19 19 2.9 115 ~ 0.2<br />
~1~ ~E~Y ~1~ 14:~ 11.3 6.9 11.3 ~ 42 ~ 0.~ 1~ 16 16 2.7 1~ ~ 0.3<br />
~1~ ~~Y ~1~ 7:45 14.9 7.7 8.7 ~ ~ ~ 0.10 1~ ~ ~ 2.6 1~ ~ 0.3<br />
~ ~E~Y ~4~ 8:~16.6 8.0 8.3 ~ ~ 41 0.11 1~ ~ ~ 2.5 1~ ~ 0.3<br />
~ ~E~Y ~12:~21.6 8.5 7.4 4~ ~ ~ 0.~ 1~ ~ 19 2.7 1~ ~ 0.2<br />
~ ~~Y ~ 7:~21.4 8.4 8.0 ~1 ~ ~ 111 18 16 2.9 101 ~ 0.2<br />
~ ~E~Y ~14:~24.8 7.4 9.6 315 ~ ~ 0.~ ~ 16 13 2.4 ~ ~ 0.2<br />
~ ~E~Y ~1~ 7:~ 19.7 6.8 ~ 21 18 0.~ ~ 14 11 2.1 ~ 16 ~.1 161<br />
~ ~E~Y ~ 8:~19.3 7.0 6.7 ~ ~ 19 ~ 16 13 2.3 ~ 16 0.2<br />
~ ~E~Y 1~ 6:~ 15.6 9.7 8.3 317 ~ ~ 0.~ 1~ 17 14 2.3 1~ ~ 0.2<br />
~ ~E~Y 11/1~ 11:45 13.9 8.0 9.6 ~ ~ ~ 0.~ ~ 15 12 2. ~ 19 0.1<br />
~ ~E~Y 1~11~ 9:~ 8.8 9.0 9.2 ~ ~ ~ 0.~ ~ 16 13 2.2 ~ ~ 0.1 161<br />
~ ~DIH1 01~ 12:15 8.6 7.1 10.1 ~ 31 42 1~ 21 12 2.7 ~ ~ 0.1<br />
~1~ ~DIH1 ~ 8:15 11.7 7.2 6.2 1~ 114 ~ 4~ 1~ ~ 4.2 ~ ~ 0.4<br />
~1~ ~I81 ~12:10~.4 6.9 5.9 ~ ~ 21 ~ ~ 11 1.4 ~ ~ 0.2<br />
~16 ~DI81 ~ 9:~ ~.5 6.9 5.2 247 18 18 ~ 17 9 1.7 ~ 15 0.1<br />
~ ~DIN1 ~4~ 12:~ 24.8 2.1 ~ 24 24 0.17 ~ ~ 11 1.9 ~ ~ 0.2<br />
~ ~DI81 ~ 13:~ 24.4 7.8 5.4 242 18 15 0.11 ~ 18 9 1.7 ~ 16 0.1<br />
~ ~DIHI 1~11:~18.0 7.1 4.1 ~ ~ ~ 0.24 1~ ~ 15 2.7 ~ ~ 0.2<br />
~10 ~DI~ 01~11:~ 7.2 6.2 6.0 ~ ~ ~ 0.~ 1~ ~ 18 2.6 ~ ~ 0.4<br />
~1~ ~DI~ ~ 7:~ 9.3 7.0 9.5 4~ ~ ~ 0.18 1~ ~ 18 2.4 ~ ~ 0.3<br />
Hote: "
N[liERAL DATA REPORT<br />
~ pH DO EC Na C! Br Se Asbest Hard. Ca Ng K ~ $04 B TDS<br />
900191<br />
900317<br />
900377<br />
BOULDIN2<br />
BOULDIN2<br />
BOttDIH2<br />
04/28/90 12:40 18.3<br />
06/28/90 9:15 20.9<br />
07/24/90 13:03 24.5<br />
6.2<br />
6.8<br />
4.3<br />
5.8<br />
1.8<br />
257<br />
266<br />
309<br />
18 17<br />
25 21<br />
26 25<br />
0.12<br />
0.16<br />
88 19 10 1.4 56 36<br />
95 20 II 2. 86 19<br />
105 22 12 1.9 78 33<br />
0.3<br />
0.2<br />
0.3<br />
206<br />
200<br />
237<br />
800487<br />
900761<br />
BOULDIH2<br />
BOLLDIH2<br />
08/20/90 13:54 26.0 8.7<br />
10/22/90 11:45 18.0 7.1<br />
5.8<br />
4.1<br />
178<br />
381<br />
13 9<br />
25 29<br />
0.05<br />
0.42<br />
62 13 7 1.5<br />
129 27 15 3.1<br />
58 11 4).1<br />
93 51 0.4<br />
126<br />
312<br />
900001<br />
900118<br />
BR~HAHi~Ol<br />
BA~I~PO1<br />
01/22/90 9:30 12.1 6.6<br />
02/19/90 14:20 11.5 7.9<br />
3.5<br />
7.6<br />
622<br />
878<br />
58 84<br />
70 95<br />
180<br />
284<br />
34 23 4.9<br />
53 37 2.3<br />
106<br />
107<br />
62<br />
133<br />
0.2<br />
0.3 608<br />
800190 BR~Hk]~Ol 04/23/90 15:30 19.8 7.3 7.3 429 33 46 122 24 15 2.1 78 56 0.2 280<br />
903286 BRkHH~HPPOI 06/26/90 11:30 24.0 7.1 5.2 317 27 26 97 19 12 2. 68 34 0.1 204<br />
900374<br />
800486<br />
~PPOI<br />
BR~PP01<br />
07/24/90 13:50 24.5 7.0<br />
08/33/90 13:00 23.8<br />
4.5<br />
4.0<br />
246<br />
300<br />
20 21<br />
25 29<br />
0.09<br />
0.13<br />
74<br />
90<br />
15<br />
18<br />
9 1.4<br />
11 1.7<br />
59 22 0.1<br />
65 29
I~NERAL DATA REPORT<br />
TE~ pH DO EC Ha CI Br Se A~be~t Hard. Ca NO K ALl( $04 B TDS><br />
gOO4~ CLIFTI~I 08/21/90 9:30 23.6 8.0 7.9 307 48 59 0.28 80 14 11 2.8 DO 19 ~).1 221<br />
9(~73 CLIFT~ 09/24/90 9:45 21.4 8.3 8.2 504 58 88 0.41 98 16 14 3.3 78 28 0.1 275 ¯<br />
900765 CI.IFTOI4 10/23/90 9:15 18,7 7,8 8,1 710 87 138 0,52 127 21 18 4,4 82 38 0.2 386<br />
900864 CLIFT~ 11/13/90 13:20 16,0 7,8 9,0 689 84 134 123 21 17 4,3 78 42 0,2 370<br />
900915 ~IH08 12/11/90 12:45 11,5 7,5 8,4 853 IDO 185 0,63 ~O,DOI 142 23 20 5,5 73 48 0,2 451<br />
900692 COI~COSPPI 10/01/90 10:10 18,6 7,3 7,8 636 78 128 0,52 108 17 16<br />
900055 l~1481~ 01/24/90 10:15 8,6 7,9 9,8 474 55 89 ~O.DO1 87 15 12 3,4 57 24 ~0.1 266<br />
900237 l~81~O 04/25/90 6:50 17,5 8,2 8.8 367 42 82 76 14 10 2,5 59 16 ~0,1 201<br />
900423 I~81~D 07/26/90 8:10 24,1 7.9 7,2 396 48 68 0,24 80 14 11 2,6 59 19 0,1 212<br />
900535 I~D 06/22/90 8:3023,4 7,8 8,1 279 28 39 0,16 70 13 9 2, 60 14 ~0,1 158<br />
900782 ~08~O~D 10/24/90 9:25 18,0 7.8 8.4 700 98 147 0,53 119 19 17 4.5 75 33 0.1 372<br />
9(II)52 DEI.TA~I~iA~ 01/24/90 10:55 8,9 7,5 207 14 10 68 14 8 2, 70 14 ~0,1 131<br />
900233 D~TAI~CHAI4 04/25/90 10:28 18.3 6,1 8,8 136 8 5 52 11 6 1,4 53 5 ~0,1 85<br />
900417 I~LTA~DI~4 07/26/90 11:20 24.0 7,6 6,5 133 8 6 0,02 48 10 5 1, 49 6 ~0,1 79<br />
900529 ~LTA~J~ 08/22/90 12:30 24.4 7.6 9.3 178 13 7 0,03 60 11 8 1,2 69 9 ~0,1 109<br />
900811 OELTA~4 10/24/90 12:05 19,6 7,6 8,3 162 11 8 0,01 58 11 7 1,5 57 8 ~0.1 98 ¯<br />
900038 0t~ 01/24/90 9:53 8,5 7,6 9,7 787 95 127 0,43 O.DO1 158 32 19 4.5 87 58 0,4 458<br />
900081 [~ 02/07/90 11:18 10,7 7,5 11,5 953 116 140 0,003<br />
900082 lilac 02/07/90 11:18 10.7 7,5 11,5 954 118 140 0.003<br />
900088 ~ 02/14/90 lO:lO 8,7 7,8 12,4 421 45 68 ~O,DOI 98 18 13 2,9 68 28
1<br />
I<br />
I<br />
900876<br />
900910<br />
900334<br />
900351<br />
900421<br />
900444<br />
~<br />
0!4C<br />
FkLSETIP"NE98<br />
FkLSETIP-NEB8<br />
FALSETIP--~EB8<br />
FkLSETIP’-NE58<br />
11/27/90 12:00 10.9 7.8 10.7<br />
12/11/90 13:15 11.0 7.5 8.5<br />
07/10/90 7:35 22.3 8.1 7.6<br />
07/16/90 8:25 22.9 8.3 7.4<br />
07/26/90 7:46 22.6 8.2 7.8<br />
07/31/90 8:05 22.2 7.5 7.8<br />
850<br />
782<br />
610<br />
449<br />
849<br />
415<br />
99 139<br />
94 160<br />
76 122<br />
54 83<br />
117 200<br />
49 76<br />
0.44<br />
0.55<br />
0.45<br />
0.32<br />
0.86<br />
0.29<br />
I~NERAL ~TA REPORT<br />
TEI~ pH DO EC Na ii ~ Br S~ ks.t Hard. Ca MO K ~I.__SI~4 B<br />
LABt STA. ~ S/~.DATE T]NE oC ~ u~. TDS><br />
< I<br />
900627 GRANTOLD 09/11/90 11:10 22.8 7.5 8.7 307 43 61 0.26 90 16 12<br />
900654 GRANTOLD 09/17/90 11:35 22.6 7.8 7.4 422 45 64 0.28 94 18 12 I<br />
900668 GRkHTOLD 0G/25/90 12:15 22.1 7.6 7.2 447 50 73 0.33 96 17 13<br />
900690 6RkI, ITOLD 10/132/90 11:35 22.9 7.5 6.6 595 85 91 0.38 134 27 16<br />
900715 GIL~I"OL9 10/09/90 11:20 19.5 7.9 7.7 831 73 107 0.39 130 24 17 I<br />
900735 6R.,~TOLD 10/15/90 11:20 18.8 8.1 11.8 761 80 129 0.45 160 31 20<br />
996732 GRkKrOLD 10/24/90 11:30 18.4 7.6 8.0 703 88 138 0.49 126 21 18 4.7 82 38 0.2 373<br />
900834 I~I’OLD 10/31/90 12:35 18.1 7.7 9.0 817 94 142 0.53 167 32 21<br />
900848 GRANTOI.D 11/14A20 11:50 13.5 7.9 715 86 132 0.44 134 24 18 ¯<br />
900892 6RAHTOLD 11/’28/90 12:00 10.2 7.9 9.9 829 91 129 0.43 182 38 21<br />
900940 6RAHTOLD 17_/12/90 12:05 9.4 7.4 8.2 781 91 100 0.55 133 22 19<br />
900053 (~EEHES 01/24/90 11:25 10.5 7.1 175 10 7 0.03
I<br />
I~NERAL DATA REPORT<br />
TD~ pH & EC Ha s4~L BF S~ Asbest Hard. Ca Ng K ALK S04 B TDS<br />
I LABt STA. ~ SAI~.DATE TINE oC uS/c~ zg/L ~g/L ~ I~/L < ng/L ><br />
900746 I 900047<br />
8052~<br />
900412<br />
800524<br />
900806<br />
900013<br />
900017<br />
900113<br />
HOLLAND03<br />
HOHI~ER<br />
HOHKER<br />
HQHKER<br />
HOHKER<br />
HOHKER<br />
KIHGISPP01<br />
KIHGISPPO1<br />
KIHGISi~O1<br />
10/22/90 10:15 16.0 7.2 6.6<br />
01/24/90 6:50 7.2 7.1<br />
04/25/90 7:45 17.2 6.2 9.2<br />
07/26/90 7:35 23.5 7.7 6.8<br />
08/22/90 8:05 23.3 7.6 9.0<br />
10/24/90 8:15 17.6 7.8 8.6<br />
01/22/90 10:00 9.9 7.3 2.9<br />
01/22/90 10:00 9.9 7.3 2.9<br />
02/19/90 10:05 9.5 7.2 4.3<br />
888<br />
197<br />
161<br />
190<br />
213<br />
239<br />
409<br />
430<br />
460<br />
96 178<br />
13 15<br />
10 9<br />
13 15<br />
14 15<br />
18 20<br />
26 17<br />
26 18<br />
27 19<br />
0.85<br />
0.98<br />
0.05<br />
0.06<br />
N[HERkL DATk REPORT<br />
TE~ pH DO EC Ha C1 Br Se Asbest Hard. Ca Ng K kLK $04 B TDS<br />
LABt~ STA. likNE S~4~.DATE TII( oC zo/L uS/c~ zo/L mo/L zg/I. mg/L I~/L < ~<br />
><br />
900162 NkLLXROIS 03/21/90 10:05 17.0 7.5 8.8 10400 1850 3200 12.00 1130 81 226 68. 83 444 0.9 6000<br />
900208 )4~.Lh~IS 04/24,/90 12:05 17.8 7.8 9.0 7340 12002250 8.10 804 60 158 48. 78 309 0.6 4160<br />
9(~0270 I~LLkRDIS 05/22/90 10:40 18.8 8.0 8.5 8340 1420 2540 902 68 179 54. 78 368 0.7 4770<br />
900282 I~I.LARDIS 06/26/90 9:50 22.4 7.9 8.3 7700 1360 2370 7.90 830 62 164 62. 77 334 0.6 4450<br />
900329 )P, LL.kRDIS 07/09/90 12:15 22.0 8.0 8.0 5740 950 1700 6.70 636 52 123<br />
900345 NALI.~.RDIS 07/16/90 9:06 23.0 6.7 8.4 12.20 1010 72 202<br />
900392 I~LLhO, DIS 07/25/90 12:00 24.5 7.6 9.4 6~0 1110 1980 7.40 719 54 142 44. 75 288 0.6 3740<br />
900439 I~LI.hO, DIS 07/30/90 9:30 22.2 7.5 8.5 9060 1630 2840 10.60 983 72 195<br />
900458 N~LLARDIS 08/06/90 8:00 21.0 8.0 8.2 7570 1360 2340 8.50 840 61 107<br />
900547 lk~LI.XRDIS 08/13/90 8:00 22.5 8.1 7.0 7410 1320 2270 9.50 798 58 158<br />
900504 14~Li.h~IS 08/21/90 9:14 22.1 7.6 7000 11302130 7.70 749 56 148 40. 71 305 0.6 3880<br />
900571 I~..I.hqOIS 08/27/90 8:42 21.6 8.2 7500 1270 2310 9.40 750 50 148<br />
9005~3 NkLI.~,OlS 09/04/90 9:50 22.0 8.3 5760 961 1700 6.70 586 45 115<br />
900613 NkLLkRDIS 09/10/90 8:30 21.5 7.9 8.2 11600 2080 3660 17.30 1260 88 253<br />
900633 NALLh~DIS 09/18/90 9:35 21.1 7.3 7.9 6260 1030 1870 8.00 660 50 150<br />
900676 I~LI.h~IS 00/24/90 8:30 21.0 8.1 8.4 13600 2400 4340 18.80 1420 99 286 20. 83 584 1.1 80~<br />
900696 Ik~LLh~IS 10/01/90 9:00 20.1 7.6 8.3 9710 1636 3010 12.00 1026 75 204<br />
900721 NALL~DIS 10/10/90 8:10 19.5 7.9 6.9 15300 2740 5060 14.70 1626 110 328<br />
900737 I~I.LARDIS 10/16/90 7:30 19.8 7.9 7.8 11200 1970 3540 11.90 1190 88 236<br />
900770 I~LLARDIS 10/23/90 7:45 17.4 9.5 8.9 15400 2740 5070 17.80 1654 122 328 104. 87 658 1.3 9350<br />
800820 I~LI.~RDIS 10/30/90 IO:DO 18.1 7.9 9.2 14200 2520 4580 16.30 1660 104 340<br />
900855 NALI.h~IS 11/13/90 13:45 16.8 7.6 9.7 15500 2790 5080 18.80 1720 115 348 120. 64 692 1.3 9230<br />
900878 I~LI.XRDIS 11/27/90 9:45 12.4 7.5 9.7 16400 2850 5150 19.80 1765 117 358<br />
900924 N~J.LhO, DIS 12/11/80 10:40 11.1 8.3 9.1 17805 3310 5880 20.90 2020 138 408 134. 88 800 1.5 101~0<br />
900020 1~7.E 01/23/90 ll:OO 9.1 8.1 9.6 1520 195 209 0.68 0.006 329 68 38 5.4 161 280 1.2 928<br />
900078 1~7.E 02/07,/90 9:23 10.3 7.9 9.6 1480 198 205 O.DO8<br />
900084 Ik~.E 02/14/90 8:10 7.5 7.3 11.6 1470 191 206 0.007 328 72 38 4.4 138 272 1.2 913<br />
9~095 1~7.E 02/21,/90 7:57 8.6 7.6 11.4 1270 161 168 0.55 0.006 269 68 29 6.4 126 228 1.1 787<br />
900147 N~Z.E 03/07/90 9:30 13.8 7.9 8.1 1380 171 137 0.007<br />
900151 I~.ZE ~ 9:00 17.3 6.7 7.4 1470 187 215 0.65 0.006 330 78 36 4.8 154 251 1. 909<br />
900178 I~.E 04,/04,/90 11:00 19.0 7.4 1220 148 174 0.004<br />
900205 I~ZE 04/24/90 13:25 19.4 8.0 8.4 1290 166 187 0.61 0.003 271 54 33 4.6 157 201 1. 781<br />
900258 N~.E 05/23/90 11:45 19.4 8.3 8.3 1330 158 199 0.58 0.004 306 65 35 4.6 157 191 0.8 805<br />
900300 Nk.ZE 06/27/90 8:10 21.3 8.1 5.8 1390 133 199 0.70 0.003 337 68 40 4.8 163 209 1. 857<br />
900~9 Ik~ZE 07/25/90 14:05 26.0 9.3 1190 141 171 0.83 0.003 283 58 33 4.6 155 162 0.8 724<br />
900501 N~ZE 08/21/90 11:00 23.0 8.5 6.9 1060 126 150 0.60 0.002 258 54 30 4.4 145 141 0.6 634<br />
900640 NkZE 09/25/90 10:45 21.7 6.9 7.0 1030 119 151 0.61 0.002 242 51 28 3.8 149 132 0.6 608<br />
900762 NAZE 10/23/80 7:10 15.9 7.8 7.6 1000 118 150 0.58 0.001 215 45 25 3.8 143 112 0.4 585<br />
900859 )IkZE 11/13/90 8:50 13.0 7.8 8.8 1070 122 160 0.52 O.DO2 231 48 27 3.9 140 141 0.6 621<br />
900912 NAZE 12/11/90 9:00 10.5 7.6 7.7 1160 133 174 0.55 0.002 253 52 30 4.5 134 168 0.6 681<br />
900042 NIDOLER 01/24/90 11:40 9.1 7.4 10.2 460 53 82 0.30
NIHERAL DATA REPORT<br />
TE)~ pH DO EC Ha C] Br Se Asbest Hard. Ca NO K kLK 504 B TOS<br />
LkBt STA. HANE SA~.DATE TINE oC zg/L uS/a~ mg/L zg/L ~ z@q. NF/1. < ,,, ~ag/L ><br />
900223 NIDDLER 04/25/90 ]0:45 ]8.6 7.3 8.5 37] 42 63 0.22 76 ]4 ]0 2.5 60 ]9
NII~ERAL DATA REPORT<br />
LABI, STA. NA~ SAI~.BATE TIME o~ m~L . < ><br />
900018 NATOMk, S 01/"23/90 7:00 7.2 7.5 8.8 838 49 215 47 0.2 373<br />
900139 NATOMAS 132/27/90 7:]5 12.9 8.] 8.8 784 98 59 258 44 36 3.1 280 52 0.2 455<br />
90015"/ NATOMAS 03/’21/90 13:20 22.0 8.3 8.2 877 75 74 0.18 308 54 42 2.2 314 55 0.2 514<br />
900201 NATOMAS 04/24/90 7:10 18.5 7.8 281 20 14 92 17 12 2.8 107 12 0.2 182<br />
900287 BATOt~S 05/22/90 7:07 19.2 7.9 9.7 439 27 33 152 30 21 2.1 138 35
1<br />
NINB~AJ. ~TA RER]RT<br />
TEl4 ~ ~ ~ [C Na C! Br ~ k~l~t~rd. ~ ~ K ~ ~ B ~<br />
LAB# STA. NANE SA~.BATE TI~ o~ uS/cl mmgA. lg/L mg/L mg/I. I~/I. < mg/l., ,><br />
900602 NVIOf008 08/08/90 10:4523.2 7.7 6.7 294 28 3~ 0.16 72 14 9<br />
~<br />
g00649<br />
~ICt~O0<br />
NVICNO(X)<br />
09/11/90 lO:OO 23.3 7.4<br />
09/1720 10:26 22.9 7.8<br />
8.5<br />
7.5<br />
316<br />
404<br />
32 40<br />
44 63<br />
0.18<br />
0.30<br />
78<br />
90<br />
15<br />
16<br />
10<br />
12<br />
900663<br />
~<br />
NVICNO08<br />
~I~<br />
09/25/90 11:2822.1 7.8<br />
1~ 10:35 22.1 7.6<br />
6.8<br />
7.3<br />
359<br />
534<br />
36 48<br />
64 97<br />
0.28<br />
0.38<br />
85 16<br />
150 17<br />
11<br />
14<br />
900710<br />
900730<br />
g00757<br />
NVICNO00<br />
HVICt~OD<br />
NVICNO00<br />
10/09/90 10:10 18.6 7.9 8.0<br />
10/15/90 10:25 19.0 7.9 11.6<br />
10/2420 10:20 18.4 7.5 7.9<br />
716<br />
706<br />
715<br />
90 145<br />
80 142<br />
89 147<br />
0.53<br />
0.53<br />
0.51<br />
122<br />
124<br />
129<br />
19<br />
20<br />
22<br />
18<br />
18<br />
18 4.5 79 40 0.2 384<br />
g00829 NVICt~OO 10/3120 11:35 18.3 7.5 8.6 746 95 151 0.55 129 22 18<br />
900843 NVICNO00 11/1420 11:00 13.6 7.9 755 96 159 0.52 124 20 18<br />
900887 NVICNO00 11/28/90 11:10 10.6 7.9 9.8 743 93 148 0.51 129 22 18<br />
900935<br />
900342<br />
900362<br />
NVIOlO00<br />
OL~-D!4C-CLIFT<br />
OLOR-O4C-CI.IFT<br />
12/12/90 11:15 9.6 7.4<br />
07/10/90 9:15 24.7 7.9<br />
07/17/90 10:40 28.1 7.8<br />
8.0<br />
6.8<br />
6.4<br />
624<br />
366<br />
571<br />
71 109<br />
39 53<br />
52 83<br />
0.35<br />
0.20<br />
0.32<br />
126<br />
88<br />
136<br />
24<br />
17<br />
28<br />
16<br />
11<br />
16<br />
900432 OLDR-O4C-CLIFT 07/26/90 10:40 24.1 7.9 7.2 411 43 70 0.30 87 15 12 2.6 63 20
Note: "
1<br />
NIHERAI. D~TA REPORT<br />
TEI~ pH DO EC lla C] Br Se Asbest Hard. Ca Ng K ALK $04 B TDS<br />
I L~# STA. HANE S~P.D~TE TINE oC ~ uS/cz ~L ~ ~/L ~ !lr/L < ~yL.<br />
I ~ RIHDGEPPO1 08/20/90 8:20 21.5 6.4 3.1 728 78 122 0.53 183 42 19 2.7 118 47 0.2 491<br />
900754 RINDGEPPOI 10/22/90 7:00 14.4 6.9 2.5 688 72 108 0.56 174 40 18 2.8 170 10 0.2 415<br />
9~0012 RINDGEPP02 01/22/90 8:45 7.8 6.7 2.7 797 108 133 98 0.3 515<br />
900111 RINDGEPP02 02/19/00 8:45 7.8 6.5 6.4 1340 107 220 434 98 46 2.2 124 214 0.3 845<br />
I 900193 RIHDGEPP02 04/23/90 8:15 16.6 6.4 6.1 711 56 80 221 54 21 1.5 48 162 0.3 482<br />
9(i~376 RINDGEPP02 07/24/90 8:2022.1 2.1 514 44 07 0.33 151 34 16 1.7 88 56 0.2 352<br />
m 900753<br />
903489 RINDOEPP02 08/20/90 9:15 22.1 6.2 3.1 485 44 57 0.28 154 35 16 1.9 81 65 0.2 341<br />
9(XX)54<br />
RIHDGEPP02<br />
ROCKSL<br />
10/22/90<br />
01/24/90<br />
8:00 14.9 7.1 3.3<br />
8:50 8.3 7.8 10.5<br />
890<br />
962<br />
60 104<br />
222<br />
1.70<br />
0.68
MINERid. DATA REPOT<br />
~81 ~D 1~4~ 9:~ 17.9 7.8 8.4 912 121 210 0.78 1~ 19 21 5.8 ~ ~ 0.2 474<br />
Hote: "
NINERAL DATA REPORT<br />
TE~ pH DO EC N~ C! Br Se Asbest Hard. Ca MO K ALK S04 B TDS<br />
LABtl STA. KAJ~E SAI~.DATE T~ME oC uS/a~ ~ mg/L ~1. ~ ~f/L < ~ ........ ><br />
9005.59 SAIfl’AFEBkCON 08/13/90 9:00 22.0 7.5 8.7 477 58 94 0.33 82 1~ 12<br />
900539 SAHTkFEBACOH 08,r22/90 10:35 25.2 8.3 8.2 307 30 47 0.19 70 1:3 9 2. 59 15
~ota: "
I<br />
NIHERkL DATA REPORT<br />
TEI~ pH DO EC He C1 Br Se Asbest Hard. Ca 149 K kLK $04 B TI)S<br />
I LAB# STA. NkME SA~.DkTE TIME oC lg/L uS/me ~ lg/L lg/L ~/L ~/L < ~VL -><br />
9QQ650 STATIOH09 09/]7/80 ]0:45 22.9 7.8 7.4 474 55 84 0.39 94 ]6<br />
900664<br />
900686<br />
STATIOHO9<br />
STATIOH09<br />
09/25/90 11:30 22.4 7.8<br />
10/02/90 10:50 22.6 7.6<br />
7.0<br />
7.3<br />
510<br />
533<br />
60 93<br />
64 97<br />
0.35<br />
0.39<br />
98<br />
lO0<br />
16<br />
17 14<br />
900711 STATIOH09 10/09/90 10:25 19.1 7.7 7.8 677 85 132 0.52 118 19 17<br />
900731 STATIOH09 10/15/90 10:35 19.0 8.0 11.4 726 94 150 0.54 124 20 18<br />
900788 STATIOH09 10/24/90 10:40 18.0 7.6 8.0 800 105 173 0.61 130 21 19 5.1 80 38 0.2 425<br />
900830<br />
900844 I 900880<br />
900936<br />
STATIOII09<br />
STATIOH09<br />
STATIOH09<br />
STATIOH09<br />
10/31/90 11:50 18.3 7.6<br />
]1/]4/90 11:10 13.5 7.9<br />
11/28/90 11:20 10.6 7.8<br />
12/12/90 11:25 9.4 7.4<br />
8.7<br />
9.6<br />
8.2<br />
773<br />
771<br />
846<br />
910<br />
99 160<br />
101 ]62<br />
109 18]<br />
118 202<br />
0.55<br />
0.53<br />
0.65<br />
0.72<br />
130<br />
124<br />
134<br />
142<br />
21 19<br />
20 18<br />
21 20<br />
22 21<br />
900045<br />
90~14<br />
TUP~ERCUT<br />
TURNERCUT<br />
01/24/90 12:52 9.4 7.4<br />
01/24/90 12:52 9.4 7.4<br />
9.8<br />
9.8<br />
367<br />
363<br />
36 56<br />
35 55<br />
Note: "
<strong>State</strong> <strong>of</strong> <strong>California</strong>--The Resources Agency<br />
Department <strong>of</strong> Water Resources<br />
P. O. Box 942836<br />
Sacramento, <strong>California</strong> 94236-0001<br />
C--030734<br />
C-030734