- Page 2 and 3:
U.S. International Trade Commission
- Page 4 and 5:
UNITED STATES INTERNATIONAL TRADE C
- Page 6 and 7:
This report was principally prepare
- Page 8 and 9:
imports from the region. U.S. expor
- Page 10 and 11:
- the Southern African Development
- Page 12 and 13:
vi Figure ES-1 SSA sector profiles
- Page 14 and 15:
purchased Fine Chemicals Corp. faci
- Page 16 and 17:
exploration drilling. U.S. exports
- Page 18 and 19:
egional stability stemming from neg
- Page 21 and 22:
TABLE OF CONTENTS Page Executive Su
- Page 23 and 24:
TABLE OF CONTENTS—Continued Page
- Page 25 and 26:
TABLE OF CONTENTS—Continued Page
- Page 27 and 28:
TABLE OF CONTENTS—Continued Page
- Page 29:
TABLE OF CONTENTS—Continued Page
- Page 32 and 33:
List of Abbreviations and Acronyms-
- Page 34 and 35:
Approach S expanded information on
- Page 36 and 37:
Cape Verde Senegal The Gambia Guine
- Page 39 and 40:
CHAPTER 1 U.S. Trade and Investment
- Page 41 and 42:
The increase in total U.S. exports
- Page 43 and 44:
In absolute terms, U.S. merchandise
- Page 45 and 46:
Table 1-1 Sub-Saharan Africa: U.S.
- Page 47 and 48:
1-9 Table 1-2—Continued Sub-Sahar
- Page 49 and 50:
In absolute terms, significant incr
- Page 51 and 52:
1-13 Table 1-3—Continued Sub-Saha
- Page 53 and 54:
Figure 1-9 U.S. cross-border trade
- Page 55 and 56:
Box 1-1 Services Trade in Sub-Sahar
- Page 57 and 58:
Table 1-5 Total Africa and South Af
- Page 59 and 60:
Table 1-6 Global investment flows t
- Page 61 and 62:
since 2000. 35 African companies, m
- Page 63 and 64:
Table 1-9 Bilateral investment trea
- Page 65:
Because the lack of available infor
- Page 68 and 69:
through September 30, 2015, and the
- Page 70 and 71:
U.S. Imports under AGOA the Secreta
- Page 72 and 73:
2-6 Table 2-2—Continued U.S. impo
- Page 74 and 75:
AGOA-Related Investment accounted f
- Page 76 and 77:
2-10 Table 2-4—Continued Leading
- Page 78 and 79:
Table 2-5 Selected examples of rece
- Page 80 and 81:
Table 2-5—Continued Selected exam
- Page 82 and 83:
Table 2-5—Continued Selected exam
- Page 84 and 85:
African Union Commission that was d
- Page 87 and 88:
Status and Structure: ECOWAS was es
- Page 89 and 90:
Status and Structure: Union Economi
- Page 91 and 92:
Status and Structure: Common Market
- Page 93 and 94:
Status and Structure: Southern Afri
- Page 95 and 96:
Status and Structure: Southern Afri
- Page 97 and 98:
Status and Structure: East African
- Page 99 and 100:
Status and Structure: Intergovernme
- Page 101 and 102:
Status and Structure: 800 600 400 2
- Page 103 and 104:
Communauté Economique et Monétair
- Page 105:
TRADE-Continued ENDNOTES 1 African
- Page 108 and 109:
Table 4-1 Summary of general develo
- Page 110 and 111:
environment, and strengthening soci
- Page 112 and 113:
Table 4-4 World Bank projects appro
- Page 114 and 115:
Table 4-4—Continued World Bank pr
- Page 116 and 117:
Table 4-6 MIGA guarantees issued in
- Page 118 and 119: infrastructure funds, and developme
- Page 120 and 121: lending facility (formerly known as
- Page 122 and 123: provided $300 million for NEPAD inf
- Page 124 and 125: Table 4-8 U.S. support for building
- Page 126 and 127: 4-20 Figure 4-1 U.S. trade capacity
- Page 128 and 129: Table 4-10-Continued Examples of tr
- Page 130 and 131: Table 4-10-Continued Examples of tr
- Page 132 and 133: Table 4-10-Continued Examples of tr
- Page 134 and 135: Table 4-10-Continued Examples of tr
- Page 136 and 137: Box 4-1 USAID and Trade Capacity-Bu
- Page 138 and 139: Table 4-11 Sub-Saharan Africa: Expo
- Page 140 and 141: Table 4-12-Continued U.S. Trade and
- Page 142 and 143: In FY 2003, USAID obligations for S
- Page 144 and 145: USAID is a partner in the $15-billi
- Page 147 and 148: agriculture, fisheries, and forest
- Page 149 and 150: AGRICULTURE, FISHERIES, AND FOREST
- Page 151 and 152: AGRICULTURE, FISHERIES, AND FOREST
- Page 153 and 154: AGRICULTURE, FISHERIES, AND FOREST
- Page 155 and 156: SSA sector production, by country,
- Page 157 and 158: TRADE-Continued South Africa 58% So
- Page 159 and 160: South Africa U.S. sector SSA FDI po
- Page 161 and 162: PETROLEUM AND ENERGY-RELATED PRODUC
- Page 163 and 164: PETROLEUM AND ENERGY-RELATED PRODUC
- Page 165 and 166: PETROLEUM AND ENERGY-RELATED PRODUC
- Page 167: 1 MINERALS AND METALS SSA sector pr
- Page 171 and 172: TRADE-Continued South Africa 39% U.
- Page 173 and 174: U.S. sector SSA FDI position, by co
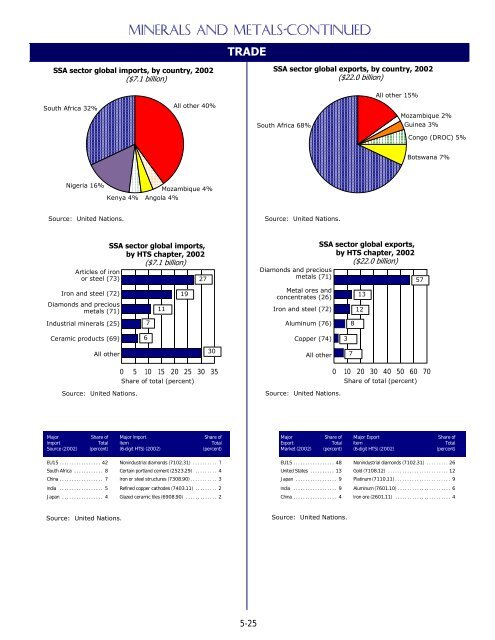
- Page 175 and 176: MINERALS AND METALS-CONTINUED 35 Me
- Page 177 and 178: 1 TEXTILES AND APPAREL S SSA accoun
- Page 179 and 180: SSA sector global imports, by count
- Page 181 and 182: TRADE-Continued South Africa 21% Gh
- Page 183 and 184: TEXTILES AND APPAREL-CONTINUED 1 Th
- Page 185 and 186: CERTAIN TRANSPORTATION EQUIPMENT 1
- Page 187 and 188: South Africa 61% Certain Transporta
- Page 189 and 190: TRADE-Continued South Africa 67% Ce
- Page 191: Certain Transportation Equipment-co
- Page 194 and 195: EAC regional framework, Uganda is s
- Page 196 and 197: Figure 6-1 Gross national income pe
- Page 198 and 199: Table 6-2 Tariffs in sub-Saharan Af
- Page 200 and 201: Statistical data for the 48 countri
- Page 202 and 203: ANGOLA Main Trade Partners, percent
- Page 204 and 205: enin Main Trade Partners, percent o
- Page 206 and 207: otswana Main Trade Partners, percen
- Page 208 and 209: urkina faso Main Trade Partners, pe
- Page 210 and 211: urundi Main Trade Partners, percent
- Page 212 and 213: cameroon Main Trade Partners, perce
- Page 214 and 215: cape verde Main Trade Partners, per
- Page 216 and 217: central african republic Main Trade
- Page 218 and 219:
chad Main Trade Partners, percent o
- Page 220 and 221:
comoros Main Trade Partners, percen
- Page 222 and 223:
CÔTE D’IVOIRE Main Trade Partner
- Page 224 and 225:
democratic republic of THE CONGO Ma
- Page 226 and 227:
djibouti Main Trade Partners, perce
- Page 228 and 229:
equatorial guINEA Main Trade Partne
- Page 230 and 231:
eritrea Main Trade Partners, percen
- Page 232 and 233:
ethiopia Main Trade Partners, perce
- Page 234 and 235:
gabon Main Trade Partners, percent
- Page 236 and 237:
the gambia Main Trade Partners, per
- Page 238 and 239:
ghana Main Trade Partners, percent
- Page 240 and 241:
guinea Main Trade Partners, percent
- Page 242 and 243:
guinea-bissau Main Trade Partners,
- Page 244 and 245:
kenya Main Trade Partners, percent
- Page 246 and 247:
lesotho Main Trade Partners, percen
- Page 248 and 249:
liberia Main Trade Partners, percen
- Page 250 and 251:
madagascar Main Trade Partners, per
- Page 252 and 253:
malawi Main Trade Partners, percent
- Page 254 and 255:
mali Main Trade Partners, percent o
- Page 256 and 257:
mauritania Main Trade Partners, per
- Page 258 and 259:
mauritius Main Trade Partners, perc
- Page 260 and 261:
mozambique Main Trade Partners, per
- Page 262 and 263:
namibia Main Trade Partners, percen
- Page 264 and 265:
niger Main Trade Partners, percent
- Page 266 and 267:
nigeria Economic Update—Continued
- Page 268 and 269:
nigeria Net Foreign Direct Investme
- Page 270 and 271:
epublic of the congo Main Trade Par
- Page 272 and 273:
wanda Main Trade Partners, percent
- Page 274 and 275:
SÃO TOMÉ AND PRINCIPE Main Trade
- Page 276 and 277:
senegal Main Trade Partners, percen
- Page 278 and 279:
seychelles Main Trade Partners, per
- Page 280 and 281:
sierra Leone Main Trade Partners, p
- Page 282 and 283:
somalia Main Trade Partners, percen
- Page 284 and 285:
south africa 6-92 Economic Update
- Page 286 and 287:
south africa Net Foreign Direct Inv
- Page 288 and 289:
sudan Main Trade Partners, percent
- Page 290 and 291:
swaZILAND Main Trade Partners, perc
- Page 292 and 293:
tanzania Main Trade Partners, perce
- Page 294 and 295:
togo Main Trade Partners, percent o
- Page 296 and 297:
uganda Main Trade Partners, percent
- Page 298 and 299:
zambia Main Trade Partners, percent
- Page 300 and 301:
zimbabwe Main Trade Partners, perce
- Page 302 and 303:
Economist Intelligence Unit, “IMF
- Page 304 and 305:
Cameroon Economist Intelligence Uni
- Page 306 and 307:
Economist Intelligence Unit, “Eco
- Page 308 and 309:
Economist Intelligence Unit, “Reg
- Page 310 and 311:
Guinea Economist Intelligence Unit,
- Page 312 and 313:
Economist Intelligence Unit, “Gro
- Page 314 and 315:
“IMF weighs resumption of aid to
- Page 316 and 317:
“Mozambique-South Africa/Investme
- Page 318 and 319:
“Country Vows to Make Privatizati
- Page 320 and 321:
Economist Intelligence Unit, “US
- Page 322 and 323:
Somalia Economist Intelligence Unit
- Page 324 and 325:
John Fraser, “Country Takes Lion
- Page 326 and 327:
Abduel Kenge, “Tanzania Plans to
- Page 328 and 329:
Economist Intelligence Unit, “Spe
- Page 330 and 331:
“Weird economy is consuming itsel
- Page 332 and 333:
A-2
- Page 334 and 335:
A-4
- Page 336 and 337:
A-6
- Page 338 and 339:
B-2
- Page 340 and 341:
Table B-1—Continued U.S. exports,
- Page 342 and 343:
Table B-1—Continued U.S. exports,
- Page 344 and 345:
Table B-2-Continued Benin: U.S. exp
- Page 346 and 347:
Table B-2-Continued Burkina Faso: U
- Page 348 and 349:
Table B-2-Continued Cameroon: U.S.
- Page 350 and 351:
Table B-2-Continued Central African
- Page 352 and 353:
Table B-2-Continued Comoros: U.S. e
- Page 354 and 355:
Table B-2-Continued Democratic Repu
- Page 356 and 357:
Table B-2-Continued Equatorial Guin
- Page 358 and 359:
Table B-2-Continued Ethiopia: U.S.
- Page 360 and 361:
Table B-2-Continued The Gambia: U.S
- Page 362 and 363:
Table B-2-Continued Guinea: U.S. ex
- Page 364 and 365:
Table B-2-Continued Kenya: U.S. exp
- Page 366 and 367:
Table B-2-Continued Liberia: U.S. e
- Page 368 and 369:
Table B-2-Continued Malawi: U.S. ex
- Page 370 and 371:
Table B-2-Continued Mauritania: U.S
- Page 372 and 373:
Table B-2-Continued Mozambique: U.S
- Page 374 and 375:
Table B-2-Continued Niger: U.S. exp
- Page 376 and 377:
Table B-2-Continued Republic of the
- Page 378 and 379:
Table B-2-Continued São Tomé & Pr
- Page 380 and 381:
Table B-2-Continued Seychelles: U.S
- Page 382 and 383:
Table B-2-Continued Somalia: U.S. e
- Page 384 and 385:
Table B-2-Continued Sudan: U.S. exp
- Page 386 and 387:
Table B-2-Continued Tanzania: U.S.
- Page 388 and 389:
Table B-2-Continued Uganda: U.S. ex
- Page 390 and 391:
Table B-2-Continued Zimbabwe: U.S.
- Page 392 and 393:
Table B-3—Continued Côte d’Ivo
- Page 394 and 395:
Table B-3—Continued Gabon: Leadin
- Page 396 and 397:
Table B-3—Continued Kenya: Leadin
- Page 398 and 399:
Table B-3—Continued Nigeria: Lead
- Page 400 and 401:
Table B-3—Continued South Africa:
- Page 402 and 403:
Table B-4—Continued U.S. imports
- Page 404 and 405:
Table B-4—Continued U.S. imports