5 PhD Chapter4.pdf - DSpace@UM
5 PhD Chapter4.pdf - DSpace@UM
5 PhD Chapter4.pdf - DSpace@UM

Create successful ePaper yourself
Turn your PDF publications into a flip-book with our unique Google optimized e-Paper software.
CHAPTER 4<br />
DIGITAL LIBRARIES INITIATIVES: ANALYSIS OF READINESS<br />
4.1 Introduction<br />
As had been specified in Chapter 3, the research had adopted both methods of<br />
data gathering techniques i.e. quantitative (using the questionnaire) and qualitative<br />
(interview sessions). This chapter consists of data analysis, findings and discussions that<br />
had resulted from the quantitative method, specifically covering the readiness aspects,<br />
done in accordance with the research questions. While the qualitative data analysis from<br />
the interview sessions were elaborated in Chapter 5, specifically covering the aspect of<br />
perceived conditions of digital library future growth. Summaries of both chapters are<br />
found at the end of Chapter 5.<br />
A total of 354 libraries listed in the Directory of Libraries in Malaysia, 2002<br />
were randomly selected for the study. A total of 223 (63%) questionnaires out of 354<br />
sent were returned. It must be pointed out that the follow-up reminders and phone calls<br />
had contributed greatly to the high percentage of questionnaires sent being attended to<br />
and returned. The respondents who replied did so voluntarily, and this augurs well for<br />
the overall quality of the data supplied.<br />
4.2 Profile of Libraries<br />
4.2.1 Types of Libraries<br />
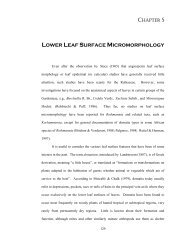
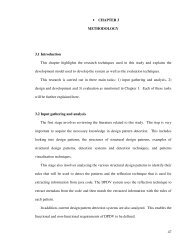
The libraries were divided into four types, namely, state libraries, public libraries,<br />
special libraries and academic libraries. Figure 4.1 shows that special libraries made up<br />
157
the largest number 52.5% (117) followed by academic libraries 40.3% (90), public<br />
libraries 4.5% (10) and state libraries 2.7% (6).<br />
Academic<br />
40.3%<br />
Public<br />
4.5%<br />
State<br />
2.7%<br />
Figure 4.1: Distribution of Libraries by Type<br />
4.2.2 Category of Libraries<br />
Special<br />
52.5%<br />
About 36.3% (81) of the libraries were perceived to be hybrid, while 55.2% (123) were<br />
considered print-based. Hybrid and print-based libraries together accounted for 91.5%<br />
(204) of the total sample, with the digital/virtual making up just 1.3% (3). A rather<br />
substantial 6.3% (14) of the respondents did not answer this question, and another 0.9%<br />
(2) considered none of the categories in the grouping scheme fits their libraries (Table<br />
4.1).<br />
158
Table 4.1: Distribution of Libraries by Category<br />
Category Number of Libraries Percent<br />
1. Digital 2 0.9<br />
2. Virtual 1 0.4<br />
3. Hybrid 81 36.3<br />
4. Print- based 123 55.2<br />
5. Not Applicable 2 0.9<br />
6. No Response 14 6.3<br />
Looking at the individual figures for digital, virtual and print-based libraries in the<br />
table, and what the term hybrid implies, it could be inferred that hybrid libraries was the<br />
new forthcoming library pattern in Malaysia. That was to say, Malaysian libraries could<br />
have been largely print-based in content, but some or parts of the operations and<br />
services could have been converted to digital and, hence the hybrid designation.<br />
(Note: The terms digital and virtual libraries were used concurrently because both terms<br />
are being used by Malaysian libraries).<br />
4.2.3 Age of Libraries<br />
The libraries were found to vary greatly in age from the latest set up, which was one-<br />
year old, to the earliest established 118 years ago (Table 4.2). Its mean age of 18.95<br />
years had a standard deviation of 16.78, or a coefficient of variation (C.V) of 88.5%,<br />
implying a wide variability in the age of individual libraries in the sample.<br />
159
Table 4.2: Statistics on Age of Libraries by Type<br />
Type Minimum Maximum Mean Std Deviation<br />
1. State 4.0 35.0 26.3 11.69<br />
2. Public 4.0 30.0 19.4 8.98<br />
3. Special 1.0 118 22.7 18.03<br />
4. Academic 1.0 75 13.3 14.25<br />
5. All libraries 1.0 118 18.95 16.78<br />
State and public libraries, with mean age of 26.3 and 19.4 years respectively, had<br />
relatively lower age variability as reflected by the C.V. values of less than 50%. Special<br />
libraries had a mean age of 22.7 with a C.V. of 79.4%. Academic libraries had the<br />
lowest mean age of 13.3 years, but with the highest C.V. of 107.1%. The large<br />
variability in the age of the libraries under study might not lead to a meaningful average<br />
age figure, but it could be useful later in explaining variation in certain aspects of the<br />
libraries that might be related to age.<br />
4.2.4 Heads of Libraries<br />
There were 205 heads of libraries reported in the questionnaire. They were made up of 1<br />
JUSA B officer, 7 grade 1 (S54/53) officers, 23 grade 2 (S48) officers and 59 grade 3<br />
(S41) officers, all with degree level qualifications. There were 20 personnel designated<br />
as heads of libraries with diploma level qualifications and 50 were reported to be heads<br />
of libraries although with salary scales of Malaysian Higher School Certificate (STPM)<br />
and lower qualifications. With one end of the spectrum of heads of libraries having<br />
Malaysian School Certificate (SPM) level salaries, and at the other end an officer with a<br />
160
salary scale equivalent to that of a director-general of a federal level government<br />
department, the conclusion had to be that this study was dealing with libraries that was<br />
vastly different with each other in many aspects.<br />
(Note: „S‟ refers to the designation of grade within the Social category of the<br />
government employment scheme, assigned by the Public Service Department. The<br />
number is the ranking system where the higher number denotes higher ranking).<br />
4.2.5 Provision of E-mail Addresses to Staff<br />
Only 94 libraries out of 223, or 42.2%, provided e-mail addresses to their staff. Table<br />
4.3 shows the statistics on the provision of e-mail addresses to staff by type of library<br />
and total sample. From the table, it appeared that state libraries performed better than<br />
other libraries in this aspect, with 50% (47) of their staff being provided with e-mail<br />
addresses, followed by academic libraries 48.9% (45) and special libraries 39.3% (36).<br />
Only 10% of the staff in public libraries had official e-mail addresses.<br />
Table 4.3: Libraries Providing E-mail Addresses to Staff by Type<br />
Type of Library Yes (%) No (%) No Response (%)<br />
1. State 50.0 50.0 0<br />
2. Public 10.0 80.0 10.0<br />
3. Special 39.3 59.0 1.7<br />
4. Academic 48.9 48.9 2.2<br />
5. All libraries 42.2 55.6 2.2<br />
n=94<br />
161
4.2.6 Other profiles<br />
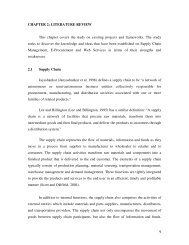
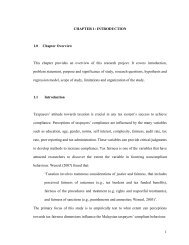
The data show that the heads of libraries had been working for an average of 10.5 years.<br />
By type, state libraries led with 23.4 years, followed by special libraries (11.09 years),<br />
public libraries (10.5 years) and academic libraries (8.8 years) (Figure 4.2).<br />
About 52% (116) of the libraries planned to be 100% digital by 2010.<br />
Years<br />
25<br />
20<br />
15<br />
10<br />
5<br />
0<br />
All<br />
library<br />
State<br />
library<br />
Special<br />
library<br />
Public<br />
library<br />
Academic<br />
library<br />
Figure 4.2: Working Experience of Heads of Libraries by Type of Library<br />
4.3 Analysis on General Problems<br />
The respondents were asked the problems their libraries were facing, if any, ranging<br />
from lack of professional staff to attitude of staff. A scale from 1 (not a problem) to 5<br />
(extremely problematic) was used to indicate the extent of problems prevailing.<br />
However, for simplicity and data analysis, the five measures of problem were collapsed<br />
into two, namely, not problematic and problematic. All responses with not a problem<br />
162
and slightly problematic were classified as not problematic; those with problematic,<br />
very problematic and extremely problematic responses were grouped together as<br />
problematic.<br />
The rationales of having five scales of problem measurement in the<br />
questionnaire, but only two for data analysis were as follows. A respondent‟s feeling or<br />
view on the shortcomings their libraries were facing could not easily be represented by a<br />
clear-cut yes or no. The wider range of measure or degree of problem provided him with<br />
avenues to state the best possible situation. In the end, the answer being probed in the<br />
study, and the most practical one, was whether the respective library faces any problem<br />
or not, regardless of whether the problems were under the category problematic, or very<br />
problematic, or extremely problematic. They were all shortcomings faced by the<br />
libraries. On the other hand, the term slightly problematic was a statement which in<br />
everyday usage, meant that a situation was generally alright. Yes, there was some<br />
problem, but it was manageable. In short it was to give options to the respondents and to<br />
help facilitate decision- making process.<br />
With the above explanation, the result of the survey on the perception of<br />
respondents on general problems faced (and not faced) by the libraries was summarized<br />
in Table 4.4. Based on a cut-off point of 50% (the research wanted only the highest<br />
categories of problems which could be considered of real significance affecting the<br />
libraries) either way, 11 of the 19 possible shortcomings of a library were not deemed to<br />
be problems, while 8 were considered problems.<br />
163
Table 4.4: Perceptions of Respondents on General Problems<br />
Shortcomings Not a Problem (%<br />
of total respondents)<br />
(f)<br />
Problematic (% of<br />
total respondents)<br />
(f)<br />
1. Lack of professional staff 53.4 (119) 45.7 (102)<br />
2. Lack of IT personnel 35.9 (80) 64.1 (143)<br />
3. Lack of supporting staff 51.6 (115) 48.4 (108)<br />
4. Lack of IT training 41.7 (93) 58.3 (130)<br />
5. Lack of leadership 60.1 (134) 39.9 (89)<br />
6. Lack management support 60.1 (134) 39.9 (89)<br />
7. Lack of suitable integrated library<br />
system<br />
46.6 (104) 53.4 (119)<br />
8. Lack of local vendor 61.4 (137) 38.6 (86)<br />
9. Lack of IT facility 50.2 (112) 49.8 (111)<br />
10. Lack of ICT infrastructure 51.6 (115) 48.4 (108)<br />
11. Lack of collaboration (among<br />
local librarians)<br />
12. Lack of demand on library<br />
services<br />
68.2 (152) 31.8 (71)<br />
69.5 (155) 30.5 (68)<br />
13. Lack of budget 37.2 (83) 62.8 (140)<br />
14. Lack of library space 47.1 (105) 52.9 (118)<br />
15. Lack of digital library initiatives<br />
(at all level)<br />
16. Under-utilization of digital<br />
resources<br />
17. Renewal subscription of online<br />
databases<br />
39.9 (89) 60.1 (134)<br />
42.6 (95) 57.4 (128)<br />
44.4 (99) 55.6 (124)<br />
18. Not up-to-date holdings 57.8 (129) 42.2 (94)<br />
19. Attitude problems 62.8 (140) 37.2 (83)<br />
n=223<br />
Table 4.5 presents the list of shortcomings deemed not a problem and those that were<br />
considered problematic. These shortcomings were arranged in descending order of<br />
percentage respondents both under the not a problem column and under the problematic<br />
164
column. That was, as we went down the not a problem column, the shortcomings<br />
become relatively more problematic; as we moved down the problematic column, the<br />
shortcomings become less problematic.<br />
Table 4.5: Shortcomings Considered Not Problematic and Problematic<br />
Not Problematic % of<br />
respondents<br />
1. Lack of demand for<br />
library services<br />
2. Lack of collaboration<br />
among local librarians<br />
(f)<br />
69.5<br />
(155)<br />
68.2<br />
(152)<br />
3. Attitude problem 62.8<br />
4. Lack of local vendor<br />
support<br />
5. Lack of leadership &<br />
lack of management<br />
support<br />
(140)<br />
61.4<br />
(137)<br />
60.1<br />
(134)<br />
7. Not up-to-date holding 57.8<br />
8. Lack of professional<br />
staff<br />
9. Lack of supporting staff<br />
& Lack of ICT<br />
infrastructure<br />
(129)<br />
53.4<br />
(119)<br />
51.6<br />
(115)<br />
10. Lack of IT facility 50.2<br />
n=223<br />
(112)<br />
Problematic % of<br />
respondents<br />
(f)<br />
1. Lack of IT personnel 64.1<br />
(143)<br />
2. Lack of budget 62.8<br />
3. Lack of digital library<br />
initiatives<br />
(140)<br />
60.1<br />
(134)<br />
4. Lack of ICT training 58.3<br />
5. Underutilization of<br />
digital resources<br />
6. Renewal subscription on<br />
online databases<br />
7. Lack of suitable<br />
integrated library system<br />
(130)<br />
57.4<br />
(128)<br />
55.6<br />
(124)<br />
53.4<br />
(119)<br />
8. Lack of library space 52.9<br />
(118)<br />
165
As could be seen, lack of IT personnel had been identified as being the most problematic<br />
to the libraries. This was followed by lack of budget, lack of digital library initiatives, lack<br />
of IT training, underutilization of digital resources, renewal subscription of online<br />
databases, lack of suitable integrated library system, and lack of library space. Among a<br />
library‟s possible shortcomings that the respondents thought of as not being problematic,<br />
lack of demand for library services tops the list, followed by lack of collaboration among<br />
local librarians, attitude problem, lack of local vendor support, lack of leadership, lack of<br />
management support, not up-to-date holding, lack of professional staff, lack of supporting<br />
staff, lack of ICT infrastructure, and lack of IT facility.<br />
In other words, the average library in Malaysia, at least as represented by the<br />
libraries in this study, did not lack users, collaboration between local librarians, local<br />
vendor support, leadership, management support, professional staff, supporting staff, ICT<br />
infrastructure and IT facilities; it did not face attitude problem and had sufficient up-to-<br />
date collections. However, the average library lacks IT personnel, funds, digital library<br />
initiatives, IT training, suitable integrated library system (s), and library space; it also<br />
faces problem of digital resource utilization and renewal subscription of online databases.<br />
4.4 Holdings/Collections<br />
A library might have many collection types but this study identified ten to be the most<br />
relevant for analysis. These were monographs (including books, theses, and annual<br />
reports), journals and periodicals, audio cassette tapes, video tapes, films, photographs,<br />
maps, posters, microfiche and CD-ROM, some of which were storage media rather than<br />
actual reference materials. Table 4.6 shows the statistics on these collections by types.<br />
166
As could be seen from the statistics in Table 4.6 there was a large variability among the<br />
libraries for each type of collection. For monograph, the size of collection ranges from<br />
10 units to 1 600 000 units, with a coefficient of variation (CV) of 353%. This was too<br />
large a variation which renders the mean figure meaningless. As such, subsequent<br />
discussion on the other collection types would only be on the range. (In fact, all the CVs<br />
for the other collection types were very large, ranging from 197% for video tapes to<br />
580% for CD-ROM).<br />
Table 4.6: Statistics on Library Collection by Type<br />
Type of collection No. of<br />
libraries<br />
1. Number of<br />
monographs<br />
(including books,<br />
theses, annual<br />
report, etc)<br />
2. Journals &<br />
periodicals<br />
3. Audio cassettes<br />
tapes<br />
4. Video tapes<br />
5. Films<br />
6. Photographs<br />
Minimum Maximum Mean Std.<br />
Deviation<br />
199 10 1 600 000 50 514 178 094.9<br />
165 2 48 000 1 655 4 908.3<br />
99 1 6 686 266 749.5<br />
118 1 5 026 371 734.0<br />
7 39 28 059 4 657 10 363.4<br />
34 3 1 600 000<br />
70<br />
478<br />
283 989.1<br />
7. Maps 46 1 3 000 173 586.1<br />
8. Posters 48 1 2 670 167 483.3<br />
9. Microfiche 16 4 120 000 11 002 29 725.5<br />
10. CD-ROM 129 2 50 000 768 4 454.9<br />
167
It was also surprising that only 199 libraries out of 223 had monographs. Could it be that<br />
those libraries outside the 199 had completely digitized their collections or had<br />
converted them into other storage medium? So were journals and periodicals, where<br />
only 165 libraries reported to have them. The size ranges from 2 units to 48 000 units.<br />
The next most common collection in terms of the number of libraries reporting was CD-<br />
ROM (129 libraries), ranging from 2 units to 50 000 units. This was followed by video<br />
tapes (118 libraries), ranging from 1 unit to 5 062 units; audio cassette tapes (99<br />
libraries), ranging from 1 unit to 6 686 units; posters (48 libraries), ranging from 1 unit<br />
to 2 670 units; maps (46 libraries), ranging from 1 unit to 3 000 units; photographs (34<br />
libraries), ranging from 3 units to 1 600 000 units. In terms of collections, monographs<br />
still dominated.<br />
4.5 Automation<br />
4.5.1 Installation of Integrated Library System<br />
Only 121 libraries (54%) of the 233 libraries reported to have installed integrated<br />
library systems. Out of these, more than half (52.9% or 64 libraries) had installed the<br />
systems between 1999 and 2004. The earliest installation was made in 1982 (one<br />
library). Between then and 1998, the progress of automation was rather slow, averaging<br />
about three libraries per year. Between 1999 and 2003, the pace of automation<br />
quickened to about 12 libraries per year. In 2004, that was at the time of survey, this<br />
progress in automation appeared to be coming to a grind as only two additional libraries<br />
reported to have installed an integrated library system.<br />
168
4.5.2 Integrated Library Systems<br />
Table 4.7 lists the various integrated library systems used and the number of<br />
libraries under each system. There were 15 different brand names with at least two<br />
libraries each. The system known as ILMU was the most common with 21 libraries;<br />
followed by VTLS (15 libraries), SISPUKOM (10 libraries), CDS/ISIS (9 libraries),<br />
TECHLIB (6 libraries), GEAC (5 libraries), Micro VTLS and WINNIS (4 libraries<br />
each), and HORIZON (3 libraries). Systems with two libraries each carry the following<br />
names: CLM, CLS, PUSTAKAWAN, Supermax, Winnebago, DOBIS, LIBRARY<br />
WORLD and DNIX. In addition, there were twenty other systems known by their<br />
designated names with one library each.<br />
Table 4.7: Integrated Systems Installed and Number of Libraries Adopting<br />
Name of Integrated<br />
System<br />
Number of<br />
libraries<br />
Name of Integrated<br />
System<br />
Number of<br />
libraries<br />
1. ILMU 21 (19%) 10. CLM 2 (1.7%)<br />
2. VTLS 15 (13%) 11. CLS 2 (1.7%)<br />
3. SISPUKOM 10 (9%) 12. PUSTAKAWAN 2 (1.7%)<br />
4. CDS/ISIS 9 (8%) 13. Supermax 2 (1.7%)<br />
5. TECHLIB 6 (5%) 14. Winnebago 2 (1.7%)<br />
6. GEAC 5 (4%) 15. DOBIS 2 (1.7%)<br />
7. Micro VTLS 4 (3.5%) 16. LIBRARY WORLD 2 (1.7%)<br />
8. WINISIS 4 (3.5%) 17. DNIX 2 (1.7%)<br />
9. HORIZON 3 (2.6%) 18. Others 20 (17.6%)<br />
n=113<br />
169
4.5.3 Services Offered and Operational<br />
Table 4.8 lists, in descending order the services offered by the libraries. With 45.7%:102<br />
libraries providing it, OPAC was the most widely available service, followed by online<br />
circulation (35.9%:80), Web OPAC (34.5%:78), Website services (26.0%:58), online<br />
reservation (25.6%:57), online registration (20.2%:45), online reference enquiry and<br />
hypermedia/multimedia (19.7% each:44), online acquisition (15.2% :34), online SDI<br />
(selective dissemination of information) service (12.6%:28), self-check machine<br />
(9.9%:22), mobile internet services (8.1%:18), online inter-library loan (7.2%:16), and<br />
several services categorized as “others” such as digital multimedia, electronic forum,<br />
library bar-code, Mykad, ASTRO and EIS which altogether make up 3.6%:8 libraries.<br />
Table 4.8: Services Offered to Clients (n=223)<br />
No. Service % of Libraries (f)<br />
1 OPAC 45.7 (102)<br />
2 Online circulation 35.9 (80)<br />
3 Web OPAC 34.5 (78)<br />
4 Website Services 26.0 (58)<br />
5 Online reservation 25.6 (57)<br />
6 Online registration 20.2 (45)<br />
7 Online reference enquiry 19.7 (44)<br />
8 Hypermedia/Multimedia 19.7 (44)<br />
9 Online acquisition /ordering 15.2 (34)<br />
10 Online Selective Dissemination of Information (SDI) 12.6 (28)<br />
11 Self Checked Machine 9.9 (22)<br />
12 Mobile Internet Services 8.1 (18)<br />
13 Online Inter-library loan/ SPP 7.2 (16)<br />
14 Smart card 5.4 (12)<br />
15 Others 3.6 (8)<br />
170
4.5.4 IT Facilities<br />
Table 4.9 shows the list of IT facilities arranged in descending order of percentage<br />
distribution. It could be seen local area network (LAN) was the most available facility<br />
with 108 of the libraries (48.4%) having it. This was followed by intranet (40.8% or 91<br />
libraries), scanners (39.9% or 89 libraries), internet (22.4% or 50 libraries), wide area<br />
network (WAN) (22.0% or 49 libraries), telnet (11.7% or 26) and extranet (6.3% or14<br />
libraries). For libraries with internet facility, 41.7% of these or 21 libraries were on<br />
leased lines and 14.8% on dial up systems. About 16.0% of the libraries do charge<br />
clients for the use of Internet facilities.<br />
Table 4.9: IT Facilities<br />
No. IT Facility % of Libraries<br />
(f)<br />
1 Local area network (LAN) 48.4 (108)<br />
2 Intranet access 40.8 (91)<br />
3 Scanners 39.9 (89)<br />
4 Internet access 22.4 (50)<br />
5 Wide area network (WAN) 22.0 (49)<br />
6 Telnet 11.7 (26)<br />
7 Extranet 6.3 (14)<br />
n=223<br />
4.5.5 Number of PCs Owned and Internet Connection<br />
Considering that PCs were now a must for any establishment, just as typewriters were in<br />
the older days, it was quite perplexing that only 82.5% of the libraries surveyed (184 out<br />
of 223) responded to the question on the number of PCs owned. A 100% response<br />
171
should have been obtained from the respondents. However, the 184 libraries responded<br />
all had PCs: 37.2% had between 1-5 PC each; 14.8% with 6-10 PCs each; 13.0% with<br />
11-20 PCs each; 9.9% with 21-50 PCs each; 2.7% with 51-100 each; 4.9% with more<br />
than 100 PCs each (Table 4.10). The data also shows that special libraries made up 63%<br />
of those libraries having the smallest number of PCs (1-5 each). This was not surprising<br />
as libraries under this type constituted 52% of the total sample, and many of them could<br />
have been small in terms of staff size; hence the small numbers of PCs. Public and state<br />
libraries tend to have more PCs per library. Forty per cent (40%) of public and 20% of<br />
state libraries had more than 100 PCs each compared with academic libraries (1.1%) and<br />
special libraries (1.1%).<br />
Table 4.10: Number of PCs Owned, Percentage Distribution of Libraries a , and<br />
Number of PCs per<br />
Library<br />
Percentage with Internet Connection b<br />
% of Libraries<br />
(f)<br />
% of PCs with Internet<br />
Connection (f)<br />
1 – 5 37.2 (68) 35.0 (64)<br />
6 – 10 14.8 (27) 15.2 (28)<br />
11 -20 13.0 (24) 13.5 (25)<br />
21 – 50 9.9 (18) 10.3 (19)<br />
51 – 100 2.7 (5) 3.6 (7)<br />
>100 4.9 (9) 4.5 (8)<br />
a, b out of total sample; n=184<br />
172
The number of PCs with internet connection appeared to be in proportion to the number<br />
of PCs owned. Thirty-five per cent of the libraries have internet connection for only 1 –<br />
5 of their PC sets. Those with 6 – 10 of their PCs having internet connection account for<br />
only 15.2% of the libraries. This was followed by the 11 - 20 PCs group (13.5%) and the<br />
21 – 50 PCs group (10.3%). Those with more than 100 of their PCs being connected to<br />
internet account for 4.5% of the libraries, while those with 51 -100 of their PCs<br />
connected to internet make up 3.6% of the libraries.<br />
4.5.6 Subscriptions to Foreign and Local Databases<br />
Table 4.11 shows the extent of subscriptions to local and foreign databases. It could be<br />
seen that only 33.1% or 73 of the libraries were subscribing to local databases.<br />
Moreover, more than two-thirds of the subscriptions were for 1-3 databases only, while<br />
the rest were for 4-6 data bases (8.2%), 7-10 databases (9.4%) and 28-35 databases<br />
(1.2%). Similarly, a rather low percentage (31.6%) of the libraries subscribed to foreign<br />
databases. Out of these, about 61.0% were for 1-3 databases each, 15.5% for 4-6<br />
databases, and 8.5% for 7-10 databases. Unlike the case with local subscriptions, those<br />
subscribing to foreign databases also included the 11-27 database groups. In addition,<br />
4.1% of those who subscribed to foreign databases were paying for more than 50<br />
databases. It could be seen that subscriptions to foreign data bases were more significant<br />
as compared to local data bases. Local subscriptions end within the range of 7-10 data<br />
bases only.<br />
173
n=223<br />
Table 4.11: Subscriptions to Databases among Libraries<br />
Database group Local subscription (as %<br />
of Sample)<br />
(f)<br />
Foreign Database<br />
Subscription (as % of<br />
Sample)<br />
1 – 3 26.9 (60) 19.3 (43)<br />
4 – 6 2.7 (6) 4.9 (11)<br />
7 – 10 3.1 (7) 2.7 (6)<br />
11 – 15 - 1.3 (3)<br />
16 – 19 - 0.9 (2)<br />
20 – 23 - 0.4 (1)<br />
24 – 27 - 0.4 (1)<br />
28 – 35 - 0.4 (1)<br />
51 -100 - 1.3 (3)<br />
All groups 33.1 (73) 31.6 (71)<br />
4.5.7 Technical Support for Library Automation<br />
Fifty-six percent (56%) or 124 of the libraries obtained their technical support for<br />
facilitating automation from the IT units of their parent organizations (Table 4.12). This<br />
was to be expected and supported earlier finding that related to the lack of IT personnel.<br />
Out-sourcing was the mean for getting technical support for 18.8% or 42 of the libraries,<br />
while 17.9% or 40 of the libraries were utilizing the services of their own internal IT<br />
units. Apart from these sources, 8% or 17 of the libraries obtained their technical<br />
support for automation from 20 different service entities.<br />
(f)<br />
174
Table 4.12 Technical Support for Library Automation<br />
No. Technical Support % of Libraries<br />
1 IT unit of parent organization 56% (124)<br />
2 IT unit within the library itself 17.9% (40)<br />
3 Out-sourcing 18.8% (42)<br />
4 Others 8% (17)<br />
n=223<br />
4.6 Training<br />
4.6.1 ICT Training for Staff<br />
Table 4.13 shows the number of libraries that had sent their staff for various ICT<br />
courses, listed in descending order of percentage respondents. About 72% or 160 of the<br />
libraries had sent their staff for training in application software. This was followed by<br />
introduction to computers (66.4% or 148) and internet & worldwide web (51.6% or 115)<br />
among courses that were attended by more than 50% of the libraries.<br />
Other courses attended were web design and home page (40.4% or 90), online<br />
searching skills (38.1% or 85 libraries), PC maintenance (21.5% or 48 libraries),<br />
operating system (15.7 or 35 libraries ), online indexing & abstracting (15.2% or 34<br />
libraries), content management (15.2% or 34 libraries), database management system<br />
(14.8% or 33 libraries), information system development (9.9% or 22 libraries),<br />
programming (9.4% or 21 libraries), telecommunication and networking (9.4% or 21<br />
libraries), and others (4.0% or 9 libraries).<br />
(f)<br />
175
Table 4.13: Number of Libraries Providing IT Training for Staff by Type of<br />
Training<br />
Type of Training Number of libraries<br />
(f)<br />
% of Total<br />
Sample<br />
1. Application software 160 71.7<br />
2. Introduction to computers 148 66.4<br />
3. Internet & world wide web 115 51.6<br />
4. Web design & home page 90 40.4<br />
5. Online searching skills 85 38.1<br />
6. PC maintenance 48 21.5<br />
7. Operating system 35 15.7<br />
8. Online indexing & abstracting 34 15.2<br />
9. Content management 34 15.2<br />
10. Database management system 33 14.8<br />
11. Information system development 22 9.9<br />
12. Programming 21 9.4<br />
13. Telecommunication & networking 21 9.4<br />
14. Others 9 4.0<br />
n=223<br />
4.6.2 ICT Training Providers<br />
Table 4.14 shows providers of ICT training. It could be seen that the largest number,<br />
that was 94 libraries (42.2%) of the total sample, had in-service ICT training for the staff<br />
using both in-house and outside trainers. There were 53 libraries (23.8% of total sample)<br />
that trained their staff exclusively in-house. Only 13.5% or 30 of the libraries sent their<br />
176
staff for ICT training under external trainers who might be better equipped with the<br />
knowledge considering the pace of advancement in ICT application. Moreover, a quite<br />
substantial number of the libraries (23.3% or 52 libraries) claimed that the staff<br />
enhanced their ICT skills through self-learning.<br />
Table 4.14: Providers of ICT Training<br />
Trainers Number of<br />
Libraries (f)<br />
As % of Total<br />
Sample<br />
1. Both in-house and external 94 42.2<br />
2. In-house trainers 53 23.8<br />
3. Self trained 52 23.3<br />
4. External trainers 30 13.5<br />
The breakdown of trainers by type of library (Table 4.15) shows that special libraries<br />
tend to be more likely to adopt in-house ICT training than the other types of libraries;<br />
academic libraries were more likely to employ external trainers as well as had staff<br />
resorting to self- training; state and public libraries combined were more inclined to have<br />
both in-house and external training.<br />
177
Table 4.15: ICT Trainers by Type of Libraries<br />
Type Total In-house External In-house and<br />
external<br />
Self-trained<br />
1. State/Public 16 2 (12.5%) 2 (12.5%) 11 (68.8%) 3 (18.8%)<br />
2. Special 117 31 (26.5%) 13 (11.1%) 52 (44.4%) 24 (20.5%)<br />
3. Academic 90 20 (22.2%) 15 (16.7%) 31 (34.4%) 25 (27.8%)<br />
Total 223 53 (23.8%) 30 (13.5%) 94 (42.2%) 52 (23.3%)<br />
4.6.3 Length of ICT Training<br />
Based on the duration of the above training, it was quite evident that the libraries were<br />
not serious in their effort to enhance the ICT skill of their staff. It was found that 68.6%<br />
or 153 of the libraries reported that the courses/training mentioned were for duration of<br />
less than one week. Courses of this duration couldn‟t be more that an “introductory” or a<br />
“refresher” in nature. Only 5.2% or 12 of the libraries sent their staff for courses/training<br />
that was more than three months long (Figure 4.3).<br />
It was recalled in Table 4.13 that 71.7% or 160 of the libraries, 66.4% or 148 of the<br />
libraries and 51.6% or 115 of the libraries sent their staff for training on application<br />
software, introduction to computers and internet and worldwide web, respectively.<br />
These courses tend to be short-duration in nature, hence the finding that 68.8% or 153 of<br />
the libraries sent their staff for courses which lasted less than one week.<br />
178
Percent of respondents<br />
80<br />
70<br />
60<br />
50<br />
40<br />
30<br />
20<br />
10<br />
0<br />
68.6<br />
22.6<br />
71.3%<br />
No<br />
28.7%<br />
Yes<br />
Figure 4.4: Distribution of libraries by Digitization Project<br />
A Chi-square test was performed to determine whether the percentage of libraries<br />
digitizing differed between different library types. For this statistical test, the state and<br />
public libraries were combined into one (state/public) because they numbered only 16<br />
libraries, as well as because the two types of libraries were quite similar in terms of<br />
services and users. Table 4.16 presents the results of the statistical test. Since the P-<br />
value was less than 0.05, it meant that the percentage of libraries digitizing differs<br />
between the three types of libraries, and the difference was statistically significant. It<br />
could, therefore, be concluded that the state/public group had the highest proportion<br />
(62.5%) of its libraries digitizing. This was followed a distant second by special libraries<br />
(29.9%) and academic libraries (21.1%). A note of comment was in order on this<br />
180
conclusion. Firstly, the result for state/public libraries might have to be interpreted with<br />
caution because of its relatively smaller sample size. Secondly, that academic libraries<br />
occupied the bottom-most position in terms of digitization was rather surprising. We<br />
would expect academic libraries to be the most advanced in adopting new information<br />
technology. But, that was what statistical test on the data shows.<br />
Table 4.16: Chi-square Statistics on Digitization Difference between Library Types<br />
Library Type Sample Size Percent with Digitization<br />
Project<br />
P-Value of the<br />
2<br />
� Test<br />
a) State/Public 16 62.5 0.003<br />
b) Special 117 29.9<br />
c) Academic 90 21.1<br />
Overall 223 28.7<br />
4.7.2 Materials Digitized<br />
Table 4.17 lists the materials that had been digitized by the libraries. It could be seen<br />
that newspaper cuttings was the most widely digitized material, with 56.3% of the<br />
libraries digitizing. Next (32.8% of the libraries) was theses/dissertations, books and<br />
articles. This was followed by conference papers/proceedings (31.3%),<br />
booklets/pamphlets/leaflets (29.7%), photo collections (28.1%), others (25.0%),<br />
newsletters/house organs (23.4%), speeches (21.9%), minutes of meeting/organization’s<br />
special reports (20.3%), circulars (18.8%), occasional papers/organization’s technical<br />
reports (17.2%), and archival materials (14.1%). In addition, there were materials, each<br />
181
with less than 10% of the libraries digitizing it. These were maps, manuscripts and<br />
patents & specifications.<br />
Table 4.17: Materials Digitized<br />
Material Number of<br />
Libraries<br />
As % of<br />
Digitizing Libraries Total Sample<br />
1. Articles 21 32.8 9.4<br />
2. Books 21 32.8 9.4<br />
3. Booklets/leaflets/pamphlets 19 29.7 8.5<br />
4. Circulars 12 18.8 5.4<br />
5. Conference papers/proceedings 20 31.3 9.0<br />
6. Manuscripts 4 6.3 1.8<br />
7. Maps 5 7.8 2.2<br />
8. Minutes of meeting 13 20.3 5.8<br />
9. Newsletters/house organ 15 23.4 6.7<br />
10. Newspaper cuttings 36 56.3 16.1<br />
11. Occasional papers 11 17.2 4.9<br />
12. Organization's special report 13 20.3 5.8<br />
13. Organization's technical report 11 17.2 4.9<br />
14. Photo collection 18 28.1 8.1<br />
15. Standards 5 7.8 2.2<br />
16. Patents & specifications 4 6.3 1.8<br />
17. Speeches 14 21.9 6.3<br />
18. Theses and dissertations 21 32.8 9.4<br />
19. Archival materials 9 14.1 4.0<br />
20. Others 16 25.0 7.2<br />
182
From the point of progress in digitization for all the libraries that the sample was<br />
representing, it could be seen that Malaysian libraries were doing some amount of<br />
information surrogation as a starting point towards digital library initiatives.<br />
4.7.3 Technical Support for Digitization Work<br />
As could be seen from Table 4.18, 45.3% of the libraries (39) that were reported to have<br />
done digitization works, did it fully using their own capability in terms of technical<br />
expertise and facilities, while 40.7% (35) resorted to local private company to carry out<br />
the task. Libraries that made use of their parent organizations‟ IT units for their<br />
digitization works accounted for 14.0% (12).<br />
Table 4.18 Technical Support in Digitization Works<br />
Technical support Number of<br />
Libraries<br />
Digitizing<br />
Libraries<br />
As % of<br />
Total Sample<br />
1. Local private company 35 40.7 15.7<br />
2. Organization's IT Unit 12 14.0 5.4<br />
3. Library's own equipment 39 45.3 17.5<br />
4.7.4 Storage Media Adopted<br />
As shown in Table 4.19 below, compact disc (CD) served as the storage media<br />
for 62.5% (40) of the libraries with digitization projects. This was followed by PDF and<br />
hard disc (50.0% each or 32 libraries), floppy disc (20.3% or 13 libraries), and enterprise<br />
storage system (18.8% or 12 libraries). Others, each with less than 10% of the libraries,<br />
183
were DVD (6.3%), miniature mobile storage media (4.7%), and PC cards (3.1%). As the<br />
statistics imply, several of the libraries made use of more than one medium of storage<br />
each.<br />
Table 4.19: Digitization Storage Media<br />
Media Number of<br />
Libraries<br />
As % of<br />
Digitizing Libraries Total Sample<br />
1. CD 40 62.5 17.9<br />
2. PDF 32 50.0 14.3<br />
3. Hard Disc 32 50.0 14.3<br />
4. Floppy Disc 13 20.3 5.8<br />
5. Enterprise storage system 12 18.8 5.4<br />
6. DVD 4 6.3 1.8<br />
7. Miniature mobile storage media 3 4.7 1.3<br />
8. PC Cards 2 3.1 0.9<br />
4.7.5 Digitized Materials On Website<br />
Out of the 84 libraries reporting to have digitized or have digitization project (s), only 57<br />
responded to this question. Table 4.20 shows that 54.4% (31) of these libraries had<br />
flashed only some selected digitized materials on the websites, while quite a substantial<br />
proportion (33.3% or 19) had not done so, but would be attempting to do so in the<br />
future. Only 7 libraries or 12.3% flashed all materials online.<br />
184
Proportion of Materials on<br />
Website<br />
Table 4.20 Proportion of Materials on Website<br />
Number of<br />
Libraries<br />
As % of Libraries<br />
Giving Response<br />
As % of<br />
Total Sample<br />
1. All materials 7 12.3 3.1<br />
2. Some selected materials 31 54.4 13.9<br />
3. None, but will be in<br />
future<br />
19 33.3 8.5<br />
The number of libraries that was full public domain (i.e. putting all that they had<br />
digitized on the website) was only 12.3% (7). This was not conducive for the purpose of<br />
resource sharing, as one of the fundamental features in a digital library environment.<br />
4.7.6 Budget Spent/Committed Until December 2003<br />
Table 4.21 shows the distribution of the libraries (only 54 of the 64 libraries digitizing<br />
responded to this question) and the budget they either had spent or had committed until<br />
December 2003. Fifteen libraries, or 27.8% of them, had spent or committed RM25 000 –<br />
RM50 000 each, 9 libraries (16.7%) with RM50 00 – RM75 000 each, 8 libraries (14.8%)<br />
with RM100 000 – RM200 000 each, 7 libraries (13.0%) with RM200 000 – 300 000), 6<br />
libraries (11.1%) with RM75 000 – RM100 000, 3 libraries (5.5%) with RM300 00 –<br />
RM400 000, 3 libraries (5.5%) with more than RM2 million, and 1 library (1.9%) with<br />
less than RM25 000 each.<br />
185
Table 4.21: Budget Spent/Committed for Digitization until December 2003<br />
Size of Budget (RM) Number of<br />
Libraries<br />
As % of Digitizing<br />
Libraries Responding<br />
As % of<br />
Total Sample<br />
1. < 25 000 1 1.9 0.4<br />
2. 25 000 – 50 000 15 27.8 6.7<br />
3. 50 000 – 75 000 9 16.7 4.0<br />
4. 75 000 – 100 000 6 11.1 2.7<br />
5. 100 000 – 200 000 8 14.8 3.6<br />
6. 200 000 – 300 000 7 13.0 3.1<br />
7. 300 00 – 400 000 3 5.5 1.3<br />
8. 500 000 – 1 000 000 2 3.7 0.9<br />
9. >2 000 000 3 5.5 1.3<br />
4.7.7 Contents of Website<br />
About 90% of the 57 digitizing libraries placed general basic information on their<br />
websites (Table 4.22). E-mail was the next most commonly stated website content by<br />
70.3% (45) of the libraries. Other website contents mentioned with more than 50%<br />
counts were, in descending order: Web OPAC (68.8%)/44; hypertext linkages to<br />
agencies within the same ministry /department (62.5%)/40; hypertext linkages to related<br />
websites (59.4%)/38; feedback and comment (53.1%)/34; access to commercial online<br />
databases (51.6%)/33; new books list (51.6%)/33; and access to e-book (50.0%/32).<br />
Website contents with less than 50% of the libraries reporting to have them were:<br />
calendar of events (42.2%)/27; e-forms (42.2%/27); book/article reviews (37.5%/24);<br />
access to local contents databases developed internally (35.9%/23); FAQ (34.4%/22);<br />
186
suggestion page (32.8%/21); electronic document delivery service (32.8%/21);<br />
community information database (29.7%/19); location maps (17.2%/11); and others<br />
(6.3%/4).<br />
Table 4.22: Contents of Website<br />
Content description Number of<br />
Libraries<br />
1. General information on the library, staff, contact<br />
number, opening hours, services, collections,<br />
rules and regulation<br />
2. Hypertext links to other agencies within the<br />
same ministry/department<br />
As % of Digitising<br />
Libraries<br />
57 89.1<br />
38 59.4<br />
3. Hypertext links to related websites 40 62.5<br />
4. Community information database 19 29.7<br />
5. FAQ 22 34.4<br />
6. Web OPAC 44 68.8<br />
7. Access to E-books and e-journals 32 50.0<br />
8. Access to commercial online databases 33 51.6<br />
9. Access to local content databases (developed by<br />
the library itself) e.g. Raja Kita/Sireh Pinang<br />
23 35.9<br />
10. E-mail 45 70.3<br />
11. E-forms (e.g. application forms) 27 42.2<br />
12. Electronic document delivery service 21 32.8<br />
13. Calendar of events & exhibition 27 42.2<br />
14. Book/article reviews 24 37.5<br />
15. New book list 33 51.6<br />
16. Location maps 11 17.2<br />
17. Suggestion page 21 32.8<br />
18. Feedback & comment 34 53.1<br />
19. Others 4 6.3<br />
187
4.7.8 Digitization Related Problems<br />
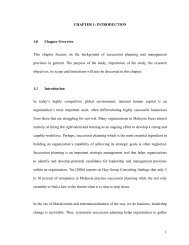
It was recalled that 64 (28.7%) of the libraries surveyed reported to have done some<br />
digitization works. In this section, the task was to find out what were the problems faced<br />
during the digitizing process. Table 4.23 lists the 17 statements that this study had<br />
identified, which might or might not be problems to the libraries, plus any other<br />
situations altogether categorized as others, and the opinions of the respondents about<br />
them. These statements were arranged in descending order from the highest percentage<br />
to the lowest percentage of “Yes”, or alternatively, in ascending order from the lowest to<br />
the highest percentage of “No”.<br />
Table 4.23: Perceptions of Respondents on Digitization Related Problems<br />
Statements/Problems Respondents % Yes % No<br />
1. Projects have to be done with existing staff 53 73.6 26.4<br />
2. Absence of a blueprint as a guideline 49 70.8 29.2<br />
3. Absence of National Information<br />
Infrastructure Policy<br />
44 63.6 36.4<br />
4. Too expensive 50 60.0 40.0<br />
5. Lack of role model 49 57.1 42.9<br />
6. Copyright Act clearance 43 51.2 48.8<br />
7. Lack of collaborative works among<br />
libraries<br />
8. Lack of exposure of what is digital and<br />
virtual library is all about<br />
44 50.0 50.0<br />
56 46.4 53.6<br />
9. Lack of suitable hardware and software 51 45.1 54.9<br />
10. Lack of understanding of the actual concept<br />
of digital/virtual library phenomena<br />
11. Lack of initiatives at national level (e.g.<br />
from PNM)<br />
53 43.4 56.6<br />
43 37.2 62.8<br />
12. Lack of local contents 48 35.4 64.6<br />
188
13. Lack of IT vendor specializing in<br />
digitization of library<br />
50 32.0 68.0<br />
14. Home page is not updated regularly 49 30.6 69.4<br />
15. Too busy running the library to have the<br />
time to plan for digital and virtual library<br />
development<br />
50 30.0 70.0<br />
16. Proposal has been turned down 41 26.8 73.2<br />
17. Others 13 23.1 76.9<br />
18. Management is not very keen on<br />
digitization<br />
45 20.0 80.0<br />
Taking a cut-off point of 50%, it could be seen that six of the 18 statements were<br />
considered problems to digitization process by the respondents. Projects have to be done<br />
with existing staff (73.6% of the respondents saying yes) were the most common<br />
problem faced. The problem might be in terms of staff shortage or lack of relevant<br />
training/background. This was closely followed, in descending order of importance, by<br />
absences of a blueprint that may serve as guidance (70.8% of respondents), absence of<br />
National Information Infrastructure (NII) (63.6%), too expensive (60.0%), lack of role<br />
model (57.1%), and Copyright Act clearance (51.2%).<br />
Among the “not problematic” statements, management is not very keen on digitization<br />
was the least problematic with 80% of the respondents saying “no”. It could be taken to<br />
mean that the majority of the management of the libraries studied was keen on digital<br />
library. The next least problematic statement is others (76.9% of the respondents).<br />
However, there had to be a reservation on the interpretation of others because only 13<br />
provided answers, and two of the three who responded with a “yes” mentioned limited<br />
budget and lack of staff which should have been accounted for under too expensive and<br />
189
project has to be done with the existing number of staff. Therefore, the second least<br />
problematic of the statements was proposal has been turned down (73.2% saying no).<br />
This was followed by don’t have time (70.0% saying no), homepage was not updated<br />
regularly (69.4% saying no), lack of IT vendor (68.0% saying no)), lack of local<br />
contents (64.6% saying no), lack of initiatives at national level (62.8% saying no), lack<br />
of understanding of the actual concept of digital library (56.6% saying no), lack of<br />
suitable hardware and software (54.9% saying no), and lack of exposure on what digital<br />
library was all about (53.6 saying no). Lack of collaborative works among libraries is<br />
considered neither “problematic” nor “not problematic”.<br />
In short, it could be inferred from the results that the problems encountered during<br />
digital library development were: the lack of staff (either in terms of number or the<br />
required skills); a dearth of a blueprint for guidance; absence of National Information<br />
Infrastructure policy; the project being too expensive; lack of role model; and Copyright<br />
Act clearance.<br />
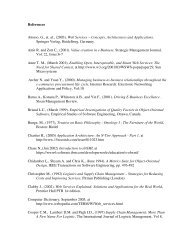
4.7.9 Involvement in Digitization Project under the National Library of Malaysia<br />
Playing a leading role in library development, the National Library of Malaysia had<br />
initiated a number of collaborative digitization projects with several other libraries,<br />
notably the MyLib/PERDANA Project. However, the participation among the libraries<br />
studied in these projects was not widespread. According to the data, only 24 libraries or<br />
10.8% of the total sample, reported to have been involved (Figure 4.5).<br />
190
Figure 4.5: Percentage of Libraries Involved in Digitization with PNM<br />
4.7.10 Development of In-house Databases<br />
The development of in-house databases ran parallel with progresses in automation and<br />
digitization. Progress in in-house database development among the libraries studied<br />
appeared to be keeping abreast with digitization, with sixty-three libraries, or 28.3% of the<br />
total sample, reporting to have developed some kind of in-house databases (Figure 4.6).<br />
Earlier it was reported that 64 libraries or 28.7% of the total sample did have digitization<br />
project(s).<br />
89.2%<br />
No<br />
Digitization<br />
Project<br />
10.8% Have<br />
Digitization<br />
Project<br />
191
Figure 4.6: Percentage of Libraries with In-house Databases<br />
4.7.11 Future Plan for Digital Library Development<br />
A total of 138 respondents answered this open-ended question on the future plan for<br />
digital development of their libraries. Although there were numerous responses and<br />
plans, in actuality these could be relevantly sorted into ten different groups of responses.<br />
Table 4.24 lists the ten response groups/plans in descending order of percentage<br />
respondents.<br />
71.7%<br />
No Inhouse<br />
Databases<br />
28.3%<br />
Inhouse<br />
Databases<br />
192
Table 4.24: Plans for Digitization and Percentage Respondents.<br />
Responses/Plans % of Respondents<br />
1. Will be automating/going online 39.9 (55)<br />
2. Others 11.6 (16)<br />
3. Improve the infrastructure 10.9 (15)<br />
4. In the planning stage 8.7 (12)<br />
5. Acquire more electronic library resources 7.9 (11)<br />
6. Depend on budget / to ask for budget increase 6.5 (9)<br />
7. Depend on main/parent organization 4.3 (6)<br />
8. Improve staff IT competency 3.6 (5)<br />
9. Establish linkage with other libraries including PNM 3.6 (5)<br />
10. Make the library more user-friendly 2.9 (4)<br />
n=138<br />
It was noted in Chapter 1 that it was very unlikely that Malaysian libraries would<br />
develop digital libraries without first embracing automation and becoming electronic. It<br />
re-affirms that statement when the largest proportion (39.9% or 55) of the respondents<br />
who provided answers to the question of digital library planning, said that they would<br />
automate in the near future. It seemed that this was the logical sequence and it was an<br />
accepted phenomenon that digital library development would come next after<br />
transforming the library from print based, electronic and then digital. Followed by close<br />
to 12% or 16 of them cited several answers (some were related to automation and<br />
electronic libraries) which fall into the category of others. These included updating<br />
existing project, knowledge portal, install library system, make information available to<br />
(f)<br />
193
public, publication/research data/photo gallery, portal of k-management, to be the best<br />
library in the country, stay with hybrid library but promote electronic medium, and<br />
integrated broadcast library system. Improving existing infrastructure (10.9% or 15)<br />
was the next most mentioned plan, followed by In the planning stage (8.7% or 12), to<br />
acquire more electronic library resources (7.9% or 11), depend on budget (6.5% or 9),<br />
depend on main/parent organization (4.3% or 6), improve competency of staff (3.6% or<br />
5), linkage with other libraries including PNM (3.6% or 5), and make the library user-<br />
friendly (2.9% or 4). What seemed to be missing in their future planning were a concrete<br />
and solid digital library initiative, no mention of collaborative effort and the small<br />
localized initiatives that seemed to be all at the initial stage.<br />
4.8 Opinions of Heads of Libraries<br />
4.8.1 Digital Library Development<br />
This study was also interested to gauge the opinions of the library heads with<br />
respect to some points related to digital library development and the extent to which<br />
libraries in Malaysia would actually become digital. It had been shown throughout the<br />
earlier discussions that the concept of digital library had been initially received by the<br />
library community, at least from their perspectives. However, viewed from the<br />
interviews and field visits, and as evident from the data, progress in the actual<br />
realization of the concept had not been extensive. There could be teething problems with<br />
the implementation here and there that contributed to the slow progress. What did they<br />
think was going to happen later with digital library, especially among those occupying<br />
194
positions in the libraries that had a better perspective of what had happened in the past,<br />
and at the same time could collectively influence its future development.<br />
To facilitate this analysis, a total of five questions were posed to the respondents,<br />
who by designation were heads of libraries. The selection of five levels of perceptions at<br />
the time of survey was to minimize the possibility of respondents stating their opinion<br />
wrongly if only the yes and no options were provided. Just as the case with Section 4.3,<br />
the five levels of perceptions were collapsed into two measures (“yes” and “no”) to<br />
arrive at a more definitive interpretation of how did respondents perceived about the<br />
issues. In interpreting the results, this study‟s approach was to treat the measurement<br />
level denoted by the numeric 2 as a “no” that was, it was in the same category of<br />
perception as numeric 1. The rationale was that there could be a tendency among the<br />
respondents to somewhat paint a slightly better picture of a negative situation. Whether<br />
it was a bona fide “no” or slight “yes”, both were manifestations of opinion that actually<br />
meant “no”. Similarly, for practical purpose, very positive and extremely positive were<br />
degrees in opinion, and were, therefore, interpreted simply as a “yes”.<br />
Table 4.25 shows the distribution of respondents on perceptions about the<br />
development of digital library. It could be seen that the majority (88.7% or 198) of the<br />
respondents were positive about digital library development in Malaysia. This optimistic<br />
view from people who were in-charge of the organizations themselves might be<br />
influenced more by an honest desire to see that such a situation should materialize, and<br />
less by actual progress in digital library development in the country. Since the concept<br />
of digital library was already accepted and its implementation had been initiated, albeit<br />
slow in progress. The desire to see libraries become digital could in itself become an<br />
195
impetus to the actual implementation of the concept and this somehow reflected their<br />
readiness to go for digital libraries.<br />
More than three-quarters (78% or 173) of the respondents believed that users<br />
were now ready for new information technology or digital information. Being at the<br />
forefront of library services, they knew that library users were expecting changes,<br />
demand more electronic, online and digital services, as they themselves were becoming<br />
more IT savvy.<br />
One the one hand, respondents were overtly confident that in the future libraries<br />
would become digital, but on the other hand, they did not think that digital format would<br />
finally dominate the entire library scene. Only 52.7% or 118 of the respondents thought<br />
that libraries would be predominantly on digital format. If another inference could be<br />
made here, it meant that it would not be likely that Malaysian libraries would become<br />
full fledge digital libraries but rather the hybrid type because the other information<br />
media would be present for quite an indefinite time.<br />
On whether there had been a change in the collection development policy of the<br />
libraries since 2000, 70.3% or 157 of the respondents answered that there was none.<br />
This study had intended the question to mean whether the library concerned had created<br />
or transformed more digital format and subscribed to more on-line services since 2000.<br />
If so, then 70.3% of the libraries had not done so. This finding did not augur well for the<br />
transformation of traditional libraries as collection development policy must be in<br />
tandem with digital library initiatives. Digitization progress in Malaysian libraries was<br />
indeed slow going by the result of data analysis.<br />
196
Table 4.25: Distribution of Respondents on Perceptions towards Development of<br />
Digital Library<br />
Questions/Issues Perception (%) and (f)<br />
1. Are you positive about digital library<br />
development?<br />
2. Do you think library users are ready for new<br />
information technology?<br />
3. In your opinion will digital format finally<br />
dominate the entire library scene?<br />
4. Has there been a change in your collection<br />
development policy since 2000?<br />
n=223<br />
Not positive<br />
(11.3%)<br />
25<br />
Not ready<br />
(22.2%)<br />
50<br />
Will not dominate<br />
(47.2%)<br />
105<br />
No change<br />
(70.3%)<br />
157<br />
Positive<br />
(88.7%)<br />
198<br />
Ready<br />
(77.8%)<br />
173<br />
Will dominate<br />
(52.7%)<br />
118<br />
Change<br />
(29.7%)<br />
A Chi-square test of significance was performed on the data to determine<br />
whether opinions on the four statements/questions differed between the different types<br />
of libraries. As was the case with the section on digitization, in this analysis state and<br />
public libraries were combined into one group because of their much smaller sub-sample<br />
sizes (altogether there were only 16 libraries). Results of the statistical analysis were<br />
presented in Table 4.26. As could be seen, none of the P-value is less than 0.05 (level of<br />
significance), meaning that in all of the five statements/questions, the opinions of heads<br />
of libraries did not differ between the different library types.<br />
66<br />
197
Table 4.26: Chi-square Statistics of Opinion on Digitization by Type of Library<br />
Statement Type of<br />
Library<br />
1. Are you positive about<br />
virtual library<br />
development?<br />
2. Do you think library<br />
users are ready for<br />
new information<br />
technology?<br />
3. In your opinion will<br />
digital format finally<br />
dominate the entire<br />
library scene?<br />
4. Has there been a<br />
change in your<br />
collection<br />
development policy<br />
since 2000?<br />
Opinion (% of<br />
Respondent)<br />
Negative Positive<br />
P-Value of<br />
2<br />
the � Test<br />
a) State/Public 20.0 80.0 0.526<br />
b) Special 11.2 88.8<br />
c) Academic 10.0 90.0<br />
Overall 11.3 88.7<br />
a) State/Public 31.3 68.8 0.438<br />
b) Special 19.1 80.9<br />
c) Academic 24.4 75.6<br />
Overall 22.2 77.8<br />
a. State/Public 62.5 37.5 0.347<br />
b. Special 48.2 51.8<br />
c. Academic 43.2 56.8<br />
Overall 47.2 52.8<br />
a) State/Public 78.6 21.4 0.229<br />
b) Special 74.1 25.9<br />
c) Academic 64.0 36.0<br />
Overall 70.3 29.7<br />
198
4.8.2 PNM Project, Type of libraries and Role of Information Professional<br />
In the literature review, it was mentioned that the National Library of Malaysia<br />
played a leading role in the country‟s library development and more so in spearheading<br />
national digital library initiatives. This study seeks to obtain the opinion of respondents<br />
on this role. It was also interesting to know how heads of libraries perceived about the<br />
role of information professionals vis-à-vis computer science professionals in the<br />
development of digital libraries, as well as the future of printed books and traditional<br />
libraries.<br />
Respondents were asked to state their perceptions on these issues using five<br />
evaluation scales: disagree (1), slightly agree (2), agree (3), agree to a large extent (4)<br />
and agree 100%. It was reasonable that a perception or an opinion represented by<br />
“slightly agree” essentially meant one was not too sure. In fact, if the respondents were<br />
to be provided a “not sure” option for their opinion, those respondents who had stated<br />
“slightly agree‟ would most probably have chosen the “not sure” answer.<br />
It was for this reason that the analysis treated slightly agree effectively as<br />
disagree. Similarly, agree to a large extent and agree 100% essentially meant that a<br />
person agrees, or believes, or thinks so. With this, the results of analysis (Table 4.27)<br />
were presented and discussed as follows.<br />
199
Table 4.27: Perceptions on PNM, Type of Library, Role of IPs and Future of Books<br />
and Traditional Libraries<br />
Questions/Issues Disagree: % of<br />
respondents<br />
1. PNM should publish a blue print that will<br />
serve as a guideline for digital library<br />
development in Malaysia<br />
2. Projek Perdana of PNM does reflect some<br />
degree of digital library development in<br />
Malaysia<br />
3. In your opinion, do you think that the<br />
hybrid type is the best for Malaysian<br />
libraries?<br />
4. Do you think that books are here to stay<br />
despite the rapid expansion of the on-line<br />
services?<br />
5. Do you feel that the information<br />
professionals are being threatened by the<br />
computer science professionals?<br />
6. Information professional must embrace<br />
technology and not leave everything to the<br />
computer science professionals<br />
7. Traditional libraries are on the brink of<br />
extinction<br />
n=223<br />
(f)<br />
5.1<br />
(11)<br />
19.0<br />
(42)<br />
14.9<br />
(33)<br />
9.4<br />
(21)<br />
59.6<br />
(133)<br />
4.2<br />
(9)<br />
56.1<br />
(125)<br />
Agree: % of<br />
respondents<br />
(f)<br />
94.9<br />
(212)<br />
81.0<br />
(181)<br />
85.1<br />
(190)<br />
90.6<br />
(202)<br />
40.4<br />
(90)<br />
95.8<br />
(214)<br />
Heads of libraries overwhelmingly (94.9% or 212) agreed that the National Library of<br />
Malaysia should fulfill its leading role in spearheading the drive towards digitization by<br />
publishing a blueprint that would serve as a guideline for the other libraries. A<br />
substantial number of respondents (81.0% or 181) viewed the national digital library<br />
43.9<br />
(98)<br />
200
program, the PERDANA Project as a manifestation of some development in the way of<br />
national digital library development.<br />
Despite their views that digital library had a bright future, a high percentage of<br />
the respondents (85.1% or 190) thought that the best library would be the hybrid type,<br />
combining the digital and the print collections. Thus, in the context of the Malaysian<br />
library communities, digital library was perceived to be one that was not necessarily one<br />
hundred per cent digital. This might actually be true even in the more technologically<br />
advanced countries. If so, there was a need to “quantify” the definition of a digital<br />
library.<br />
This might be a suggestion for future research. A large proportion (90.6% or<br />
202) of the respondents believed that books would continue to be an essential part of a<br />
library‟s collections. The digital library concept was developed to provide users<br />
convenience and quick access to information. Books, and for that matter other print<br />
materials, should also be kept as libraries were traditionally the depository of published<br />
materials.<br />
A Chi-square test of significance was carried out to determine whether opinions<br />
of heads of libraries on the five statements differed by type of libraries (Table 4.28). As<br />
could be seen from the various P-values, only in the first statement (about whether PNM<br />
should publish a blueprint) that the percentage figures differed, that was statistically<br />
significant, between different types of libraries.<br />
It could be concluded, therefore, that the heads of state/public libraries were<br />
unanimous (100%) in their opinion that the National Library of Malaysia should<br />
produce a blueprint that would be a guideline for the other libraries. This was followed<br />
201
y special libraries (98.2%) and academic libraries (89.9%). In the case of the other four<br />
statements, although the percentages of respondents who were positive about the four<br />
statements appear to be different, these were not statistically significant. Therefore, it<br />
was concluded that all library heads, regardless of the type of libraries, view the issues<br />
(about Projek Perdana, hybrid library, books, and information technology professional<br />
being replaced by computer scientists), the same way as with the general sample.<br />
202
Table 4. 28: Opinion of Heads of Libraries on Various Issues by Type of Library<br />
Statement Type of Library Opinion (% of<br />
Respondents)<br />
1. The National Library of<br />
Malaysia (PNM) should publish<br />
a blueprint that will serve as a<br />
guideline for digital and virtual<br />
library development in Malaysia<br />
2. Projek PERDANA of PNM<br />
does reflect some degree of<br />
digital and virtual library<br />
development in Malaysia<br />
3. In your opinion, do you think<br />
that the hybrid type is the best<br />
for Malaysian libraries?<br />
4. Do you think that books are<br />
here to stay despite the rapid<br />
expansion of the online<br />
services?<br />
5. Do you feel that the information<br />
professionals are being<br />
threatened by the computer<br />
science professional?<br />
Negative Positive<br />
P-Value<br />
of the<br />
2<br />
� Test<br />
a) State/Public 0 100.0 0.017<br />
b) Special 1.8 98.2<br />
c) Academic 10.1 89.9<br />
Overall 5.0 95.0<br />
a) State/Public 25.0 75.0 0.387<br />
b) Special 15.5 84.5<br />
c) Academic 22.4 77.6<br />
Overall 19.0 81.0<br />
a) State/Public 6.3 93.8 0.417<br />
b) Special 13.6 86.4<br />
c) Academic 18.1 81.9<br />
Overall 14.8 85.2<br />
a) State/Public 12.5 87.5 0.294<br />
b) Special 6.4 93.6<br />
c) Academic 12.6 87.4<br />
Overall 9.4 90.6<br />
a) State/Public 50.0 50.0 0.382<br />
b) Special 56.9 43.1<br />
c) Academic 64.8 35.2<br />
Overall 59.6 40.4<br />
203
4.9 Analysis of findings (Quantitative)<br />
4.9.1 Library Profiles<br />
The first emerging sign of digital library development from the research was that<br />
36% of the libraries had declared to become hybrid type, having some components of their<br />
collection digitized and was providing some form of online services. The remaining 55 %<br />
was print-based and only 1.3% declared to be digital.<br />
The oldest library in Malaysia was the special library type followed by<br />
academic, state and public. There were great variations in terms of grade of library heads,<br />
ranking from JUSA B officer to S27, embedded within 15 designations i.e. Director<br />
General, Chief Information Officer, Chief Knowledge Officer, Director, Assistant<br />
Director, Deputy Director, Manager, Information Manager, Chief Librarian, Library Head,<br />
Librarian, Library Officer, Assistant Library Officer, Senior Library Assistant and Library<br />
Assistant.<br />
As for staff strength, there was a close relationship between the number of<br />
professional staff and supporting staff. On the average there were 2 professional staffs /<br />
library. By type, state libraries had the highest average number of professionals followed<br />
by public, academic and special libraries. For supporting staff it was slightly higher than<br />
those above but in the same pattern. For IT personnel, it was much lower. With only 39<br />
respondents answering this question, the average was only 2 persons / library. The<br />
provision of e-mail facilities for staff usage (with personal addresses) was only 42 %. This<br />
was considered to be low due to the fact that e-mail facility was one of the platforms for<br />
information transfer. In the cyber area where means of communication had been<br />
dominated by wireless technology, e-mail should be at everybody‟s disposal. However, by<br />
204
type state libraries were the most generous followed by academic, special and public<br />
libraries. In terms of experience of library heads, state librarians had served the longest,<br />
followed by special, public and academic libraries. Average for all was 11 years.<br />
4.9.2 Analysis of Library General Problems<br />
Since the research wishes to see the readiness of Malaysian libraries in starting<br />
digitization programs and providing online services, it would be wise to ascertain their<br />
present conditions in terms of the nature of problems that they were facing. This was<br />
because the present environment did have some impact on any new undertakings. It<br />
would be difficult to move forward if not supported by adequate facilities, budget,<br />
training, management support and human resource. Earlier it was found that only 54%<br />
of the libraries had installed an integrated library systems, meaning 46% were still<br />
without library system. In another words, almost half of the respondents did not have as<br />
yet the most basic infrastructure for electronic library where at least web OPAC could<br />
be operational. It would be hard to imagine that in the cyber era, where the Internet had<br />
changed the way we live, there were still libraries without library system. How could<br />
they be ready or even plan for the setting up of a digital library in the absence of a<br />
library system? Therefore nineteen different kinds of general library problems had been<br />
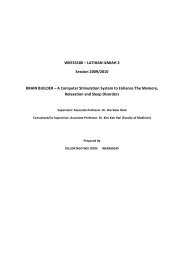
asked in the questionnaire and these were what the research unfolded:-<br />
205
Percentage<br />
70<br />
60<br />
50<br />
40<br />
30<br />
20<br />
10<br />
0<br />
Lack of IT personnel<br />
64 63<br />
Lack of budget<br />
Analysis of General Problems<br />
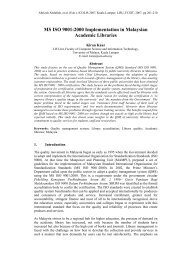
Figure 4.7: Analysis of General Problems<br />
Lack of digital library initiatives<br />
60<br />
Lack of IT training<br />
58 57 56<br />
Underutilization of digital resources<br />
Renewal subscription of online<br />
databases<br />
53 53<br />
Lack of IT personnel had been identified as the most problematic and this was in<br />
fact very crucial to digital library development that was supposed to be IT dependent<br />
and IT driven. This was partly the reason why there had been some form of dependence<br />
on the IT unit of the parents‟ organizations for technical support and also the reason why<br />
heads of libraries unanimously agreed that librarians must embrace digital technology.<br />
As had been pointed out earlier, there was an average of only two IT personnel / library.<br />
This factor was further intensified by the lack of IT training. These problems co-related.<br />
The lack of IT personnel should be substantiated with the librarians themselves being<br />
sent for IT training, but this was not happening either.<br />
Lack of suitable integrated library<br />
system<br />
Lack of library space<br />
Lack of IT facility<br />
50<br />
206
In the literature review there had been a lot of discussions on the importance of<br />
funding and with such funding, digital library initiatives flourished. Digitization projects<br />
were complex and it required a significant amount of investment. But as the research<br />
found, the lack of budget came next after the lack of IT personnel. As we would see<br />
later, only 5% of the respondents had budget of more than 2 million and funding from<br />
non-governmental sector for digital library development was not yet a norm in<br />
Malaysia. Unlike in the United States, bodies like NASA and FBI were also involved in<br />
the sponsoring of digital library programs. The only known Malaysian non-<br />
governmental sector that had been sponsoring part of the maintenance costs of<br />
Universiti Kebangsaan Malaysia Medical Virtual Library had stopped doing so at the<br />
end of 2008 for reason they only knew.<br />
The third problem was the lack of digital library initiatives and this was a<br />
testimony of the level of digital library development in Malaysia. In relation to this,<br />
some of the responses under digital library planning further emphasizes on this matter<br />
where it was gathered that they were still in the mid of planning for automation and<br />
electronic libraries, improving infrastructure and staff competency, depending on the<br />
availability of budget and on parent organizations. What seemed to be missing in their<br />
future planning were a concrete and solid digital library initiative and most probably<br />
they depended on the digital library initiatives of the National Library of Malaysia.<br />
The other problems of underutilization of digital resources and renewal<br />
subscription of online databases were inter-related. The underutilization of digital<br />
resources could stem from several reasons. Its either users were not familiar with digital<br />
resources or the new service had not been promoted or user education program had not<br />
207
een intensified. With limited budget, renewal would be a problem if the subscriptions<br />
remained underutilized. Therefore some publicity embedded within user education<br />
program might help solved underutilization of digital resources. Together with the lack<br />
of suitable integrated library system, lack of library space and lack of IT facility would<br />
definitely slow down development growth, even though lack of library space might not<br />
be so important because with digital materials, supposedly less space would be needed.<br />
4.9.3 Holdings<br />
Print-based libraries still dominated Malaysian scenario although 36% had<br />
turned hybrid. This was further intensified by the fact that 89% had monograph as one<br />
of their main collections followed by periodicals, video cassettes and audio cassettes.<br />
Others in a much smaller percentages were posters, maps, photographs, microfiche, and<br />
films. On the rise was CD-ROM (58%). CD-ROM collection had surpassed the last 5<br />
collection types that used to be among the most important collections being kept. This<br />
was a good indication of the inclination towards digital library development. On the<br />
contrary, the western library scenario was quite different when Pack and Pemberton<br />
(1999) were reported as saying that the use of CD-ROMs had declined. If we might<br />
infer, we had been left behind.<br />
4.9.4 Automation<br />
One of the problems identified earlier was the lack of suitable integrated library<br />
system and as a result only fifty four percent (54%) of the libraries had installed<br />
integrated library system and most of them have got it quite recently, i.e. between 1999<br />
and 2004. The earliest reported was in 1982. Between 1982 and 1998, the automation<br />
208
was rather slow averaging about 3 libraries per year, and between 1999-2003, the pace<br />
quickened to about 12 libraries per year. The fact that only half of the respondents had<br />
installed library system was another major setback when libraries of the world were<br />
actively transforming from print to digital based but some Malaysian libraries were still<br />
without a library system. Progress in library automation and electronic libraries would<br />
logically be the force factor to further accelerate digital library development. As<br />
mentioned earlier, this was due to the fact that it would be very unlikely that Malaysian<br />
libraries would go into digitization without first installing library systems. The<br />
researcher‟s twenty years experience as practicing librarian had witnessed this trend and<br />
the field works done at initial stage of the research had confirmed this. When they were<br />
fully automated, at least some of the basic infrastructures such as Web OPAC would be<br />
there in place. It was just a matter of taking one step further and exploring all new<br />
possibilities.<br />
There had been a tendency to install locally developed library system as shown<br />
below but unfortunately Integrated Library Management Utility (ILMU), a joint venture<br />
between MARA University of Technology (UiTM) and Paradigm ceased operation in<br />
October 2007.<br />
209
Percentage<br />
25<br />
20<br />
15<br />
10<br />
5<br />
0<br />
21<br />
15<br />
10<br />
9<br />
6<br />
5 5<br />
ILMU VTLS Sispukom CDS / ISIS Techlib GEAC Micro VTLS WININIS CLM, CLS, PUSTAKAWAN, HORIZON Supamax, Winnebago, DOBIS, Library World and DNIX<br />
Figure 4.8: Automation<br />
Percentage<br />
50<br />
45<br />
40<br />
35<br />
30<br />
25<br />
20<br />
15<br />
10<br />
5<br />
0<br />
OPAC<br />
46<br />
36 35<br />
Figure 4.9: Online Services<br />
Online circulation<br />
Web OPAC<br />
Website services<br />
26 26<br />
Online reservation<br />
Automation<br />
Online Services<br />
Online registration<br />
20 20 20<br />
Online reference enquiry<br />
Hypermedia<br />
Online acquisition<br />
15 13<br />
Online SDI<br />
Self-check machine<br />
4<br />
3<br />
10 8 7 5<br />
As a result of the problems of IT personnel, lack of budget, lack of digital library<br />
initiatives and lack of IT training, online services were still minimal and comprised only<br />
the basic library functions as shown above. But at least they were transforming<br />
Mobile internet services<br />
Online inter library loan<br />
(SPP)<br />
Smart card<br />
2<br />
210
electronically and providing some important user online services even though the<br />
percentages were rather low. The widespread of web OPAC and web site services were<br />
good indicators. Again Malaysian libraries were advancing albeit slow but progressing.<br />
4.9.5 IT Facilities<br />
Universal access was the keyword with respect to digital library information<br />
services. Information infrastructure and ICT facilities were prerequisite without which<br />
online services might not be possible. Again these were also at the minimal level as<br />
shown below.<br />
Percentage<br />
60<br />
50<br />
40<br />
30<br />
20<br />
10<br />
0<br />
48<br />
41<br />
22 22<br />
LAN Intranet Internet WAN Telnet Extranet<br />
Figure 4.10: IT Facilities<br />
IT Facilities<br />
Digital library‟s existence is totally dependent on Internet facilities where World<br />
Wide Web would be in full operational to enable transboarder data flow. These findings<br />
somehow reinforced the earlier finding which had identified that lack of IT facilities as<br />
12<br />
6<br />
211
one of the problems facing Malaysian libraries. The fact that only 22% had Internet<br />
access in the cyber era was indeed surprising and disappointing. Automatically for the<br />
other 78% of the libraries there would be no virtual access and services and definitely<br />
digital library development would be out of question.<br />
It was quite difficult to believe in the digital age that there were still some<br />
Malaysian libraries operating without any PCs. Only 83% of the respondent did possess<br />
PCs in varying numbers and the biggest percentage was within the range of 1-5. This<br />
was also not a good indicator for digital library development. The availability of PCs<br />
meant the possibility of online services. And the number of PCs owned in this study<br />
corresponded very much with the number of PCs with Internet connection.<br />
Percentage<br />
40<br />
30<br />
20<br />
10<br />
0<br />
37<br />
15 13<br />
1-5 PCs 6-10 PCs 11-20 PCs 21-50 PCs 51-100<br />
PCs<br />
Figure 4.11: IT Facilities<br />
4.9.6 Data base subscription<br />
IT Facilities<br />
10<br />
3<br />
5<br />
>100 PCs<br />
Subscriptions to local and foreign databases did not show much different in term<br />
of percentages. Average for local database subscription was 33% and for foreign<br />
database subscription was 31.6%. Those subscribing to between 1-3 databases, 27%<br />
were local while 19% was foreign. Between 4-6, 3% was local while 5% was foreign.<br />
Between 7-10, 3% was local while 2.7% was foreign. While subscriptions to local<br />
212
databases stopped at a range of between 7-10, foreign databases subscription continues<br />
to a higher range till between 51-100. The percentage for these categories was all below<br />
1%. But subscription for the 51-100 databases was represented by 1.3%. Therefore a<br />
conclusion could be made that Malaysian libraries subscribed more to foreign databases<br />
as compared to local data bases. Three inferences could be drawn here. First there<br />
wasn‟t enough local databases to subscribe to; second if there was any, it might not be<br />
relevant to organizational needs; third foreign databases were plenty in the market and<br />
in multidisciplinary subjects.<br />
4.9.7 IT personnel and technical support for library automation<br />
Earlier it was found that IT personnel constitute an average of only 2 persons /<br />
library. The shortage of IT personnel was further intensified by another finding that 56%<br />
of the libraries were dependent on IT units of their parent organizations for technical<br />
support. The tendency to depend on parent organization‟s IT unit was not a very<br />
encouraging phenomenon because at times libraries would have to cue for jobs to be<br />
done. As a result of the shortage, outsourcing for digitization works accounted for 19%<br />
and only 17% did have their own internal IT units. What was needed by librarians was<br />
actually intensive ICT training and this was what suggested under opinion when they<br />
strongly felt that information professionals must embrace technology and not to leave<br />
everything to the computer science people.<br />
4.9.8 ICT Training<br />
As for ICT training, 42% of the libraries did engaged in both in-house and<br />
external trainers. But in-house training alone accounted for 24% and self–trained was<br />
213
epresented by 23%. Those engaging external trainers accounted for only 14%. Earlier it<br />
was found that the most top problems faced by all libraries were the lack of IT<br />
personnel. Therefore this problem should have been substantiated by intensive training.<br />
This could be the reason why many of the librarians had resorted to undertake self-<br />
training. This was further intensified by the fact that 70% of the libraries reported<br />
having ICT training of less than one week. Short courses might not what they required.<br />
With ICT changing like the speed of light, training should be in tandem with the<br />
development itself. A week of training could expose them only to basic skills or just a<br />
refresher course. Those attending courses between 1 - 3 weeks but less than a month<br />
were 23%, as compared to about 70% that constituted less than a week. For courses that<br />
were more than 3 months was only represented by 5%.<br />
The above phenomena accounted for the high dependency on parent<br />
organizations IT unit as already mentioned above. Technically, librarians could not<br />
stand on their own as yet for digitization works. And looking at the kinds of ICT<br />
training that they had been sent, 72% was on application software, 66% on introduction<br />
to computers, Internet and World Wide Web 51%, and web design 40%. More ICT<br />
inclined courses pertinent to digital library development such as database management,<br />
information system development, programming and telecommunication and networking<br />
were represented by only small percentages i.e. 15%, 10%, and 9.4% respectively,<br />
which were insufficient.<br />
4.9.9 Digitization<br />
Digitization of library materials meant creating and transforming some of the<br />
library‟s print holding into digital format, either through information surrogates, born<br />
214
digital materials and giving access to digital information through subscription of e-<br />
resources, as part of digital library initiatives. The survey showed that only 29% had<br />
done some kind of digitization works, while 71% had not done anything as yet. Earlier it<br />
was also found out that 55% of the libraries were still print-based and only 36% had<br />
turned hybrid. Comparatively, the state/public group had the highest proportion of its<br />
libraries digitizing (63%), followed by special libraries 30% and academic libraries<br />
21%.<br />
The development of Malaysian libraries had actually begun with the introduction<br />
of library automation in 1978. Then it progressed further from electronic and networked<br />
environment and then to digital library concept. In short from MALMARC to PERDANA.<br />
For a period span of about 25 years, having only 29% of the libraries had done<br />
digitization works and where 55% of the libraries were still print-based, the<br />
development was seemed to be relatively slow. As noted earlier under digital library<br />
planning, when digital library initiatives were taking shape in the western world,<br />
majority of Malaysian libraries were only planning to automate/going online.<br />
Comparatively, the American Memory Project had digitized almost 9 million items and<br />
France‟s Gallica, was offering 90,000 volumes in image format, 1200 volumes in<br />
searchable text format, 500 sound recordings and 80,000 digitized still images<br />
(http://www.bnf.fr/pages/zNavigat/fraem/version_anglaise.htm?ancre=english.htm). The<br />
Koninklijke Bibliotheek, of Netherlands was planning mass digitization from 2007 –<br />
2011, putting online 8 million pages from colonial Dutch daily newspapers (Klijn,<br />
2008). Europeana, started in July 2007 had initially 2 million digital collections of texts,<br />
images, audio files and movies and the number was projected to reach 6 million items<br />
215
y 2010 (Landon, 2009). The Portal of the Association of Computing Machinery had<br />
54,000 online articles from 30 journals it ever published (http://portal.acm.org/dl.cfm).<br />
European Commission‟s digital library initiative under the EU‟s i2010 strategy, aimed<br />
to make over the next 5 years, 6 million resources accessible through the European<br />
Digital Library web portal and the cooperation between Europe‟s national libraries in<br />
2006, would see digitized objects increasing from 2 million in 2008 to 6 million in 2010.<br />
The National Library of Malaysia had digitized 600,000 pages as at September 2008.<br />
Percentage<br />
60<br />
50<br />
40<br />
30<br />
20<br />
10<br />
0<br />
Newspaper cutting<br />
56<br />
33<br />
31 30<br />
Articles, books and<br />
theses<br />
Conference papers /<br />
proceedings<br />
Booklets / leaflets /<br />
pamphlets<br />
Photo collection<br />
28<br />
20 20<br />
Organizational special<br />
reports<br />
Figure 4.12: Materials Digitized<br />
Materials digitized<br />
Minutes of meeting<br />
6<br />
Patents &<br />
specifications<br />
Maps<br />
8<br />
Archival materials<br />
14<br />
23<br />
Newsletters / house<br />
organs<br />
17 17<br />
If we look deeper at the choices of materials digitized, these were very much<br />
localized materials pertaining to the organization‟s themselves, their own internal<br />
publications and were meant mainly for internal usage. If we might infer, it seemed that<br />
the main aim of digitization was to preserve these materials to be part of the institutional<br />
Occasional papers<br />
Technical report<br />
Speeches<br />
22<br />
Circulars<br />
19<br />
Standards<br />
8<br />
Manuscripts<br />
6<br />
216
memory systems and by digitizing their own internal publications, they did not have to<br />
infringe on any copyright matters or get involved with any legal matters. The other<br />
possible reason could be to solve space problems since this had earlier been identified as<br />
one of the problems faced. Information surrogate in the form of digitizing internal<br />
organizational publications seemed to be the favorite approach for digital library<br />
initiatives followed by subscription to commercial online databases and e-journals.<br />
The above inference was further supported by the next finding i.e. only 12% of<br />
the libraries flashed on the World Wide Web as a public domain whatever that they had<br />
digitized. Majority 54% flashed or uploaded only selected materials and 33% didn‟t put<br />
their digitized material on the web, only planning to do it in the near future. So, it could<br />
be further inferred that Malaysian libraries digitize not so much for resource sharing,<br />
which was a fundamental concept of digital library environment but rather using it as a<br />
new platform for preservation or institutional memory and at the same time to increase<br />
online or digital services within their own territory.<br />
Libraries undertaking digitization works preferred to buy their own equipment<br />
and did it themselves within the library premise despite digitization works had to be<br />
done with the same number of existing staff. This was represented by 45% and<br />
outsourcing to local private company was the second best choice (41%) and only 14%<br />
depended on organization‟s IT unit. Even though 56% of the libraries depended on their<br />
respective parent organization IT units for technical support, but for digitization works,<br />
they prefered buying their own equipment and outsourcing. As mentioned earlier, total<br />
dependent on parent organization‟s IT unit would slows down development growth as<br />
all the other divisions together with the libraries would have to cue for works to be done.<br />
217
So, to speed up digitization process they had to resort to other alternatives i.e. buying<br />
their own equipment and outsourcing.<br />
One of the findings earlier under library holdings was that collection on CDs was<br />
on the increase. In terms of importance, CDs came third after monograph and journal<br />
collections. This finding was further intensified by the storage media adopted for<br />
digitization purposes. CD tops the list represented by 63% of libraries choosing this<br />
medium, followed by PDF and hard disc 50% each, floppy disc 20% and enterprise<br />
storage system 19%. Other media were less significant; DVD 6%, miniature mobile<br />
storage media 4.7% and PC cards 3%.<br />
However the use of CD-ROMs in the west had declined considerably in the<br />
digital age (Pack and Pemberton, 1999).<br />
4.9.10 Budget for digitization<br />
The literature review earlier had revealed that budget was indeed very important<br />
as one of the successful determining factors with respect to the amount of digitization<br />
works that libraries could have possibly done. Unfortunately, to many of the libraries for<br />
this study, budget was classified as confidential and therefore couldn‟t be released.<br />
However data could still be generated from the 54 responding libraries. The total<br />
amount of budget on digitization works varies greatly between RM25, 000 to RM2<br />
million as shown below:<br />
218
Percentage<br />
30<br />
25<br />
20<br />
15<br />
10<br />
5<br />
0<br />
28<br />
RM25, 000-<br />
RM50, 000<br />
17<br />
RM50, 000-<br />
RM75, 000<br />
11<br />
RM75, 000-<br />
RM100, 000<br />
Figure 4.13: Budget for Digitization<br />
Budget for digitization<br />
15<br />
RM100, 000-<br />
RM200, 000<br />
13<br />
RM200, 000-<br />
RM300, 000<br />
6<br />
RM300, 000-<br />
RM400, 000<br />
4<br />
½ million-1<br />
million<br />
5<br />
more than 2<br />
million<br />
The above statistics were drawn from only 54 libraries that were willing to<br />
disclose their budgets for digitization projects. Even though the figures were not well<br />
represented from the total respondents but the researcher had to respect the libraries<br />
decisions to classify their budget as confidential. However, the statistics did provide a<br />
glimpse of financial standings of libraries in terms of budget provision for digitization<br />
purposes.<br />
Looking at the statistics, 56% of the libraries had below RM100, 000 and this<br />
was not an encouraging figure. The literature review had revealed that almost all the<br />
digitization projects mentioned were all in the multi-million brackets. There were<br />
several factors that might lead to this scenario. Earlier it was found that libraries did face<br />
problems in terms of staffing, IT personnel, budget, digital library initiatives, ICT<br />
training, under utilization of digital resources, renewal subscriptions of online data bases<br />
and to a lesser extent, IT facilities and infrastructure. Digital library development<br />
219
equired an extensive long-term planning that needed to be staggered into several<br />
phases, over a period of time that might take several years to accomplish. It could be<br />
inferred that Malaysian libraries were still configuring and planning to embark on a<br />
massive digitization projects but they were now doing it, steadily albeit slow. They were<br />
still experimenting, trying and taking smaller steps but definitely progressing.<br />
As we realized, digitization process was a big undertaking, requiring huge<br />
investment and capital expenditure. This was one of the reasons why in other countries,<br />
most of the digitization projects were done on a collaborative basis, where operational<br />
costs and expertise were shared wherever possible. However, the scenario was not all<br />
too bad. Four percent (4%) of the libraries did have between RM1/2-1 million and 5%<br />
did have budget of more than RM 2 million. Comparatively small to match the western<br />
digital library initiatives‟ budget allocation but positively a good start.<br />
4.9.11 Website contents<br />
There were many approaches to the development of a digital library. One of the<br />
most popular among Malaysian libraries was the development of websites where<br />
electronic or digital access to information that used to be in the printed form was now<br />
provided online or virtual. The research had posted 18 possible areas with respect to the<br />
contents of websites.<br />
220
Percentage<br />
100<br />
90<br />
80<br />
70<br />
60<br />
50<br />
40<br />
30<br />
20<br />
10<br />
0<br />
General information<br />
89<br />
E-mail<br />
70 69<br />
Web-OPAC<br />
63<br />
Hypertext linkages to<br />
related websites<br />
59<br />
Hypertext linkages to other<br />
agencies within the same …<br />
Figure 4.14: Website Contents<br />
Feedback and comment<br />
Website contents<br />
53 52<br />
New book list<br />
Calendar of events<br />
42 42<br />
E-forms<br />
36 34 33 33 30<br />
Access to local content<br />
databases<br />
FAQ<br />
Suggestion page<br />
Electronic document<br />
delivery service<br />
Community information<br />
database<br />
From the statistics above, several inferences could be made. Most of the contents<br />
of the websites were the information that they used to have them printed on their<br />
brochures or leaflets. In a way they had moved one step further. With digitization, they<br />
had made it available online. Global access to many of the other related digital contents<br />
of other organizations‟ web sites were also possible through the hypertext linkages thus<br />
increasing virtual communications. The presence of hypertext linkages helped users in<br />
their searching for more related information and might also help reduced reference<br />
enquiries. It might also substitute the production of subject bibliographies, in the new<br />
form. Their potential users had grown by leap and bound, cutting across physical<br />
boundaries. The availability of web-OPAC, which was one of the outcomes of library<br />
automation, had facilitated further the management of Inter Library Loan. It also helps<br />
copy cataloging and thus reducing original cataloging time and maintaining<br />
standardization as far as call number and subject headings were concerned. Thus it could<br />
Location maps<br />
17<br />
221
e seen that the websites were fully utilized as a platform to disseminate information<br />
that previously used to be in the printed form. They were now used to facilitate and<br />
enhance library routine functions with respect to enquiries pertaining to the normal<br />
libraries‟ enquiries and the provision of linkages to other local and foreign related<br />
websites.<br />
It could be also be inferred that the website services were the initial attempts<br />
toward online/digital services and gradually the libraries would be putting up more<br />
varieties. As statistics showed, 52% of the libraries had converted to virtual accession<br />
list, 50% had started to provide access to e-book through their websites and another 52%<br />
for the provision of online databases.<br />
4.9.12 Problems related to digitization<br />
Since digital library development was a new phenomenon, the research also<br />
wishes to ascertain the kinds of problems that these libraries might have encountered in<br />
the process of going digital. Earlier it was found that only 29% of the respondents had<br />
started some kind of digitization works and 71% had not done anything as yet.<br />
Definitely this was not a good indicator. What could possibly the reasons that many of<br />
the libraries had not done anything despite the fact that the topic was gaining momentum<br />
worldwide. The questionnaire had posted 18 possible problems and 6 items had been<br />
classified as the top most problems as shown below.<br />
The first digitization related problem on staff shortage (digitization project done<br />
with existing staff) further intensified earlier finding that stated lack of IT personnel<br />
(64%) as one of the general problems faced by Malaysian libraries. Similarly cost factor<br />
(60%) also bore similar weightage as lack of budget (63%).<br />
222
From the interview sessions with the 38 libraries that the researcher did for the<br />
qualitative data, it could be seen that all of these libraries were planning and doing their<br />
own digitizing works independently, depending on whatever resources they had at their<br />
disposal, where there was an absent of any concerted or collaborative efforts at any level<br />
Percentage<br />
80<br />
70<br />
60<br />
50<br />
40<br />
30<br />
20<br />
10<br />
0<br />
74<br />
Staff<br />
shortage<br />
71<br />
Absence of<br />
a blueprint<br />
Problems related to digitization<br />
64<br />
Absence of<br />
a NII Policy<br />
Figure 4.15: Problems Related to Digitization<br />
Cost factor<br />
60<br />
57<br />
Lack of role<br />
model<br />
51<br />
Copyright<br />
act<br />
clearance<br />
among the libraries that could be the platform for some kind of cooperative work, except<br />
those spearheaded by National Library of Malaysia or PERPUN. The involvement of the<br />
respondents with digital library projects under the National Library of Malaysia was also<br />
very small i.e. only 11% and 89% had never been involved. Everyone was doing their<br />
own work, at their own pace; they did communicate through the invisible college but not<br />
through well chartered and published guidelines.<br />
The above observation had been further justified when 71% of the respondents<br />
felt that the absence of a blueprint that might serve as a guideline for digital library<br />
development as another one of the problems faced. The high percentage for this problem<br />
could be taken as an indicator that the Malaysian librarians were ready to move forward<br />
223
and embrace digital environment but needed the right guidance and reference so that<br />
they would be moving in the right direction in tandem with the concept of world‟s<br />
digital library development. The next problem faced was the absence of National<br />
Information Infrastructure policy (64%). Many felt that digital policy with respect to<br />
national information infrastructure should be formulated by the authority concerned to<br />
help putting in place the much needed basic information infrastructure to keep regulate<br />
digital library development.<br />
Since 55% of the respondents declared themselves as print-based, 36% hybrid<br />
and digital libraries accounts for only 1.3%, therefore, lack of role model where the<br />
libraries could learn, emulate and evaluate before starting their own digital library works<br />
was also one of the problems faced. Due to the lack of local published literature on<br />
digital library initiatives and the absent of an inventory of national digital library<br />
initiatives, no one knew what the others were doing and as such nothing could be<br />
learned or discussed from those who had initially started and progressed in digitization<br />
works. This lack of common official platform, called for an urgent extensive<br />
collaborative digital library projects among all Malaysian libraries and other related<br />
information agencies.<br />
The last problem identified was related to Copyright Act Clearance (51%). There<br />
was a co-relation between this problem and materials digitized by libraries. Earlier<br />
findings revealed that information surrogate was one of the most popular methods<br />
chosen by Malaysian libraries as a short-cut to the formation of a digital library. Internal<br />
organizational publications such as newspaper cuttings was the most widely digitized,<br />
followed by theses / dissertations, articles, books, conference papers, pamphlets,<br />
224
technical reports, speeches, minutes of meetings, maps, manuscripts and circulars.<br />
Therefore it could be inferred that in the process of transforming these materials into<br />
digitized form, they did face some copyright problems. This had greatly contributed to<br />
the reason for resorting to digitizing mainly their internal organizational publications to<br />
avoid any legal problems.<br />
From the total list of digitization related problems, those six mentioned above<br />
top the list scoring more than 50%. They do face other problems albeit insignificantly.<br />
The least of the problems i.e. 20% was related to management support. In other words,<br />
libraries do get management support literally i.e. they were keen on transforming the<br />
libraries into digital based but in some cases this had not been translated into monetary<br />
grant. Hence the problems of budget that had always besieged library development but<br />
at least as the evidence showed that management awareness was there in place. So it was<br />
up to the librarians to capitalize on this good indicator and work harder to convince the<br />
top management level in order to get more budgets for digitization works.<br />
Those problems discussed above might also have contributed to another finding<br />
of the research i.e. only 28% of the libraries had developed some kind of in-house<br />
databases, while 72% had never done so. Developing in-house databases might stem<br />
from two sources i.e. information surrogates and born digital materials (through local<br />
contents). Lack of local contents was not a major problem. Only 35% said it was so. So<br />
again another inference could be made for the low level of digitization works i.e. lack of<br />
staff, expertise and budget.<br />
225
4.9.13 Digital Library Planning<br />
The questionnaire consisted of one open ended question with regards to digital<br />
library future plans that they might have. This question hoped to gauge all kinds of plans<br />
that were in the pipeline for Malaysian libraries. It seemed that some of their digital<br />
library planning (the highest percentage) was still surrounding the attempts towards<br />
automation and electronic libraries, which reflects their levels of perceptions, readiness<br />
or preparedness towards digital library environment. It seemed that they would automate<br />
first prior to planning for digital libraries, because by automating, at least the basic ICT<br />
infrastructure would supposedly be in place. That‟s why some of the digital library<br />
planning had included promoting the electronic media and acquiring/subscribing to<br />
more e-resources, as the fastest way of giving access to digital materials. This was in<br />
tandem with one of Cleveland‟s methods of building digital collections i.e. giving access<br />
to external materials, which Malaysian libraries had been capitalizing on.<br />
What seemed to be missing in their future planning, which seemed to be very<br />
basic and loose, were a concrete long term planning and solid digital library initiatives<br />
and there had been no mention whatsoever of collaborative effort between organizations<br />
thus resulting in the small localized independent digital library initiatives that seemed to<br />
still remained at the preliminary stage.<br />
Another major concerned was that only 62% did attempt this question. Therefore<br />
it could be inferred that most probably the other 38% did not have any plan as yet, and<br />
9% was at the initial planning stage. For the purpose of convenience, the future plans<br />
had been themed and grouped as shown below:-<br />
226
Percentage<br />
45<br />
40<br />
35<br />
30<br />
25<br />
20<br />
15<br />
10<br />
5<br />
0<br />
40<br />
would be automating<br />
/ going online<br />
12<br />
Update existing<br />
project, to establish<br />
knowledge portal and<br />
to promote the<br />
electronic media.<br />
11<br />
Improve<br />
infrastructure<br />
Figure 4.16: Digital Library Planning<br />
Digital Library Planning<br />
9<br />
8<br />
Initial planning stage Acquire more eresources.<br />
7<br />
Ask for budget<br />
increase<br />
4 4 4<br />
Depend on parent<br />
organizations.<br />
Improve IT<br />
competency<br />
Establish more<br />
linkages and<br />
cooperation<br />
The above plans suggested that they would be automating and going online<br />
through the installation of integrated library system and would provide more web-based<br />
online services and access. In fact some of their planning co-related with the digital<br />
library related problems discussed earlier i.e. budget, infrastructure, training and<br />
dependence on parents‟ organizations IT Unit. That‟s why their plans included to ask for<br />
a budget increase, to improve infrastructure and IT competency and would depend on<br />
the parents‟ organizations initiatives. Many had the intention of digitizing their own<br />
organization‟s publications through the establishment of knowledge portals, reflecting<br />
efforts to actually establishing institutional memories and it seemed that Malaysian<br />
libraries preferred this approach when planning for digitization. Since Malaysian<br />
libraries were facing space problems presumably by digitizing their own materials, this<br />
227
might help solved space problems and provide an avenue for the purpose of in-house<br />
archive preservation.<br />
Other plans included to update existing project, acquiring more hardware and<br />
software, installing wide area network and enhancing Internet access. As stated above,<br />
they also wished to acquire more e-resources, ask for budget increase, to improve on<br />
staff IT competency and intended to establish linkages and cooperation with other<br />
libraries including the National Library of Malaysia. This was very contradicting with<br />
the western digital library initiatives. From the literature review, it was clear that all of<br />
the digitization projects done were on a collaborative basis, either locally, reginally or<br />
internationally.<br />
From the above statements on digital library planning that had been collapsed,<br />
two inferences could be made. First, Malaysian digital libraries‟ planning related<br />
significantly to solve the problems that had been identified earlier such as lack of<br />
infrastructure and IT facility, staffing, installation of library systems, acquiring more e-<br />
resources, asked for a budget increase and staff IT competency. Secondly, the planning<br />
as a whole was too localized, mainly at the initial stage, focusing on the digitization of<br />
organizational publications, no big scale planning and without any concrete<br />
collaborative efforts among them. They seemed to be planning independently, what they<br />
thought would be best for their libraries without any specific guidance from any main<br />
body or digital library authority. This had partly contributed to another finding later in<br />
another research question when it was found that 95% of the respondents agreed that the<br />
National Library of Malaysia should publish a digital library blue print that would serve<br />
as a guideline for digitization works in Malaysia.<br />
228
4.9.14 Opinions of Library Heads<br />
The last part of the questionnaire attempted to seek general opinions of heads of<br />
libraries on their perception on the phenomenal growth of digital library development in<br />
Malaysia, where 89% of them were positive about it. They strongly supported and<br />
believed that Malaysian libraries must move toward digital library development and that<br />
users too were ready (78%) for new digital services. However only 53% thought that<br />
digital format would dominate the entirely library scene, while 47% felt the opposite.<br />
Several deductions could be made.<br />
Firstly, majority of head of libraries were aware and realized the fact that<br />
traditional library operations and services were bound to change. But what they felt was<br />
not the same as what was happening. The change had not been drastic. Printed materials<br />
were still dominating. Digital library initiative planning was still minimal with high<br />
dependency on the National Library of Malaysia, together with other scores of problems<br />
that they were skeptical about Malaysian libraries turning 100% digital, even though it<br />
was earlier found that 52% of the libraries did plan to be digital by 2010. They had some<br />
reservations that the current scenario would change drastically in the near future. The<br />
last part of this question re-affirmed those above. 70% of the libraries had not<br />
experienced any change in collection development policy. Meaning they still purchased<br />
what they used to purchase previously. Only 30% had experienced some changes in the<br />
collection development policy, probably catering to the increase in the acquisition of<br />
digital information.<br />
The next part of the questionnaire, consisting of seven general questions, was<br />
another attempt to establish the dimension of development, or the platform, the pace at<br />
which digital library development would takes place. As shown below, high percentage<br />
229
or majority of the respondents felt that the National Library of Malaysia should publish<br />
a blueprint that would serve as a guideline for digitization works. Being the prime<br />
mover of national library development, hopes were high for the National Library of<br />
Malaysia to be proactive in establishing a set of guidelines that provides the mechanism<br />
for going digital.<br />
From the field works and interview sessions made during the year 2002-2004, it<br />
was obvious that libraries started digitization works very much on their own, without<br />
one unified blueprint that they could consult, count or depend on. Each library, taking<br />
their own approaches and experimenting at times, what and how they should begin with.<br />
As each was developing on their own, collaboration was very minimal. The presence of<br />
a blueprint of digital library development and digitization works would serve well for<br />
Malaysian libraries as it would help solved a lot of basic questions and provide the right<br />
mechanism to adopt the right digital library concepts. A blueprint would also provide<br />
some form of standardization and serve as the national reference source or<br />
documentation for digital library operations and services that would generally be<br />
accepted by the Malaysian library community.<br />
Many of them agreed that the PERDANA Project did reflect some degree of<br />
digital library development in Malaysia even though in terms of participation only 11%<br />
had been directly involved in that project. Since only 29% had done some kinds of<br />
digitization works, many were of the opinion that the hybrid type was the best for<br />
Malaysian libraries. This also coincided with the early finding whereby only 1.3% had<br />
categorized themselves as digital libraries. This finding was further intensified by<br />
another finding that books were here to stay despite the rapid expansion of online<br />
230
Percentage<br />
120<br />
100<br />
80<br />
60<br />
40<br />
20<br />
0<br />
Blueprint<br />
95<br />
81<br />
PERDANA Project<br />
is national DLIs<br />
85<br />
Figure 4.17: Opinions of Library Heads<br />
Opinions of Library Heads<br />
Hybrid DL<br />
Books to stay<br />
91<br />
40<br />
Threat by computer<br />
people<br />
96<br />
IPs must embrace<br />
ICT<br />
services. Even though users were ready for online library services as reported by earlier<br />
finding but the Malaysians custodians felt that print would stay despite the<br />
overwhelming digital library development worldwide. As such 60% did not feel<br />
threatened by the computer science people. However 40% felt the other way round.<br />
However a high percentage agreed that librarians must embrace ICT, indirectly sending<br />
a message that they should not be too dependent on the computer science experts.<br />
Extinction of TL<br />
44<br />
231
From the above quantitative findings, Malaysian libraries were seemed quite<br />
ready and had embraced digital library concepts to some extent where digital library<br />
services and operations were permeating into the scene but more impetus were needed to<br />
progress further due to the facts that as of 2004:<br />
� Some libraries were still run by non professional librarians.<br />
� Lack of staff especially technical expertise.<br />
� Only 54% of the respondents had installed library system.<br />
� 17.5% did not answer the question on the number of PCs owned and only 5% had<br />
more than 100 PCs.<br />
� High dependency on IT Unit of parent organizations for technical support.<br />
� The domination of print materials in all libraries.<br />
� The introduction of basic online library services (OPAC, circulation, website<br />
services, reservation, registration, reference and SDI).<br />
� Press cuttings and organizational publications formed the bulk of digitized<br />
materials.<br />
� Minimum ICT training.<br />
� Modest ICT infrastructure.<br />
� Only 29% had done digitization works.<br />
� Only 11% had been involved in the national digital library project (PERDANA).<br />
� Web sites were dominated by private domain.<br />
� Only 1.3% had budget above RM 2 million.<br />
� Digitization related problems were basic in nature (staff, blueprint, NII, budget,<br />
role model, copyright act).<br />
� There had been no significant change in the collection development policy.<br />
� There had been no concrete and long term digital library future planning.<br />
� There had been no international collaboration as yet.<br />
The scarce of some of the above basic necessities were not good indicators for<br />
the national digital library development. Although the digital library planning seemed to<br />
be basic and lack of depth but library heads were all pessimistic, users were ready and<br />
232
their preference for hybrid library was commendable. With the right infrastructure (such<br />
as a blueprint, ICT and national information infrastructure), budget, training,<br />
cooperation/collaboration and leadership from the relevant authorities, they could go<br />
further. The necessary platforms for digital library development need to be created and the<br />
existing ones enhanced, so that the path would become clearer.<br />
What follows in Chapter 5 were findings from the qualitative data based on the 12<br />
structured interview questions from a total of 38 interview sessions, looking for some<br />
form of convergence of findings.<br />
233