

The use of quantitative light-induced fluorescence (QLF) to ... - Library
The use of quantitative light-induced fluorescence (QLF) to ... - Library
The use of quantitative light-induced fluorescence (QLF) to ... - Library

Create successful ePaper yourself
Turn your PDF publications into a flip-book with our unique Google optimized e-Paper software.
4 JOURNAL OF FORENSIC SCIENCES<br />
pr<strong>of</strong>orma and sent back <strong>to</strong> the authors. All examiners correctly<br />
completed both attempts.<br />
Statistical Analysis<br />
Data were entered in<strong>to</strong> Micros<strong>of</strong>t Excel from where it was <strong>use</strong>d<br />
in the PEPI suite <strong>of</strong> statistical programs (13). Analysis obtained<br />
values for percentage agreement (% correct), specificity, sensitivity,<br />
and Kappa (chance corrected agreement). A paired t-test was<br />
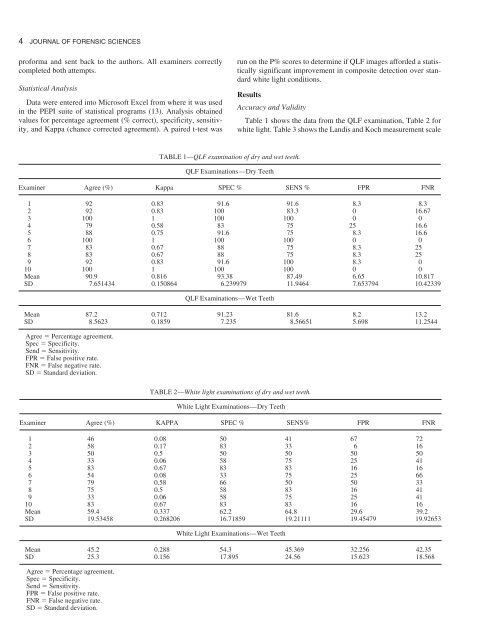
TABLE 1—<strong>QLF</strong> examination <strong>of</strong> dry and wet teeth.<br />
<strong>QLF</strong> Examinations—Dry Teeth<br />
run on the P% scores <strong>to</strong> determine if <strong>QLF</strong> images afforded a statistically<br />
significant improvement in composite detection over standard<br />
white <strong>light</strong> conditions.<br />
Results<br />
Accuracy and Validity<br />
Table 1 shows the data from the <strong>QLF</strong> examination, Table 2 for<br />
white <strong>light</strong>. Table 3 shows the Landis and Koch measurement scale<br />
Examiner Agree (%) Kappa SPEC % SENS % FPR FNR<br />
1 92 0.83 91.6 91.6 8.3 8.3<br />
2 92 0.83 100 83.3 0 16.67<br />
3 100 1 100 100 0 0<br />
4 79 0.58 83 75 25 16.6<br />
5 88 0.75 91.6 75 8.3 16.6<br />
6 100 1 100 100 0 0<br />
7 83 0.67 88 75 8.3 25<br />
8 83 0.67 88 75 8.3 25<br />
9 92 0.83 91.6 100 8.3 0<br />
10 100 1 100 100 0 0<br />
Mean 90.9 0.816 93.38 87.49 6.65 10.817<br />
SD 7.651434 0.150864 6.239979 11.9464 7.653794 10.42339<br />
<strong>QLF</strong> Examinations—Wet Teeth<br />
Mean 87.2 0.712 91.23 81.6 8.2 13.2<br />
SD 8.5623 0.1859 7.235 8.56651 5.698 11.2544<br />
Agree � Percentage agreement.<br />
Spec � Specificity.<br />
Send � Sensitivity.<br />
FPR � False positive rate.<br />
FNR � False negative rate.<br />
SD � Standard deviation.<br />
TABLE 2—White <strong>light</strong> examinations <strong>of</strong> dry and wet teeth.<br />
White Light Examinations—Dry Teeth<br />
Examiner Agree (%) KAPPA SPEC % SENS% FPR FNR<br />
1 46 0.08 50 41 67 72<br />
2 58 0.17 83 33 6 16<br />
3 50 0.5 50 50 50 50<br />
4 33 0.06 58 75 25 41<br />
5 83 0.67 83 83 16 16<br />
6 54 0.08 33 75 25 66<br />
7 79 0.58 66 50 50 33<br />
8 75 0.5 58 83 16 41<br />
9 33 0.06 58 75 25 41<br />
10 83 0.67 83 83 16 16<br />
Mean 59.4 0.337 62.2 64.8 29.6 39.2<br />
SD 19.53458 0.268206 16.71859 19.21111 19.45479 19.92653<br />
White Light Examinations—Wet Teeth<br />
Mean 45.2 0.288 54.3 45.369 32.256 42.35<br />
SD 25.3 0.156 17.895 24.56 15.623 18.568<br />
Agree � Percentage agreement.<br />
Spec � Specificity.<br />
Send � Sensitivity.<br />
FPR � False positive rate.<br />
FNR � False negative rate.<br />
SD � Standard deviation.


