3. Continuous Random Variables
3. Continuous Random Variables
3. Continuous Random Variables

You also want an ePaper? Increase the reach of your titles
YUMPU automatically turns print PDFs into web optimized ePapers that Google loves.
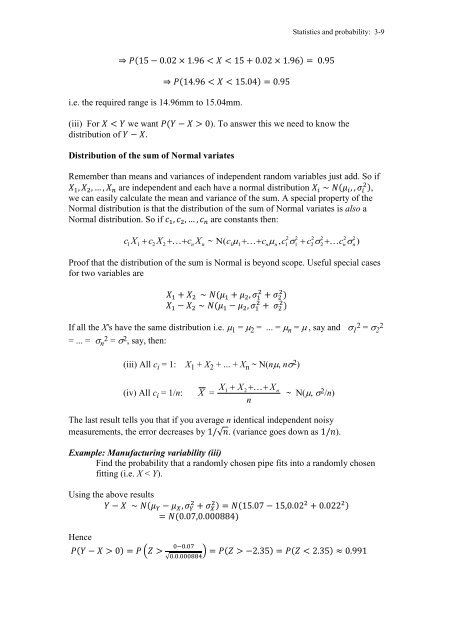
i.e. the required range is 14.96mm to 15.04mm.<br />
Statistics and probability: 3-9<br />
(iii) For we want ). To answer this we need to know the<br />
distribution of<br />
Distribution of the sum of Normal variates<br />
Remember than means and variances of independent random variables just add. So if<br />
are independent and each have a normal distribution ,<br />
we can easily calculate the mean and variance of the sum. A special property of the<br />
Normal distribution is that the distribution of the sum of Normal variates is also a<br />
Normal distribution. So if are constants then:<br />
2 2 2 2 2 2<br />
c X � c X �� �c<br />
X ~ N( c � ���c � , c � � c � ��<br />
c � )<br />
1 1 2 2<br />
n n<br />
1 1 n n 1 1 2 2 n n<br />
Proof that the distribution of the sum is Normal is beyond scope. Useful special cases<br />
for two variables are<br />
If all the X's have the same distribution i.e. � 1 = � 2 = ... = � n = � , say and � 1 2 = �2 2<br />
= ... = � n 2 = � 2 , say, then:<br />
(iii) All c i = 1: X 1 + X 2 + ... + X n ~ N(n�, n� 2 )<br />
(iv) All c i = 1/n: X =<br />
X1 � X 2 ��� X<br />
n<br />
n<br />
~ N(�, � 2 /n)<br />
The last result tells you that if you average n identical independent noisy<br />
measurements, the error decreases by √ . (variance goes down as ).<br />
Example: Manufacturing variability (iii)<br />
Find the probability that a randomly chosen pipe fits into a randomly chosen<br />
fitting (i.e. X < Y).<br />
Using the above results<br />
Hence<br />
(<br />
√ )