December 31, 2001 - National Technical Institute for the Deaf ...
December 31, 2001 - National Technical Institute for the Deaf ...
December 31, 2001 - National Technical Institute for the Deaf ...

You also want an ePaper? Increase the reach of your titles
YUMPU automatically turns print PDFs into web optimized ePapers that Google loves.
R .I .T Rochester <strong>Institute</strong> of Technology<br />
<strong>December</strong> <strong>31</strong>, 2010<br />
The Honorable Arne Duncan<br />
Secretary of Education<br />
U.S. Department of Education<br />
400 Maryland Avenue, S.W.<br />
Washington, DC 20202<br />
Dear Secretary Duncan:<br />
Office of <strong>the</strong> President<br />
George Eastman Building<br />
2 Lomb Memorial Drive<br />
Rochester, New York 14623-5604<br />
585-475-2394 Fax 585-475-5700<br />
NTID’s Annual Report 2010 fulfills <strong>the</strong> requirement of <strong>the</strong> Education of <strong>the</strong> <strong>Deaf</strong> Act that <strong>the</strong> <strong>National</strong> <strong>Technical</strong><br />
<strong>Institute</strong> <strong>for</strong> <strong>the</strong> <strong>Deaf</strong>, a college of Rochester <strong>Institute</strong> of Technology (RIT/NTID), ―… shall prepare and submit<br />
an annual report to <strong>the</strong> Secretary…‖<br />
We are pleased to present this report, our 44 th , <strong>for</strong> it provides a summary of activities undertaken at RIT/NTID<br />
during Fiscal Year 2010.<br />
For <strong>the</strong> fourth year in a row, NTID has increased our enrollment, now totaling 1,521 students, <strong>the</strong> largest<br />
enrollment in our history. New students continue to be attracted to NTID because of <strong>the</strong> excellence of our<br />
academic programs, and more students are continuing <strong>the</strong>ir studies at NTID thanks to both <strong>the</strong> focus on<br />
student retention by faculty and staff and <strong>the</strong> determination and persistence of <strong>the</strong> students we serve. We<br />
graduated a record 306 students in FY 2010 and found that 90 percent of our FY 2009 graduates were<br />
employed this year in spite of <strong>the</strong> current national economic climate. Indeed, we are well positioned to improve<br />
on our successes with <strong>the</strong> launch of our new strategic plan, Strategic Decisions 2020: Shaping NTID’s Future<br />
Through Innovation, developed over <strong>the</strong> past year.<br />
The successes we and our students and graduates have achieved are <strong>the</strong> result of <strong>the</strong> support we receive from<br />
you and so many o<strong>the</strong>rs in <strong>the</strong> federal government. Our identity as an educational institution rests on those you<br />
have charged us to serve, and our mission statement continues to be <strong>the</strong> driving <strong>for</strong>ce behind all that we do:<br />
To provide deaf and hard-of-hearing students with outstanding state-of-<strong>the</strong>-art technical and<br />
professional education programs, complemented by a strong liberal arts and sciences<br />
curriculum, that prepare <strong>the</strong>m to live and work in <strong>the</strong> mainstream of a rapidly changing global<br />
community and enhance <strong>the</strong>ir lifelong learning. Secondarily, NTID prepares professionals to<br />
work in fields related to deafness; undertakes a program of applied research designed to<br />
enhance <strong>the</strong> social, economic and educational accommodation of deaf people; and shares its<br />
knowledge and expertise through outreach and o<strong>the</strong>r in<strong>for</strong>mation dissemination programs.<br />
This report is also available in full to <strong>the</strong> general public at:<br />
www.ntid.rit.edu/media/annual_report2010.pdf<br />
The RIT/NTID community, including students, faculty, staff and friends, are appreciative of <strong>the</strong> guidance and<br />
support you and <strong>the</strong> Department of Education continue to provide NTID.<br />
With warm regards,<br />
William Destler, Ph.D. James J. DeCaro, Ph.D.<br />
President, RIT Professor & Dean Emeritus<br />
Interim President, NTID<br />
Interim Vice President and Dean, RIT
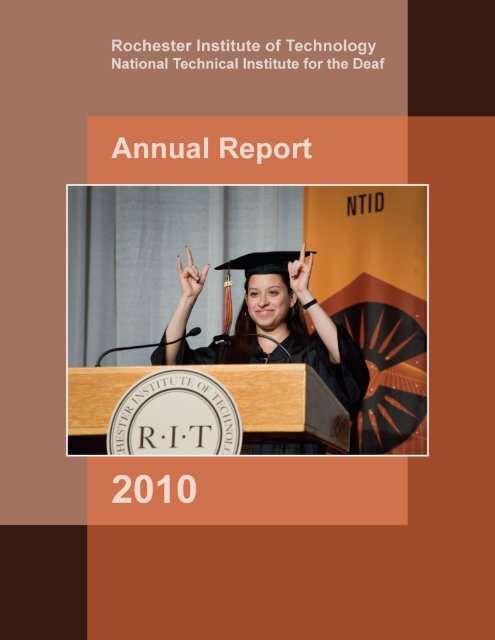
Cover Photos<br />
NTID Commencement Ceremony<br />
The front cover photo was taken in May 2010 during NTID’s commencement ceremony; it shows<br />
Adriana Gaylord, of Houston, Texas, giving a speech to her fellow graduates. Gaylord graduated with an<br />
associate degree in Computer Integrated Machining Technology and was selected as one of NTID’s<br />
delegates to <strong>the</strong> larger RIT commencement ceremony.<br />
While a student, Gaylord held leadership positions with <strong>the</strong> Society of Hispanic Professional Engineers,<br />
<strong>the</strong> Hispanic <strong>Deaf</strong> Club and <strong>the</strong> Department of Engineering Studies Engineering Club. She has worked at<br />
<strong>the</strong> Corpus Christi Army Depot in Corpus Christi, Texas. Gaylord currently is pursuing a BS in<br />
Manufacturing Engineering Technology at RIT.<br />
RIT Convocation <strong>for</strong> New Students and Families<br />
The back cover photo was taken in September 2010 during RIT’s Convocation <strong>for</strong> New Students and<br />
Families; it shows RIT Student Government President and past NTID Student Congress President Greg<br />
Pollock, of Pittsburgh, Pa., welcoming new students and families to RIT.<br />
Pollock is currently pursuing his BS in Professional and <strong>Technical</strong> Communication. He served on <strong>the</strong><br />
NTID President search committee, and in October 2010, was one of four NTID students invited to<br />
participate in a session of Dow Chemical Co.’s Senior Management Potential Program in Midland, Mich.
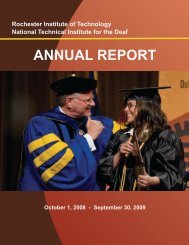
Contents<br />
RIT/NTID graduates pose with RITchie, RIT’s tiger mascot, in NTID’s<br />
Student Development Center.<br />
Contents<br />
<strong>National</strong> <strong>Technical</strong> <strong>Institute</strong> <strong>for</strong> <strong>the</strong> <strong>Deaf</strong>
Note of Explanation<br />
This Annual Report notes activities and accomplishments throughout Fiscal Year 2010 (10/01/09-<br />
09/30/10), corresponding primarily to Academic Year 2009-10. References to Fiscal Year 2011<br />
correspond to characteristics and accomplishments as of fall quarter Academic Year 2010-2011.
NTID FY 2010 Annual Report<br />
Contents<br />
Mission Statement .......................................................................................................................... 1<br />
<strong>National</strong> <strong>Technical</strong> <strong>Institute</strong> <strong>for</strong> <strong>the</strong> <strong>Deaf</strong> at a Glance ...................................................................... 2<br />
Annual Highlights ............................................................................................................................ 3<br />
Executive Summary ........................................................................................................................ 4<br />
The Education of <strong>the</strong> <strong>Deaf</strong> Act ..................................................................................................... 9<br />
Reporting Requirements of <strong>the</strong> Education of <strong>the</strong> <strong>Deaf</strong> Act and <strong>the</strong> Agreement with RIT ....... 10<br />
Per<strong>for</strong>mance Indicators ............................................................................................................... 13<br />
Strategic Planning ........................................................................................................................ 29<br />
Strategic Vision 2010 ............................................................................................................. 30<br />
Strategic Decisions 2020 ......................................................................................................... 35<br />
Admissions and Enrollment ......................................................................................................... 39<br />
Admissions and Enrollment Highlights .................................................................................... 40<br />
Comparative Admissions Data ............................................................................................... 42<br />
Summer Vestibule Program ................................................................................................... 43<br />
Entering Registered Students ................................................................................................. 44<br />
NTID Student Enrollment by Quarter (<strong>Deaf</strong> and Hard-of-Hearing Students Only) ................ 45<br />
Percent of Registered Students with Full-Time Status .......................................................... 46<br />
International Student Recruitment ........................................................................................... 47<br />
Demographic Characteristics of All Entering Students ........................................................... 48<br />
Demographic Characteristics of International Students Compared to U.S. Students ........... 49<br />
ACT In<strong>for</strong>mation on Entering Class (<strong>Deaf</strong> and Hard-of-Hearing Students Only) …………… . 50<br />
Academic Skills of Entering Students ..................................................................................... 51<br />
Hearing Assessment and Cochlear Implant In<strong>for</strong>mation ……………………………… ............ 52<br />
Students with Secondary Disabilities ..................................................................................... 53<br />
Origin of Students and Graduates ………………………………………………………………... 54<br />
Academic Programs ...................................................................................................................... 59<br />
Academic Program Highlights ................................................................................................. 60<br />
Enrollment by Degree Programs ............................................................................................. 69<br />
Average Class Size by Discipline ............................................................................................ 75<br />
Educational Support: Teaching ............................................................................................... 76<br />
American Sign Language-English Interpretation Program ...................................................... 79<br />
Master of Science in Secondary Education of Students Who Are <strong>Deaf</strong> or Hard-of-Hearing .. 80<br />
Cooperative Work Experiences ............................................................................................... 81<br />
Science, Technology, Engineering and Ma<strong>the</strong>matics (STEM) Activities ................................ 82<br />
Student Support Services ............................................................................................................. 85<br />
Student Support Services Highlights ...................................................................................... 86<br />
Support Services ..................................................................................................................... 88<br />
Student Access Services .............................................................................................................. 89<br />
Student Access Services Highlights ........................................................................................ 90<br />
Access Services: Interpreting, Notetaking and Real-Time Captioning ................................... 91<br />
Access Services: Interpreting Services ................................................................................... 92<br />
Access Services: Real-Time Captioning (C-Print ® ) Services ................................................. 93<br />
Access Services: Staff Training ............................................................................................. 94
Contents (continued)<br />
Persistence, Graduation and Employment ................................................................................ 95<br />
Persistence, Graduation and Employment Highlights ............................................................. 96<br />
First-Year Persistence Rates ................................................................................................. 98<br />
Persistence to Graduation <strong>for</strong> <strong>Deaf</strong> and Hard-of-Hearing Students........................................ 99<br />
Degrees Granted: FY 2006 to FY 2010 ................................................................................. 100<br />
Graduates by Program Areas ................................................................................................. 102<br />
Time Required to Complete a Degree .................................................................................... 103<br />
Origin and Success of <strong>Deaf</strong> and Hard-of-Hearing Students in Baccalaureate Programs ...... 104<br />
Graduation and Employment <strong>for</strong> Recent Graduates ............................................................... 105<br />
Employment Services <strong>for</strong> <strong>Deaf</strong> and Hard-of-Hearing Students and Graduates .................... 106<br />
Where Recent Graduates are Working .................................................................................. 107<br />
Employment by Sector of <strong>the</strong> Economy .................................................................................. 108<br />
Occupations of Recent Graduates: Entry Status by Labor Category ..................................... 109<br />
Occupations of Alumni by Gender and Labor Categories ....................................................... 111<br />
Ten-Year Labor Force Status and Earnings of Alumni ........................................................... 115<br />
Effect of College Graduation on Reduction in SSI and SSDI Payments ................................ 117<br />
Diversity and Pluralism ................................................................................................................. 119<br />
Diversity and Pluralism Highlights .......................................................................................... 120<br />
Diversity and Pluralism Philosophy ........................................................................................ 121<br />
Admissions Activity by Ethnicity ............................................................................................. 123<br />
Ethnicity of Entering Students ................................................................................................ 124<br />
Ethnicity of Enrolled Students ................................................................................................ 125<br />
First-Year Student Persistence and Graduation Rates by Diversity Categories .................... 126<br />
Graduates by College and Program Areas: Minority Status .................................................. 127<br />
Affirmative Action Report: Faculty and Staff .......................................................................... 128<br />
Affirmative Action: Faculty and Staff Applicants ..................................................................... 129<br />
Affirmative Action: Faculty and Staff Hiring Results ............................................................... 130<br />
Affirmative Action: Faculty and Staff Termination Results ..................................................... 1<strong>31</strong><br />
Innovation and Creativity .............................................................................................................. 133<br />
Scholarship and Accomplishments ........................................................................................ 134<br />
Innovation and Creativity at NTID .......................................................................................... 136<br />
Imagine RIT: Innovation and Creativity Festival ..................................................................... 142<br />
Intellectual Property: Licensed Products, Patents and Inventions ......................................... 143<br />
Research ........................................................................................................................................ 145<br />
Research Overview ................................................................................................................ 146<br />
Examples of Research Activities ............................................................................................ 148<br />
Outreach ......................................................................................................................................... 155<br />
Outreach Highlights ................................................................................................................ 156<br />
Explore Your Future ............................................................................................................... 160<br />
Explore Your Future Enrollment by Location ......................................................................... 161<br />
Employer Outreach ................................................................................................................. 163<br />
<strong>Deaf</strong> Initiative in Technology .................................................................................................. 164
Contents (continued)<br />
PEPNet-Nor<strong>the</strong>ast .................................................................................................................. 166<br />
Pre-College Outreach ............................................................................................................. 169<br />
Faculty and Staff ............................................................................................................................ 175<br />
Faculty and Staff Highlights ..................................................................................................... 176<br />
Average Salary: Faculty and Staff .......................................................................................... 177<br />
Tenure-Track Positions and Faculty Rank ............................................................................. 178<br />
Degree Levels of Tenured and Tenure-Track Faculty ........................................................... 179<br />
Age, Length of Service and Retirement Status of NTID Faculty and Staff ............................ 180<br />
Faculty and Staff New Hires ................................................................................................... 181<br />
Faculty and Staff Terminations .............................................................................................. 182<br />
RIT/NTID Leadership .................................................................................................................... 183<br />
NTID Administrative Team ..................................................................................................... 184<br />
NTID <strong>National</strong> Advisory Group ............................................................................................... 186<br />
NTID Foundation Board ......................................................................................................... 188<br />
RIT Officers ............................................................................................................................ 190<br />
RIT Board of Trustees Active Members .................................................................................. 191<br />
Results of Financial Operations ................................................................................................. 195<br />
Financial Operations Highlights ............................................................................................. 196<br />
Financial Operating Results ................................................................................................... 197<br />
Tuition, Room, Board and O<strong>the</strong>r Fees ................................................................................... 198<br />
Financial Aid ................................................................................................................................. 199<br />
Financial Aid (Domestic Students) ......................................................................................... 200<br />
External Funding Sources ........................................................................................................... 201<br />
NTID Foundation .................................................................................................................... 202<br />
NTID Annual Fundraising Results ........................................................................................... 205<br />
NTID Endowment Programs .................................................................................................. 206<br />
Scholarships and Endowed Funds .......................................................................................... 207<br />
Grants and Contracts ............................................................................................................. 210
Mission Statement<br />
The primary mission of <strong>the</strong> <strong>National</strong> <strong>Technical</strong><br />
<strong>Institute</strong> <strong>for</strong> <strong>the</strong> <strong>Deaf</strong> is to provide deaf students with<br />
outstanding state-of-<strong>the</strong>-art technical and<br />
professional education programs, complemented by<br />
a strong arts and sciences curriculum, that prepare<br />
<strong>the</strong>m to live and work in <strong>the</strong> mainstream of a rapidly<br />
changing global community and enhance <strong>the</strong>ir<br />
lifelong learning.<br />
Secondarily, NTID prepares professionals to work in<br />
fields related to deafness; undertakes a program of<br />
applied research designed to enhance <strong>the</strong> social,<br />
economic and educational accommodation of deaf<br />
people; and shares its knowledge and expertise<br />
through outreach and o<strong>the</strong>r in<strong>for</strong>mation<br />
dissemination programs.<br />
-1-
<strong>National</strong> <strong>Technical</strong> <strong>Institute</strong> <strong>for</strong> <strong>the</strong> <strong>Deaf</strong> – At a Glance<br />
Character<br />
World’s first and largest technological<br />
college <strong>for</strong> students who are deaf or<br />
hard-of-hearing. One of eight colleges<br />
of Rochester <strong>Institute</strong> of Technology, a<br />
privately endowed, coeducational<br />
university that is student-centered and<br />
career-focused.<br />
Primary Mission<br />
To provide deaf and hard-of-hearing<br />
students with outstanding state-of-<strong>the</strong>art<br />
technical and professional<br />
education programs, complemented by<br />
a strong arts and sciences curriculum,<br />
that prepare <strong>the</strong>m to live and work in<br />
<strong>the</strong> mainstream of a rapidly changing<br />
global community and enhance <strong>the</strong>ir<br />
lifelong learning.<br />
History<br />
Formally established in 1965 through<br />
an Act of Congress (PL89-36). Began<br />
operation in 1967 at RIT, with first<br />
students in 1968. RIT was founded<br />
in 1829.<br />
Location<br />
Western New York, in suburban<br />
Rochester.<br />
RIT Campus<br />
More than 1,300 acres, 243 buildings<br />
(5.6 million square feet).<br />
Enrollment<br />
Total of 1,521 students enrolled as of<br />
fall 2010. Undergraduate: 1,263 deaf<br />
and hard-of-hearing students,<br />
147 hearing students (enrolled in<br />
ASL-English Interpretation program).<br />
Graduate: 111 students (71 hearing,<br />
deaf and hard-of-hearing in <strong>the</strong> Master<br />
of Science program in Secondary<br />
Education of Students Who Are <strong>Deaf</strong><br />
or Hard-of-Hearing and 40 deaf and<br />
hard-of-hearing in <strong>the</strong> o<strong>the</strong>r colleges of<br />
RIT). These students study and<br />
reside on a campus that includes<br />
17,206 students studying at <strong>the</strong><br />
associate, baccalaureate, master’s and<br />
doctoral levels.<br />
Male/Female Ratio<br />
50 percent male; 50 percent female.<br />
Diversity<br />
Of <strong>the</strong> 1,521 students enrolled,<br />
28.4 percent are minority students<br />
and 2.7 percent are international<br />
students, representing 17<br />
different countries.<br />
Residence Life<br />
Most undergraduates live in campus<br />
residence halls, apartments and<br />
townhouses. On-campus fraternities,<br />
sororities and special-interest houses<br />
also are available.<br />
RIT Campus Activities<br />
Major social events and activities are<br />
sponsored by <strong>the</strong> College Activities<br />
Board, Residence Halls Association,<br />
sororities, fraternities and special<br />
interest clubs of many kinds. There<br />
are more than 175 student<br />
organizations on campus. NTID’s<br />
Student Life Team also sponsors<br />
a variety of co-curricular<br />
educational programs.<br />
RIT Campus Technology<br />
Extensive wireless computer access,<br />
smart classrooms with state-of-<strong>the</strong>-art<br />
computers and multimedia-based<br />
technologies, microcomputer labs,<br />
computer graphics and computeraided<br />
drafting labs, microelectronics<br />
and computer engineering facilities,<br />
digital printing presses, a laser optics<br />
lab, robotics program, a distance<br />
learning/access demonstration lab<br />
and fully networked residence halls<br />
equipped with strobe lights and<br />
telephone amplifiers.<br />
Research<br />
Integrated research program of<br />
national and international<br />
prominence, focusing on teaching<br />
and learning; access, support<br />
services, and related technology;<br />
communication in personal, learning,<br />
and working environments and<br />
enrollment management.<br />
Cooperative Education<br />
In keeping with a career education<br />
focus, most RIT/NTID degree<br />
programs require students to<br />
complete at least one cooperative<br />
work assignment <strong>for</strong> experience<br />
in <strong>the</strong>ir chosen profession<br />
be<strong>for</strong>e graduation.<br />
-2-<br />
Post-Graduation Employment<br />
Over <strong>the</strong> past five years, 93 percent<br />
of deaf and hard-of-hearing<br />
graduates who have chosen to enter<br />
<strong>the</strong> labor market have obtained jobs<br />
in business, industry, government,<br />
education and o<strong>the</strong>r fields.<br />
Communication/Support<br />
NTID instructors use a variety of<br />
communication strategies while<br />
teaching, including sign language,<br />
spoken language, finger spelling,<br />
printed/visual aids and Web-based<br />
instructional materials. Support and<br />
access services <strong>for</strong> classes<br />
throughout <strong>the</strong> o<strong>the</strong>r colleges of RIT<br />
include notetakers, tutors, real-time<br />
captioning services and <strong>the</strong> largest<br />
interpreting staff <strong>for</strong> a college<br />
program in <strong>the</strong> United States.<br />
Annual Expenses 2010-2011<br />
<strong>for</strong> Undergraduate/U.S. Citizens<br />
Tuition $ 10,719<br />
Room $ 5,862<br />
Board $ 4,182<br />
Fees $ 753<br />
Total $ 21,516<br />
Financial Aid<br />
A combination of institutional grants<br />
and scholarships, federal and state<br />
grants, private scholarships and<br />
Vocational Rehabilitation are<br />
available to students. Average aid per<br />
domestic student in FY 2010 is<br />
$10,496, not including loans or<br />
federal work study.<br />
Academic Year<br />
A quarter system divides <strong>the</strong> calendar<br />
year into four 11-week terms,<br />
beginning with fall quarter in<br />
September. Traditional academic<br />
year runs three quarters, from<br />
September through May.<br />
Degree Programs<br />
Students enrolled at NTID can earn<br />
associate degrees in more than 30<br />
accredited programs. Qualified deaf<br />
and hard-of-hearing students also<br />
can earn bachelor’s or master’s<br />
degrees in more than 200 programs<br />
offered by RIT’s o<strong>the</strong>r colleges:<br />
Applied Science and Technology,<br />
Business, Computing and In<strong>for</strong>mation<br />
Sciences, Engineering, Imaging<br />
Arts and Sciences, Liberal Arts<br />
and Science.
Annual Highlights<br />
Here are a few noteworthy accomplishments and statistics <strong>for</strong> <strong>the</strong> past year:<br />
NTID’s record enrollment – 1,521 students <strong>for</strong> fall 2010<br />
NTID’s record number of student co-op experiences – 281 in FY 2010<br />
NTID’s record number of degrees granted – 306 in FY 2010<br />
NTID’s record number of bachelor’s degrees granted – 143 in FY 2010<br />
NTID’s record number of students with cochlear implants – 305 in fall 2010 (almost 23% of<br />
students who are deaf or hard-of-hearing)<br />
Ninety percent (89.52%) employment rate <strong>for</strong> FY 2009 graduates, not including MSSE and ASL-<br />
English Interpretation graduates<br />
One hundred percent (100%) employment rate <strong>for</strong> FY 2010 MSSE and ASL-English<br />
Interpretation graduates<br />
NTID’s record number of participants in NTID pre-college outreach programs: FutureQuest,<br />
<strong>National</strong> Science Fair, and TechGirlz Camp<br />
Real-time captioning and interpreting services were in strong demand in FY 2010, with<br />
staff providing 19,493 hours of captioning and 116,782 hours of interpreting – <strong>the</strong> highest ever.<br />
NTID completed <strong>the</strong> successful implementation of Strategic Vision 2010 and developed a<br />
strategic plan <strong>for</strong> <strong>the</strong> next 10 years, Strategic Decisions 2020: Shaping NTID’s Future<br />
Through Innovation.<br />
NTID co-hosted, with The Nippon Foundation of Japan and PEN-International, its sixth<br />
international symposium, Technology and <strong>Deaf</strong> Education: Exploring Instructional and Access<br />
Technologies. A total of 289 teachers, administrators, technologists and researchers representing<br />
17 countries attended.<br />
The NTID Innovation Forum in April helped inspire <strong>the</strong> submission of 92 Innovation Grant<br />
proposals by students, staff and faculty in three categories: innovative instruction/student services<br />
projects, innovative scholarship/research projects and professional growth plans.<br />
Imagine RIT: Innovation and Creativity Festival attracted more than 32,000 people and featured<br />
presentations by NTID’s Laboratory Science Technology students, NTID Electric Bike Club,<br />
C-Print ® staff, NTID student inventors and more.<br />
PEPNet-Nor<strong>the</strong>ast produced three live webcasts to national audiences on online accessible<br />
media, resources <strong>for</strong> itinerant teachers of students who are deaf or hard-of-hearing, and access<br />
issues <strong>for</strong> individuals with cochlear implants in educational and employment settings.<br />
-3-
Executive Summary<br />
New Registrations FY 2007 FY 2008 FY 2009 FY 2010 FY 2011<br />
Admissions (<strong>Deaf</strong> and Hard-of-Hearing<br />
Students Only)<br />
Applications 819 939 1,000 966 983<br />
Acceptances 450 522 594 521 526<br />
Registrations 341 377 396 341 351<br />
O<strong>the</strong>r New Registrations<br />
AAS/BS ASL-English Interpretation 41 34 36 52* 57**<br />
MS in Secondary Education 28 27 24 30 27<br />
Total New Registrations 410 438 456 423 435<br />
Enrollment (<strong>Deaf</strong> and Hard-of-Hearing Students Only)<br />
Sub-Baccalaureate Programs<br />
Career-Focused Programs N/A 450 501 485 488<br />
Transfer Associate/Pre-Baccalaureate N/A 113 138 150 168<br />
Subtotal Sub-Baccalaureate 503 563 639 635 656<br />
Baccalaureate Programs at RIT 439 443 451 478 495<br />
Graduate Programs at RIT 47 51 48 38 40<br />
Subtotal Baccalaureate and Graduate at RIT 486 494 499 516 535<br />
Career Exploration Studies 75 97 122 124 112<br />
Subtotal <strong>Deaf</strong> and Hard-of-Hearing<br />
Students Only 1,064 1,154 1,260 1,275 1,303<br />
O<strong>the</strong>r Enrollments<br />
Educational Interpreting 130 130 135 138* 147**<br />
MS in Secondary Education*** 56 59 55 61 71<br />
Subtotal O<strong>the</strong>r 186 189 190 199 218<br />
Total Enrollment 1,250 1,343 1,450 1,474 1,521<br />
* There are an additional three students who are double-majors, with one major in NTID and ano<strong>the</strong>r in a different college of RIT.<br />
** There is an additional student who is a double-major, with one major in NTID and ano<strong>the</strong>r in a different college of RIT.<br />
*** Included from FY 2007 to date are non-matriculated students (between four and 15 per year) taking courses offered by <strong>the</strong><br />
Master of Science program in Secondary Education, but who are part of a grant-supported joint program between NTID and<br />
Nazareth College of Rochester to train speech pathologists to work with deaf and hard-of-hearing persons.<br />
Executive Summary -4-
Executive Summary (continued)<br />
FY 2006 FY 2007 FY 2008 FY 2009 FY 2010<br />
Withdrawn (All Students) 16% 16% 14% 15% 14%<br />
Graduates<br />
Total Degrees Granted 292 251 286 284 306<br />
Degree Level<br />
Certificate 11 10 9 7 12<br />
Diploma 1 2 2 1 1<br />
Associate (AOS) 42 43 33 35 42<br />
Associate (AS/AAS) 67 45 61 73 74<br />
Associate (Interpreting) 22 26 10 0 2<br />
Bachelor’s (Interpreting) 6 10 18 34 <strong>31</strong><br />
Bachelor’s 98 78 108 89 112<br />
Master’s 19 14 12 22 14<br />
Master’s (MSSE) 26 23 33 23 18<br />
Post-Graduation Employment<br />
Post-Graduation Employment 103 112 102 94 N/A*<br />
Post-Graduation Employment Rate 95% 95% 90% 90% N/A*<br />
By Sector of <strong>the</strong> Economy<br />
Business and Industry 60% 63% 71% 59% N/A*<br />
Education 30% 29% 20% 21% N/A*<br />
Government 10% 8% 9% 20% N/A*<br />
Cooperative Work Experiences 233 272 255 262 281<br />
Access/Support Services<br />
Notetaking Hours 57,478 59,466 65,851 63,291 63,620<br />
Tutoring Hours 15,103 15,045 15,271 17,636 18,236<br />
Interpreting Hours 107,257 110,840 114,233 109,618 116,782<br />
Real-Time Captioning Hours 9,350 15,440 16,722 18,168 19,493<br />
* Post-graduation employment numbers reflect status as of one year following graduation; placement numbers <strong>for</strong> September 1,<br />
2009 through August <strong>31</strong>, 2010 graduates will be reported next year.<br />
-5-<br />
Executive Summary
Executive Summary (continued)<br />
Outreach (Number of<br />
External Participants)<br />
Executive Summary -6-<br />
FY 2006 FY 2007 FY 2008 FY 2009 FY 2010<br />
C-Print ® <strong>31</strong> 7 14 0 7<br />
<strong>Deaf</strong> Initiative<br />
in Technology 90 88 71 64 88<br />
Digital Arts, Film<br />
and Animation * * 54 64 62<br />
Explore Your Future 183 253 235 196 217<br />
FutureQuest * * 46 96 128<br />
Interpreter Training** 93 97 92 37 74<br />
Math Competition * * 55 98 61<br />
<strong>National</strong> Center<br />
on Employment 836 958 692 577 521<br />
<strong>National</strong> Science Fair * * 54 62 66<br />
Notetaker Training 201 261 <strong>31</strong>8 223 346<br />
Project Fast Forward * * 66 86 87<br />
SpiRIT Writing Contest * * 35 42 <strong>31</strong><br />
Steps to Success * * 14 20 23<br />
TechGirlz Camp * * 21 32 41<br />
Financial Aid (Domestic Students)<br />
Grant-in-Aid $1,200,874 $1,306,250 $1,169,113 $1,415,786 $1,174,944<br />
Vocational Rehabilitation 5,587,915 6,257,424 7,383,519 8,192,636 8,377,642<br />
Pell Grants 1,212,809 1,241,903 1,450,715 1,839,938 2,781,909<br />
State Grants 493,302 536,811 547,755 549,382 548,863<br />
Federal Loans 2,982,676 3,274,300 3,663,544 4,060,757 5,394,370<br />
Scholarships and O<strong>the</strong>r 1,177,959 1,523,423 1,789,895 2,165,910 2,147,416<br />
Total Financial Aid $12,655,535 $14,140,111 $16,004,541 $18,224,409 $20,425,144<br />
Average Aid per Domestic<br />
Student (Excluding Loans)*** $8,114 $9,537 $9,537 $10,0<strong>31</strong> $10,496<br />
* Data not available.<br />
** Students supported by grants from <strong>the</strong> New York State Board of Regents, State Education Department, Vocational<br />
and Educational Services <strong>for</strong> Individuals with Disabilities, awarded to RIT/NTID and <strong>the</strong> Monroe County #1 Board of<br />
Cooperative Education Services of Rochester, N.Y.<br />
*** Total financial aid, less loans, divided by domestic student enrollment.
Executive Summary (continued)<br />
Domestic Student Rates* FY 2007 FY 2008 FY 2009 FY 2010 FY 2011<br />
Tuition $8,559 $9,153 $9,801 $10,233 $10,719<br />
Room 5,034 5,211 5,421 5,583 5,862<br />
Board 3,714 3,843 3,960 4,059 4,182<br />
Fees 642 669 702 717 753<br />
Total $17,949 $18,876 $19,884 $20,592 $21,516<br />
Fundraising Activity<br />
Cash to Endowment and<br />
Restricted Funds $2,840,116 $2,527,289 $2,085,697 $2,602,401 **<br />
Equipment and Software 124,052 254,191 87,660 94,100 **<br />
Federal Funds Matched*** $828,000 $1,200,000 $784,000 $1,102,800 **<br />
Shana, of Hawaii, celebrates her graduation<br />
with her mo<strong>the</strong>r, Gail, of Centralia, Wash.<br />
* Per <strong>the</strong> Education of <strong>the</strong> <strong>Deaf</strong> Act, international students pay differing tuition rates, depending on whe<strong>the</strong>r <strong>the</strong>y are from a<br />
developing or developed country. Their charges <strong>for</strong> room, board and fees are <strong>the</strong> same as <strong>for</strong> domestic students.<br />
** In<strong>for</strong>mation not yet available.<br />
*** There is no longer a separate appropriation <strong>for</strong> <strong>the</strong> Matching Endowment Program. Any monies matched must be funded<br />
through operating funds efficiencies.<br />
-7-<br />
Executive Summary
The Education of <strong>the</strong> <strong>Deaf</strong> Act<br />
NTID was created by Public Law 89-36, now part of <strong>the</strong> Education<br />
of <strong>the</strong> <strong>Deaf</strong> Act.<br />
-9-<br />
Education of <strong>the</strong> <strong>Deaf</strong> Act<br />
The Education of <strong>the</strong><br />
<strong>Deaf</strong> Act<br />
<strong>National</strong> <strong>Technical</strong> <strong>Institute</strong> <strong>for</strong> <strong>the</strong> <strong>Deaf</strong>
Reporting Requirements of <strong>the</strong> Education of <strong>the</strong> <strong>Deaf</strong> Act and <strong>the</strong> Agreement<br />
with RIT<br />
This section includes, verbatim, <strong>the</strong> section of <strong>the</strong><br />
Education of <strong>the</strong> <strong>Deaf</strong> Act (EDA) that applies to<br />
reporting requirements <strong>for</strong> <strong>the</strong> <strong>National</strong> <strong>Technical</strong><br />
<strong>Institute</strong> <strong>for</strong> <strong>the</strong> <strong>Deaf</strong>. The material below in<br />
brackets provides cross-references, indicating<br />
sections of this report that reflect NTID compliance<br />
Reports <strong>for</strong> <strong>the</strong> EDA<br />
Education of <strong>the</strong> <strong>Deaf</strong> Act -10-<br />
with <strong>the</strong>se EDA provisions. In addition, reporting<br />
on inventions is included below based on a<br />
requirement of <strong>the</strong> Agreement with RIT.<br />
NOTE: Where “…” appear, sections of <strong>the</strong> EDA<br />
that do not apply to NTID have been removed.<br />
The … Board of Trustees or o<strong>the</strong>r governing body of <strong>the</strong> institution of higher education with which <strong>the</strong><br />
Secretary has an agreement [RIT] under section 4332 of this title shall prepare and submit an annual<br />
report to <strong>the</strong> Secretary, and to <strong>the</strong> Committee on Education and Labor of <strong>the</strong> House of Representatives<br />
and <strong>the</strong> Committee on Labor and Human Resources of <strong>the</strong> Senate, not later than 100 days after <strong>the</strong> end<br />
of each fiscal year, which shall include <strong>the</strong> following: [This Annual Report meets this requirement.]<br />
(1) The number of students during <strong>the</strong> preceding academic year who enrolled and whe<strong>the</strong>r <strong>the</strong>se were<br />
first-time enrollments, who graduated, who found employment, or who left without completing a<br />
program of study, reported under each of <strong>the</strong> programs … of NTID. [Refer to <strong>the</strong> Executive<br />
Summary section.]<br />
(2) For <strong>the</strong> preceding academic year, and to <strong>the</strong> extent possible, <strong>the</strong> following data on individuals<br />
who are deaf and from minority backgrounds and who are students (at all educational levels)<br />
or employees:<br />
(A) The number of students enrolled full- and part-time. [Refer to <strong>the</strong> Academic Programs and<br />
Diversity and Pluralism sections.]<br />
(B) The number of <strong>the</strong>se students who completed or graduated from each of <strong>the</strong> educational<br />
programs. [Refer to <strong>the</strong> Persistence, Graduation and Employment, and Diversity and<br />
Pluralism sections.]<br />
(C) The disposition of <strong>the</strong>se students upon graduation/completion on <strong>the</strong> date that is one year after<br />
<strong>the</strong> date of graduation or completion of programs at NTID … in comparison to students from nonminority<br />
backgrounds. [Refer to <strong>the</strong> Persistence, Graduation and Employment, and Diversity and<br />
Pluralism sections.]<br />
(D) The number of students needing and receiving support services (such as tutoring and counseling)<br />
at all educational levels. [Refer to <strong>the</strong> Student Support Services section.]<br />
(E) The number of recruitment activities by type and location <strong>for</strong> all educational levels. [Refer to <strong>the</strong><br />
Outreach section of <strong>the</strong> Executive Summary.]<br />
(F) Employment openings/vacancies and grade level/type of job and number of <strong>the</strong>se individuals that<br />
applied and that were hired. [Refer to <strong>the</strong> Diversity and Pluralism section.]<br />
(G) …<br />
(3) (A) A summary of <strong>the</strong> annual audited financial statements and auditor’s report … as required under<br />
section 4353 of this title. [The audit of RIT is provided to <strong>the</strong> Secretary, as is a separate schedule<br />
<strong>for</strong> NTID.]
Education of <strong>the</strong> <strong>Deaf</strong> Act (continued)<br />
(B) A summary of <strong>the</strong> annual audited financial statements and auditor’s report of NTID programs and<br />
activities of this title, and such supplementary schedules presenting financial in<strong>for</strong>mation <strong>for</strong> NTID<br />
<strong>for</strong> <strong>the</strong> end of <strong>the</strong> federal fiscal year as determined by <strong>the</strong> Secretary. [The audit of RIT is provided<br />
to <strong>the</strong> Secretary, as is a separate schedule <strong>for</strong> NTID.]<br />
(4) For <strong>the</strong> preceding fiscal year, a statement showing <strong>the</strong> receipts of … NTID and from what federal<br />
sources, and a statement showing <strong>the</strong> expenditures … by function, activity, and administrative and<br />
academic unit. [Refer to <strong>the</strong> Financial Operations section.]<br />
(5) A statement showing <strong>the</strong> use of funds (both corpus and income) provided by <strong>the</strong> Federal Endowment<br />
Program under section 4357 of this title. [Refer to <strong>the</strong> External Funding section.]<br />
(6) A statement showing how such Endowment Program funds are invested, what <strong>the</strong> gains or losses<br />
(both realized and unrealized) on such investments were <strong>for</strong> <strong>the</strong> most recent fiscal year, and what<br />
changes were made in investments during that year. [Refer to <strong>the</strong> External Funding section.]<br />
(7) Such additional in<strong>for</strong>mation as <strong>the</strong> Secretary may consider necessary. [We respond on a regular<br />
basis to requests <strong>for</strong> additional in<strong>for</strong>mation from staff of <strong>the</strong> U.S. Department of Education.]<br />
Agreement with RIT: Certification Regarding Inventions<br />
The Agreement <strong>for</strong> Establishment and Operation of <strong>the</strong> <strong>National</strong> <strong>Technical</strong> <strong>Institute</strong> <strong>for</strong> <strong>the</strong> <strong>Deaf</strong> Between<br />
<strong>the</strong> Secretary of Health, Education, and Welfare and Rochester <strong>Institute</strong> of Technology (RIT) (1966)<br />
requires annual disclosure of any inventions developed during <strong>the</strong> year or a certification that no inventions<br />
were made during <strong>the</strong> applicable period. NTID hereby certifies that no inventions were made during <strong>the</strong><br />
year covered by this Annual Report. [In addition, refer to <strong>the</strong> Innovation and Creativity section.]<br />
-11-<br />
Education of <strong>the</strong> <strong>Deaf</strong> Act
Per<strong>for</strong>mance Indicators<br />
Mark, an Accounting Technology student from Pembroke, Mass.,<br />
receives instructional support from Business Studies faculty member<br />
Tracy Magin.<br />
-13-<br />
Per<strong>for</strong>mance Indicators<br />
Per<strong>for</strong>mance<br />
Indicators<br />
<strong>National</strong> <strong>Technical</strong> <strong>Institute</strong> <strong>for</strong> <strong>the</strong> <strong>Deaf</strong>
Per<strong>for</strong>mance Indicators<br />
Per<strong>for</strong>mance indicators are critical elements of <strong>the</strong><br />
Congressionally mandated Government<br />
Per<strong>for</strong>mance and Results Act (GPRA), which<br />
requires <strong>the</strong> Department of Education to<br />
Objective 1 of 4<br />
Per<strong>for</strong>mance Indicators -14-<br />
measure <strong>the</strong> per<strong>for</strong>mance of all entities within its<br />
oversight receiving federal funds. There are<br />
four objectives, each with several measures to<br />
track per<strong>for</strong>mance.<br />
Provide deaf, hard-of-hearing and hearing students in undergraduate and professional studies<br />
with outstanding state-of-<strong>the</strong>-art technical and professional education programs, complemented<br />
by a strong arts and sciences curriculum and supplemented with appropriate student<br />
support services.<br />
Though not related directly to required per<strong>for</strong>mance indicators, <strong>the</strong> table below reports an overview <strong>the</strong><br />
total enrollment <strong>for</strong> <strong>the</strong> <strong>National</strong> <strong>Technical</strong> <strong>Institute</strong> <strong>for</strong> <strong>the</strong> <strong>Deaf</strong> (NTID), which includes:<br />
<strong>Deaf</strong> and hard-of-hearing sub-baccalaureate students<br />
<strong>Deaf</strong> and hard-of-hearing baccalaureate students<br />
Baccalaureate students in <strong>the</strong> ASL-English Interpretation program<br />
<strong>Deaf</strong> and hard-of-hearing graduate students enrolled in colleges of RIT o<strong>the</strong>r than NTID<br />
<strong>Deaf</strong>, hard-of-hearing, and hearing students in NTID’s Master of Science program in Secondary<br />
Education of Students who are <strong>Deaf</strong> or Hard-of-Hearing (MSSE).<br />
Fiscal Year Total Enrollment<br />
1998 1,205<br />
1999 1,278<br />
2000 1,220<br />
<strong>2001</strong> 1,219<br />
2002 1,238<br />
2003 1,2<strong>31</strong><br />
2004 1,270<br />
2005 1,281<br />
2006 1,256<br />
2007 1,250<br />
2008 1,343<br />
2009 1,450<br />
2010 1,474<br />
2011 1,521
Per<strong>for</strong>mance Indicators (continued)<br />
Measure 1.1 of 3: The number of NTID-supported deaf and hard-of-hearing<br />
undergraduates (desired direction: increase)<br />
Fiscal<br />
Year Target<br />
Number<br />
(or date expected) Status<br />
1997<br />
1,069 Measure Not In Place<br />
1998<br />
1,085 Measure Not In Place<br />
1999 1,080 1,135 Target Exceeded<br />
2000 1,080 1,084 Target Exceeded<br />
<strong>2001</strong> 1,080 1,089 Target Exceeded<br />
2002 1,080 1,121 Target Exceeded<br />
2003 1,080 1,093 Target Exceeded<br />
2004 1,080 1,064 Target Not Met<br />
2005 1,080 1,055 Target Not Met<br />
2006 1,080 1,013 Target Not Met<br />
2007 1,080 1,017 Made Progress From Prior Year<br />
2008 1,045 1,103 Target Exceeded<br />
2009 1,045 1,212 Target Exceeded<br />
2010 1,045 1,237 Target Exceeded<br />
2011 1,045 1,263 Target Exceeded<br />
2012 1,045 (October 2011) Pending<br />
Source. <strong>National</strong> <strong>Technical</strong> <strong>Institute</strong> <strong>for</strong> <strong>the</strong> <strong>Deaf</strong>, Registrar Office records<br />
Frequency of Data Collection. Annual<br />
Data Quality. Enrollment data does not include part-time students or non-degree-seeking students, with<br />
<strong>the</strong> exception of students who are part-time taking <strong>the</strong>ir final courses <strong>for</strong> completion of <strong>the</strong>ir degrees.<br />
Target Context. For FY 2011, <strong>the</strong> target <strong>for</strong> <strong>the</strong> number of undergraduates enrolled at NTID remained<br />
<strong>the</strong> same as <strong>the</strong> prior three fiscal years.<br />
Explanation. Below is a table showing <strong>the</strong> number of undergraduate students who are deaf or<br />
hard-of-hearing who were enrolled in baccalaureate programs at RIT and in sub-baccalaureate programs<br />
at NTID.<br />
Fiscal<br />
Year<br />
Baccalaureate<br />
-15-<br />
Sub-<br />
Baccalaureate<br />
Total<br />
<strong>2001</strong> 447 642 1,089<br />
2002 440 681 1,121<br />
2003 449 644 1,093<br />
2004 434 630 1,064<br />
2005 427 628 1,055<br />
2006 438 575 1,013<br />
2007 439 578 1,017<br />
2008 443 660 1,103<br />
2009 451 761 1,212<br />
2010 478 759 1,237<br />
2011 495 768 1,263<br />
Per<strong>for</strong>mance Indicators
Per<strong>for</strong>mance Indicators (continued)<br />
As seen from <strong>the</strong> table on <strong>the</strong> previous page, NTID has increased <strong>the</strong> undergraduate enrollment of<br />
students who are deaf or hard-of-hearing from 1,237 students during FY 2010 to 1,263 students in FY<br />
2011, a 2 percent increase. Baccalaureate students account <strong>for</strong> most of this growth, increasing by 17<br />
students, while sub-baccalaureate students increased by nine students.<br />
Measure 1.2 of 3: The number of students enrolled in NTID’s ASL-English<br />
Interpretation program (desired direction: increase)<br />
Fiscal<br />
Year Target<br />
Number<br />
(or date<br />
expected) Status<br />
1997 72 Measure Not In Place<br />
1998 84 Measure Not In Place<br />
1999 100 93 Made Progress From Prior Year<br />
2000 100 77 Target Not Met<br />
<strong>2001</strong> 100 75 Target Not Met<br />
2002 100 53 Target Not Met<br />
2003 100 65 Made Progress From Prior Year<br />
2004 100 92 Made Progress From Prior Year<br />
2005 100 100 Target Met<br />
2006 100 116 Target Exceeded<br />
2007 100 130 Target Exceeded<br />
2008 100 130 Target Exceeded<br />
2009 100 135 Target Exceeded<br />
2010 100 138 Target Exceeded<br />
2011 120 147 Target Exceeded<br />
2012 120 (October 2011) Pending<br />
Source. <strong>National</strong> <strong>Technical</strong> <strong>Institute</strong> <strong>for</strong> <strong>the</strong> <strong>Deaf</strong>, Registrar Office records<br />
Frequency of Data Collection. Annual<br />
Data Quality. Enrollment data <strong>for</strong> students in <strong>the</strong> ASL-English Interpretation program does not include<br />
part-time students or non-degree-seeking students, with <strong>the</strong> exception of those students who are parttime<br />
taking <strong>the</strong>ir final courses toward completion of <strong>the</strong>ir degrees.<br />
Target Context. Enrollment in this program has increased from 72 students in FY 1997 to its highest<br />
level to date of 147 students in FY 2011. It should be noted that <strong>the</strong>re is one additional ASL-English<br />
Interpretation student who is a double major within ano<strong>the</strong>r college at RIT. Because of <strong>the</strong> way our<br />
computer systems track double-majors, those individuals are not credited to NTID, but are shown in non-<br />
NTID enrollments. We have decided not to count this student here or elsewhere as an NTID student, but<br />
we do in fact have 148, not 147, individuals in this program.<br />
NTID has reported that <strong>the</strong> ASL-English Interpretation program receives more applicants than <strong>the</strong><br />
program is able to accept. We allowed this program to expand in FY 2009 to help meet <strong>the</strong> increasing<br />
demand <strong>for</strong> qualified interpreters. As a result of <strong>the</strong> expansion, <strong>the</strong> target increased to 120 students<br />
<strong>for</strong> FY 2011.<br />
Per<strong>for</strong>mance Indicators -16-
Per<strong>for</strong>mance Indicators (continued)<br />
Measure 1.3 of 3: The number of students enrolled in NTID’s Master of Science program in<br />
Secondary Education of Students Who are <strong>Deaf</strong> or Hard-of-Hearing (MSSE) as well as deaf<br />
and hard-of-hearing students pursuing graduate degrees in o<strong>the</strong>r RIT colleges (desired<br />
direction: increase)<br />
Fiscal<br />
Year Target<br />
Number<br />
(or date expected) Status<br />
1997 32 Measure Not In Place<br />
1998 36 Measure Not In Place<br />
1999 50 50 Target Met<br />
2000 50 59 Target Exceeded<br />
<strong>2001</strong> 50 55 Target Exceeded<br />
2002 75 60 Made Progress From Prior Year<br />
2003 75 73 Made Progress From Prior Year<br />
2004 75 114 Target Exceeded<br />
2005 90 126 Target Exceeded<br />
2006 120 127 Target Exceeded<br />
2007 120 101 Target Not Met<br />
2008 105 110 Target Exceeded<br />
2009 105 103 Target Not Met<br />
2010 105 99 Target Not Met<br />
2011 105 111 Target Exceeded<br />
2012 105 (October 2011) Pending<br />
Source. <strong>National</strong> <strong>Technical</strong> <strong>Institute</strong> <strong>for</strong> <strong>the</strong> <strong>Deaf</strong>, Registrar Office records<br />
Frequency of Data Collection. Annual<br />
Data Quality. Enrollment data does not include part-time students or non-degree-seeking students,<br />
with <strong>the</strong> exception of those students who are part-time taking <strong>the</strong>ir final courses toward completion of<br />
<strong>the</strong>ir degrees.<br />
Target Context. In <strong>the</strong> FY 2008 Per<strong>for</strong>mance Plan, <strong>the</strong> target <strong>for</strong> <strong>the</strong> number of students enrolled in<br />
NTID’s MSSE program, as well as students pursuing graduate degrees in <strong>the</strong> o<strong>the</strong>r colleges of RIT, was<br />
reduced from 120 students to 105 students.<br />
From FY 2004 until FY 2006, NTID and Nazareth College fulfilled <strong>the</strong> terms of an agreement <strong>for</strong> a group<br />
of Nazareth College Speech Pathology students to attend several classes at NTID each year. The 34<br />
Nazareth College students who attended classes at NTID were included in <strong>the</strong> enrollment totals <strong>for</strong> those<br />
three years. With <strong>the</strong> termination of <strong>the</strong> program, enrollment of MSSE and o<strong>the</strong>r graduate students<br />
declined, but were still above pre-FY 2004 levels.<br />
-17-<br />
Per<strong>for</strong>mance Indicators
Per<strong>for</strong>mance Indicators (continued)<br />
Objective 2 of 4<br />
Maximize <strong>the</strong> number of students successfully completing a program of study.<br />
The measures included in this objective are changing this year. The measures that were known as 2.2,<br />
2.4, 2.6, and 2.8 have been removed. In its recent communication with NTID, <strong>the</strong> Department of<br />
Education asked NTID to include data <strong>for</strong> <strong>the</strong> ASL-English Interpretation students in <strong>the</strong> calculations of<br />
<strong>the</strong> persistence and graduation rates of sub-baccalaureate and baccalaureate students <strong>for</strong> FY 2009 and<br />
future years. Disaggregated data was also requested. As a result, measures 2.1, 2.3, 2.5, and 2.7 now<br />
include <strong>the</strong> aggregated data (e.g., 2.1) and <strong>the</strong> disaggregated data (e.g., 2.1A and 2.1B). Previously, only<br />
<strong>the</strong> data in 2.1A, 2.3A, 2.5A, and 2.7A were reported to <strong>the</strong> department, as measures 2.1, 2.3, 2.5, and<br />
2.7, respectively.<br />
Unlike o<strong>the</strong>r data reported in per<strong>for</strong>mance indicator objectives, <strong>the</strong> data in Objective 2 is reported to <strong>the</strong><br />
Integrated Postsecondary Education Data System (IPEDS) using its April timeline. There<strong>for</strong>e, FY 2010<br />
data will be reported in April 2011.<br />
Measure 2.1 of 12: The percentage of first-time, full-time, degree-seeking subbaccalaureate<br />
students who were in <strong>the</strong>ir first year of postsecondary enrollment in <strong>the</strong><br />
previous year and who are enrolled in <strong>the</strong> current year, including students enrolled in<br />
NTID’s ASL-English Interpretation program (desired direction: increase)<br />
Fiscal<br />
Year Target Percentage Status<br />
2008<br />
75.5* Target Not In Place<br />
2009<br />
71.9* Target Not In Place<br />
Measure 2.1A of 12: The percentage of first-time, full-time, degree-seeking subbaccalaureate<br />
students who were in <strong>the</strong>ir first year of postsecondary enrollment in <strong>the</strong><br />
previous year and who are enrolled in <strong>the</strong> current year, not including students enrolled in<br />
NTID’s ASL-English Interpretation program (desired direction: increase)<br />
Fiscal<br />
Year Target<br />
Percentage<br />
(or date expected) Status<br />
2004 72 Measure Not In Place<br />
2005 65.6 Measure Not In Place<br />
2006 64.5 Measure Not In Place<br />
2007 72.4 Measure Not In Place<br />
2008 Set a Baseline 75.5 Target Not In Place<br />
2009 Maintain a Baseline 71.9 Target Not In Place<br />
2010 70 (April 2011) Pending<br />
2011 70 (April 2012) Pending<br />
2012 70 (April 2013) Pending<br />
Measure 2.1B of 12: The percentage of first-time, full-time, degree-seeking subbaccalaureate<br />
students enrolled in NTID’s ASL-English Interpretation program who were<br />
in <strong>the</strong>ir first year of postsecondary enrollment in <strong>the</strong> previous year and who are enrolled<br />
in <strong>the</strong> current year (desired direction: increase)<br />
Fiscal<br />
Year Target Percentage Status<br />
2008<br />
* Target Not In Place<br />
2009<br />
* Target Not In Place<br />
* There were no first-time, full-time, degree-seeking sub-baccalaureate students enrolled in NTID’s ASL-English Interpretation<br />
program who were first-year students in fall 2007 (FY 2008) or fall 2008 (FY 2009).<br />
Per<strong>for</strong>mance Indicators -18-
Per<strong>for</strong>mance Indicators (continued)<br />
Source. Rochester <strong>Institute</strong> of Technology, Registrar Office records<br />
Frequency of Data Collection. Annual<br />
Data Quality. In October 2008, NTID provided data <strong>for</strong> <strong>the</strong> first time to <strong>the</strong> Department of Education on<br />
<strong>the</strong> percentage of first-time, full-time, degree-seeking sub-baccalaureate students who returned <strong>for</strong> <strong>the</strong>ir<br />
second year at <strong>the</strong> institution in fall 2008.<br />
Target Context. Comparisons with two-year public and private colleges indicated that<br />
two-year public colleges have an average persistence rate of 52.5 percent, and two-year private colleges<br />
have a persistence rate of 60.1 percent.<br />
The department proposed that <strong>the</strong> target <strong>for</strong> Measure 2.1A be established at 70 percent. In response,<br />
NTID noted that <strong>the</strong> average persistence rate reported <strong>for</strong> <strong>the</strong> past five years (FY 2004 – 2008) is<br />
70 percent and concurred that this target was appropriate.<br />
Explanation. This measure was added to <strong>the</strong> FY 2008 Per<strong>for</strong>mance Plan and is consistent with <strong>the</strong><br />
methodology used by IPEDS and o<strong>the</strong>r department programs in measuring <strong>the</strong> persistence of<br />
postsecondary students. The persistence rate is <strong>the</strong> percentage of first-time, full-time, degree-seeking<br />
sub-baccalaureate students who were in <strong>the</strong>ir first year of enrollment in <strong>the</strong> previous year and who are<br />
enrolled in <strong>the</strong> current year.<br />
Measure 2.3 of 12: The percentage of first-time, full-time, degree-seeking baccalaureate<br />
students who were in <strong>the</strong>ir first year of postsecondary enrollment in <strong>the</strong> previous year<br />
and are enrolled in <strong>the</strong> current year, including students enrolled in NTID’s ASL-English<br />
Interpretation program (desired direction: increase)<br />
Fiscal<br />
Year Target Percentage Status<br />
2008<br />
85.9 Target Not In Place<br />
2009<br />
88.0 Target Not In Place<br />
Measure 2.3A of 12: The percentage of first-time, full-time, degree-seeking baccalaureate<br />
students who were in <strong>the</strong>ir first year of postsecondary enrollment in <strong>the</strong> previous year<br />
and are enrolled in <strong>the</strong> current year, not including students enrolled in NTID’s ASL-<br />
English Interpretation program (desired direction: increase)<br />
Fiscal<br />
Year Target<br />
Percentage<br />
(or date expected) Status<br />
2004 91.9 Measure Not In Place<br />
2005 82.6 Measure Not In Place<br />
2006 86.3 Measure Not In Place<br />
2007 75.7 Measure Not In Place<br />
2008 Set a Baseline 85.7 Target Not In Place<br />
2009 Maintain a Baseline 87.7 Target Not In Place<br />
2010 85 (April 2011) Pending<br />
2011 85 (April 2012) Pending<br />
2012 85 (April 2013) Pending<br />
-19-<br />
Per<strong>for</strong>mance Indicators
Per<strong>for</strong>mance Indicators (continued)<br />
Measure 2.3B of 12: The percentage of first-time, full-time, degree-seeking baccalaureate<br />
students enrolled in NTID’s ASL-English Interpretation program who were in <strong>the</strong>ir first<br />
year of postsecondary enrollment in <strong>the</strong> previous year and are enrolled in <strong>the</strong> current<br />
year (desired direction: increase)<br />
Fiscal<br />
Year Target Percentage Status<br />
2008<br />
87.5 Target Not In Place<br />
2009<br />
89.5 Target Not In Place<br />
Source. Rochester <strong>Institute</strong> of Technology, Registrar Office records<br />
Data Quality. In October 2008, NTID provided data <strong>for</strong> <strong>the</strong> first time to <strong>the</strong> department on <strong>the</strong> percentage<br />
of first-time, full-time, degree-seeking baccalaureate students who returned <strong>for</strong> <strong>the</strong>ir second year at <strong>the</strong><br />
institution in fall 2008.<br />
Target Context. Comparisons with four-year public and private colleges indicate that<br />
four-year public colleges have an average persistence rate of 69.9 percent, and four-year private colleges<br />
have a persistence rate of 70.6 percent.<br />
The department proposed that <strong>the</strong> target <strong>for</strong> Measure 2.3A be established at 85 percent. In response,<br />
NTID noted that <strong>the</strong> average persistence rate reported <strong>for</strong> <strong>the</strong> past five years (FY 2004 – 2008) is<br />
84.4 percent and proposed that <strong>the</strong> target be equal to this average. NTID also noted that <strong>the</strong> persistence<br />
rate varies greatly from year to year, due to <strong>the</strong> small number of first-time, full-time, degree-seeking<br />
baccalaureate students at <strong>the</strong> institution, which does not include transfer students. The department<br />
determined that 85 percent is an appropriate and ambitious target <strong>for</strong> this measure.<br />
Explanation. This measure was added to <strong>the</strong> FY 2008 Per<strong>for</strong>mance Plan and is consistent with <strong>the</strong><br />
methodology used by IPEDS and o<strong>the</strong>r department programs in measuring <strong>the</strong> persistence of<br />
postsecondary students. The persistence rate is <strong>the</strong> percentage of first-time, full-time, degree-seeking<br />
baccalaureate students who were in <strong>the</strong>ir first year of enrollment in <strong>the</strong> previous year and who are<br />
enrolled in <strong>the</strong> current year.<br />
Measure 2.5 of 12: The percentage of first-time, full-time, degree-seeking subbaccalaureate<br />
students who graduate within 150% of <strong>the</strong> program-based length of<br />
time, including students enrolled in NTID’s ASL-English Interpretation program<br />
(desired direction: increase)<br />
Fiscal<br />
Year Target Percentage Status<br />
2008<br />
26.9 Target Not In Place<br />
2009<br />
37.4 Target Not In Place<br />
Per<strong>for</strong>mance Indicators -20-
Per<strong>for</strong>mance Indicators (continued)<br />
Measure 2.5A of 12: The percentage of first-time, full-time, degree-seeking subbaccalaureate<br />
students who graduate within 150% of <strong>the</strong> program-based length of<br />
time, not including students enrolled in NTID’s ASL-English Interpretation program<br />
(desired direction: increase)<br />
Fiscal<br />
Year Target<br />
Percentage<br />
(or date expected) Status<br />
2004 25.3 Measure Not In Place<br />
2005 23.3 Measure Not In Place<br />
2006 25.4 Measure Not In Place<br />
2007 25.3 Measure Not In Place<br />
2008 Set a Baseline 29.3 Target Not In Place<br />
2009 Maintain a Baseline 37.8 Target Not In Place<br />
2010 26 (April 2011) Pending<br />
2011 26 (April 2012) Pending<br />
2012 27 (April 2013) Pending<br />
Measure 2.5B of 12: The percentage of first-time, full-time, degree-seeking subbaccalaureate<br />
students enrolled in NTID’s ASL-English Interpretation<br />
program who graduate within 150% of <strong>the</strong> program-based length of time (desired<br />
direction: increase)<br />
Fiscal<br />
Year Target Percentage Status<br />
2008<br />
0.0* Target Not In Place<br />
2009<br />
33.3 Target Not In Place<br />
Source. Rochester <strong>Institute</strong> of Technology, Registrar Office records<br />
Frequency of Data Collection. Annual<br />
Data Quality. In October 2008, NTID provided data <strong>for</strong> <strong>the</strong> first time to <strong>the</strong> department on <strong>the</strong> percentage<br />
of first-time, full-time, degree-seeking sub-baccalaureate students who graduate within 150 percent of <strong>the</strong><br />
program-based length of time.<br />
Target Context. The department proposed that <strong>the</strong> target <strong>for</strong> Measure 2.5A be established at<br />
32 percent. In response, NTID noted that <strong>the</strong> average graduation rate reported <strong>for</strong> <strong>the</strong> past five years<br />
(FY 2004 – 2008) is 25.7 percent and proposed that <strong>the</strong> target be equal to this average. The department<br />
determined that 26 percent is an appropriate and ambitious target <strong>for</strong> FY 2010 and 2011 <strong>for</strong> this measure.<br />
The target will be increased by 1 percent to 27 percent in FY 2012 and subsequent years.<br />
Explanation. This measure was added to <strong>the</strong> FY 2008 Per<strong>for</strong>mance Plan and is consistent with <strong>the</strong><br />
methodology used by IPEDS and o<strong>the</strong>r department programs to measure <strong>the</strong> graduation rate of<br />
postsecondary students. Program-based length of time refers to whe<strong>the</strong>r <strong>the</strong> stated program length <strong>for</strong><br />
sub-baccalaureates is two or three years. The measure will allow <strong>the</strong> department to obtain data that is<br />
comparable with what is being submitted to IPEDS by o<strong>the</strong>r institutions on graduation rates.<br />
* There were only three students included in <strong>the</strong> ASL-English Interpretation cohort reported <strong>for</strong> FY 2008. None of <strong>the</strong>se students<br />
persisted to graduation, resulting in a rate of 0 percent.<br />
-21-<br />
Per<strong>for</strong>mance Indicators
Per<strong>for</strong>mance Indicators (continued)<br />
Measure 2.7 of 12: The percentage of first-time, full-time, degree-seeking<br />
baccalaureate students who graduate within 150% of <strong>the</strong> program-based length<br />
of time, including students enrolled in NTID’s ASL-English Interpretation<br />
program (desired direction: increase)<br />
Fiscal<br />
Year Target Percentage Status<br />
2008<br />
60.5* Target Not In Place<br />
2009<br />
62.2* Target Not In Place<br />
Measure 2.7A of 12: The percentage of first-time, full-time, degree-seeking<br />
baccalaureate students who graduate within 150% of <strong>the</strong> program-based length<br />
of time, not including students enrolled in NTID’s ASL-English Interpretation<br />
program (desired direction: increase)<br />
Fiscal<br />
Year Target<br />
Percentage<br />
(or date expected) Status<br />
2004 50.0 Measure Not In Place<br />
2005 62.1 Measure Not In Place<br />
2006 62.9 Measure Not In Place<br />
2007 53.3 Measure Not In Place<br />
2008 Set a Baseline 60.5 Target Not In Place<br />
2009 Maintain a Baseline 62.2 Target Not In Place<br />
2010 60 (April 2011) Pending<br />
2011 60 (April 2012) Pending<br />
2012 61 (April 2013) Pending<br />
Measure 2.7B of 12: The percentage of first-time, full-time, degree-seeking<br />
baccalaureate students enrolled in NTID’s ASL-English Interpretation program<br />
who graduate within 150% of <strong>the</strong> program-based length of time (desired<br />
direction: increase)<br />
Fiscal<br />
Year Target Percentage Status<br />
2008<br />
* Target Not In Place<br />
2009<br />
* Target Not In Place<br />
Source. Rochester <strong>Institute</strong> of Technology, Registrar Office records<br />
Data Quality. In October 2008, NTID provided data <strong>for</strong> <strong>the</strong> first time to <strong>the</strong> department on <strong>the</strong> percentage<br />
of first-time, full-time, degree-seeking baccalaureate students who graduate within six years.<br />
Target Context. The department proposed that <strong>the</strong> target <strong>for</strong> Measure 2.7A be established at 65 percent.<br />
In response, NTID noted that <strong>the</strong> average graduation rate reported <strong>for</strong> <strong>the</strong> past five years (FY 2004 –<br />
2008) is 57.8 percent and proposed that <strong>the</strong> target be equal to this average. The department determined<br />
that 60 percent is an appropriate and ambitious target <strong>for</strong> FY 2010 and 2011 <strong>for</strong> this measure. The target<br />
will be increased by 1 percent to 61 percent <strong>for</strong> FY 2012 and subsequent years.<br />
Explanation. This measure was added in <strong>the</strong> FY 2008 Per<strong>for</strong>mance Plan and is consistent with <strong>the</strong><br />
methodology used by IPEDS and o<strong>the</strong>r department programs to measure <strong>the</strong> graduation rate of<br />
* There were no first-time, full-time, degree-seeking baccalaureate students enrolled in NTID’s ASL-English Interpretation program<br />
in fall 2002 (FY 2003) or fall 2003 (FY 2004).<br />
Per<strong>for</strong>mance Indicators -22-
Per<strong>for</strong>mance Indicators (continued)<br />
baccalaureate postsecondary students who graduate within six years of entry. The measure will allow <strong>the</strong><br />
department to obtain data that is comparable with what is being submitted to IPEDS by o<strong>the</strong>r institutions<br />
on graduation rates.<br />
Objective 3 of 4<br />
Improve post-school outcomes.<br />
The source of <strong>the</strong> data in <strong>the</strong>se measures is a questionnaire given by NTID to its students who are<br />
nearing graduation and immediately after graduation. In addition, all graduates receive an initial e-mail<br />
contact from NTID during <strong>the</strong> first quarter after graduation, as well as follow-up letters and phone calls,<br />
with <strong>the</strong> goal of acquiring data <strong>for</strong> every student who has graduated within <strong>the</strong> previous year. Questions<br />
include <strong>the</strong> graduate’s address, whe<strong>the</strong>r <strong>the</strong> graduate has found or is looking <strong>for</strong> employment, and<br />
whe<strong>the</strong>r <strong>the</strong> graduate is attending college or ano<strong>the</strong>r postsecondary institution. If <strong>the</strong> graduate is<br />
employed, NTID requests in<strong>for</strong>mation regarding <strong>the</strong> employment experience, including type of work,<br />
starting date, and salary.<br />
According to <strong>the</strong> FY 2010 GPRA report submitted by NTID on those who graduated in 2009, a total of<br />
218 students graduated from NTID that year. Valid data existed on 202 graduates and were collected <strong>for</strong><br />
<strong>the</strong> FY 2010 report. Of <strong>the</strong> 202 graduates, 94 students were employed (47%), 80 students were in higher<br />
education or training (40%), and 28 students were not employed or in higher education or training (13%).<br />
Of <strong>the</strong> 28 students not employed or in higher education or training, 11 were actively looking <strong>for</strong> work.<br />
Measure 3.1 of 3: The post-school rate of NTID graduates who are in <strong>the</strong><br />
work<strong>for</strong>ce during <strong>the</strong>ir first year after graduation (desired direction: increase)<br />
Graduation<br />
Year Target<br />
Rate<br />
(or date expected) Status<br />
2005 59 Measure Not In Place<br />
2006<br />
52 Measure Not In Place<br />
2007 Set a Baseline 60 Target Not In Place<br />
2008 Set a Baseline 51 Target Not In Place<br />
2009 Maintain a Baseline 47 Target Not In Place<br />
2010 57 (October 2011) Pending<br />
2011 57 (October 2012) Pending<br />
2012 57 (October 2013) Pending<br />
Source. <strong>National</strong> <strong>Technical</strong> <strong>Institute</strong> <strong>for</strong> <strong>the</strong> <strong>Deaf</strong>, post-graduation employment records<br />
Frequency of Data Collection. Annual<br />
Target Context. The average employment rate of 2005, 2006 and 2007 graduates who were employed<br />
full-time within one year after graduation is 57%. In FY 2010, <strong>the</strong> department proposed that <strong>the</strong> target <strong>for</strong><br />
this measure be equal to this average. NTID will report <strong>the</strong> employment rate of its 2010 graduates who<br />
are employed within one year after graduation to <strong>the</strong> department in <strong>the</strong> next report.<br />
Explanation. Originally employment rates were calculated by NTID as <strong>the</strong> percentage of graduates who<br />
are employed among those who choose to pursue employment, following <strong>the</strong> Bureau of Labor Statistics<br />
methodology. In previous years, NTID reported, in comparison with <strong>the</strong> target of 95 percent, <strong>the</strong> following<br />
percentages of students employed who have chosen to pursue employment:<br />
-23-<br />
Per<strong>for</strong>mance Indicators
Per<strong>for</strong>mance Indicators (continued)<br />
Graduation<br />
Year<br />
Per<strong>for</strong>mance Indicators -24-<br />
Percentage<br />
1999 94<br />
2000 90<br />
<strong>2001</strong> 92<br />
2002 89<br />
2003 93<br />
2004 93<br />
2005 95<br />
2006 95<br />
2007 90<br />
2008 90<br />
In FY 2006, <strong>the</strong> department changed <strong>the</strong> methodology of calculating employment data, from <strong>the</strong><br />
percentage of graduates who were employed among those seeking employment, to <strong>the</strong> percentage of<br />
graduates who are employed among all those who graduated from NTID.<br />
Measure 3.2 of 3: The post-school rate of NTID graduates who are in<br />
advanced education or training during <strong>the</strong>ir first year after graduation (desired<br />
direction: increase)<br />
Graduation<br />
Year Target<br />
Rate<br />
(or date expected) Status<br />
2005 33 Measure Not In Place<br />
2006 Set a Baseline 42 Target Not In Place<br />
2007 Set a Baseline 30 Target Not In Place<br />
2008 Set a Baseline 39 Target Not In Place<br />
2009 Maintain a Baseline 40 Target Not In Place<br />
2010 35 (October 2011) Pending<br />
2011 35 (October 2012) Pending<br />
2012 35 (October 2013) Pending<br />
Source. <strong>National</strong> <strong>Technical</strong> <strong>Institute</strong> <strong>for</strong> <strong>the</strong> <strong>Deaf</strong>, post-graduation employment records<br />
Frequency of Data Collection. Annual<br />
Target Context. The average participation rate of 2005, 2006 and 2007 graduates who were in advanced<br />
education or training full-time within one year after graduation is 35 percent. In FY 2010, <strong>the</strong> department<br />
proposed that <strong>the</strong> target <strong>for</strong> this measure be equal to this average. NTID will report <strong>the</strong> participation rate<br />
of its 2010 graduates who are in advanced education or training within one year after graduation to <strong>the</strong><br />
department in <strong>the</strong> next report.<br />
Explanation. This indicator was added as part of <strong>the</strong> post-school outcomes to provide a more complete<br />
and accurate picture of outcomes <strong>for</strong> NTID graduates. The measure focuses on graduates who are in<br />
advanced education or training during <strong>the</strong>ir first year after graduation. Separate measures cover<br />
graduates who are in <strong>the</strong> work<strong>for</strong>ce during <strong>the</strong>ir first year after graduation and graduates who are<br />
not engaged in ei<strong>the</strong>r advanced education or training or in <strong>the</strong> work<strong>for</strong>ce during <strong>the</strong>ir first year<br />
after graduation.
Per<strong>for</strong>mance Indicators (continued)<br />
Measure 3.3 of 3: The post-school rate of NTID graduates who are not engaged in ei<strong>the</strong>r<br />
advanced education or training or in <strong>the</strong> work<strong>for</strong>ce during <strong>the</strong>ir first year after graduation<br />
(desired direction: decrease)<br />
Fiscal<br />
Year Target<br />
Rate<br />
(or date expected) Status<br />
2005<br />
8 Measure Not In Place<br />
2006 Set a Baseline 6 Target Not In Place<br />
2007 Set a Baseline 10 Target Not In Place<br />
2008 Set a Baseline 10 Target Not In Place<br />
2009 Maintain a Baseline 13 Target Not In Place<br />
2010 8 (October 2011) Pending<br />
2011 8 (October 2012) Pending<br />
2012 8 (October 2013) Pending<br />
Source. <strong>National</strong> <strong>Technical</strong> <strong>Institute</strong> <strong>for</strong> <strong>the</strong> <strong>Deaf</strong>, post-graduation employment records<br />
Frequency of Data Collection. Annual<br />
Target Context. The average rate of <strong>the</strong> 2005, 2006 and 2007 graduates, who were nei<strong>the</strong>r employed<br />
nor in advanced education or training full-time within one year after graduation is 8 percent. In FY 2010,<br />
<strong>the</strong> department proposed that <strong>the</strong> target <strong>for</strong> this measure be equal to this average. NTID will report<br />
<strong>the</strong> rate of its FY 2010 graduates who are nei<strong>the</strong>r employed or in advanced education or training within<br />
one year after graduation to <strong>the</strong> department in <strong>the</strong> next report.<br />
Explanation. This indicator has been added as part of <strong>the</strong> post-school outcomes to provide a more<br />
complete and accurate picture of outcomes <strong>for</strong> NTID graduates. The measure focuses on graduates<br />
who are not engaged in advanced education or training or in <strong>the</strong> work<strong>for</strong>ce during <strong>the</strong>ir first year after<br />
graduation. O<strong>the</strong>r measures cover graduates who are in <strong>the</strong> work<strong>for</strong>ce during <strong>the</strong>ir first year after<br />
graduation and graduates who are in ei<strong>the</strong>r advanced education or training during <strong>the</strong>ir first year<br />
after graduation.<br />
-25-<br />
Per<strong>for</strong>mance Indicators
Per<strong>for</strong>mance Indicators (continued)<br />
Objective 4 of 4:<br />
Improve <strong>the</strong> efficiency of operations at NTID as defined by <strong>the</strong> cost per successful student<br />
outcome, where <strong>the</strong> successful outcome is graduation.<br />
Measure 4.1 of 2: Federal cost per NTID graduate (desired direction: decrease)<br />
Fiscal<br />
Year Target<br />
2003<br />
Per<strong>for</strong>mance Indicators -26-<br />
Cost<br />
(or date expected) Status<br />
239,900 Measure Not In Place<br />
2004 206,600 Measure Not In Place<br />
2005 209,800 Measure Not In Place<br />
2006 181,400 Measure Not In Place<br />
2007 Set a Baseline 210,100 Target Not In Place<br />
2008 Maintain a Baseline 188,600 Target Not In Place<br />
2009 Maintain a Baseline 196,300 Target Not In Place<br />
2010 198,100 187,400 Target Exceeded<br />
2011 199,900 (<strong>December</strong> 2011) Pending<br />
2012 201,700 (<strong>December</strong> 2012) Pending<br />
2013 203,500 (<strong>December</strong> 2013) Pending<br />
Source. <strong>National</strong> <strong>Technical</strong> <strong>Institute</strong> <strong>for</strong> <strong>the</strong> <strong>Deaf</strong>, Budget Office<br />
Frequency of Data Collection. Annual<br />
Data Quality. The FY 2010 data on <strong>the</strong> federal cost per graduate, as reported by NTID, is an average of<br />
<strong>the</strong> cost per graduate from FY 2005 to FY 2010. The federal cost per graduate includes graduates who<br />
receive associate, bachelor’s and master’s degrees from NTID.<br />
Target Context. In determining <strong>the</strong> appropriate target each year <strong>for</strong> <strong>the</strong> federal cost per graduate, future<br />
inflation must be taken into account, as well as <strong>the</strong> variation in <strong>the</strong> number of students who graduate<br />
each year from NTID. The department has identified and established targets <strong>for</strong> FY 2010 and<br />
subsequent years.<br />
Explanation. This measure is calculated by adding <strong>the</strong> federal appropriations <strong>for</strong> <strong>the</strong> current year and <strong>the</strong><br />
five preceding years, which is <strong>the</strong>n averaged. The average (from six years of federal appropriations) is<br />
divided by <strong>the</strong> number of graduates in <strong>the</strong> current year, including sub-baccalaureate, baccalaureate and<br />
graduate students. Federal student financial aid, vocational rehabilitation payments, o<strong>the</strong>r federal support<br />
<strong>for</strong> students, federal grants and contracts, <strong>the</strong> Federal Endowment Grant Program tuition, and o<strong>the</strong>r<br />
private funds received by NTID are not included in this calculation.
Per<strong>for</strong>mance Indicators (continued)<br />
Measure 4.2 of 2: Total educational cost per NTID graduate (desired direction:<br />
decrease)<br />
Fiscal<br />
Year Target<br />
2003<br />
Cost<br />
(or date expected) Status<br />
273,400 Measure Not In Place<br />
2004 239,400 Measure Not In Place<br />
2005 246,100 Measure Not In Place<br />
2006 214,300 Measure Not In Place<br />
2007 Set a Baseline 250,300 Target Not In Place<br />
2008 Maintain a Baseline 226,700 Target Not In Place<br />
2009 Maintain a Baseline 236,400 Target Not In Place<br />
2010 238,500 223,900 Target Exceeded<br />
2011 240,600 (<strong>December</strong> 2011) Pending<br />
2012 242,800 (<strong>December</strong> 2012) Pending<br />
2013 245,000 (<strong>December</strong> 2013) Pending<br />
Source. <strong>National</strong> <strong>Technical</strong> <strong>Institute</strong> <strong>for</strong> <strong>the</strong> <strong>Deaf</strong>, Budget Office<br />
Frequency of Data Collection. Annual<br />
Data Quality. The FY 2010 data on <strong>the</strong> total educational cost per graduate, as reported by NTID, is an<br />
average of <strong>the</strong> cost per graduate from FY 2005 to FY 2010. The total educational cost per graduate<br />
includes graduates who receive associate, bachelor’s and master’s degrees from NTID.<br />
Target Context. In determining <strong>the</strong> appropriate target each year <strong>for</strong> <strong>the</strong> total educational cost per<br />
graduate, future inflation must be taken into account, as well as <strong>the</strong> variation in <strong>the</strong> number of students<br />
who graduate each year from NTID. The department has identified and established targets <strong>for</strong> FY 2010<br />
and subsequent years.<br />
Explanation. This measure is calculated by adding <strong>the</strong> federal appropriations and non-federal funds<br />
(tuition, room, board, and fees collected from students) <strong>for</strong> <strong>the</strong> current year and <strong>the</strong> five preceding years,<br />
which is <strong>the</strong>n averaged. The average (from six years of federal appropriations and non-federal funds) is<br />
divided by <strong>the</strong> number of graduates in <strong>the</strong> current year, including sub-baccalaureate, baccalaureate and<br />
graduate students. Costs associated with public services, auxiliary enterprises, and construction are<br />
excluded from this calculation.<br />
-27-<br />
Per<strong>for</strong>mance Indicators
Strategic Planning<br />
FY 2010 marked <strong>the</strong> final year <strong>for</strong> implementation of Strategic Vision<br />
2010 as well as <strong>the</strong> completion of <strong>the</strong> strategic plan <strong>for</strong> <strong>the</strong> next 10<br />
years, Strategic Decisions 2020.<br />
-29-<br />
Strategic Planning<br />
Strategic Planning<br />
<strong>National</strong> <strong>Technical</strong> <strong>Institute</strong> <strong>for</strong> <strong>the</strong> <strong>Deaf</strong>
Transition from Strategic Vision 2010 to Strategic Decisions 2020<br />
This portion of <strong>the</strong> annual report incorporates <strong>the</strong><br />
fifth and final year of accomplishments associated<br />
with Strategic Vision 2010 (SV 2010), which was<br />
implemented by NTID in February 2005. SV 2010<br />
contains four main decision areas, each of which is<br />
Strategic Vision 2010<br />
Strategic Planning -30-<br />
presented briefly below followed by a list of our<br />
accomplishments. This year, Strategic Decisions<br />
2020 (SD 2020) was developed with<br />
implementation scheduled to begin in FY 2011. The<br />
key initiatives of SD 2020 are also provided below.<br />
As of February 2010, NTID completed its fifth and final year of implementing Strategic Vision 2010:<br />
Creating Our Future (February 2005). Goals of this strategic planning/implementation initiative, and<br />
highlights of accomplishments, can be summarized according to four primary areas:<br />
1. NTID will offer three distinct kinds of degree programs: a) career-focused; b) associate-tobaccalaureate<br />
transfer degree programs in collaboration with o<strong>the</strong>r colleges of RIT; and c)<br />
baccalaureate/master’s degrees. Increased emphasis will be given to <strong>the</strong> latter two kinds<br />
of degree programs, with higher percentages of NTID-supported students enrolled at <strong>the</strong><br />
baccalaureate level or higher. At <strong>the</strong> same time, NTID would ensure students graduating<br />
from career-focused degree programs will be eligible <strong>for</strong> well-paying technician-level jobs<br />
and careers.<br />
Highlights of Accomplishments Regarding Career-Focused Degree Programs<br />
- Consolidation of 11 career-focused degree programs to five cluster areas: Arts and Imaging<br />
Studies; Business; Engineering Technologies; Computing; and Science.<br />
- Completion, piloting, and implementation of a General Education curriculum designed to<br />
enhance skills needed in <strong>the</strong> workplace, including:<br />
i. Communication outcomes related to e-mail etiquette, face-to-face communication,<br />
and presentation skills<br />
ii. Capstone Course required <strong>for</strong> graduation revised to focus on both critical thinking,<br />
problem solving and communication skills, as well as issues related to workplace or<br />
technical areas of study<br />
iii. Career English three-course sequence focusing on reading and writing skills required<br />
<strong>for</strong> <strong>the</strong> workplace<br />
iv. Promotion of career-focused degree programs to encourage students and parents to<br />
understand and value <strong>the</strong> career possibilities of <strong>the</strong>se degrees<br />
Highlights of Accomplishments Regarding Associate-to-Baccalaureate Transfer Degree Programs<br />
- Transfer degree programs (with at least 80 percent of <strong>the</strong> credits taken at NTID transferable<br />
to <strong>the</strong> o<strong>the</strong>r RIT colleges through <strong>for</strong>mal articulation agreements) have been designed and<br />
implemented in <strong>the</strong> following majors:<br />
i. Business Studies<br />
Completed Associate in Science (AS) in Business with <strong>the</strong> E. Philip<br />
Saunders College of Business<br />
Completed AS in Hospitality and Service Management with <strong>the</strong> College of<br />
Applied Science and Technology<br />
Completed Associate in Applied Science (AAS) in Administrative Support<br />
Technology with <strong>the</strong> College of Applied Science and Technology, with<br />
concentrations in Human Resources Management or Computer Graphics
Strategic Vision 2010 (continued)<br />
ii. Engineering Studies<br />
Completed AAS in Applied Mechanical Technology with <strong>the</strong> College of<br />
Applied Science and Technology<br />
iii. In<strong>for</strong>mation and Computing Studies<br />
Completed AS in Applied Computer Technology with <strong>the</strong> B. Thomas<br />
Golisano College of Computing and In<strong>for</strong>mation Sciences<br />
iv. Laboratory Science Technology<br />
Completed AAS in Laboratory Science Technology with <strong>the</strong> College of<br />
Applied Science and Technology<br />
v. Liberal Studies<br />
Completed a new AS in Applied Liberal Studies<br />
Highlights of Accomplishments Regarding Baccalaureate/Master’s Degree Programs<br />
- Approval obtained <strong>for</strong> a BS in ASL-English Interpretation<br />
- Accreditation obtained from <strong>the</strong> Teacher Education Accreditation Council (TEAC) <strong>for</strong><br />
<strong>the</strong> Master of Science program in Secondary Education of Students who are <strong>Deaf</strong> or<br />
Hard-of-Hearing (MSSE)<br />
- Implemented an NTID and College of Liberal Arts Partnership Agreement, greatly increasing<br />
<strong>the</strong> number of sections of American Sign Language (ASL) courses offered through <strong>the</strong><br />
College of Liberal Arts, establishing a concentration in ASL/<strong>Deaf</strong> Studies <strong>for</strong> hearing, deaf<br />
and hard-of-hearing students, and a cross-disciplinary minor in <strong>Deaf</strong> Cultural Studies<br />
2. NTID will create <strong>for</strong>mal referral agreements with selected community colleges <strong>for</strong> students not<br />
yet ready <strong>for</strong> admission to NTID’s career-focused programs. NTID also will create an intensive<br />
summer English program to boost selected students from career-focused to 2+2 or 2+3<br />
transfer programs.<br />
Highlights of Accomplishments Regarding Community College Partnerships<br />
- Strategic Vision 2010 called <strong>for</strong> NTID to establish a strong referral program with selected<br />
community college programs to help students who want to come to NTID, but who are not<br />
yet academically ready. This plan has been modified and has become our Community<br />
College Referral Program. This program focuses on recruiting deaf and hard-of-hearing<br />
students with associate degrees to transfer to RIT baccalaureate programs from partner<br />
community colleges.<br />
A coordinator was appointed in <strong>December</strong> 2007, and from <strong>December</strong> 2007 to October 2008,<br />
this person contacted 40 schools across <strong>the</strong> United States and visited 33 of <strong>the</strong>m. Written<br />
agreements with Austin Community College and Northwestern Connecticut Community<br />
College have been developed. A Transfer Advising Worksheet has been mailed to<br />
55 contacts at <strong>the</strong> schools visited. Community colleges were made aware of RIT’s access<br />
services in interpreting, notetaking, C-Print ® and tutoring.<br />
- NTID received funding from <strong>the</strong> <strong>National</strong> Science Foundation (NSF) <strong>for</strong> a planning grant <strong>for</strong> a<br />
Center <strong>for</strong> Advancing Technological Education of <strong>Deaf</strong> and Hard-of-Hearing Students<br />
(CATED), utilizing <strong>the</strong> results of <strong>the</strong> Community College Referral Program, NTID’s <strong>Deaf</strong><br />
Initiative in Technology (DiiT), and NTID’s Project Fast Forward. The aim of <strong>the</strong> planning<br />
-<strong>31</strong>-<br />
Strategic Planning
Strategic Vision 2010 (continued)<br />
grant was <strong>the</strong> development of paths from high school to community college to a<br />
four-year college in advancing deaf and hard-of-hearing students into high technology<br />
fields with an emphasis on preparing students <strong>for</strong> two-year programs leading to technician<br />
level employment.<br />
Highlights of Accomplishments Regarding Intensive English Bridging Program<br />
- NTID created an Intensive English Program with full implementation during Academic Year<br />
2008-09. A proposal <strong>for</strong> an intensive English Bridging Program was prepared, reviewed,<br />
developed, piloted and approved – and was implemented in fall 2009. This program serves a<br />
high achieving segment of students in career-focused degree programs, repositioning <strong>the</strong>m<br />
to enter a transfer associate degree program leading to a baccalaureate degree.<br />
3. NTID will expand <strong>the</strong> array of access services and resources available to NTID-supported<br />
students in <strong>the</strong> o<strong>the</strong>r colleges of RIT in response to <strong>the</strong> changing characteristics of<br />
entering students.<br />
Highlights of Accomplishments Regarding Access Services<br />
- NTID continues to inclusively accommodate impressive communication diversity among our<br />
students, as exemplified by a sampling of recent results from NTID’s<br />
Language/Communication Background Questionnaire (Academic Year 2009-10):<br />
For associate-degree deaf and hard-of-hearing students, when interacting with o<strong>the</strong>r<br />
deaf and hard-of-hearing students, 53 percent use sign language alone, 12 percent<br />
use speech alone, and 34 percent use both sign and speech. When interacting with<br />
hearing people, 8 percent use sign language alone, 40 percent use speech alone,<br />
and 22 percent use both sign and speech.<br />
For baccalaureate-degree deaf and hard-of-hearing students, when interacting with<br />
o<strong>the</strong>r deaf and hard-of-hearing students, 41 percent use sign language alone,<br />
15 percent use speech alone, and 37 percent use both sign and speech. When<br />
interacting with hearing people, 2 percent use sign language alone, 76 percent use<br />
speech alone, and 7 percent use both sign and speech.<br />
Most of our students use sign language, spoken language and amplification, and do so with<br />
impressive adaptability, depending on with whom <strong>the</strong>y are interacting. It is an adaptability that<br />
will serve our students well in <strong>the</strong>ir lives and careers beyond RIT, and one that NTID will<br />
continue to cultivate as an educational community.<br />
- - There continues to be an increase in <strong>the</strong> number of students who have cochlear implants –<br />
from 120 students in fall 2003 to 305 in fall 2010 (see Hearing Assessment and Cochlear<br />
Implant In<strong>for</strong>mation page).<br />
In coming years NTID expects a continuing increase in <strong>the</strong> number of students who<br />
have used cochlear implants from an early age. Ra<strong>the</strong>r than relying on access services<br />
that are strictly sign language-based, many of <strong>the</strong>se students rely primarily on<br />
text-based translation.<br />
Already we see a growing trend in student demand <strong>for</strong> such access services. These services<br />
– like C-Print ® – use captionists to type a professor’s and classmates’ spoken words into a<br />
computer, allowing deaf and hard-of-hearing students without sign language skills to read <strong>the</strong><br />
text on a computer screen <strong>for</strong> real-time access to classroom instruction.<br />
Strategic Planning -32-
Strategic Vision 2010 (continued)<br />
NTID has responded to <strong>the</strong> changing needs of deaf and hard-of-hearing students registered<br />
in <strong>the</strong> o<strong>the</strong>r colleges of RIT by expanding <strong>the</strong> array of access services, including speech-totext<br />
captioning services; we continue to make significant improvements in <strong>the</strong> delivery of<br />
access services. Throughout <strong>the</strong> implementation of Strategic Vision 2010, we have:<br />
Increased <strong>the</strong> provision of interpreting services by 11 percent, from a total of<br />
99,175 hours in FY 2005 to a total of 116,782 hours in FY 2010; and<br />
Increased <strong>the</strong> provision of C-Print real-time captioning services by 43 percent, from a<br />
total of 7,485 hours in FY 2005 to a total of 19,493 hours in FY 2010.<br />
In addition to increased provision of access services, as a result of <strong>the</strong> direction provided by<br />
Strategic Vision 2010, we also have established two significant Research Centers responsive to<br />
<strong>the</strong> broad topic of access services.<br />
The Center on Access Technology <strong>for</strong> Students who are <strong>Deaf</strong> or Hard-of-Hearing (CAT),<br />
continues to address <strong>the</strong> challenges of utilizing or adapting new access technologies <strong>for</strong><br />
use in postsecondary education. The center investigates, evaluates and reports on <strong>the</strong><br />
most effective use of access technologies and accelerates <strong>the</strong> implementation of best<br />
practices within postsecondary deaf education. Its current focus areas are: classroom<br />
access technologies, mobile technologies, audio and sound technologies, and training<br />
and evaluation services. CAT, over several years, has participated in multiple<br />
externally funded projects and submitted additional proposals. (See Research section <strong>for</strong><br />
more in<strong>for</strong>mation.)<br />
The Center <strong>for</strong> Education Research Partnerships (CERP) establishes and joins research<br />
partnerships concerning development and learning among deaf and hard-of-hearing<br />
students across <strong>the</strong> lifespan and in various educational settings. Included in several<br />
areas of concentration is research on communication via real-time text as specified in<br />
our Strategic Vision 2010. Unique features of <strong>the</strong> center include: an emphasis on<br />
research partnerships, considering learning in a variety of settings, serving as an<br />
incubator <strong>for</strong> research ideas and grant proposals, providing seed funding <strong>for</strong><br />
collaborative activities and obtaining support from external funding. (See Research<br />
section <strong>for</strong> more in<strong>for</strong>mation.)<br />
4. NTID will develop an Educational Outreach Consortium to improve <strong>the</strong> education and career<br />
development of deaf and hard-of-hearing students. As a first step, <strong>the</strong> consortium primarily<br />
will focus on pre-college audiences of students.<br />
Highlights of Accomplishments Regarding Educational Outreach Consortium<br />
As a result of guidance provided by Strategic Vision 2010, <strong>the</strong> Educational Outreach Consortium<br />
accomplished a host of outreach initiatives. Summaries are provided below, with extended details<br />
provided in <strong>the</strong> Outreach section of this report.<br />
PEPNet-Nor<strong>the</strong>ast. In October 2006, PEPNet-Nor<strong>the</strong>ast, <strong>for</strong>merly <strong>the</strong> Nor<strong>the</strong>ast <strong>Technical</strong><br />
Assistance Center (NETAC), was awarded a five-year $5,000,000 grant from <strong>the</strong> U.S.<br />
Department of Education, Office of Special Education Programs. The center is one of four<br />
regional centers comprising <strong>the</strong> Postsecondary Education Programs Network (PEPNet) that<br />
assists secondary and postsecondary institutions in more effectively addressing <strong>the</strong><br />
transition, postsecondary, vocational, technical, continuing and adult education needs of<br />
individuals who are deaf or hard-of-hearing.<br />
-33-<br />
Strategic Planning
Strategic Vision 2010 (continued)<br />
Explore Your Future. Explore Your Future (EYF) provides a five-day career exploration and<br />
evaluation program <strong>for</strong> deaf and hard-of-hearing students about to enter <strong>the</strong>ir junior or senior<br />
year of high school.<br />
TechGirlz Camp. TechGirlz Camp is a one-week summer camp program <strong>for</strong> deaf and hardof-hearing<br />
7 th –9 th grade girls who have a strong interest in science, technology, engineering<br />
and math fields (STEM). Students build a personal computer and spend time in <strong>the</strong> chemistry<br />
and manufacturing labs.<br />
SpiRIT Writing Contest. High school students submit multiple writing samples, including an<br />
essay or a report written <strong>for</strong> a school assignment, a creative writing piece and a writing<br />
sample of 250 words written specifically <strong>for</strong> <strong>the</strong> competition. Over <strong>the</strong> years, <strong>the</strong> writing<br />
samples have included topics such as physician-assisted suicide, supporting <strong>the</strong> fight <strong>for</strong><br />
independence from Great Britain, <strong>the</strong> Black Death, and should <strong>the</strong> <strong>National</strong> Basketball<br />
Association have a dress code.<br />
Steps to Success. <strong>Deaf</strong> and hard-of-hearing African-American, Latino-American and Native-<br />
American (AALANA) students attend Steps to Success, a career exploration mini-camp.<br />
These students, entering 7 th , 8 th or 9 th grades, explore career options through hands-on<br />
experiences using computers, working with robots and doing science experiments.<br />
Counselors and technical faculty role models present <strong>the</strong> program.<br />
Digital Arts, Film and Animation Competition. Students submit projects to compete in <strong>the</strong><br />
Digital Arts, Film and Animation Competition. Categories include mixed digital media, photo<br />
illustration, Web page design, graphic media, 3-D animation, interactive media and film. The<br />
winners, accompanied by parents and teachers, came to RIT to attend <strong>the</strong> awards ceremony.<br />
Math Competition. NTID hosts an annual math competition <strong>for</strong> deaf and hard-of-hearing<br />
middle school students. The competition involves students from schools throughout <strong>the</strong><br />
country, competing as individuals and teams to solve a variety of ma<strong>the</strong>matical problems<br />
within designated time periods. Students in grades 6, 7 and 8 participate. The mission of <strong>the</strong><br />
nationwide competition is to increase enthusiasm <strong>for</strong>, and enhance achievement in, middle<br />
school ma<strong>the</strong>matics throughout <strong>the</strong> United States. The materials challenge students’ math<br />
skills, develop <strong>the</strong>ir self-confidence and reward <strong>the</strong>m <strong>for</strong> <strong>the</strong>ir achievements.<br />
<strong>National</strong> Science Fair. The fair hosts middle school and high school students from around<br />
<strong>the</strong> country who compete <strong>for</strong> <strong>the</strong> top honors in <strong>the</strong> individual middle school, individual high<br />
school, and team divisions.<br />
<strong>Deaf</strong> Initiative in Technology. The <strong>Deaf</strong> Initiative in Technology (DiiT) project (<strong>for</strong>merly <strong>Deaf</strong><br />
Initiative in In<strong>for</strong>mation Technology) was established with two continuing grants from <strong>the</strong><br />
<strong>National</strong> Science Foundation. During <strong>the</strong> six years of NSF funding, DiiT focused on <strong>the</strong> area<br />
of in<strong>for</strong>mation technology. Since <strong>the</strong> end of NSF funding several years ago, NTID has<br />
supported <strong>the</strong> project, expanding <strong>the</strong> DiiT model to o<strong>the</strong>r disciplines. Faculty members from<br />
various departments offer workshops on a wide range of topics during <strong>the</strong> year. Outside<br />
funding also has been acquired to support <strong>the</strong> annual offerings of DiiT workshops in <strong>the</strong><br />
Greater Los Angeles area.<br />
Project Fast Forward. Project Fast Forward is a three-year project funded in July 2006 by<br />
<strong>the</strong> Advanced Technological Education program of <strong>the</strong> <strong>National</strong> Science Foundation. The<br />
project is housed in NTID’s In<strong>for</strong>mation and Computing Studies Department. The goal of<br />
Strategic Planning -34-
Strategic Decisions 2020<br />
Current Context<br />
Project Fast Forward is to increase <strong>the</strong> number of deaf and hard-of-hearing students who<br />
pursue a postsecondary education in a computer-related field by creating a pathway <strong>for</strong><br />
students to transition from high school to college in <strong>the</strong> area of in<strong>for</strong>mation technology (IT).<br />
To accomplish this, NTID partners with high schools across <strong>the</strong> country to offer dual-credit IT<br />
courses <strong>for</strong> deaf and hard-of-hearing students and professional development <strong>for</strong> teachers<br />
and guidance counselors.<br />
Not only with regard to <strong>the</strong> past five years since Strategic Vision 2010: Creating Our Future, but over <strong>the</strong><br />
last 18 years since Strategic Plan: An Agenda <strong>for</strong> Action in 1992, NTID’s evolution as an educational<br />
community can be traced along seven vectors:<br />
Increasing emphasis on graduates achieving baccalaureate-level degrees, while maintaining<br />
focus and commitment to quality associate-level degrees leading directly to <strong>the</strong> workplace;<br />
Improving <strong>the</strong> array and level of access services available <strong>for</strong> students who are deaf or hardof-hearing<br />
students enrolled throughout <strong>the</strong> o<strong>the</strong>r colleges and programs of RIT;<br />
More seamless articulation among NTID- and RIT-wide academic and student life programs;<br />
Cultivating an educational community that, in <strong>the</strong> face of increasing diversity among entering<br />
students, values and supports <strong>the</strong> educational process of students exploring alternative<br />
perspectives in developing <strong>the</strong>ir own personal, career and cultural identities;<br />
Increasing emphasis regarding NTID’s responsibility <strong>for</strong> contributing to <strong>the</strong> preparation of<br />
professionals serving individuals who are deaf or hard-of-hearing;<br />
Increasing emphasis on reaching out to enhance <strong>the</strong> education and career choices of<br />
students who are deaf or hard-of-hearing at middle school, high school and postsecondary<br />
levels, as well as adults who are deaf or hard-of-hearing seeking to update <strong>the</strong>ir technical<br />
skills; and<br />
Increasing experimentation and advancement in <strong>the</strong> use of both on-site and remote<br />
technologies to support <strong>the</strong> access and learning of individuals who are deaf or<br />
hard-of-hearing.<br />
These vectors have guided us into <strong>the</strong> world we face today, and have provided context <strong>for</strong> Strategic<br />
Decisions 2020: Shaping NTID’s Future Through Innovation, NTID’s most recent strategic planning<br />
initiative, completed in April 2010. Implementation of this strategic plan is now underway in FY 2011;<br />
an update will be provided in next year’s annual report.<br />
RIT/NTID students at <strong>the</strong><br />
Imagine RIT: Innovation and<br />
Creativity Festival show young<br />
members of <strong>the</strong> community a<br />
few signs in ASL.<br />
-35-<br />
Strategic Planning
Strategic Decisions 2020 (continued)<br />
Strategic Decisions 2020<br />
Strategic Decisions 2020 is rooted in our founding mission statement. This statement establishes our<br />
institutional responsibility <strong>for</strong> working with students to develop <strong>the</strong>ir academic, career and life-long<br />
learning skills as future contributors in a rapidly changing world. It also recognizes our role as a special<br />
resource <strong>for</strong> preparing individuals who are deaf or hard-of-hearing, <strong>for</strong> conducting applied research in<br />
areas critical to <strong>the</strong> advancement of individuals who are deaf or hard-of-hearing, and <strong>for</strong> disseminating<br />
our cumulative expertise.<br />
Strategic Decisions 2020 builds on two documents and extensive community feedback. The<br />
first document, Strategic Vision <strong>for</strong> NTID: Shaping our Future by Embracing Change, was developed by<br />
<strong>the</strong> Strategic Vision 2020 Committee and submitted in June 2009. The second document was a response<br />
to <strong>the</strong> first, developed by <strong>the</strong> NTID Administrative Team and disseminated to <strong>the</strong> NTID community <strong>for</strong><br />
discussion and feedback in September 2009. Strategic Decisions 2020 benefits from <strong>the</strong> respective<br />
contributions of both documents, and <strong>the</strong> community dialogue <strong>the</strong>y engendered.<br />
The strategic planning process was originally expected to be completed by <strong>the</strong> end of <strong>December</strong> 2009.<br />
However, <strong>the</strong> timeline <strong>for</strong> community discussion and feedback was extended at <strong>the</strong> urging of <strong>the</strong> Strategic<br />
Vision Planning Committee from early <strong>December</strong> 2009 to February 2010. There was general concern<br />
expressed that <strong>the</strong> community had not been provided ample opportunity to critique <strong>the</strong> document<br />
submitted by <strong>the</strong> Strategic Vision Committee and <strong>the</strong> response developed by NTID leadership. As a<br />
result, five open <strong>for</strong>ums were conducted; four open to students, staff and faculty and one conducted<br />
with staff and faculty only. In addition, three <strong>for</strong>ums were held specifically <strong>for</strong> students. Attendance at<br />
each <strong>for</strong>um was strong and increased with each successive session. Whatever strengths and<br />
credibility characterize Strategic Decisions 2020 derive from <strong>the</strong> vitality and quality of this<br />
community-wide discourse.<br />
Strategic Decisions 2020 establishes key initiatives responding to future challenges and shaping future<br />
opportunities. The initiatives are organized around six central <strong>the</strong>mes: Students; Program and Curriculum<br />
Development; Communication; Access; Faculty/Staff; and Innovation, Scholarship, and Research.<br />
Examples of SD 2020 initiatives include:<br />
Pursuing enrollment targets and admissions and programming strategies that will result in<br />
increasing numbers of our graduates achieving baccalaureate degrees and higher, while<br />
maintaining focus and commitment to quality associate-level degree programs leading directly<br />
to <strong>the</strong> workplace;<br />
Improving services to under-prepared students through working with regional partners to<br />
implement intensive summer academic preparation programs in selected high-growth,<br />
ethnically diverse areas of <strong>the</strong> country. Through this initiative, NTID will identify those students<br />
demonstrating promise <strong>for</strong> success in career-focused degree-level programs and beyond, and<br />
provide consultation to o<strong>the</strong>rs regarding postsecondary educational alternatives;<br />
Expanding NTID’s role as a <strong>National</strong> Resource Center of Excellence regarding <strong>the</strong> education of<br />
deaf and hard-of-hearing students in senior high school (grades 10, 11 and 12) and at <strong>the</strong><br />
postsecondary level. Components of this identity as a <strong>National</strong> Resource Center of Excellence<br />
will include:<br />
- Center <strong>for</strong> Excellence in STEM Education. NTID currently is working to develop an<br />
externally funded Center <strong>for</strong> Excellence in STEM Education <strong>for</strong> <strong>Deaf</strong> and Hard-of-Hearing<br />
Students. This is an example of making our expertise available nationally and enhancing<br />
deaf and hard-of-hearing students’ access to STEM fields.<br />
Strategic Planning -36-
Strategic Decisions 2020 (continued)<br />
- NTID Research Centers. NTID will organize research resources into Research Centers<br />
focused on such strategic areas of research as: Teaching and Learning; Communication;<br />
Technology, Access, and Support Services; and Employment and Adaptability to Social<br />
Changes and <strong>the</strong> Global Workplace.<br />
- Outreach Programs. NTID will continue to extend outreach activities to junior and senior<br />
high school students who are deaf or hard-of-hearing, many of whom represent AALANA<br />
populations, to expand <strong>the</strong>ir horizons regarding a college education. We also support<br />
o<strong>the</strong>r colleges and universities serving students who are deaf or hard-of-hearing, as well<br />
as post-college adults who are deaf or hard-of-hearing;<br />
Enhancing ef<strong>for</strong>ts to become a recognized national leader in <strong>the</strong> exploration, adaptation,<br />
testing, and implementation of new technologies to enhance access to, and support of, learning<br />
by deaf and hard-of-hearing individuals;<br />
Enhancing professional development resources and strategies in anticipation of increasing<br />
numbers of retirements among staff and faculty, and increasing numbers of new hires; and<br />
Establishing a center-based model <strong>for</strong> addressing NTID’s strategic research agenda, including<br />
support <strong>for</strong> discipline-based research, fostering <strong>the</strong> involvement of students in scholarship and<br />
innovation, enhancing institutional research, and providing additional space <strong>for</strong> innovation,<br />
scholarship and research.<br />
-37-<br />
Strategic Planning
Admissions and Enrollment<br />
Throughout <strong>the</strong> year, NTID’s Office of Admissions hosts open house<br />
events <strong>for</strong> prospective students and <strong>the</strong>ir families, including<br />
academic department meetings, campus tours, residence hall tours,<br />
and admissions and financial aid presentations.<br />
-39-<br />
Admissions and Enrollment<br />
Admissions and<br />
Enrollment<br />
<strong>National</strong> <strong>Technical</strong> <strong>Institute</strong> <strong>for</strong> <strong>the</strong> <strong>Deaf</strong>
Admissions and Enrollment Highlights<br />
Because deafness is a low-incidence disability, with deaf and hard-of-hearing students widely dispersed<br />
throughout <strong>the</strong> nation, recruiting and admitting qualified students to NTID is always a challenge.<br />
Admission counselors visited 465 schools during <strong>the</strong> FY 2010 admissions cycle. Visits this year covered<br />
444 high schools, including 156 in <strong>the</strong> Midwest, 76 in <strong>the</strong> Sou<strong>the</strong>ast, 72 in <strong>the</strong> Nor<strong>the</strong>ast, 61 in New York<br />
State and 79 in <strong>the</strong> West Coast Region. Counselors visited 21 colleges: seven in <strong>the</strong> West Coast region,<br />
seven in <strong>the</strong> Midwest, one in <strong>the</strong> Nor<strong>the</strong>ast, four in New York State and two in <strong>the</strong> Sou<strong>the</strong>ast region.<br />
Admissions participated in six college fairs, including four in <strong>the</strong> Midwest, one in <strong>the</strong> Sou<strong>the</strong>ast and one in<br />
<strong>the</strong> West Coast region.<br />
The number of new students entering NTID in fall 2010 was 435. The total included 341 deaf and hardof-hearing<br />
freshmen and transfers, 22 first-year deaf and hard-of-hearing graduate students (12 in <strong>the</strong><br />
Master of Science program in Secondary Education of Students who are <strong>Deaf</strong> or Hard-of-Hearing<br />
[MSSE] and 10 in o<strong>the</strong>r RIT master’s programs), and 72 first-year hearing students (57 in <strong>the</strong> ASL-<br />
English Interpretation program, and 15 in <strong>the</strong> MSSE program).<br />
Overall, NTID’s applicants increased by 2 percent from last year’s 966 to 983 applicants <strong>for</strong> fall 2010<br />
enrollment. Total enrollment was 1,521 compared to 1,474 <strong>for</strong> last year. The breakdown of <strong>the</strong> 1,521<br />
students is as follows:<br />
<strong>Deaf</strong> and<br />
Hard-of Hearing Hearing Total<br />
Undergraduate Programs<br />
Career Exploration Studies 112 0 112<br />
Career-Focused Associate Programs 488 0 488<br />
Transfer Associate Programs 168 0 168<br />
Baccalaureate (ASL-English Interpretation)<br />
Baccalaureate/Master’s Programs in O<strong>the</strong>r<br />
0 147* 147*<br />
RIT Colleges 495 0 495<br />
Subtotal NTID Undergraduate Programs 1,263 147 1,410<br />
Graduate Programs at RIT 40 0 40<br />
MSSE Program 29 42 71<br />
Total Enrolled Students 1,332 189 1,521<br />
NTID’s student population remains strong in both ethnic and geographic diversity. Minority students<br />
represent 34 percent of this year’s fall 2010 entering class, compared to 29 percent of <strong>the</strong> total<br />
student body. Minority students have represented approximately 28 to 34 percent of <strong>the</strong> entering student<br />
population over <strong>the</strong> last five years. Additionally, minority students have represented approximately 24 to<br />
29 percent of <strong>the</strong> entire student population over <strong>the</strong> last five years (<strong>for</strong> more in<strong>for</strong>mation see <strong>the</strong><br />
Diversity and Pluralism section). Students come from all over <strong>the</strong> country with 14 percent from <strong>the</strong> West,<br />
22 percent from <strong>the</strong> South, 25 percent from <strong>the</strong> Midwest, and 39 percent from <strong>the</strong> Nor<strong>the</strong>ast.<br />
In addition, NTID enrolled 10 new international students. The total number of international students<br />
is 41, or 2.7 percent of <strong>the</strong> entire student population. International students have represented<br />
approximately 3 or 4 percent of <strong>the</strong> entire student population in <strong>the</strong> last five years.<br />
In summary, NTID registered 435 new students and is serving a total of 1,521 students.<br />
* There is an additional student who is a double-major, with one major in NTID and ano<strong>the</strong>r in a different college of RIT.<br />
Admissions and Enrollment -40-
Admissions and Enrollment Highlights (continued)<br />
NTID’s fall 2010 enrollment of 1,521 is <strong>the</strong> highest enrollment in our history, exceeding our increased<br />
enrollments last year. It also exceeds <strong>the</strong> high enrollments from 1983 to 1988 resulting from <strong>the</strong> rubella<br />
epidemic 20 years earlier in which pregnant mo<strong>the</strong>rs who contracted rubella gave birth to increased<br />
numbers of deaf children.<br />
1600<br />
1400<br />
1200<br />
1000<br />
800<br />
600<br />
400<br />
200<br />
0<br />
1,358<br />
(1984)<br />
-41-<br />
1,521<br />
(2010)<br />
Admissions and Enrollment
Comparative Admissions Data<br />
Total applications increased by 2 percent from last<br />
year. The acceptance rate was 54 percent of<br />
applications. Total registrations were 351, achieving<br />
a yield rate of 67 percent.<br />
Admissions and Enrollment -42-<br />
<strong>Deaf</strong> and Hard-of-Hearing Freshman and Transfers<br />
Number of Students*<br />
FY 2007 FY 2008 FY 2009 FY 2010 FY 2011<br />
Total Applicants 819 939 1,000 966 983<br />
% Increase or Decrease<br />
from Previous Year +7% +15% +6% -3% +2%<br />
Accepted Applicants 450 522 594 521 526<br />
% Increase or Decrease<br />
from Previous Year +6% +16% +14% -12% +1%<br />
Acceptance Rate<br />
(Percent of Total Applicants) 55% 56% 59% 54% 54%<br />
Registrations 341 377 396 341 351<br />
Yield Rate<br />
(Registrations as a Percent<br />
of Accepted Applicants) 76% 72% 67% 65% 67%<br />
* Figures reported include deaf and hard-of-hearing international students, but do not include admissions activity in <strong>the</strong> ASL-<br />
English Interpretation program or <strong>the</strong> Master of Science program in Secondary Education. Specific data on <strong>the</strong>se students is<br />
reported in <strong>the</strong> section on Academic Programs.
Summer Vestibule Program<br />
The Summer Vestibule Program (SVP) is a 10-day<br />
experience that allows new students to engage in<br />
career exploration and decision-making, adjust to<br />
college life and assess <strong>the</strong>ir academic<br />
competencies. Students get hands-on experience<br />
and in<strong>for</strong>mation about various academic programs<br />
and majors.<br />
SVP includes a Student/Parent Orientation<br />
Weekend designed to give participants an<br />
overview of <strong>the</strong> program and to familiarize <strong>the</strong>m<br />
with NTID and its place on <strong>the</strong> RIT campus.<br />
In<strong>for</strong>mational seminars, awareness workshops and<br />
in-depth orientation programs are offered to<br />
facilitate student-parent separation and student<br />
transition to <strong>the</strong> college environment.<br />
-43-<br />
There were 269 SVP registrants <strong>for</strong> summer 2010.<br />
Number of Students*<br />
FY 2006 FY 2007 FY 2008 FY 2009 FY 2010<br />
SVP Students Accepted 354 406 452 409 407<br />
SVP Students Registered at Start of Program 219 254 295 265 269<br />
SVP Students Completing Program 217 253 294 259 268<br />
SVP Students Registered in Academic<br />
Programs <strong>for</strong> Fall Quarter (based on <strong>the</strong> end<br />
of fall registration) 215 253 294 253 263<br />
RIT/NTID students chat in <strong>the</strong> Student Development Center.<br />
* Figures reported include deaf and hard-of-hearing international students, but do not include admissions activity in <strong>the</strong><br />
ASL-English Interpretation program or <strong>the</strong> Master of Science in Secondary Education program. Specific data on <strong>the</strong>se students is<br />
reported in <strong>the</strong> section on Academic Programs.<br />
Admissions and Enrollment
Entering Registered Students<br />
Although NTID registers new students in each<br />
quarter throughout <strong>the</strong> academic year, <strong>the</strong> vast<br />
majority enter in <strong>the</strong> fall, ei<strong>the</strong>r following <strong>the</strong><br />
Summer Vestibule Program (SVP) or as fall directentry<br />
students. SVP is a 10-day orientation and<br />
career-sampling program held in August. Students<br />
who finish <strong>the</strong> program become part of <strong>the</strong> fall<br />
entering class.<br />
Admissions and Enrollment -44-<br />
The remainder of <strong>the</strong> fall class enters directly into a<br />
program because <strong>the</strong>ir academic preparation<br />
suggests that <strong>the</strong>y do not need <strong>the</strong> SVP experience.<br />
As of fall 2010, <strong>the</strong> number of new students in was<br />
up 5 percent from <strong>the</strong> previous fall, from 355 to 373<br />
students.<br />
Number of Students*<br />
FY 2006 FY 2007 FY 2008 FY 2009 FY 2010<br />
Winter (Off-Term) 12 18 20 24 23<br />
Spring (Off-Term) 19 25 18 2 9<br />
Summer (Off-Term) 2 0 0 0 0<br />
Subtotal Off-Term 33 43 38 26 32<br />
Fall (SVP) 215 253 299** 258** 276***<br />
Fall (Direct Entry) 93 81 86 71 65<br />
Subtotal Fall 308 334 385 329 341<br />
Total 341 377 423 355 373<br />
* Figures reported include deaf and hard-of-hearing undergraduate international students, but do not include deaf graduate<br />
students or admissions activity in <strong>the</strong> ASL-English Interpretation program or <strong>the</strong> Master of Science program in Secondary<br />
Education. Specific data on <strong>the</strong>se students is reported in <strong>the</strong> section on Academic Programs.<br />
** Includes five re-matriculating students.<br />
*** Includes 13 re-matriculating students.
NTID Student Enrollment by Quarter (<strong>Deaf</strong> and Hard-of-Hearing Students Only)<br />
The enrollment reported reflects only <strong>the</strong> deaf and<br />
hard-of-hearing students in undergraduate<br />
programs on <strong>the</strong> RIT campus or in graduate<br />
programs at o<strong>the</strong>r RIT colleges. Not included are<br />
hearing students enrolled in <strong>the</strong> ASL-English<br />
Interpretation program (147), or deaf,<br />
PERIOD<br />
COVERED<br />
FALL<br />
QUARTER<br />
WINTER<br />
QUARTER<br />
hard-of-hearing or hearing students enrolled in <strong>the</strong><br />
Master of Science program in Secondary Education<br />
(71). In addition, large numbers of hearing, deaf<br />
and hard-of-hearing students access a variety of<br />
part-time and non-credit-bearing coursework at<br />
NTID throughout <strong>the</strong> year.<br />
-45-<br />
SPRING<br />
QUARTER<br />
SUMMER<br />
QUARTER<br />
SUMMER<br />
VESTIBULE<br />
PROGRAM<br />
A B A B C A B C A B A B<br />
FY 91: Oct. 90-<br />
Sep. 91 1,105 0.82% 1,048 2.54% -5.16% 982 1.34% -6.30% 255 -14.72% 245 -10.58%<br />
FY 92: Oct. 91-<br />
Sep. 92 1,086 -1.72% 1,027 -2.00% -5.43% 991 0.92% -3.51% 260 1.96% 259 5.71%<br />
FY 93: Oct. 92-<br />
Sep. 93 1,130 4.05% 1,058 3.02% -6.37% 978 -1.<strong>31</strong>% -7.56% 251 -3.46% 235 -9.27%<br />
FY 94: Oct. 93-<br />
Sep. 94 1,092 -3.36% 1,021 -3.50% -6.50% 978 0.00% -4.21% 299 19.12% 196 -16.60%<br />
FY 95: Oct. 94-<br />
Sep. 95 1,045 -4.30% 977 -4.<strong>31</strong>% -6.51% 900 -7.98% -7.88% 240 -19.73% 272 38.78%<br />
FY 96: Oct. 95-<br />
Sep. 96 1,056 1.05% 968 -0.92% -8.33% 933 3.67% -3.62% 194 -19.17% 260 -4.41%<br />
FY 97: Oct. 96-<br />
Sep. 97 1,085 2.75% 1,021 5.48% -5.90% 965 3.43% -5.48% 187 -3.61% 253 -2.69%<br />
FY 98: Oct. 97-<br />
Sep. 98 1,085 0.00% 1,010 -1.08% -6.91% 960 -0.52% -4.95% 189 1.07% 241 -4.74%<br />
FY 99: Oct. 98-<br />
Sep. 99 1,155 6.45% 1,030 1.98% -10.82% 976 1.67% -5.24% 217 14.81% 255 5.81%<br />
FY 00: Oct. 99-<br />
Sep. 00 1,107 -4.16% 1,040 0.97% -6.05% 1009 3.38% -2.98% 221 1.84% 256 0.39%<br />
FY 01: Oct. 00-<br />
Sep. 01 1,113 0.54% 1,045 0.48% -6.11% 1,017 0.79% -2.68% 236 6.79% 242 -5.47%<br />
FY 02: Oct. 01-<br />
Sep. 02 1,151 3.41% 1,056 1.05% -8.25% 1,007 -0.98% -4.64% 224 -5.08% 234 -3.<strong>31</strong>%<br />
FY 03: Oct. 02-<br />
Sep. 03 1,122 -2.52% 1,027 -2.75% -8.47% 994 -1.29% -3.21% 228 1.79% 195 -16.67%<br />
FY 04: Oct. 03-<br />
Sep. 04<br />
FY 05: Oct. 04-<br />
1,109 -1.16% 1,047 1.95% -5.59% 1,005 1.11% -4.01% 249 9.21% 168 -13.85%<br />
Sep. 05<br />
FY 06: Oct. 05-<br />
1,097 -1.08% 1,029 -1.72% -6.20% 962 -4.28% -6.51% 222 -10.84% 190 13.10%<br />
Sep. 06<br />
FY 07: Oct. 06-<br />
1,066 -2.83% 988 -3.98% -7.32% 926 -3.74% -6.28% 263 18.47% 219 15.26%<br />
Sep. 07<br />
FY 08: Oct. 07-<br />
1,064 -0.19% 998 1.01% -6.20% 963 4.00% -3.51% 339 28.90% 254 15.98%<br />
Sep. 08<br />
FY 09: Oct. 08-<br />
1,154 8.46% 1,099 10.12% -4.77% 1,040 8.00% -5.37% 396 16.81% 295 16.14%<br />
Sep. 09<br />
FY 10: Oct. 09-<br />
1,260 9.19% 1,216 10.65% -3.49% 1,155 11.06% -5.02% 428 8.08% 265 -10.17%<br />
Sep. 10<br />
FY 11: Oct. 10-<br />
1,275 1.20% 1,166 -4.11% -8.55% 1,170 1.90% 0.34% 411 -3.97% 269 1.51%<br />
Sep. 11 1,303 2.20%<br />
NOTES: Column A = Number of Student Enrollments <strong>for</strong> <strong>the</strong> period covered<br />
Column B = Percent Change of Enrollment from <strong>the</strong> same quarter in previous year<br />
Column C = Percent Change of Enrollment from <strong>the</strong> previous quarter<br />
Admissions and Enrollment
Percent of Registered Students with Full-Time Status<br />
On average, 95 percent of NTID-supported<br />
students are registered full time. At RIT, full-time<br />
status is defined as taking at least 12 credit hours<br />
in an academic quarter.<br />
Admissions and Enrollment -46-<br />
FY 2006 FY 2007 FY 2008 FY 2009 FY 2010<br />
Number<br />
Percent Full-Time Total<br />
Career Exploration 97% 99% 99% 99% 100% 112 112<br />
Career-Focused and Transfer<br />
Associate Degrees 98% 98% 98% 97% 97% 615 636<br />
Pre-Baccalaureate 100% 100% 97% 100% 100% 16 16<br />
Cross-Registered<br />
Baccalaureate and Graduate 95% 92% 91% 93% 93% 481 517<br />
ASL-English Interpretation 89% 91% 91% 93% 97% 143 147<br />
Master of Science in Secondary<br />
Education (MSSE)* 91% 85% 73% 75% 80% 57 71<br />
Overall 94% 95% 94%** 94%*** 95% 1,424 1,499****<br />
* Included <strong>for</strong> FY 2007 and FY 2008 are non-matriculated students (between four and 15, per year) taking courses offered by <strong>the</strong><br />
Master of Science program in Secondary Education, but who are part of a grant-supported joint program between NTID and<br />
Nazareth College of Rochester to train speech pathologists to work with deaf and hard-of-hearing persons.<br />
** In<strong>for</strong>mation on full-time status is not available <strong>for</strong> 24 currently registered students, who are <strong>the</strong>re<strong>for</strong>e not included.<br />
*** In<strong>for</strong>mation on full-time status is not available <strong>for</strong> 25 currently registered students, who are <strong>the</strong>re<strong>for</strong>e not included.<br />
**** In<strong>for</strong>mation on full-time status is not available <strong>for</strong> 22 currently registered students, who are <strong>the</strong>re<strong>for</strong>e not included.
International Student Recruitment<br />
This year, applications from international students<br />
numbered 63 and, of those, 14 were accepted and<br />
nine registered. Canadian students have always<br />
represented <strong>the</strong> largest contingent of international<br />
students, but many of <strong>the</strong>m continue to experience<br />
a lack of funding resources, which discouraged a<br />
number of prospective students from applying or<br />
prevented many of those accepted from being able<br />
to attend NTID. Students from developing countries<br />
Applicant Continent of Origin<br />
also encounter financial difficulties, and NTID has<br />
only limited scholarship dollars to assist <strong>the</strong>m.<br />
However, per <strong>the</strong> Education of <strong>the</strong> <strong>Deaf</strong> Act,<br />
international students pay differing tuition rates,<br />
depending on whe<strong>the</strong>r <strong>the</strong>y are from a developing<br />
or developed country. Until <strong>the</strong> situation in Canada<br />
changes, and until we obtain additional private<br />
scholarship funds, enrollment of international<br />
students will continue to be a challenge.<br />
Number of Students*<br />
FY 2007 FY 2008 FY 2009 FY 2010 FY 2011<br />
Africa 9 19 9 20 12<br />
Asia 14 10 10 12 10<br />
Australia 0 0 0 0 0<br />
Europe 3 3 2 8 8<br />
North America 28 33 32 29 <strong>31</strong><br />
South America 0 0 0 0 2<br />
Total Applicants 54 65 53 69 63<br />
Accepted Applicants 13 11 15 13 14<br />
Acceptance Rate (Percent of<br />
Total Applicants) 24% 17% 28% 19% 22%<br />
New Registrations 10 10 7 12 9<br />
Yield Rate (New Registrations as a<br />
Percent of Accepted Applicants) 77% 91% 47% 92% 64%<br />
Returning International Students 32 34 <strong>31</strong> 30 <strong>31</strong><br />
Total Enrollment<br />
(Returning International Students<br />
plus New Registrations) 42 44 38 42 40<br />
* Figures reported do not include admissions activity in <strong>the</strong> ASL-English Interpretation program or <strong>the</strong> Master of Science program in<br />
Secondary Education. Specific data on <strong>the</strong>se students is reported in <strong>the</strong> section on Academic Programs.<br />
-47-<br />
Admissions and Enrollment
Demographic Characteristics of All Entering Students<br />
The demographic profile of entering students<br />
demonstrates little change from last year in most<br />
categories as shown below.*<br />
Admissions and Enrollment -48-<br />
FY 2007 FY 2008 FY 2009 FY 2010 FY 2011<br />
Characteristics of<br />
Entering Students<br />
Gender<br />
Male 61% 52% 51% 60% 54%<br />
Female 39% 48% 49% 40% 46%<br />
Mean Age at Entry 21 21 21 21 21<br />
Parents’ Hearing Status<br />
Both Hearing 92% 85% 92% 85% 86%<br />
Both <strong>Deaf</strong> 5% 5% 4% 9% 8%<br />
One Hearing/One <strong>Deaf</strong> 3% 10% 4% 6% 6%<br />
Origin of Entering Students<br />
United States by Region: 100% of U.S. students distributed across four regions<br />
West 11% 10% 11% 9% 14%<br />
Midwest 24% 20% 23% 26% 25%<br />
South 19% 23% 22% 22% 22%<br />
Nor<strong>the</strong>ast 46% 47% 44% 43% 39%<br />
Distribution of United States and International Students<br />
United States 96% 97% 97% 96% 96%<br />
International 4% 3% 3% 4% 3%<br />
School Background of Entering Students<br />
First Time in College 65% 74% 71% 72% 72%<br />
Transfer from O<strong>the</strong>r Colleges 17% 16% 17% 16% 20%<br />
Previously Enrolled at RIT 14% 6% 5% 8% 5%<br />
Graduate Students 4% 4% 7% 4% 3%<br />
* Figures reported include deaf and hard-of-hearing international students, but do not include admissions activity in <strong>the</strong><br />
ASL-English Interpretation program or <strong>the</strong> Master of Science in Secondary Education program. Specific data on <strong>the</strong>se students is<br />
reported in <strong>the</strong> section on Academic Programs.
Demographic Characteristics of Enrolled International Students Compared to<br />
Enrolled U.S. Students<br />
International<br />
FY 2011*<br />
U.S. Overall<br />
Demographics<br />
Gender<br />
Male 68% 55% 56%<br />
Female 33% 45% 44%<br />
Entry Age, All Students 25 23 23<br />
Age of Onset of <strong>Deaf</strong>ness<br />
Birth 78% 89% 88%<br />
1 - 3 Years of Age 22% 4% 5%<br />
More than 3 Years of Age 0% 7% 7%<br />
Entry Scores<br />
Hearing Level (Pure Tone Average) in Better Ear 97.6 dB 92.9 dB 93.0 dB<br />
ACT Composite Score 17.7 17.2 17.2<br />
Program Area<br />
Career Exploration 8% 9% 9%<br />
Career-Focused Associate Degrees 30% 38% 37%<br />
Transfer Associate Degrees 13% 13% 13%<br />
O<strong>the</strong>r Colleges of RIT Baccalaureate/Master’s 50% 41% 41%<br />
FY 2011 Status of Students Enrolled FY 2010<br />
Still Registered 67% 68% 68%<br />
Withdrawn 12% 15% 15%<br />
Graduated 21% 17% 17%<br />
* Figures reported do not include students in <strong>the</strong> ASL-English Interpretation program or <strong>the</strong> Master of Science in Secondary<br />
Education program. Specific data on <strong>the</strong>se students is reported in <strong>the</strong> section on Academic Programs.<br />
-49-<br />
Admissions and Enrollment
ACT In<strong>for</strong>mation on Entering Class (<strong>Deaf</strong> and Hard-of-Hearing Students Only)<br />
Beginning in 1969, <strong>the</strong> Stan<strong>for</strong>d Achievement Test<br />
(now known as <strong>the</strong> SAT) was used to evaluate<br />
educational achievement <strong>for</strong> admission to NTID. In<br />
1996, <strong>the</strong> decision was made to replace <strong>the</strong> SAT<br />
with <strong>the</strong> American College Test (ACT).<br />
Admissions and Enrollment -50-<br />
Mean scores <strong>for</strong> <strong>the</strong> ACT are presented below.<br />
Results indicate that skill levels of entering<br />
students were slightly below those of students<br />
entering in fall 2009.<br />
American College Test (ACT)* FY 2007 FY 2008 FY 2009 FY 2010 FY 2011<br />
ACT English 13.9 14.8 15.6 15.3 14.5<br />
ACT Reading 16.4 17.3 18.4 18.1 17.0<br />
ACT Ma<strong>the</strong>matics 17.2 17.7 18.1 18.3 17.5<br />
ACT Science Reasoning 18.2 19.0 19.1 19.4 18.7<br />
ACT Composite 16.8 17.5 18.2 17.9 17.2<br />
Admissions counselors and RIT/NTID graduates David Spiecker of<br />
Henrietta, N.Y., and Mich Gerson of South River, N.J., as well as<br />
admissions student worker Michelle of Grapevine, Texas, greet<br />
prospective students during an open house.<br />
* Figures reported include deaf and hard-of-hearing international students, but do not include admissions activity in <strong>the</strong><br />
ASL-English Interpretation program or <strong>the</strong> Master of Science in Secondary Education program. Specific data on <strong>the</strong>se students is<br />
reported in <strong>the</strong> section on Academic Programs.
Academic Skills of Entering Students<br />
The academic preparedness of most entering<br />
NTID-supported students is substantially below that<br />
of <strong>the</strong>ir hearing peers. NTID students directly<br />
admitted to one of RIT’s o<strong>the</strong>r colleges have a<br />
mean ACT composite score of 23, and represent<br />
19 percent of NTID’s entering class of 2010. The<br />
average ACT composite score <strong>for</strong> students entering<br />
transfer associate programs is 19, and represents<br />
18 percent of NTID’s entering class. The average<br />
ACT composite score <strong>for</strong> students entering careerexploration<br />
programs is 15, and represents<br />
22 percent of NTID’s entering class. Lastly, <strong>the</strong><br />
average ACT composite score <strong>for</strong> students entering<br />
Degree Level<br />
career-focused associate programs is 15, and<br />
represents 41 percent of NTID’s entering class.<br />
The average ACT composite score of 17 <strong>for</strong> all<br />
entering students is in <strong>the</strong> range achieved by<br />
students entering four-year schools with open<br />
admissions standards and many community<br />
colleges. By any measure, <strong>the</strong> majority of <strong>the</strong>se<br />
students would not be admissible to <strong>the</strong> o<strong>the</strong>r<br />
colleges of RIT, yet many deaf and hard-of-hearing<br />
students graduating from baccalaureate/master’s<br />
programs throughout RIT came through NTID first,<br />
which means <strong>the</strong>y graduated in spite of <strong>the</strong> fact that<br />
<strong>the</strong>ir entering ACT scores were in <strong>the</strong> 15-19 range.<br />
Percentage of<br />
<strong>Deaf</strong> and Hard-of-Hearing<br />
Students by Degree Level<br />
-51-<br />
ACT Composite<br />
Mean<br />
Bachelor’s in O<strong>the</strong>r RIT Colleges 19% 23<br />
NTID<br />
Career-Focused Associate Programs 41% 15<br />
Transfer Associate Programs 18% 19<br />
Career Exploration 22% 15<br />
Total* 100%<br />
Average Score of All Entering Students* 17<br />
* Includes only undergraduate students. Does not include students enrolled in <strong>the</strong> ASL-English Interpretation program.<br />
Admissions and Enrollment
Hearing Assessment and Cochlear Implant In<strong>for</strong>mation<br />
Hearing is measured in units of intensity called<br />
decibels (dB) at a variety of frequencies<br />
[Hz (cycles per second)]. The hearing level<br />
reported here is calculated by taking <strong>the</strong> arithmetic<br />
mean of an individual’s responses in dB to pure<br />
tones presented at 500 Hz, 1000 Hz and 2000 Hz.<br />
Normal hearing is in <strong>the</strong> range of –10 dB to 20 dB.<br />
Moderate hearing loss is defined as having a pure<br />
tone average of 40-55 dB, with moderately severe<br />
at 56-70 dB, severe at 71-90 dB and profound at<br />
90 dB or more. NTID continues to serve a<br />
prelingually, profoundly deaf population whose<br />
measured decibel hearing loss over <strong>the</strong> past five<br />
years averages 93.1 dB.<br />
The number of students with cochlear implants<br />
has increased to 305 in fall 2010.<br />
Admissions and Enrollment -52-<br />
The Communication Studies and Services<br />
Department currently has four audiologists trained<br />
to provide cochlear implant mapping, consultation<br />
and follow-up services. Mapping services are<br />
provided to users of cochlear implants from all<br />
three current manufacturers. Students sign up <strong>for</strong><br />
mapping and auditory training services in our new<br />
cochlear implant center. This five-room facility is<br />
equipped with state-of-<strong>the</strong>-art computer-based<br />
technology, training software and<br />
telecommunications devices. A separate area is<br />
available where faculty and staff can meet with<br />
students to troubleshoot cochlear implant issues<br />
and replace some parts of <strong>the</strong> external equipment.<br />
FY 2007 FY 2008 FY 2009 FY 2010 FY 2011<br />
Total Number of <strong>Deaf</strong> Students* 1,097 1,187 1,284 1,307 1,332<br />
Students with Cochlear Implants 212 245 255 273 305<br />
Percent with Cochlear Implants 19.8% 20.6% 19.9% 20.8% 22.9%<br />
Average Hearing Level in Best<br />
Ear of All <strong>Deaf</strong> Students<br />
Students<br />
350<br />
300<br />
250<br />
200<br />
150<br />
100<br />
50<br />
0<br />
212<br />
* This figure includes all deaf and hard-of-hearing students, undergraduate and graduate.<br />
245<br />
93.4 dB 92.6 dB 93.2 dB 93.2 dB 93.0 dB<br />
255<br />
FY 2007 FY 2008 FY 2009 FY 2010 FY 2011<br />
273<br />
305
Students with Secondary Disabilities<br />
NTID is working with significantly increased<br />
numbers of students with disabilities in addition to<br />
deafness. The table shows <strong>the</strong> number and percent<br />
of NTID-supported undergraduate students eligible<br />
to receive services from <strong>the</strong> RIT Disability Services<br />
Office, which serves students ―with physical or<br />
mental impairments that limit one or more major life<br />
activities.‖ NTID works directly with <strong>the</strong> RIT<br />
Disability Services Office to accommodate <strong>the</strong>se<br />
students through services such as notetaking and<br />
Fiscal Year Total <strong>Deaf</strong> Students*<br />
Number and Percent of Students<br />
Receiving Secondary Disability Services<br />
extended time to complete assignments. Their<br />
services ensure equal access to education based<br />
upon legal foundations established by federal<br />
law—<strong>the</strong> Rehabilitation Act of 1973, including<br />
Section 504, and <strong>the</strong> Americans with Disabilities<br />
Act of 1990. NTID also has a committee of<br />
faculty and staff that focuses on <strong>the</strong><br />
accommodation of deaf and hard-of-hearing<br />
students specifically with visual disabilities, a<br />
student population that continues to increase.<br />
-53-<br />
Students with<br />
Secondary Disabilities<br />
Percent<br />
2000 1,084 57 5%<br />
<strong>2001</strong> 1,089 82 8%<br />
2002 1,121 78 7%<br />
2003 1,093 97 9%<br />
2004 1,064 95 9%<br />
2005 1,055 110 10%<br />
2006 1,013 129 13%<br />
2007 1,019 115 11%<br />
2008 1,103 126 11%<br />
2009 1,212 133** 11%**<br />
2010 1,237 112 9%<br />
140<br />
120<br />
100<br />
80<br />
60<br />
40<br />
20<br />
0<br />
57<br />
82 78<br />
97 95<br />
* This figure includes all undergraduate deaf and hard-of-hearing students.<br />
** Secondary disability numbers <strong>for</strong> FY 2009 are estimates; <strong>the</strong>se data are not available.<br />
110<br />
FY 00 FY 01 FY 02 FY 03 FY 04 FY 05 FY 06 FY 07 FY 08 FY 09 FY 10<br />
129<br />
115<br />
126<br />
133<br />
112<br />
Admissions and Enrollment
Origin of Students and Graduates<br />
NTID students enrolled as of fall 2010 come from<br />
48 states. A total of 17 countries are represented<br />
among current international students.<br />
Home State<br />
or U.S. Territory<br />
Number<br />
in Student Body<br />
FY 2011<br />
Admissions and Enrollment -54-<br />
Since NTID began accepting students, we have<br />
had students from more than 50 countries and all<br />
50 states.<br />
Graduates to Date<br />
as of Fall 2010<br />
Cumulative<br />
Students to Date*<br />
Alabama 12 25 61<br />
Alaska 5 9 23<br />
Arizona 14 28 90<br />
Arkansas 4 28 66<br />
Bermuda 1 1 3<br />
Cali<strong>for</strong>nia 77 333 736<br />
Colorado 14 50 109<br />
Connecticut 37 179 361<br />
Delaware 15 25 70<br />
District of Columbia 3 14 36<br />
Florida 42 162 415<br />
Georgia 18 58 157<br />
Guam 0 0 2<br />
Hawaii 2 24 38<br />
Idaho 2 3 16<br />
Illinois 108 373 863<br />
Indiana 24 94 235<br />
Iowa 6 56 107<br />
Kansas 9 42 97<br />
Kentucky 8 41 119<br />
Louisiana 6 51 100<br />
Maine 10 45 108<br />
Maryland 50 150 384<br />
Massachusetts 62 <strong>31</strong>0 639<br />
Michigan 57 256 556<br />
Minnesota 12 95 181<br />
Mississippi 1 5 21<br />
Missouri 39 144 298<br />
Montana 0 7 16<br />
Nebraska 5 35 69<br />
Nevada 4 5 19<br />
New Hampshire 16 47 93<br />
New Jersey 84 330 652<br />
New Mexico 7 20 70<br />
New York 365 1,823 3,794<br />
North Carolina 14 58 134<br />
North Dakota 0 19 34<br />
* Includes current and withdrawn students and graduates.
Origin of Students and Graduates (continued)<br />
Home State<br />
or U.S. Territory<br />
Number<br />
in Student Body<br />
FY 2011<br />
* Includes current and withdrawn students and graduates.<br />
** U.S. citizens living in o<strong>the</strong>r countries.<br />
-55-<br />
Graduates to Date<br />
as of Fall 2010<br />
Cumulative<br />
Students to Date*<br />
Ohio 57 365 686<br />
Oklahoma 8 15 43<br />
Oregon 12 48 96<br />
Pennsylvania 77 527 1,066<br />
Puerto Rico 2 8 19<br />
Rhode Island 1 39 77<br />
South Carolina 7 21 48<br />
South Dakota 2 11 22<br />
Tennessee 9 43 94<br />
Texas 40 166 425<br />
Utah 1 11 24<br />
Vermont 9 37 81<br />
Virgin Islands 0 1 4<br />
Virginia 41 119 287<br />
Washington 30 59 158<br />
West Virginia 2 30 63<br />
Wisconsin 39 89 222<br />
Wyoming 1 3 6<br />
O<strong>the</strong>r** 10 10 130<br />
Subtotal 1,481<br />
6,547 14,323<br />
Admissions and Enrollment
Origin of Students and Graduates (continued)<br />
Country<br />
Number<br />
in Student Body<br />
FY 2011<br />
* Includes current and withdrawn students and graduates.<br />
Admissions and Enrollment -56-<br />
Graduates to Date<br />
as of Fall 2010<br />
Cumulative<br />
Students to Date*<br />
Australia 0 1 1<br />
Bahamas 0 1 1<br />
Bangladesh 0 0 2<br />
Belgium 0 1 1<br />
Bolivia 0 1 1<br />
Brazil 0 0 1<br />
Bulgaria 0 0 1<br />
Cameroon 0 0 2<br />
Canada 14 158 288<br />
Chad 0 0 1<br />
China 1 3 6<br />
Colombia 0 1 1<br />
Czech Republic 0 1 1<br />
Dominican Republic 0 0 1<br />
Ecuador 0 0 1<br />
Estonia 0 1 2<br />
Ghana 1 4 6<br />
Greece 0 1 2<br />
Honduras 1 0 1<br />
Hong Kong 0 0 1<br />
Hungary 1 0 1<br />
India 7 14 27<br />
Ireland 0 1 2<br />
Jamaica 2 0 5<br />
Japan 1 3 6<br />
Kenya 1 0 1<br />
Korea 1 0 1<br />
Lebanon 0 0 1<br />
Malaysia 2 1 3<br />
Mexico 0 1 3<br />
Nepal 0 1 2<br />
Nigeria 0 1 3<br />
Norway 1 0 2<br />
Pakistan 1 2 4<br />
Philippines 0 2 4<br />
Portugal 0 1 1<br />
Saudi Arabia 0 2 2<br />
Singapore 0 4 4<br />
Somalia 0 0 1<br />
South Africa 0 1 1<br />
Switzerland 0 1 1<br />
Taiwan 1 5 6
Origin of Students and Graduates (continued)<br />
Country<br />
Number<br />
in Student Body<br />
FY 2011<br />
As of fall 2010, in <strong>the</strong> entire student body, NTID has 41 international students enrolled based on<br />
visa status.<br />
-57-<br />
Number Percent<br />
U.S. Students 1,480 97.3%<br />
International Students 41 2.7%<br />
Total 1,521 100.0%<br />
* Includes current and withdrawn students and graduates.<br />
Graduates to Date<br />
as of Fall 2010<br />
Cumulative<br />
Students to Date*<br />
Tanzania 3 1 5<br />
Thailand 1 5 7<br />
Trinidad and Tobago 0 1 2<br />
Turkey 0 1 1<br />
Uganda 0 1 1<br />
United Kingdom 0 2 3<br />
Venezuela 0 1 1<br />
Zambia 0 0 1<br />
Zimbabwe 1 1 2<br />
O<strong>the</strong>r 0 3 4<br />
Subtotal 40 230 429<br />
Total 1,521<br />
6,777 14,752<br />
Admissions and Enrollment
Academic Programs<br />
Science, technology, engineering and ma<strong>the</strong>matics are areas of<br />
emphasis <strong>for</strong> RIT/NTID, including academic majors offered within<br />
NTID, majors in <strong>the</strong> o<strong>the</strong>r colleges of RIT supported by NTID, precollege<br />
outreach and research.<br />
-59-<br />
Academic Programs<br />
Academic<br />
Programs<br />
<strong>National</strong> <strong>Technical</strong> <strong>Institute</strong> <strong>for</strong> <strong>the</strong> <strong>Deaf</strong>
Academic Program Highlights<br />
Academic Affairs has been implementing Strategic Vision 2010 <strong>for</strong> <strong>the</strong> past five years by: 1) establishing<br />
key curriculum objectives <strong>for</strong> career-focused degrees and transfer associate degrees; 2) analyzing <strong>the</strong><br />
support needs <strong>for</strong> baccalaureate students; 3) developing a proposal <strong>for</strong> a community college referral<br />
program; and 4) reorganizing Academic Affairs, including development of a long-term staffing plan.<br />
Toward <strong>the</strong> end of <strong>the</strong> fiscal year, faculty attention turned also to <strong>the</strong> curriculum conversion required by<br />
<strong>the</strong> RIT-wide move from <strong>the</strong> quarter system to semesters by 2013 as well as to initial consideration of<br />
Strategic Decisions 2020.<br />
Career-Focused Associate Degrees<br />
Strategic Vision 2010 called <strong>for</strong> consolidating career-focused associate degree programs into five cluster<br />
areas with 35 percent of NTID students enrolled in <strong>the</strong>se programs. The five areas are Arts and Imaging<br />
Studies, Business, Computing, Engineering Technologies and Science. The career-focused degrees<br />
within <strong>the</strong>se clusters are designed to lead directly to employment in high-demand technical jobs.<br />
At <strong>the</strong> beginning of Academic Year (AY) 2010-2011, <strong>the</strong>re were 600 deaf and hard-of-hearing students<br />
enrolled in career-focused programs, including students enrolled in AOS and non-transfer AAS degree<br />
programs as well as students in Career Exploration Studies.<br />
In 2009-2010, program and curricular revisions were made as we continued to achieve Strategic<br />
Vision 2010 goals.<br />
The Arts & Imaging Studies Department completed a modification of <strong>the</strong> career-focused program<br />
curriculum. The number of concentrations was reduced from four to two: Graphic Design and Graphic<br />
Technology/Production, which are designed to better enable students and advisors to prepare <strong>for</strong> <strong>the</strong><br />
students’ appropriate career path. The Special Topics: Videography II course was offered again and<br />
continues to be developed. The <strong>for</strong>mer Art & Computer Design and Digital Imaging & Publishing<br />
Technology programs graduated <strong>the</strong> last remaining students and were discontinued. Program review and<br />
preparation <strong>for</strong> <strong>the</strong> RIT conversion to semesters began in <strong>the</strong> spring quarter.<br />
The Department of Engineering Studies (DES) enhanced <strong>the</strong> process <strong>for</strong> student program selection and<br />
expanded <strong>the</strong> scope of <strong>the</strong> employment market <strong>for</strong> Computer-Aided Drafting Technology graduates into<br />
construction-related fields. DES began a major curriculum conversion from a quarter to semester model<br />
and explored more than 40 skill sets <strong>for</strong> future potential program niches. During <strong>the</strong> 2009 Summer<br />
Vestibule Program, 10 students were interested in DES engineering-related studies, but were rejected <strong>for</strong><br />
<strong>the</strong> program because <strong>the</strong>y did not meet <strong>the</strong> entry requirements in Math and English. These students were<br />
accepted into <strong>the</strong> NETG – CORE as a pilot, thus allowing <strong>the</strong>m to do remedial work in Engineering<br />
Technology, Math and English. This project is considered a technical expansion program <strong>for</strong><br />
underprepared students with <strong>the</strong> idea of creating a learning community, or school-within-a-school<br />
environment. More than two-thirds of <strong>the</strong>se students eventually matriculated into Engineering Studies.<br />
The Department of In<strong>for</strong>mation and Computing Studies conducted a curriculum revision whereby its<br />
career-focused degree was modified from six to seven quarters. Two concentrations are now offered:<br />
Computer Tech Support, and Network and Cyber Security. The changes were submitted to <strong>the</strong> New York<br />
State Education Department <strong>for</strong> re-registration.<br />
The Department of Liberal Studies, which houses <strong>the</strong> developmental English program, introduced its<br />
three-course Career English sequence, designed <strong>for</strong> students preparing to complete an associate degree<br />
and go directly into <strong>the</strong> workplace. The sequence focuses on English literacy skills required in <strong>the</strong><br />
workplace, and two sections of <strong>the</strong> first course in <strong>the</strong> sequence were offered in spring quarter, after<br />
phasing out <strong>the</strong> prior curriculum during fall and winter quarters. For students who need additional<br />
preparation be<strong>for</strong>e undertaking Career English, a new English B course sequence was developed and<br />
approved <strong>for</strong> initial offering fall quarter 2010. This sequence integrates remedial reading and writing skill<br />
improvement with a focus in grammar and vocabulary development.<br />
Academic Programs -60-
Academic Program Highlights (continued)<br />
The department’s Intensive English Bridging<br />
course sequence (with one of its<br />
instructors, Leslie Bowers, seen here) has<br />
been approved and fully implemented and<br />
is now in its third year, after being piloted in<br />
2007. The sequence provides students with<br />
20 credits of intensive English language<br />
instruction, which is designed to develop<br />
<strong>the</strong> reading and writing skills necessary <strong>for</strong><br />
acceptance into a two-year transfer<br />
associate degree program. This past year<br />
saw <strong>the</strong> addition of a homework lab to<br />
provide supplemental support to this group<br />
of students in managing and completing <strong>the</strong><br />
heavy coursework. Results from <strong>the</strong> past<br />
three years of <strong>the</strong> program (2007-2010) are<br />
promising, with 62 percent of <strong>the</strong> students<br />
having completed <strong>the</strong> sequence with grades of C or better.<br />
The Department of Science and Ma<strong>the</strong>matics created a new course mask to allow students to take<br />
Intensive English and move from an AOS to an AAS degree. Piloting <strong>the</strong> revision is underway. In addition,<br />
a Special Topics course, Molecular Biology, was added to <strong>the</strong> curriculum to improve <strong>the</strong> biology strand.<br />
Based on feedback from <strong>the</strong> advisory board, new instrumentation was acquired, including a near-infrared<br />
spectrophotometer and a total organic carbon analyzer. The <strong>for</strong>mer will help with our students who go<br />
into industrial, final product and raw materials jobs. The latter will help with our environmental<br />
green-career focus.<br />
Transfer Associate Degrees<br />
One of <strong>the</strong> signature recommendations of Strategic Vision 2010 was its call <strong>for</strong> an array of transfer<br />
associate degrees that provide seamless transition to RIT baccalaureate programs, and that carry at least<br />
80 percent transferable credits. Moreover, Strategic Vision 2010 called <strong>for</strong> 20 percent of NTID-supported<br />
students to be enrolled in transfer associate degree programs by 2010. Because of some confusion with<br />
<strong>the</strong> concept of ―transfer‖ degree, <strong>the</strong> name of <strong>the</strong>se programs was changed at <strong>the</strong> end of <strong>the</strong> fiscal year to<br />
―associate+bachelor’s‖ degree programs.<br />
At <strong>the</strong> beginning of AY 2010-2011, a total of 168 students were enrolled in associate+bachelor’s degree<br />
(152) and pre-baccalaureate (16) programs. This number is expected to continue to increase as we<br />
expand <strong>the</strong> number of transfer associate degrees available and market <strong>the</strong>m as precursors to RIT<br />
baccalaureate programs.<br />
The newest associate+bachelor’s degree program is <strong>the</strong> AS in Applied Liberal Arts, offered by NTID’s<br />
Department of Liberal Studies (DLS). This program accepted its first students in fall 2009, with an initial<br />
enrollment of seven students. By <strong>the</strong> end of <strong>the</strong> year, 17 students had joined <strong>the</strong> program, and <strong>the</strong> 2010-<br />
2011 academic year will see <strong>the</strong> program’s first graduating class. The program prepares students <strong>for</strong><br />
entry into any of nine baccalaureate majors in RIT’s College of Liberal Arts (COLA). An articulation<br />
agreement between DLS and COLA ensures that 93 percent of <strong>the</strong> AS program, or 86 credits, will<br />
transfer directly into <strong>the</strong> baccalaureate program.<br />
In <strong>the</strong> Business Studies Department, <strong>the</strong> AS transfer degree program continues to successfully graduate<br />
students who are accepted into <strong>the</strong> Saunders College of Business, and <strong>the</strong> Administrative Support<br />
Technology program has had great success with students transferring to and graduating from <strong>the</strong><br />
Multidisciplinary Studies Human Resources concentration. Current department numbers show 50 percent<br />
of students in AS and BS degrees and 50 percent in AOS/AAS degrees.<br />
-61-<br />
Academic Programs
Academic Program Highlights (continued)<br />
The In<strong>for</strong>mation and Computing Studies Department signed three articulation agreements <strong>for</strong><br />
associate+bachelor’s degree programs with <strong>the</strong> Golisano College of Computing and In<strong>for</strong>mation<br />
Sciences. These agreements are in <strong>the</strong> areas of In<strong>for</strong>mation Technology, Applied Networking and System<br />
Administration, and In<strong>for</strong>mation Security and Forensics.<br />
The Science and Ma<strong>the</strong>matics Department worked with <strong>the</strong> College of Applied Science and Technology<br />
to adjust years three and four of its associate+bachelor’s degree program mask. Although <strong>the</strong> department<br />
does not have a <strong>for</strong>mal written agreement with <strong>the</strong> College of Science (COS), it now has a number of<br />
students transferring from <strong>the</strong> associate-level Laboratory Science Technology (LST) program to COS<br />
programs in Environmental Science, Chemistry and Biotechnology. There is as yet no agreement on <strong>the</strong><br />
transferability of 80 percent of LST credits, but <strong>the</strong> department is continuing to investigate <strong>the</strong> possibility<br />
of doing so. As part of that ef<strong>for</strong>t, this year <strong>the</strong> department continued to test a ―bridging‖ physics course,<br />
designed to prepare students who are expecting to take <strong>the</strong> COS College Physics sequence. The current<br />
expectation is to submit a curriculum proposal during AY 2010-2011.<br />
Support <strong>for</strong> Baccalaureate Students<br />
Strategic Vision 2010 called <strong>for</strong> an increase in <strong>the</strong> number of deaf and hard-of-hearing students<br />
successfully completing baccalaureate degrees in order to increase <strong>the</strong>ir ability to compete in <strong>the</strong><br />
technology job market where <strong>the</strong> baccalaureate degree often is <strong>the</strong> degree of choice by employers. One<br />
of <strong>the</strong> major goals of <strong>the</strong> reorganization of Academic Affairs was to increase <strong>the</strong> number of faculty<br />
available to support baccalaureate students.<br />
At <strong>the</strong> beginning of AY 2010-2011, 495 students (37 percent of <strong>the</strong> total deaf and hard-of-hearing student<br />
enrollment) were fully matriculated in baccalaureate programs in <strong>the</strong> o<strong>the</strong>r colleges of RIT. NTID faculty<br />
and staff provide tutoring, direct instruction, academic advising and counseling <strong>for</strong> <strong>the</strong>se students. In<br />
addition, interpreting, notetaking and C-Print ® services are offered through NTID’s Department of<br />
Access Services.<br />
Strategic Vision 2010 Enrollment Targets<br />
The enrollment targets set in Strategic Vision 2010 were: 35 percent career-focused programs,<br />
20 percent transfer associate degree programs and 45 percent baccalaureate programs. At <strong>the</strong> beginning<br />
of AY 2010-2011 our enrollment percentages <strong>for</strong> deaf and hard-of-hearing undergraduates were<br />
48 percent career-focused, 13 percent transfer associate degree and 39 percent baccalaureate<br />
programs. We increased enrollments in degree programs, however, <strong>the</strong> number of underprepared<br />
students who eventually enroll in career-focused programs increased at a higher rate. Strategic Decisions<br />
2020 has established <strong>the</strong> objective of developing a network of high schools and community colleges to<br />
create pathways to postsecondary education. The goal is to streng<strong>the</strong>n <strong>the</strong> preparation of deaf and hardof-hearing<br />
students <strong>for</strong> entering college and reduce <strong>the</strong> amount of developmental education that NTID<br />
must offer.<br />
Community College Referral Programs<br />
The institute’s Community College Transfer Partnership initiative was completed last year. The broad goal<br />
of <strong>the</strong> project was to develop contacts and streng<strong>the</strong>n ties between NTID and key community colleges<br />
that currently serve deaf and hard-of-hearing students. A specific goal was to explore <strong>the</strong> feasibility of<br />
establishing partnerships with key community colleges across <strong>the</strong> country to establish a pipeline <strong>for</strong><br />
associate degree graduates to transfer into RIT bachelor’s degree programs.<br />
Among its several findings, <strong>the</strong> project’s final report noted that more than half of <strong>the</strong> deaf and hard-ofhearing<br />
students in <strong>the</strong> 33 community college programs <strong>the</strong> project coordinator visited are in<br />
developmental courses and, as such, are not prepared academically to make <strong>the</strong> transfer to a four-year<br />
institution. The report also noted that, in many cases, program administrators and faculty requested<br />
NTID’s assistance to improve <strong>the</strong> delivery of developmental programs and to find <strong>the</strong> resources to put<br />
appropriate access services in place. In view of <strong>the</strong>se findings, <strong>the</strong> report recommended that NTID<br />
Academic Programs -62-
Academic Program Highlights (continued)<br />
develop an explicit program of reaching out to a targeted subset of community colleges and proposed that<br />
we consider following <strong>the</strong> growing practice of some of <strong>the</strong> more innovative community colleges, and<br />
devote institutional resources to working with feeder high schools to assist with student preparation <strong>for</strong><br />
associate degree programs that lead to jobs or continuation to four-year college programs. These findings<br />
have been picked up in Strategic Decisions 2020 where <strong>the</strong>y have taken shape in <strong>the</strong> new goal of<br />
establishing relationships with selected programs across <strong>the</strong> country to serve pre-college students, with<br />
<strong>the</strong> goal of improving <strong>the</strong>ir college readiness. NTID will apply <strong>for</strong> grant funding to provide assistance to a<br />
national network of high schools and community colleges to improve <strong>the</strong> preparation of deaf and hard-ofhearing<br />
students <strong>for</strong> careers in science, technology, engineering and math fields.<br />
Calendar Conversion from Semesters to Quarters<br />
RIT announced that it will move from <strong>the</strong> current quarter system to a semester-based academic calendar<br />
starting in <strong>the</strong> fall of AY 2013-2014. This decision necessitated that a number of initiatives be undertaken<br />
during AY 2009-2010. A primary principle in <strong>the</strong> transition will be to protect all students from any harm<br />
during <strong>the</strong> change from quarters to semesters. Specifically, RIT will ensure that no student suffers any<br />
loss of progress toward a degree during <strong>the</strong> transition; that no student's graduation will be delayed as a<br />
result of <strong>the</strong> change from quarters to semesters; and that no student will see any increase in tuition or<br />
fees related to <strong>the</strong> transition. To ensure that this principle is upheld, every student on campus will be<br />
personally advised as part of <strong>the</strong> transition process.<br />
During spring quarter of AY 2009-2010, all academic programs were screened to determine if <strong>the</strong>y should<br />
be converted to semesters or should be more carefully analyzed be<strong>for</strong>e making a decision about<br />
conversion. The screening <strong>for</strong> each NTID program included a review of five-year data on enrollment,<br />
transfers in and out of <strong>the</strong> program, graduation rates and totals, employment and continuing in-school<br />
rates and totals, as well as enrollment projections and capacity, designated laboratory space and<br />
instructional/support costs per graduate. In <strong>the</strong> end, <strong>the</strong> decision was made to discontinue <strong>the</strong> Applied<br />
Optical Technology and <strong>the</strong> Automation Technologies programs. All o<strong>the</strong>r programs began discussions<br />
about how to convert <strong>the</strong>ir programs/courses to a semester system.<br />
NTID faculty and administrators participated on university-wide committees to establish guidelines <strong>for</strong><br />
program conversion, processes <strong>for</strong> review of documents and <strong>for</strong>ms <strong>for</strong> program proposals and course<br />
outlines. A Semester Conversion website (http://www.rit.edu/conversion/) was established by RIT to<br />
house document templates and facilitate communication to students, faculty, staff and o<strong>the</strong>r audiences<br />
during <strong>the</strong> conversion process.<br />
RIT established an Academic Program Profile and expectations <strong>for</strong> Program-Level Outcomes<br />
Assessment Plans that all programs will need to adhere to under <strong>the</strong> semester system. NTID provided<br />
funds <strong>for</strong> summer contracts <strong>for</strong> faculty to revise program masks and begin work on proposal documents.<br />
Course outlines <strong>for</strong> new and converted semester courses will be written as part of <strong>the</strong> normal faculty<br />
workload during AY 2010-2011. The NTID Curriculum Committee (NCC) doubled in size, mirroring RIT’s<br />
Intercollegiate Curriculum Committee (ICC) action, to accommodate <strong>the</strong> increased volume of proposals.<br />
NCC established timelines and procedures to ensure that NTID program proposals and courses would be<br />
ready <strong>for</strong> ICC/Graduate Council review at prescribed times during AY 2010-2011, with <strong>the</strong> goal of<br />
submission to New York State Department of Education during summer 2011. Review of all proposals<br />
and course outlines will be managed electronically via specific locations within RIT’s course management<br />
system (myCourses).<br />
The RIT General Education Committee drafted a proposal <strong>for</strong> a general education framework and<br />
graduation requirements <strong>for</strong> undergraduate students at <strong>the</strong> baccalaureate, AS and AAS levels. NTID<br />
established a committee to draft <strong>the</strong> general education framework and graduation requirements <strong>for</strong><br />
students earning AOS degrees. Both committees will finalize <strong>the</strong>ir proposals during fall quarter of<br />
AY 2010-2011, and <strong>the</strong> appropriate governance bodies will review and approve <strong>the</strong> recommendations so<br />
that course development/revision can proceed.<br />
-63-<br />
Academic Programs
Academic Program Highlights (continued)<br />
Outcomes Assessment<br />
Student Learning Outcomes Assessment (OA) data was reported <strong>for</strong> all NTID academic programs as well<br />
as general education and academic support areas <strong>for</strong> AY 2009-2010. NTID OA plans identify critical<br />
outcomes, per<strong>for</strong>mance benchmarks, assessment instruments and timelines. All NTID plans have been<br />
implemented, including those <strong>for</strong> new and recently modified programs, and data has been used to in<strong>for</strong>m<br />
decisions about courses and/or assessment procedures. Changes to programs or courses based on AY<br />
2008-2009 data yielded positive results in assessments administered this year by three programs. Five<br />
programs plan to make curricular changes <strong>for</strong> next year based on data collected in this assessment cycle.<br />
Four programs implemented modified assessment procedures this year and two o<strong>the</strong>rs plan to utilize<br />
different measures next year to more accurately assess student competence in meeting expected skill<br />
levels. Two recently added programs have administered some measures, but need additional<br />
assessments be<strong>for</strong>e determining implications, and one program suspended most of its data collection due<br />
to changes in leadership. Five programs reported that criteria were met on all assessed outcomes and<br />
will continue to monitor results while taking no action at this time. Specific data and use of results are<br />
posted annually online in each program’s Outcomes Assessment Plan/Report at<br />
http://www.ntid.rit.edu/president/soa/pages/plan.html.<br />
Several examples of changes to procedures, programs and/or assessment instruments are illustrative of<br />
how outcomes assessment is a meaningful activity at NTID. Arts and Imaging Studies modified <strong>the</strong>ir<br />
program from three concentrations to two, Graphic Design and Graphic Production, and incorporated<br />
print publishing courses in both. They also provided in-service professional development and faculty<br />
mentoring to enhance delivery of <strong>the</strong> Web design course sequence and prepare more students to take<br />
<strong>the</strong> advanced courses and demonstrate competence in assessments conducted in <strong>the</strong>m.<br />
The Accounting Technology program developed and administered a new instrument, <strong>the</strong> Student<br />
Learning Assessment Test, but will revise it again <strong>for</strong> AY 2010-2011. Their goal is to more accurately<br />
measure <strong>the</strong> intended per<strong>for</strong>mance criteria related to a student’s ability to per<strong>for</strong>m <strong>the</strong> functions of <strong>the</strong><br />
accounting cycle <strong>for</strong> service, merchandising and manufacturing businesses.<br />
The Administrative Support Technology program implemented changes, such as requiring self-analysis<br />
worksheets on employment skills, to enhance students’ work habits, attitudes and time management<br />
abilities. This year, <strong>for</strong> <strong>the</strong> first time, 100 percent of <strong>the</strong> students met <strong>the</strong> benchmark <strong>for</strong> demonstrating<br />
appropriate interpersonal/human relations skills. They also have more students demonstrating technical<br />
skills through completing <strong>the</strong> Microsoft Office Specialist 2007 certification exams.<br />
The AS in Applied Computer Technology program initiated data collection and exceeded criteria <strong>for</strong><br />
acceptance of students in a baccalaureate program in <strong>the</strong> Golisano College of Computing and<br />
In<strong>for</strong>mation Sciences at RIT. Additionally, <strong>the</strong> retention and graduation rates <strong>for</strong> <strong>the</strong>se students is higher<br />
than <strong>for</strong> students who are directly admitted to <strong>the</strong> BS programs.<br />
The AAS/AOS program in Applied Computer Technology determined that students were per<strong>for</strong>ming<br />
better than expected on <strong>the</strong> general technical outcomes, but below expectations on a hands-on exam<br />
used to assess skills in <strong>the</strong> technical concentrations. Fur<strong>the</strong>r analysis revealed that students have a<br />
general weakness in applying Unix commands and relating <strong>the</strong>m to <strong>the</strong>ir work in Networking. As a result,<br />
Unix will be taught in a more applied way this year.<br />
Criteria were met <strong>for</strong> all technical skills outcomes in <strong>the</strong> Computer Integrated Machining Technology<br />
program except <strong>for</strong> producing a machined part within tolerance. Faculty are reviewing skill sets to<br />
determine needed curricular modifications that will be implemented in AY 2010-2011.<br />
The Laboratory Science Technology program has worked <strong>for</strong> several years to streng<strong>the</strong>n student<br />
outcomes in <strong>the</strong> area of microbiology. The group of students assessed this year is <strong>the</strong> first to complete a<br />
new course (Molecular Biology), and positive results are already seen. For <strong>the</strong> second straight year,<br />
students per<strong>for</strong>med very well in skills related to Volumetric/Instrumental Analysis, which <strong>the</strong> program’s<br />
advisory board highlighted as a top priority.<br />
Academic Programs -64-
Academic Program Highlights (continued)<br />
The Applied Liberal Arts AS program was offered <strong>for</strong> <strong>the</strong> first time during AY 2009-2010, but already<br />
reported data on student progress through <strong>the</strong> curriculum. As a result, <strong>the</strong>y have clarified admissions<br />
policies <strong>for</strong> internal and external transfers into <strong>the</strong> program, which should positively impact suspension<br />
risks in <strong>the</strong> future.<br />
Data from co-op supervisor online evaluations regarding overall student job per<strong>for</strong>mance was updated <strong>for</strong><br />
each academic program in 2009-2010 (N=82). These results, with program ratings pooled by department,<br />
indicated a high level of employer satisfaction, with means ranging from 4.17 to 4.47 on a five-point<br />
(5=high) scale.<br />
A study was conducted that validated use of co-op supervisor evaluations to assess face-to-face<br />
communication of NTID students. Mean ratings, grouped by department, ranged from 4.13 to 4.77,<br />
indicating a high level of communication effectiveness in face-to-face situations <strong>for</strong> co-op students<br />
(N=82). Competency in e-mail communication was assessed <strong>for</strong> <strong>the</strong> first time this year through<br />
procedures implemented in Employment Seminar. Criteria were exceeded and data collection<br />
will continue.<br />
The Department of Counseling and Academic Advising revised procedures this year to assess students<br />
closer to <strong>the</strong> time of graduation ra<strong>the</strong>r than in <strong>the</strong>ir first year. They conducted a focus group that in<strong>for</strong>med<br />
<strong>the</strong> design of a survey used to assess students’ understanding of <strong>the</strong> various roles and responsibilities of<br />
<strong>the</strong> counselor/advisor, <strong>the</strong> academic chairperson and <strong>the</strong> students <strong>the</strong>mselves. Results were positive and<br />
point toward focusing on incoming students in order to have a positive impact on <strong>the</strong>ir understanding of<br />
roles and responsibilities by <strong>the</strong> time of graduation.<br />
Outcomes assessment meetings are held regularly at NTID <strong>for</strong> <strong>the</strong> purposes of in<strong>for</strong>mation dissemination<br />
and discussion. At <strong>the</strong> January 2010 meeting, <strong>the</strong> NTID Curriculum Resource Associate and RIT Director<br />
of Student Learning Outcomes Assessment updated <strong>the</strong> Academic Affairs Chairs Cabinet (AACC)<br />
members on NTID activities as well as initiatives driven by RIT. The university reviewed and selected an<br />
Assessment Management System, established a General Education Committee to guide curriculum and<br />
assessment activities, and created a Student Learning Outcomes Assessment Office website at<br />
http://www.rit.edu/academicaffairs/outcomes/. Initiatives proposed by RIT’s Student Learning Outcomes<br />
Assessment Committee also were shared, including <strong>the</strong> need <strong>for</strong> each college to establish a three-year<br />
action plan. Ultimately, <strong>the</strong> AACC agreed to five action items grouped under three goals: to communicate<br />
and work with faculty/staff to create an assessment culture; to streng<strong>the</strong>n links between program<br />
outcomes and course level outcomes; and to streng<strong>the</strong>n links between program proposals and program<br />
outcomes. Progress on <strong>the</strong>se action items is underway and was enhanced by <strong>the</strong> strong attendance of<br />
NTID faculty and chairs at a June workshop conducted by <strong>the</strong> Office of Student Learning Outcomes<br />
Assessment. Additionally, <strong>the</strong> decision of <strong>the</strong> university to change from quarters to semesters has<br />
necessitated a review/revision of all program goals and assessment plans as well as <strong>the</strong> goals and<br />
student learning outcomes addressed and assessed within each course to be offered under <strong>the</strong> semester<br />
system. This will facilitate completion of <strong>the</strong> established action items.<br />
American Sign Language and Interpreting Education (ASLIE)<br />
ASLIE enrolled 147* students in <strong>the</strong> BS program in ASL-English Interpretation as of fall 2010. Due to <strong>the</strong><br />
continuing effectiveness of <strong>the</strong> strategic marketing and recruitment plan employed <strong>for</strong> <strong>the</strong> past three years<br />
at NTID, this number has grown since last year and has once again set a record <strong>for</strong> being <strong>the</strong> highest<br />
number of interpreting students in <strong>the</strong> BS program in NTID’s history. Interpreting faculty have<br />
re-conceptualized and redesigned <strong>the</strong> interpreting curriculum in response to changing requirements in<br />
<strong>the</strong> interpreting field and increased requests <strong>for</strong> transfer from two-year programs.<br />
* There is one additional student who is a double-major, with <strong>the</strong> primary program in a different college of RIT and <strong>the</strong> secondary<br />
major in <strong>the</strong> NTID interpreting program. Also, <strong>the</strong>re are four students whose primary major is interpreting, and <strong>the</strong>y have a<br />
secondary major in ano<strong>the</strong>r college of RIT, e.g. Psychology.<br />
-65-<br />
Academic Programs
Academic Program Highlights (continued)<br />
In AY 2009-2010, <strong>the</strong> ASL-English Interpretation program graduated 33 students, 16 of whom responded<br />
to a Senior Satisfaction Survey. When asked about overall satisfaction with <strong>the</strong> program, 11 students<br />
(69%) indicated agreement; 11 students (69%) indicated <strong>the</strong>y would recommend <strong>the</strong> program.<br />
Four months after graduation, <strong>the</strong> 33 students were sent an employment survey. Of <strong>the</strong> 13 students who<br />
responded, 11 (85%) reported being employed in <strong>the</strong> field of interpreting, one (7.6%) is pursuing a<br />
graduate degree and one (7.6%) is looking <strong>for</strong> employment.<br />
RIT’s College of Liberal Arts (COLA) offers ASL courses, coordinated and taught through NTID’s ASLIE<br />
Department. Last year <strong>the</strong> department renamed <strong>the</strong> three courses in <strong>the</strong> basic ASL sequence to bring <strong>the</strong><br />
nomenclature into alignment with o<strong>the</strong>r <strong>for</strong>eign language sequences in <strong>the</strong> college. Thus, ASL I, II and III<br />
are now known as Beginning ASL I, II and III. The courses may be taken by RIT students as electives or<br />
to fulfill <strong>the</strong>ir liberal arts concentration. The requirement <strong>for</strong> <strong>the</strong> ASL concentration is to take two language<br />
courses, Beginning ASL II and III, and one culture course. This year, <strong>the</strong> COLA program had an<br />
expanding enrollment of 197 in fall quarter, 229 in winter quarter, 259 in spring quarter, and due to high<br />
demand and increased popularity, COLA ASL courses offered <strong>for</strong> <strong>the</strong> first time during this summer<br />
quarter, had a nearly 100 percent enrollment of 35 students, <strong>for</strong> a grand total of 720 students <strong>for</strong> <strong>the</strong> year.<br />
The program continues to enjoy exponential enrollment growth, evidenced not only by actual<br />
registrations, but also by a continuing influx of requests <strong>for</strong> more course sections and a more robust and<br />
diverse offering of courses.<br />
Last year, <strong>the</strong> department discontinued its community program leading to a <strong>Deaf</strong> Studies Certificate. The<br />
three initial courses in <strong>the</strong> program, ASL I, II and III, were retained as stand-alone courses and renamed<br />
Introduction to ASL and <strong>Deaf</strong> Culture I, II and III. The courses are designed <strong>for</strong> RIT students, faculty and<br />
staff, and community members at large interested in a basic introduction to ASL and <strong>Deaf</strong> culture. In AY<br />
2009-2010, <strong>the</strong> Introduction to ASL and <strong>Deaf</strong> Culture program had an enrollment of 48 students. The<br />
Faculty Staff Sign Language Education Program (FSSLEP), a program housed in ASLIE, had an<br />
enrollment of 527 faculty and staff from NTID and o<strong>the</strong>r departments across RIT. ASLIE faculty provided<br />
instruction in ASL courses as part of <strong>the</strong> ASL/<strong>Deaf</strong> Studies (Department of Cultural and Creative Studies)<br />
requirement <strong>for</strong> 80 students, <strong>the</strong> Master of Science program in Secondary Education of Students who are<br />
<strong>Deaf</strong> or Hard-of-Hearing <strong>for</strong> 60 students, and <strong>the</strong> Provost’s Program <strong>for</strong> 15 RIT faculty and staff. ASLIE<br />
faculty continued to provide sign communication assessment and feedback services <strong>for</strong> RIT/NTID faculty<br />
and staff and MSSE students through <strong>the</strong> Office of Communication Assessment Services (OCAS).<br />
Faculty conducted 27 Sign Language Proficiency Interviews (SLPI), 69 SLPI Ratings, 12 SLPI follow-up<br />
sessions, six Classroom Sign Language Assessment (CSLA) activities, and one faculty member attended<br />
<strong>the</strong> new team member training session in June 2010.<br />
The Office of <strong>the</strong> RIT Provost sponsors an annual Provost Summer Intensive American Sign Language<br />
and <strong>Deaf</strong> Culture Experience <strong>for</strong> selected RIT faculty/staff. The aim of <strong>the</strong> program is to enhance<br />
interactions among deaf and hearing members of <strong>the</strong> RIT community. Up to 15 RIT faculty/staff, who are<br />
not employed within NTID and who represent <strong>the</strong> various academic and non-academic areas of RIT, are<br />
selected each year to participate in this intensive three-week program during <strong>the</strong> month of June. The<br />
focus of <strong>the</strong> program is to develop basic American Sign Language skills, an introduction to <strong>Deaf</strong> culture<br />
and an introduction to <strong>the</strong> dynamics of deaf and hearing interactions. The program has enjoyed<br />
continuing success and growth in registration since its inception, and is a valued and coveted offering<br />
among RIT and NTID faculty and staff.<br />
Communication Studies and Services (CSS)<br />
The Communication Studies and Services Department (CSS) is comprised of faculty and staff with<br />
expertise and training in <strong>the</strong> areas of communication, speech-language and audiology. Faculty in <strong>the</strong><br />
department provide credit-bearing instruction to students in areas related to communication in<br />
organizational structures, effective teams, interpersonal situations and o<strong>the</strong>r community settings. O<strong>the</strong>r<br />
areas where direct instruction is provided are Freshman Seminar; ASLIE, where a Cued Speech<br />
Academic Programs -66-
Academic Program Highlights (continued)<br />
Compliment course is provided to those enrolled in <strong>the</strong> interpreting education program; and <strong>the</strong> MSSE<br />
program. In <strong>the</strong>se areas, faculty provided 85 credit hours of instruction <strong>for</strong> 303 students in 2009-2010,<br />
with an additional 380 contact hours of communication support to <strong>the</strong> Job Search Process Course <strong>for</strong><br />
129 students.<br />
Audiological and speech-language clinical services were provided to members of <strong>the</strong> RIT community<br />
throughout <strong>the</strong> 2009-2010 academic year. Faculty and staff provided 3,765 hours of individual speechlanguage<br />
instruction, serving 205 students, and provided 2,665 hours of audiology services to 903<br />
students and o<strong>the</strong>rs at RIT.<br />
Instruction in NTID’s Spoken Language Learning and Practice Lab (SLLPL) includes <strong>the</strong> use of recent<br />
technologies designed to enhance students’ spoken communication skills. During <strong>the</strong> 2009-2010<br />
academic year, <strong>the</strong> lab served an additional 279 students on a walk-in basis, while <strong>the</strong> Hearing Aid Shop<br />
served 856 members of <strong>the</strong> RIT community.<br />
CSS also supports students with advisors to <strong>the</strong> Spoken Communication Club, Ushers Support Group<br />
and <strong>the</strong> Cochlear Implant Club. CSS is also a co-sponsor of a grant from <strong>the</strong> Department of Education to<br />
train master’s degree students in Speech-Language Pathology from Nazareth College of Rochester to<br />
work with deaf and hard-of-hearing students.<br />
Master of Science in Secondary Education of Students who are <strong>Deaf</strong> or Hard-of-Hearing (MSSE)<br />
The Master of Science program in Secondary Education of Students who are <strong>Deaf</strong> or Hard-of-Hearing<br />
(MSSE), now in its 16 th year, graduated 18 students during <strong>the</strong> 2009-2010 academic year. Six of <strong>the</strong>se<br />
MSSE graduates received initial certification from New York State in an academic content area (grades<br />
7-12) and/or in education of students who are deaf or hard-of-hearing (grades K-12). Those who do not<br />
have certification ei<strong>the</strong>r need to take additional NYS teacher certification exams or have chosen to pursue<br />
certification from <strong>the</strong> states where <strong>the</strong>y currently are teaching. Of <strong>the</strong> 18 graduates, 18 are now teaching<br />
in residential schools <strong>for</strong> <strong>the</strong> deaf, mainstream programs or teaching American Sign Language in public<br />
school programs. Three graduates are employed by NTID; two as instructors and one in <strong>the</strong> outreach<br />
program. One graduate is employed as an ASL instructor at ano<strong>the</strong>r college. One graduate currently<br />
is unemployed, but is actively seeking a teaching position. All graduates received provisional<br />
certification from <strong>the</strong> Council on Education of <strong>the</strong> <strong>Deaf</strong>. To date, a total of 223 students have graduated<br />
from <strong>the</strong> program.<br />
For <strong>the</strong> 2010-2011 academic year, <strong>the</strong> MSSE program has an enrollment of 71 students, of whom 41<br />
percent are deaf or hard-of-hearing and 10 percent are minority. It is anticipated that up to 23 students<br />
will graduate from <strong>the</strong> program during <strong>the</strong> 2010-2011 academic year. There are an additional four<br />
students who have completed <strong>the</strong>ir coursework and hope to finish <strong>the</strong>ir capstone projects during this<br />
academic year.<br />
The MSSE program has continued to actively recruit students with strong content area backgrounds,<br />
especially in science and math through <strong>the</strong> 4+2 program with RIT’s Colleges of Science, Engineering and<br />
Liberal Arts as well as RIT’s Multidisciplinary Studies program. The specifics related to this program can<br />
be found at http://www.ntid.rit.edu/msse/4plus2.php.<br />
MSSE is accredited by <strong>the</strong> Teacher Education Accreditation Council (TEAC), 2007-2012, and has<br />
continued to maintain partnership with <strong>the</strong> State University of New York at Cobleskill to recruit potential<br />
students with strong backgrounds in English and social studies.<br />
-67-<br />
Academic Programs
Academic Program Highlights (continued)<br />
Self-Instruction Lab<br />
The Self-Instruction Lab (SIL), shown here, offers<br />
a variety of equipment and resources to support<br />
students’, faculty, and staff members’ signed and<br />
spoken language skill development. It serves as an<br />
environment <strong>for</strong> both expressive and receptive<br />
practice, offering flexible scheduling to meet<br />
learner needs as well as supporting individual<br />
learning styles. During AY 2009-2010, students,<br />
faculty and staff spent 3,082 hours during 3,307<br />
visits to <strong>the</strong> SIL. Of <strong>the</strong> total hours, 1,365 hours<br />
were spent using <strong>the</strong> SIL video production rooms.<br />
First Year Experiences/Career Exploration Studies and Summer Vestibule Program<br />
First Year Experiences (FYE) programming is designed to maximize first-year student success and<br />
persistence. Beginning with NTID’s Summer Vestibule Program (SVP), FYE provides an array of courses<br />
and co-curricular programs as well as personal/academic counseling designed to help students<br />
successfully complete <strong>the</strong>ir first year of college. This past summer, 269 students attended SVP and<br />
participated in a variety of activities, including career exploration, adjusting to college life programs and<br />
course placement assessments. Also housed within FYE, <strong>the</strong> Career Exploration Studies program (CES)<br />
allows students <strong>the</strong> opportunity to explore technical programs while satisfying necessary core and/or<br />
prerequisite coursework. During AY 2009-2010, CES served 124 students, and 80 percent of <strong>the</strong>m were<br />
accepted into a major within three quarters.<br />
NTID Learning Center<br />
The NTID Learning Center (NLC), open seven days a week <strong>for</strong> a total of 88 hours per week from<br />
September through June, provides a variety of resources such as tutoring, computer use, video<br />
production, and individual/group study space to support student success. The NLC offers individual and<br />
small-group tutoring and studying in Ma<strong>the</strong>matics, English, in<strong>for</strong>mation and computing studies,<br />
Accounting, Interpreting and Spanish. This year, individual students signed up to use <strong>the</strong> NLC computers<br />
58,977 times <strong>for</strong> a total of 137,515 hours. This is a 9 percent increase over AY 2008-2009. Since AY<br />
2006-2007, <strong>the</strong> NLC has loaned laptops to students during <strong>the</strong> day and overnight. This year, laptops were<br />
borrowed 1,906 times, which is a 23 percent increase over AY 2008-2009. The Sprint Relay Experimental<br />
Distance Learning/Access Demonstration Lab, also housed within <strong>the</strong> NLC, hosted 186 class sessions<br />
and 69 workshop sessions <strong>for</strong> a total of 449 hours. The lab supported a variety of activities, including<br />
sponsoring <strong>the</strong> MATHCOUNTS® outreach program, conducting experimental videoconferencing projects,<br />
video-capturing classes <strong>for</strong> archiving and subsequent anytime/anywhere access by students, and<br />
supporting research comparing speech-to-text systems. In addition, Classroom #1 and <strong>the</strong> General Area<br />
supported 394 class sessions and 244 workshop/tutoring sessions, totaling 982 hours of use. Lastly, <strong>the</strong><br />
NLC continued to support <strong>the</strong> administration of SVP writing tests, <strong>the</strong> quarterly administration of <strong>the</strong> LAPT<br />
tests and provided a number of tours <strong>for</strong> incoming freshmen and visitors.<br />
Academic Programs -68-
Enrollment by Degree Programs<br />
In fall 2010, 65 percent of NTID’s 1,521 students<br />
were enrolled in a broad array of programs within<br />
NTID. Thirty-five percent were enrolled in <strong>the</strong> o<strong>the</strong>r<br />
seven colleges of RIT, including 40 students in<br />
graduate programs. Of <strong>the</strong> 1,521 students,<br />
1,303 are deaf and hard-of-hearing students in<br />
traditional undergraduate and graduate programs<br />
(excluding MSSE and interpreting). Forty-one<br />
percent of our deaf and hard-of-hearing students<br />
(535) enrolled in traditional undergraduate and<br />
graduate programs are partially or fully enrolled in<br />
<strong>the</strong> o<strong>the</strong>r colleges of RIT.<br />
Student Enrollment<br />
FY 2011<br />
Number of Percentage<br />
Students of Total<br />
NTID<br />
Career Exploration Studies<br />
(NCXP) Career Preparation/Foundation 84<br />
(NCXU) Career Exploration Undecided 28<br />
Subtotal 112 7.4%<br />
Career-Focused and Transfer Associate Degrees<br />
(NACA) Applied Computer Technology (AAS) 23<br />
(NACO) Applied Computer Technology (AOS) 72<br />
(NACT) Applied Computer Technology 26<br />
(NAIA) Arts and Imaging Studies 26<br />
(NAIO) Arts and Imaging Studies 117<br />
(NALA) Applied Liberal Arts (AS) 38<br />
(NAMA) Applied Mechanical Technology (AAS) 12<br />
(NAUA) Automation Technologies (AAS) 4<br />
(NAUO) Automation Technologies (AOS) 11<br />
(NBBO) Business Technology (AOS) 71<br />
(NBNA) Accounting Technology (AAS) 23<br />
(NBSA) Business (AS) 35<br />
(NCDA) Computer Aided Drafting Technology (AAS) 8<br />
(NCDO) Computer Aided Drafting Technology (AOS) 22<br />
(NETG) NTID Engineering Technologies 39<br />
(NHMA) Hospitality and Service Management (AS) 5<br />
(NLSA) Laboratory Science Technology (AAS) 19<br />
(NLSO) Laboratory Science Technology (AOS) 30<br />
(NMTO) Computer Integrated Machining Technology (AOS) 28<br />
(NOTA) Administrative Support Technology (AAS) 17<br />
(NTDZ) NTID General (non-degree, non-matriculated) 14<br />
Subtotal 640 42.1%<br />
-69-<br />
Academic Programs
Enrollment by Degree Programs (continued)<br />
Student Enrollment<br />
FY 2011<br />
Number of Percentage<br />
Students of Total<br />
ASL-English Interpretation<br />
(NITA) ASL-English Interpretation (AAS) 1<br />
(NITF) ASL-English Interpretation (BS) 146*<br />
Subtotal 147 9.7%<br />
Master of Science in Secondary Education (MSSE)<br />
(NMSE) Secondary Education of Students <strong>Deaf</strong>/HH (MS) 66<br />
(NORG) Graduate Teacher (Non-Degree) 5<br />
Subtotal 71 4.7%<br />
Pre-baccalaureate – Students in NTID<br />
(NAPE) Pre-College Engineering Legal Tech 5<br />
(NAPF) Pre-College Visual Communication 7<br />
(NAPL) Pre-College Liberal Arts 1<br />
(NAPS) Pre-College Science 3<br />
Subtotal 16 1.0%<br />
NTID Subtotal 986 64.9%<br />
Baccalaureate Students in O<strong>the</strong>r RIT Colleges<br />
College of Applied Science and Technology<br />
(ICTL) International Logistics and Transportation (CT) 1<br />
(IEME) Environmental Management and Technology<br />
Environmental Technology and Environmental Health &<br />
2<br />
(IEMT) Safety (EHS) Management 1<br />
(IMDB) Applied Arts and Sciences 2<br />
(IMDF) Applied Arts and Sciences (Day) 44<br />
(IPKT) Packaging Science 8<br />
(ISMK) Hospitality and Service Management 17<br />
(ITFC) Civil Engineering Technology 11<br />
(ITFE) Electrical Engineering Technology 2<br />
(ITFF) Manufacturing Engineering Technology 2<br />
(ITFL) Electrical/Mechanical Engineering Technology 1<br />
(ITFM) Mechanical Engineering Technology 8<br />
(ITFP) Computer Engineering Technology 3<br />
(ITFZ) Undeclared Engineering Technology 1<br />
(ITPD) Mechanical Technology 1<br />
(ITPE) Electrical Engineering Technology 1<br />
Subtotal 105 6.9%<br />
* There is an additional student who is a double-major, with one major in NTID and ano<strong>the</strong>r in a different college of RIT.<br />
Academic Programs -70-
Enrollment by Degree Programs (continued)<br />
Student Enrollment<br />
FY 2011<br />
Number of Percentage<br />
Students of Total<br />
College of Business<br />
(BBUA) Business Administration-Accounting 18<br />
(BBUF) Business Administration-Finance 8<br />
(BBUG) Business Administration-Management 9<br />
(BBUI) Management In<strong>for</strong>mation Systems 5<br />
(BBUM) Business Administration-Marketing 3<br />
(BBUT) Business Administration-International Business 3<br />
(BBUU) Business Administration-Undeclared 3<br />
(BBUZ) Business Administration-General 1<br />
(BREP) Graphic Media Marketing 5<br />
Subtotal 55 3.6%<br />
College of Science<br />
(SBIB) Biology 16<br />
(SBIT) Biotechnology 7<br />
(SBIV) Environmental Science 6<br />
(SCHB) Biochemistry 4<br />
(SCHC) Chemistry 1<br />
(SIMG) Imaging Science 1<br />
(SMAM) Applied Ma<strong>the</strong>matics 8<br />
(SSBS) Biomedical Sciences (BS) 17<br />
(SSEG) General Science Exploration (ND) 6<br />
Subtotal 66 4.3%<br />
College of Imaging Arts and Sciences<br />
(JADA) Art and Design 3<br />
(JADC) Graphic Design 22<br />
(JADF) Fine Arts-Studio 6<br />
(JADI) Interior Design 7<br />
(JADL) Illustration 4<br />
(JADM) Medical Illustration 3<br />
(JADU) Industrial Design 10<br />
(JADW) New Media Design and Imaging 5<br />
(JPHA) Professional Photographic Illustration 2<br />
(JPHB) Biomedical Photographic Communication 3<br />
(JPHD) Professional Photo Illustration-Advertising BFA 7<br />
(JPHF) Film and Video 1<br />
(JPHQ) Film and Video 6<br />
(JPHR) Professional Photo Illustration-Journal 1<br />
(JPHT) Imaging and Photographic Technology 1<br />
(JPHU) Visual Media 9<br />
(JPRV) Graphic Media 1<br />
(JPRW) New Media-Publishing 6<br />
Subtotal 97 6.4%<br />
-71-<br />
Academic Programs
Enrollment by Degree Programs (continued)<br />
Student Enrollment<br />
FY 2011<br />
Number of Percentage<br />
Students of Total<br />
College of Liberal Arts<br />
(GCJC) Criminal Justice 19<br />
(GCRS) Cultural Resource Studies 1<br />
(GLAU) Liberal Arts Exploration 4<br />
(GPPD) Public Policy 1<br />
(GPSY) Psychology 49<br />
(GPTA) Advertising and Public Relations 6<br />
(GPTC) Professional and <strong>Technical</strong> Communication 11<br />
(GPTJ) Journalism 2<br />
(GSSI) International Studies 5<br />
(GUCS) Urban and Community Studies 3<br />
Subtotal 101 6.6%<br />
(TCRP) College Restoration Program 1 0.1%<br />
College of Engineering<br />
(ECME) Chemical Engineering 1<br />
(EECC) Computer Engineering 1<br />
(EEEE) Electrical Engineering 2<br />
(EENG) Engineering-Undeclared 3<br />
(EIEI) Industrial Engineering 1<br />
(EMEA) Mechanical Engineering-Aerospace Option 3<br />
(EMED) Mechanical Engineering-Bioengineering Options 1<br />
(EMEE) Mechanical Engineering 1<br />
(EMEM) Mechanical Engineering 4<br />
(EMEN) Mechanical Engineering Dual Degree 1<br />
(EMEV) Mechanical Engineering-Automotive Option 1<br />
Subtotal 19 1.2%<br />
College of Computing and In<strong>for</strong>mation Sciences<br />
(VCSG) Computer Science 8<br />
(VIGD) Game Design and Development 2<br />
(VIGN) New Media Interactive Development 2<br />
(VKSF) In<strong>for</strong>mation Technology 16<br />
(VKSM) Medical In<strong>for</strong>matics 3<br />
(VKSZ) In<strong>for</strong>mation Tech (Even Option) 1<br />
(VNSA) Applied Networking and System AD 5<br />
(VNSF) In<strong>for</strong>mation Security and Forensics 8<br />
Subtotal 45 3.0%<br />
(WUSP) University Studies 6 0.4%<br />
Subtotal Baccalaureate Students in O<strong>the</strong>r Colleges 495 32.5%<br />
Academic Programs -72-
Enrollment by Degree Programs (continued)<br />
Graduate Students in O<strong>the</strong>r RIT Colleges<br />
-73-<br />
Student Enrollment<br />
FY 2011<br />
Number of Percentage<br />
Students of Total<br />
College of Applied Science and Technology<br />
(IEMH) Environmental Health and Safety Management 1<br />
(IMDM) Cross-Disciplinary Professional Studies 13<br />
(ISMC) Human Resources Development 1<br />
(ISMM) Hospitality-Tourism Management 1<br />
(ITFO) Telecommunications Engineering Technology (MS) 3<br />
Subtotal 19 1.2%<br />
College of Business<br />
(BBUY) Business Administration (EMBA) Online 1<br />
Subtotal 1 0.1%<br />
College of Engineering<br />
(EIEM) Engineering Management 1<br />
(EMEN) Mechanical Engineering-Dual Degree 1<br />
Subtotal 2 0.1%<br />
College of Imaging Arts and Sciences<br />
(JADG) Computer Graphics Design 3<br />
(JADM) Medical Illustration 1<br />
Subtotal 4 0.3%<br />
College of Liberal Arts<br />
(GBSP) School Psychology 1<br />
Subtotal 1 0.1%<br />
College of Science<br />
(SBIW) Environmental Science BS/MS 1<br />
(SMAG) Industrial and Applied Ma<strong>the</strong>matics 1<br />
Subtotal 2 0.1%<br />
Academic Programs
Enrollment by Degree Programs (continued)<br />
Student Enrollment<br />
FY 2011<br />
Number of Percentage<br />
Students of Total<br />
College of Computing and In<strong>for</strong>mation Sciences<br />
(VCSG) Computer Science 3<br />
(VKSD) Software Development and Management 1<br />
(VKSF) In<strong>for</strong>mation Technology 3<br />
(VKSI) Human-Computer Interaction 1<br />
(VNSM) Networking and System Administration 3<br />
Subtotal 11 0.7%<br />
Subtotal Graduate Students in O<strong>the</strong>r Colleges 40 2.6%<br />
Total 1,521 100%<br />
Remy, of Reno, Nev., and Ebony, of St. Louis, Mo., both pursuing BFAs<br />
in Graphic Design, collaborate in one of NTID’s design labs.<br />
Academic Programs -74-
Average Class Size by Discipline<br />
The variability in average class size is influenced<br />
by <strong>the</strong> nature of instruction. For example, many<br />
programs are laboratory-oriented and use<br />
specialized equipment, which limits <strong>the</strong> number of<br />
students who can reasonably be accommodated in<br />
a class.<br />
-75-<br />
AY 2009-2010<br />
Fall Winter Spring<br />
Accounting Technology 9.1 10.0 7.7<br />
American Sign Language 10.7 8.0 7.0<br />
Applied Computer Technology 7.3 6.6 7.9<br />
Arts & Imaging Studies 9.2 7.8 8.4<br />
ASL-English Interpretation 9.2 8.5 8.2<br />
Automation Technologies 5.3 5.0 6.0<br />
Business Technology 7.7 8.3 7.1<br />
Communication Studies and Humanities 10.4 11.9 12.5<br />
Computer-Aided Drafting Technology 8.0 7.0 7.6<br />
Computer Integrated Machining Technology 6.8 4.7 5.4<br />
<strong>Deaf</strong> Studies 9.0 15.0 11.5<br />
English 10.5 9.8 9.2<br />
Freshman Seminar / Career Exploration 9.5 9.7 9.0<br />
Interdisciplinary Studies 12.3 11.9 11.0<br />
Laboratory Science Technology 10.8 7.9 6.5<br />
Master of Science in Secondary Education 14.2 11.2 21.7<br />
Ma<strong>the</strong>matics 10.3 9.3 8.6<br />
Per<strong>for</strong>ming Arts 7.5 8.6 9.0<br />
Science 10.8 10.0 10.6<br />
Social Sciences 13.9 12.2 12.6<br />
Overall Average 9.63 9.17 9.38<br />
Academic Programs
Educational Support: Teaching<br />
In addition to providing academic advisement,<br />
tutoring, and notetaking services <strong>for</strong> deaf and hardof-hearing<br />
students enrolled in <strong>the</strong> o<strong>the</strong>r colleges of<br />
RIT, NTID faculty also teach some RIT courses<br />
with deaf students enrolled. By providing direct<br />
Academic Programs -76-<br />
instruction in <strong>the</strong>se courses as well as advisement<br />
and tutoring, faculty members help maximize <strong>the</strong><br />
benefit students receive to ensure <strong>the</strong>ir success in<br />
RIT’s highly competitive academic environment.<br />
Below are <strong>the</strong> statistics <strong>for</strong> FY 2010.<br />
Number of<br />
Sections<br />
Number of Students<br />
<strong>Deaf</strong> and<br />
Hard-of-<br />
Hearing<br />
Hearing<br />
College of Applied Science and Technology<br />
Management Process 1 1 27<br />
Management Process II 1 2 21<br />
Management Process III 1 1 24<br />
Subtotal 3 4 72<br />
E. Philip Saunders College of Business<br />
Business Software Applications 1 22 0<br />
Subtotal 1 22 0<br />
B. Thomas Golisano College of Computing and<br />
In<strong>for</strong>mation Sciences<br />
Programming <strong>for</strong> In<strong>for</strong>mation Technology II 2 37 27<br />
Subtotal 2 37 27<br />
College of Imaging Arts and Sciences<br />
Architectural Drawing 1 1 17<br />
Building Codes and Regulations 1 2 19<br />
CADD Applications 1 1 16<br />
Interior Design Business Practice 1 2 18<br />
Interior Design Elective 1 2 21<br />
Senior Project 3 9 0<br />
Survey of Western Art & Architecture 3 39 0<br />
Working Drawings 2 1 19<br />
Subtotal 13 57 110<br />
College of Liberal Arts<br />
American Sign Language I 20 15 379<br />
American Sign Language II 15 13 155<br />
American Sign Language III 8 7 116<br />
American Sign Language Literature 1 10 4<br />
Arts of Expression: Writing <strong>the</strong> Discipline 3 37 0<br />
Beginning Spanish I 2 43 0<br />
Beginning Spanish II 2 29 0
Educational Support: Teaching (continued)<br />
College of Liberal Arts (continued)<br />
-77-<br />
Number of<br />
Sections<br />
Number of Students<br />
<strong>Deaf</strong> and<br />
Hard-of-<br />
Hearing<br />
Hearing<br />
Beginning Spanish III 1 14 0<br />
Computer Crime 4 15 140<br />
Concepts in Criminal Law 2 11 54<br />
Criminology 1 16 27<br />
<strong>Deaf</strong> Culture in America 2 32 33<br />
<strong>Deaf</strong> Literature 1 13 19<br />
Fine Arts: Theatre Arts 2 3 58<br />
Fine Arts: Visual Arts 3 58 0<br />
Foundations of Sociology 5 90 0<br />
History of <strong>Deaf</strong> Educational Thought 2 40 2<br />
History: Modern America 2 41 0<br />
Introduction to Psychology 7 108 136<br />
Literary and Cultural Studies 3 40 0<br />
Major Issues in Cyber Law 1 3 24<br />
Professional Communication <strong>for</strong> Business 1 15 0<br />
Scientific Writing 2 28 0<br />
Seminar in Criminal Justice 1 5 19<br />
Senior Project Psychology II 1 1 0<br />
Special Topics: <strong>Deaf</strong> Art and Cinema 2 35 21<br />
Special Topics: Diversity in <strong>Deaf</strong> Communication 1 20 11<br />
Special Topics: Linguistics of ASL 1 8 8<br />
Special Topics: Theatre Design 1 3 8<br />
Theatre Production Seminar/Workshop 1 1 21<br />
Written Communication I 12 154 0<br />
Written Communication II 14 177 0<br />
Writing Seminar 14 200 0<br />
Subtotal 138 1,285 1,235<br />
College of Science<br />
Data Analysis I 2 2 68<br />
Stellar Astronomy Lab 3 3 45<br />
Subtotal 5 5 113<br />
Center <strong>for</strong> Intercollegiate Athletics and Recreation<br />
Coaching/Officiating Basketball 1 8 1<br />
Country Line Dancing 1 4 7<br />
Dance/Ballet 2 5 14<br />
Dance/Jazz 1 2 0<br />
Dodgeball 2 14 21<br />
Eating, Body Image and Food 2 4 19<br />
Introduction to Weight Training 1 2 5<br />
Academic Programs
Educational Support: Teaching (continued)<br />
Academic Programs -78-<br />
Number of<br />
Sections<br />
Number of Students<br />
<strong>Deaf</strong> and<br />
Hard-of-<br />
Hearing<br />
Hearing<br />
Kundalini Yoga 3 2 69<br />
Soccer 1 1 9<br />
Spinning 6 20 18<br />
Spirituality and Health 3 12 29<br />
Ultimate Frisbee 2 1 47<br />
Volleyball 1 2 18<br />
Walking <strong>for</strong> Fitness 2 4 10<br />
Subtotal 28 81 267<br />
Total 190 1,491 1,824
American Sign Language-English Interpretation Program<br />
The degree programs in ASL-English Interpretation<br />
graduated 33 students in 2009-2010, <strong>31</strong> with BS<br />
degrees and two with AAS degrees. Fifty-seven<br />
new students matriculated into <strong>the</strong> program in<br />
September 2010. Currently, 14 percent of total<br />
enrollment are students from ethnic minority<br />
backgrounds. Since its inception, <strong>the</strong> Department<br />
of ASL and Interpreting Education has graduated<br />
618 students. Of that number, 507 have graduated<br />
with an AAS degree, 105 with a BS degree, and six<br />
with a certificate.<br />
FY 2007 FY 2008 FY 2009 FY 2010 FY 2011<br />
Applicants 182 170 198 214 206*<br />
Accepted 55 48 52 70 69**<br />
Registrations 41 34 36 52 57***<br />
Enrollment<br />
AAS 98 5 1 0 0<br />
BS 29 121 134 138 147***<br />
Non-Matriculated 2 2 0 0 0<br />
Total 129 128 135 138 147***<br />
Graduates 36 28 34 33 ****<br />
Employment Rate***** 96% 100% 96% 96% 100%<br />
In addition to <strong>the</strong> interpreting program, ASL and Interpreting Education faculty also<br />
provide <strong>the</strong> following programs.<br />
-79-<br />
FY 2010<br />
Enrollment<br />
ASL courses in RIT’s College of Liberal Arts (COLA) 720<br />
Faculty/Staff Sign Language Program, open to all RIT and NTID employees 527<br />
ASL courses <strong>for</strong> deaf students, NTID 80<br />
Master of Science in Secondary Education Program, NTID 60<br />
Intro to ASL and <strong>Deaf</strong> Culture****** 48<br />
Provost Summer Intensive ASL Experience Program, RIT’s Office of <strong>the</strong> Provost 15<br />
* There were an additional 10 internal transfer RIT applicants.<br />
** Includes eight Change of Program accepts (internal RIT transfers) and two double major accepts.<br />
*** Does not include one double-major, with one major in NTID and ano<strong>the</strong>r in a different college of RIT.<br />
**** FY 2011 graduates will be reported next year.<br />
***** Employment rate reflects employment of previous year’s graduates.<br />
****** The Intro to ASL and <strong>Deaf</strong> Culture Program consists of three ASL courses offered in <strong>the</strong> evenings as an orientation to<br />
deafness <strong>for</strong> <strong>the</strong> Rochester community and interested RIT students. The tuition charged is at <strong>the</strong> RIT catalog rate.<br />
Academic Programs
Master of Science in Secondary Education of Students Who Are <strong>Deaf</strong> or<br />
Hard-Of-Hearing (MSSE)<br />
The MSSE program is now in its 16 th year. To date,<br />
223 students have graduated from <strong>the</strong> program.<br />
One hundred percent of <strong>the</strong> FY 2010 graduates<br />
have accepted teaching jobs throughout <strong>the</strong> state<br />
of New York and in New Mexico, South Carolina,<br />
Cali<strong>for</strong>nia, Arizona, and Minnesota.<br />
To complete <strong>the</strong> program, each student must<br />
successfully complete 94 credit hours, including<br />
two student-teaching assignments and a<br />
master’s project.<br />
In addition to <strong>the</strong> coursework and o<strong>the</strong>r<br />
expectations, all full-time students serve as<br />
graduate assistants during <strong>the</strong> quarters <strong>the</strong>y are<br />
not student teaching. They work as teaching<br />
assistants, program assistants, research assistants<br />
or tutors, primarily at NTID.<br />
Academic Programs -80-<br />
To recruit students with strong content area<br />
backgrounds, especially in science and math, <strong>the</strong><br />
program has implemented a 4+2 program with <strong>the</strong><br />
College of Science, <strong>the</strong> College of Engineering and<br />
<strong>the</strong> College of Liberal Arts as well as <strong>the</strong><br />
multidisciplinary studies program at RIT. The<br />
specifics related to this program can be found at<br />
http://www.ntid.rit.edu/msse/4plus2.php.<br />
Sixty-one applications <strong>for</strong> admission <strong>for</strong> fall 2010<br />
were received. Forty-four were offered admission.<br />
Of those, 27 matriculated into <strong>the</strong> program. For <strong>the</strong><br />
2010-2011 academic year <strong>the</strong> MSSE program has<br />
a total enrollment of 71 students; 44 second-year or<br />
returning students, and 27 first-year students. Of<br />
<strong>the</strong> 71 matriculated students, 41 percent are deaf<br />
or hard-of-hearing, and 10 percent are minority.<br />
MSSE Student Data<br />
FY 2007 FY 2008 FY 2009 FY 2010 FY 2011<br />
Applications 44 46 49 62 61<br />
Acceptances 38 33 37 48 44<br />
New Registrations 28 27 24 30 27<br />
<strong>Deaf</strong> and Hard-of-Hearing<br />
Enrollment<br />
<strong>31</strong><br />
<strong>31</strong><br />
24<br />
32 29<br />
Total Enrollment* 56 59 55 61 71<br />
Graduates 23 33 23 18 **<br />
Employment Rate*** 96% 83%**** 93% 91% 100%<br />
* Included from FY 2007 to date, are non-matriculated students (between four and 15, per year) taking courses offered by <strong>the</strong><br />
Master of Science program in Secondary Education, but who are part of a grant-supported joint program between NTID and<br />
Nazareth College of Rochester to train speech pathologists to work with deaf and hard-of-hearing persons.<br />
** FY 2011 graduates will be reported next year.<br />
*** Employment rate reflects employment of previous year’s graduates.<br />
**** One additional graduate is a full-time student pursuing a graduate degree.
Cooperative Work Experiences<br />
Cooperative work experience is an integral part of<br />
academic programming at NTID. Employment<br />
specialists assist students in securing 10-week<br />
work experiences that augment <strong>the</strong>ir studies.<br />
Employment specialists or faculty members visit<br />
many students and <strong>the</strong>ir supervisors at <strong>the</strong>ir<br />
workplaces to assess progress and resolve any<br />
workplace issues. Most academic programs require<br />
from one to three cooperative assignments, which<br />
generally add ano<strong>the</strong>r year to <strong>the</strong> program length<br />
Sub-Baccalaureate<br />
(totaling three years <strong>for</strong> associate degree programs<br />
and five years <strong>for</strong> BS degree programs).<br />
-81-<br />
During FY 2010:<br />
281 students were enrolled in cooperative work<br />
experiences;<br />
54 academic programs had students<br />
on cooperative work experiences; and<br />
23 faculty and staff visited 63 students at <strong>the</strong>ir<br />
job sites during <strong>the</strong> summer.<br />
Number of Students Involved in<br />
Cooperative Work Experiences*<br />
FY 2006 FY 2007 FY 2008 FY 2009 FY 2010<br />
NTID Career-Focused and Transfer<br />
Associate Degrees 86 92 109 132 123<br />
Percent of Total Co-op Enrollment 37% 34% 43% 50% 44%<br />
Baccalaureate/Master’s<br />
College of Applied Science and Technology 39 46 48 41 46<br />
College of Business 19 30 25 23 33<br />
College of Computing and In<strong>for</strong>mation<br />
Sciences 27 27 26 35 21<br />
College of Engineering 14 15 15 11 10<br />
College of Imaging Arts and Sciences 10 17 10 5 7<br />
College of Liberal Arts 35 40 16 11 28<br />
College of Science 3 5 6 4 13<br />
Subtotal 147 180 146 130 158<br />
Percent of Total Co-op Enrollment 63% 66% 57% 50% 56%<br />
Total Co-op Enrollment 233 272 255 262 281<br />
* Totals reported include deaf and hard-of-hearing international students, but do not include students in <strong>the</strong> ASL-English<br />
Interpretation program or <strong>the</strong> Master of Science program in Secondary Education. Specific data on <strong>the</strong>se students is reported<br />
elsewhere in this section.<br />
Academic Programs
Science, Technology, Engineering and Ma<strong>the</strong>matics (STEM) Activities<br />
The <strong>National</strong> <strong>Technical</strong> <strong>Institute</strong> <strong>for</strong> <strong>the</strong> <strong>Deaf</strong><br />
conducts a wide variety of science, technology,<br />
engineering and ma<strong>the</strong>matics (STEM) activities,<br />
including academic majors offered within NTID<br />
STEM Majors Offered at NTID<br />
Academic Programs -82-<br />
and those supported by NTID in <strong>the</strong> o<strong>the</strong>r colleges<br />
of RIT as well as pre-college outreach activities and<br />
research activities.<br />
All programs within <strong>the</strong> Engineering Studies Department<br />
All programs within <strong>the</strong> In<strong>for</strong>mation and Computing Studies Department<br />
All programs within <strong>the</strong> Science and Ma<strong>the</strong>matics Department<br />
Master of Science program in Secondary Education of Students who are <strong>Deaf</strong> or Hard-of-Hearing<br />
(MSSE) offers special scholarships <strong>for</strong> students interested in math/science disciplines<br />
O<strong>the</strong>r RIT Colleges Offering STEM Majors<br />
College of Applied Science and Technology<br />
B. Thomas Golisano College of Computing and In<strong>for</strong>mation Sciences<br />
Kate Gleason College of Engineering<br />
College of Science<br />
College of Imaging Arts and Sciences<br />
STEM-Related Pre-College Outreach Activities Offered by NTID<br />
Explore Your Future – Six-day career awareness program <strong>for</strong> high school sophomores and<br />
juniors, offering exposure to careers in computing, engineering, science and o<strong>the</strong>r areas<br />
Math Competition – Event <strong>for</strong> middle school students<br />
<strong>National</strong> Science Fair – For 6 th to 12 th grade students interested in science<br />
Steps to Success – Weekend camp at which 7 th to 9 th grade African-American, Latino-American<br />
and Native-American (AALANA) students explore career options<br />
TechGirlz – Week-long camp <strong>for</strong> 7 th to 9 th grade girls interested in careers in science, technology,<br />
engineering and math<br />
Project Fast Forward – Supported by <strong>the</strong> <strong>National</strong> Science Foundation (NSF), provides a pathway<br />
<strong>for</strong> deaf and hard-of-hearing students to transition from high school to college by offering<br />
computer-related courses that provide both high school and college credit<br />
Post-College STEM Outreach Activity Offered by NTID<br />
<strong>Deaf</strong> Initiative in Technology (DiiT) – Series of workshops providing computer and o<strong>the</strong>r training<br />
to deaf and hard-of-hearing adults. Roughly 675 deaf and hard-of-hearing professionals have<br />
attended 90 DiiT workshops over <strong>the</strong> past 10 years.<br />
A Sampling of Research Support <strong>for</strong> NTID STEM Activities<br />
Enrichment: Testing <strong>the</strong> Concept of a Virtual Alliance <strong>for</strong> <strong>Deaf</strong> and Hard-of-Hearing STEM<br />
Students at <strong>the</strong> Postsecondary Level. Supported by <strong>the</strong> <strong>National</strong> Science Foundation.<br />
DHH Cyber-Community - Supporting <strong>Deaf</strong> and Hard-of-Hearing Students in STEM<br />
Fields. Supported by <strong>the</strong> <strong>National</strong> Science Foundation, as a sub-award from <strong>the</strong> University<br />
of Washington.<br />
Science of Learning Center on Visual Language and Visual Learning. Supported by <strong>the</strong> <strong>National</strong><br />
Science Foundation, as a sub-award from Gallaudet University.<br />
Reorganization of Visual Functions after Early <strong>Deaf</strong>ness. Supported by <strong>the</strong> <strong>National</strong> <strong>Institute</strong>s of<br />
Health, as a sub-award from <strong>the</strong> University of Rochester.<br />
Cognitive and Metacognitive Foundations of STEM Learning by <strong>Deaf</strong> Students. Supported by <strong>the</strong><br />
<strong>National</strong> Science Foundation.
STEM Activities (continued)<br />
Psychological Foundations of Ma<strong>the</strong>matics Per<strong>for</strong>mance by <strong>Deaf</strong> and Hearing Students.<br />
Supported by <strong>the</strong> <strong>National</strong> <strong>Institute</strong>s of Health.<br />
Survive and Thrive in College. Supported by <strong>the</strong> NYS Education Department.<br />
Supporting Women and Underrepresented <strong>Deaf</strong> Students in Laboratory Science Technology.<br />
Supported by <strong>the</strong> NYS Education Department.<br />
Analyzing <strong>the</strong> Use of C-Print Mobile Technology in STEM Laboratory Settings Across Multiple<br />
Postsecondary Sites. Supported by <strong>the</strong> <strong>National</strong> Science Foundation.<br />
Improving Access to STEM Education <strong>for</strong> <strong>Deaf</strong> and Hard-of-Hearing Students. Supported by <strong>the</strong><br />
<strong>National</strong> Science Foundation.<br />
A Preliminary Investigation of Cisco Technologies and Access Solutions <strong>for</strong> <strong>Deaf</strong> and Hardof‐Hearing<br />
Individuals One-Year Investigation. Funded by Cisco.<br />
A Sampling of STEM-Related Events and Presentations<br />
Center <strong>for</strong> Education Research Partnerships<br />
What Works in <strong>the</strong> Classroom? Invited presentation to Skaladen Kompensentensenter and<br />
Norwegian Ministry of Education, October 2009.<br />
What Language in <strong>the</strong> Classroom? Invited presentation at <strong>the</strong> <strong>Institute</strong> <strong>for</strong> <strong>Deaf</strong> Youth – INJS<br />
<strong>for</strong> educators of <strong>the</strong> deaf and o<strong>the</strong>r professionals from throughout <strong>the</strong> Paris, France, region,<br />
October 2009.<br />
Educating <strong>Deaf</strong> Children: What We Know and What We Want to Believe. Jones Memorial<br />
Lecture, University of Alberta and University of Calgary, October 2009.<br />
<strong>Deaf</strong> Children Are Not Hearing Children Who Can't Hear. Keynote presentation, Educating <strong>the</strong><br />
<strong>Deaf</strong> Brain conference, Hasselt, Belgium, November 2009.<br />
What We Know and What We Don't Know about Children with Cochlear Implants. Keynote<br />
presentation, Educating <strong>the</strong> <strong>Deaf</strong> Brain conference, Hasselt, Belgium, November 2009.<br />
<strong>Deaf</strong> Children and Literacy: Is Literacy Really <strong>the</strong> Issue? Moeller Kompetensasenter,<br />
Trondheim, Norway.<br />
Educating <strong>Deaf</strong> Children: From Research to Practice and Back Again - Keynote Address to Asian<br />
Conference on Linguistics and <strong>Deaf</strong> Education, Hong Kong, January 2010.<br />
Language, Learning, and <strong>Deaf</strong> Children: What We Know and What We Don’t Know - Keynote<br />
address to <strong>the</strong> Future of <strong>Deaf</strong> Education in Ireland conference, February 2010<br />
Numerical Approximation and Math Achievement in <strong>Deaf</strong> Children, ICED2010, Vancouver.<br />
Building Better Classroom Comprehension among <strong>Deaf</strong> Students, ICED2010, Vancouver.<br />
Center <strong>for</strong> Access Technology<br />
Testing <strong>the</strong> Concept of a Virtual Alliance <strong>for</strong> <strong>Deaf</strong> and Hard of Hearing STEM Students at <strong>the</strong><br />
Postsecondary Level - Poster at <strong>National</strong> Science Foundation Joint Annual Meeting (JAM),<br />
Washington, D.C., June 2010.<br />
Planning a Virtual Alliance <strong>for</strong> <strong>Deaf</strong> and Hard-of-Hearing STEM Students at <strong>the</strong> Postsecondary<br />
Level - Presentation at Technology and <strong>Deaf</strong> Education: Exploring Instructional and Access<br />
Technologies, June 2010.<br />
A Sampling of STEM-Related Research Publications<br />
Center <strong>for</strong> Education Research Partnerships<br />
Enhancing deaf students’ learning from sign language and text: Metacognition, modality, and <strong>the</strong><br />
effectiveness of content scaffolding. Journal of <strong>Deaf</strong> Studies and <strong>Deaf</strong> Education (in press).<br />
Approaches to teaching in mainstream and separate postsecondary classrooms. American<br />
Annals of <strong>the</strong> <strong>Deaf</strong> (in press).<br />
-83-<br />
Academic Programs
STEM Activities (continued)<br />
<strong>Deaf</strong> and hard-of-hearing students’ experiences in mainstream and separate postsecondary<br />
education. Journal of <strong>Deaf</strong> Studies and <strong>Deaf</strong> Education, 15, 358-382 (2010).<br />
Language and learning in mainstream classrooms. In J. Mole (Ed.), International Perspectives on<br />
Educational Interpreting, pp. 45-54 (2009). Brassington, UK: Direct Learned Services Ltd.<br />
Are deaf students’ reading challenges really about reading? American Annals of <strong>the</strong> <strong>Deaf</strong>, 154,<br />
357-370 (2009).<br />
Center <strong>for</strong> Access Technology<br />
<strong>Deaf</strong> and hard-of-hearing students in transition: Demographics with an emphasis on STEM<br />
education (2010).<br />
Testing <strong>the</strong> concept of a virtual alliance <strong>for</strong> postsecondary level STEM students who are deaf and<br />
hard-of-hearing: Summary of PEPNet focus groups (October 2009).<br />
Testing <strong>the</strong> concept of a virtual alliance <strong>for</strong> postsecondary level STEM students who are deaf and<br />
hard-of-hearing: Thematic Notes from <strong>the</strong> PEPNet Focus Groups (October 2009).<br />
Academic Programs -84-
Student Support Services<br />
Applefest, sponsored by <strong>the</strong> Student Life Team, is an annual<br />
celebration of New York’s fall apple harvest as well as an<br />
introduction to NTID’s diverse student clubs and organizations.<br />
-85-<br />
Student Support Services<br />
Student Support<br />
Services<br />
<strong>National</strong> <strong>Technical</strong> <strong>Institute</strong> <strong>for</strong> <strong>the</strong> <strong>Deaf</strong>
Student Support Services Highlights<br />
NTID provides a variety of services to support <strong>the</strong> college success of deaf and hard-of-hearing students.<br />
• Audiological services include hearing evaluations, hearing aid trials, fittings, cochlear implant<br />
mapping and individual listening <strong>the</strong>rapy that focus on <strong>the</strong> development of receptive<br />
communication skills.<br />
• Speech and language services are offered to students who want to enhance <strong>the</strong>ir use of spoken<br />
English and <strong>the</strong>ir general communication competence. Individual and group experiences provide<br />
opportunities to improve communication in conversations, group discussions and <strong>for</strong>mal<br />
presentations. The Spoken Language Learning and Practice Lab enables students to use computer<br />
technology <strong>for</strong> speech and language analysis and visual feedback.<br />
• Mental health counseling and psycho<strong>the</strong>rapy is provided to deaf, hard-of-hearing and hearing<br />
students on campus at <strong>the</strong> RIT Counseling Center. Mental health counselors fluent in American Sign<br />
Language provide services <strong>for</strong> deaf and hard-of-hearing students. A staff psychiatrist at <strong>the</strong> Student<br />
Health Center is available <strong>for</strong> consultation or referral as needed. Mental health crisis intervention is<br />
available 24 hours a day. In addition to individual counseling and psycho<strong>the</strong>rapy, students can<br />
participate in support groups and skill-building groups with counseling center staff throughout <strong>the</strong><br />
year. In AY 2009-2010, 197 deaf and hard-of-hearing students were seen <strong>for</strong> <strong>the</strong>se services.<br />
• Personal and career counseling, and academic advising are provided to NTID students. Upon entry,<br />
every NTID-supported student has access to a professional counselor who plays an important role in<br />
helping students maximize <strong>the</strong>ir educational opportunities. Last year, <strong>the</strong> NTID Counseling Services<br />
department provided more than 11,500 hours of career and personal counseling as well as academic<br />
advising <strong>for</strong> students, in addition to teaching 28 sections of courses related to various aspects of<br />
college success. This department manages a full-service Career Resource and Testing Center, which<br />
provides a number of career assessment tools and resources, including an interactive, computerbased<br />
career in<strong>for</strong>mation system that helps students assess <strong>the</strong>ir interests, learning styles and<br />
values, and explore a wide range of educational and career options. Counselors also work in<br />
collaboration with o<strong>the</strong>r service providers on campus to assess student learning competencies and<br />
develop educational interventions where appropriate.<br />
• Student Life Team (SLT) continued its tradition in FY 2010 of both challenging and educating our<br />
students, providing resources and support <strong>for</strong> students’ successful transitions throughout college and<br />
after graduation. SLT’s collaborations with NTID’s Counseling Services Department, NTID Center on<br />
Employment, NTID Student and Academic Services, NTID Academic Affairs and several offices<br />
across RIT’s Division of Student Affairs ensured that students were provided diverse opportunities to<br />
optimize <strong>the</strong>ir collegiate experiences. SLT’s co-curricular and late night educational programming,<br />
afternoon in<strong>for</strong>mational workshops, social and cultural programs and club/organization advising are<br />
avenues of outreaching and networking with students.<br />
• Center <strong>for</strong> Intercollegiate Athletics and Recreation (CIAR) – NTID Support provided services that<br />
maximized access and success of deaf and hard-of-hearing students engaged in wellness courses,<br />
intercollegiate athletics, <strong>the</strong> Certificate of Excellence Program, intramural and recreation programs.<br />
Collaboration and referrals were made with various offices within NTID and RIT to ensure individual<br />
students’ needs and requests were met. Consultation, mentoring and educational programs were<br />
offered to deaf and hard-of-hearing intercollegiate athletes, coaches and teams. Collaboration with<br />
<strong>the</strong> NTID Admissions Office resulted in potential deaf and hard-of-hearing student athletes having <strong>the</strong><br />
opportunity to meet with an NTID support person and intercollegiate coaches. In AY 2009-2010, NTID<br />
had 15 student athletes competing in basketball, lacrosse, soccer, cross country, track and wrestling.<br />
• Financial aid <strong>for</strong> domestic students was provided in AY 2009-2010 to a total of 989 NTID students in<br />
<strong>the</strong> <strong>for</strong>m of Vocational Rehabilitation, grants-in-aid, federal and state grants, scholarships and federal<br />
loans through RIT’s Financial Aid Office. This is up from a total of 882 students receiving awards last<br />
year. Of this total, 386 received NTID merit scholarships, 49 received RIT merit scholarships,<br />
Student Support Services -86-
Student Support Services Highlights (continued)<br />
429 received NTID endowed scholarships and 135 students received scholarships from external<br />
Funding sources. In addition, <strong>the</strong> NTID Financial Services Office provided privately funded short-term<br />
loans to students who encountered emergency situations.<br />
• Summer Vestibule Program (SVP) is a 10-day orientation program <strong>for</strong> entering NTID students<br />
designed to transition <strong>the</strong>m to college life. In 2010, 269 students went through <strong>the</strong> orientation<br />
program. Assessment tests are given to fur<strong>the</strong>r evaluate a student’s academic placement <strong>for</strong><br />
English/Math classes. Students who are fur<strong>the</strong>r evaluating <strong>the</strong>ir major are given a variety of career<br />
sampling choices. This is an opportunity <strong>for</strong> students to see if <strong>the</strong>ir major is what <strong>the</strong>y expected. If not,<br />
<strong>the</strong>y have <strong>the</strong> chance to enroll in a different major/program. There also is ample opportunity <strong>for</strong> peer<br />
interaction and fun. SVP is always a memorable experience as <strong>the</strong> students bond and make friends<br />
as <strong>the</strong>y begin <strong>the</strong>ir collegiate career.<br />
• First Year Experience incorporates a ―Freshman Seminar‖ required <strong>for</strong> incoming first-year students<br />
and designed to fur<strong>the</strong>r assist <strong>the</strong>m in <strong>the</strong>ir transition to RIT/NTID. Twenty-four sections were offered<br />
with an average class size of eight. A variety of topics are covered, such as navigating <strong>the</strong> campus,<br />
library resources, Student In<strong>for</strong>mation System, conflict resolution, time management,<br />
clubs/organizations, study skills, stress management, goal setting, healthy relationships and more.<br />
This also is ano<strong>the</strong>r opportunity <strong>for</strong> students to connect with <strong>the</strong>ir instructor if <strong>the</strong>y have<br />
personal/academic struggles and <strong>the</strong> instructor can act as a resource.<br />
• Career Exploration Studies (CES) is a program that allows career-undecided students <strong>the</strong> opportunity<br />
to explore technical programs while satisfying necessary core and/or prerequisite coursework. During<br />
AY 2009-2010, CES served 124 students. Eighty percent of CES students were accepted into a<br />
major within three quarters. There were 112 students enrolled in this program in fall 2010.<br />
• Substance and Alcohol Intervention Services <strong>for</strong> <strong>the</strong> <strong>Deaf</strong> (SAISD) provides culturally sensitive,<br />
linguistically accessible in<strong>for</strong>mation on alcohol, tobacco and o<strong>the</strong>r drugs, prevention, intervention and<br />
case management services to <strong>the</strong> deaf and hard-of-hearing community at RIT and throughout<br />
Rochester and <strong>the</strong> Monroe County area. SAISD also advocates <strong>for</strong> and promotes development of a<br />
full range of accessible treatment programs <strong>for</strong> alcohol and o<strong>the</strong>r drugs <strong>for</strong> deaf and hard-of-hearing<br />
consumers through <strong>the</strong> provision of cross-disability short-term technical assistance, consultation and<br />
training <strong>for</strong> professionals. For services from October 2009 to September 2010, SAISD screened<br />
101 students, provided ongoing counseling to 61 students and made 1,324 student contacts in our<br />
prevention presentations. Wherever possible, SAISD promotes its successful model to o<strong>the</strong>r<br />
communities across <strong>the</strong> state.<br />
The NTID Learning Center (NLC), open seven days a week <strong>for</strong> a total of 88 hours per week from<br />
September through June, provides a variety of resources such as tutoring, computer use, video<br />
production and individual/group study space to support student success. The NLC offers individual<br />
and small-group tutoring and studying in Ma<strong>the</strong>matics, English, in<strong>for</strong>mation and computing studies,<br />
accounting, interpreting and Spanish. This year, individual students signed up to use <strong>the</strong> NLC<br />
computers 58,977 times <strong>for</strong> a total of 137,515 hours. This is a 9 percent increase over AY 2008-2009.<br />
Since AY 2006-2007, <strong>the</strong> NLC has loaned laptops to students during <strong>the</strong> day and overnight. This<br />
year, laptops were borrowed 1,906 times, which is a 23 percent increase over AY 2008-2009. The<br />
Sprint Relay Experimental Distance Learning/Access Demonstration Lab, also housed within <strong>the</strong><br />
NLC, hosted 186 class sessions and 69 workshop sessions <strong>for</strong> a total of 449 hours. The Sprint Relay<br />
Lab supported a variety of activities, including sponsoring <strong>the</strong> MATHCOUNTS ® outreach program,<br />
conducting experimental videoconferencing projects, video-capturing classes <strong>for</strong> archiving and<br />
subsequent ―anytime/anywhere‖ access by students, and supporting research comparing speech-totext<br />
systems. In addition, Classroom #1 and <strong>the</strong> General Area supported 394 class sessions and<br />
244 workshop/tutoring sessions, totaling 982 hours of use. Lastly, <strong>the</strong> NLC continued to support <strong>the</strong><br />
administration of SVP writing tests, <strong>the</strong> quarterly administration of <strong>the</strong> LAPT tests and provided a<br />
number of tours <strong>for</strong> incoming freshmen and visitors.<br />
-87-<br />
Student Support Services
Support Services<br />
NTID faculty provide academic assistance in <strong>the</strong><br />
<strong>for</strong>m of tutoring and academic advising <strong>for</strong> all NTIDsupported<br />
deaf and hard-of-hearing students<br />
registered in <strong>the</strong> o<strong>the</strong>r colleges of RIT.<br />
Student Support Services -88-<br />
Hours of Service<br />
Tutoring/Advising<br />
AY 2009-2010<br />
Class Sections<br />
Served<br />
Total Student<br />
Registrations<br />
College of Applied Science and<br />
Technology (CAST) * 451 891<br />
College of Imaging Arts and<br />
Sciences (CIAS) 1,737 457 968<br />
Saunders College of Business<br />
(COB) 2,058* 196 488<br />
Kate Gleason College of<br />
Engineering (KGCOE) 1,858* 106 138<br />
College of Liberal Arts (COLA) 3,137 685 2,126<br />
College of Science (COS) 7,195* 529 1,787<br />
Golisano College of Computing and<br />
In<strong>for</strong>mation Sciences (GCCIS) 2,251* 457 968<br />
Total 18,236 2,881 7,336<br />
* Hours <strong>for</strong> CAST are reported under COB, COE, COS and GCCIS.
Student Access Services<br />
In addition to providing sign language interpreting, real-time<br />
captioning and classroom notetaking to support deaf and hard-ofhearing<br />
students, NTID is committed to exploring, adapting and<br />
implementing new technologies to enhance access <strong>for</strong> students.<br />
-89-<br />
Student Access Services<br />
Student Access<br />
Services<br />
<strong>National</strong> <strong>Technical</strong> <strong>Institute</strong> <strong>for</strong> <strong>the</strong> <strong>Deaf</strong>
Student Access Services Highlights<br />
NTID provides an access services system to meet <strong>the</strong> needs of a large number of deaf and hard-ofhearing<br />
students enrolled in baccalaureate and graduate degree programs in RIT’s o<strong>the</strong>r colleges as well<br />
as students enrolled in NTID programs who take courses in <strong>the</strong> o<strong>the</strong>r colleges of RIT. Access services<br />
also are provided <strong>for</strong> non-academic events and activities throughout <strong>the</strong> RIT community.<br />
Educational access services that NTID offers <strong>for</strong> deaf and hard-of-hearing students enrolled in<br />
mainstream RIT classes include:<br />
Sign language interpreting provided by 120, as of fall 2010, full-time-equivalent employees—<br />
<strong>the</strong> largest staff of professional interpreters of any college program in <strong>the</strong> world. Students also<br />
may request interpreters <strong>for</strong> non-academic activities such as athletic events, religious services,<br />
student government meetings and guest presentations.<br />
Real-time captioning provided as a real-time access service <strong>for</strong> students who benefit from<br />
English text more than sign language interpreting. A growing staff, numbering 60 captionists as of<br />
fall 2010, has trained here in C-Print ® , a computer-assisted system developed at NTID <strong>for</strong><br />
transcribing in real time what teachers and students say in class. Real-time captioning also is<br />
provided <strong>for</strong> special events and out-of-class needs.<br />
Classroom notetaking services provided by trained student notetakers whose classroom notes<br />
are uploaded onto a website <strong>for</strong> easy access by deaf and hard-of-hearing students.<br />
O<strong>the</strong>r access services provided to NTID students include:<br />
Captioned classroom video materials. NTID, in conjunction with RIT, provides captioned video<br />
materials <strong>for</strong> use in classrooms.<br />
Assistive Listening Systems. NTID loans FM systems to students who benefit from such<br />
systems in classrooms.<br />
NTID also works with each of RIT’s colleges to provide <strong>the</strong> support needed to implement strategies <strong>for</strong><br />
maximizing access to campus services <strong>for</strong> deaf students. The Provost’s <strong>Deaf</strong> Access Committee and<br />
o<strong>the</strong>r groups address <strong>the</strong> needs of deaf and hard-of-hearing RIT students and ensure that RIT is in full<br />
compliance with <strong>the</strong> Americans with Disabilities Act and Section 504 of <strong>the</strong> Rehabilitation Act <strong>for</strong><br />
educational accommodation. The institutional position on accessibility <strong>for</strong> deaf and hard-of-hearing people<br />
includes strategies like <strong>the</strong> following, <strong>for</strong> which NTID provides support:<br />
Sharing responsibility <strong>for</strong> providing workshops, training and in<strong>for</strong>mation to assist faculty in <strong>the</strong><br />
o<strong>the</strong>r RIT colleges in effectively teaching deaf and hard-of-hearing students.<br />
Providing needed training and ensuring that academic and administrative service areas that<br />
interact with students have staff with a range of communication skills and strategies (sign<br />
language, computer terminal or o<strong>the</strong>r written interaction) to communicate effectively with<br />
deaf students.<br />
Ensuring that all audio and visual media produced at RIT are captioned, and that existing<br />
materials used in classrooms are captioned whenever possible.<br />
Encouraging RIT to advocate <strong>for</strong> <strong>the</strong> captioning of audio and visual materials, teleconferences<br />
and o<strong>the</strong>r educational media produced externally to RIT.<br />
NTID was an early innovator in access services, initiating training programs <strong>for</strong> educational interpreters in<br />
<strong>the</strong> 1970s that have grown from small, short-term certificate-level training into a large baccalaureate<br />
degree program. Staff interpreters from <strong>the</strong>se programs and o<strong>the</strong>rs have built careers at NTID,<br />
developing specialized expertise across <strong>the</strong> diverse technologies of RIT’s curriculum. The average tenure<br />
of a staff interpreter, as of fall 2010, is greater than 12 years. This experienced resource, and similar<br />
expertise developing now in real-time captioning, af<strong>for</strong>ds NTID students unparalleled access to <strong>the</strong> array<br />
of educational opportunities RIT provides. Continued innovation and application of new technology to our<br />
work promise even better services in years ahead.<br />
Student Access Services -90-
Access Services: Interpreting, Notetaking and Real-Time Captioning<br />
Interpreting, notetaking and real-time captioning<br />
services are provided to allow deaf and hard-ofhearing<br />
students equal access to in<strong>for</strong>mation in<br />
classes offered by o<strong>the</strong>r RIT colleges.<br />
RIT College<br />
Interpreting<br />
Hours<br />
-91-<br />
Notetaking<br />
Hours<br />
Real-Time<br />
Captioning<br />
Hours<br />
Class<br />
Sections<br />
Served<br />
College of Applied Science and<br />
Technology (CAST) 8,941 5,9<strong>31</strong> 1,584 <strong>31</strong>7<br />
Saunders College of Business<br />
(COB) 6,603 4,802 2,018 162<br />
Golisano College of Computing and<br />
In<strong>for</strong>mation Sciences (GCCIS) 6,300 4,982 1,713 195<br />
Kate Gleason College of<br />
Engineering (KGCOE) 2,219 2,202 872 80<br />
College of Imaging Arts and<br />
Sciences (CIAS) 14,384 11,039 3,107 361<br />
College of Liberal Arts (COLA) 24,580 16,755 5,362 558<br />
NTID Students with Approved<br />
Accommodations* 740 2,837 3 106<br />
College of Science (COS) 18,334 14,870 4,082 468<br />
O<strong>the</strong>r Courses** 3,010 202 236 216<br />
Total Hours 85,111 63,620 18,977 2,463<br />
* NTID students in associate degree programs who were approved <strong>for</strong> interpreting and/or notetaking services and/or<br />
real-time captioning services due to a secondary disability.<br />
** Courses taught outside listed colleges: First Year Experience, English Learning Center, Physical Education, etc.<br />
Student Access Services
Access Services: Interpreting Services<br />
In-class services include interpreting support in<br />
all colleges of RIT as well as student/professor<br />
meetings, field trips and o<strong>the</strong>r activities when<br />
required <strong>for</strong> credit-bearing courses. Non-class<br />
services include student use of interpreting<br />
services in student government, o<strong>the</strong>r<br />
In-Class Non-Class<br />
FY 2010 Hours %* Sections Activity<br />
Student Access Services -92-<br />
organizations, judicial proceedings, emergency<br />
situations and extra-curricular programs.<br />
Administrative use includes support <strong>for</strong> RIT<br />
faculty/staff, visiting dignitaries and speakers<br />
targeted mainly <strong>for</strong> faculty/staff audiences.<br />
Administrative<br />
Activity<br />
Overall Total<br />
Fall 25,994 77% 594 6,058 18% 1,623 5% 33,675 100%<br />
Winter 26,706 80% 588 5,424 16% 1,194 4% 33,324 100%<br />
Spring 27,833 76% 586 6,605 18% 2,063 6% 36,501 100%<br />
Summer 4,578 34% 80 6,906 52% 1,798 14% 13,282 100%<br />
FY 2010 Total 85,111 73% 1,848 24,993 21% 6,678 6% 116,782 100%<br />
FY 2004 Total 80,407 82% 12,813 13% 5,300 5% 98,520 100%<br />
FY 2005 Total 82,265 83% 11,349 11% 5,561 6% 99,175 100%<br />
FY 2006 Total** 89,748 84% 12,049 11% 5,460 5% 107,257 100%<br />
FY 2007 Total** 80,417 73% 1,617 23,757 21% 6,666 6% 110,840 100%<br />
FY 2008 Total 84,211 74% 1,869 23,620 21% 6,402 5% 114,233 100%<br />
FY 2009 Total 80,475 73% 1,8<strong>31</strong> 22,616 21% 6,527 6% 109,618 100%<br />
* Percentages are rounded to <strong>the</strong> nearest percent.<br />
** The separation of hours between <strong>the</strong> ―In-Class‖ and ―Non-Class Activity‖ categories was revised from 2006 to 2007, meaning a<br />
comparison between <strong>the</strong> two years is not meaningful.
Access Services: Real-Time Captioning (C-Print ® ) Services<br />
In keeping with NTID’s Strategic Vision 2010 and<br />
Strategic Decisions 2020, an increasing supply of<br />
real-time captioning is being made available <strong>for</strong><br />
those students taking courses in <strong>the</strong> o<strong>the</strong>r RIT<br />
colleges. Students who believe <strong>the</strong>y would benefit<br />
more from a text-based service may request it<br />
instead of sign language interpreting as <strong>the</strong>ir<br />
means of real-time access. Real-time captioning<br />
In-Class Non-Class<br />
FY 2010 Hours %* Sections Activity<br />
is provided via C-Print in classroom situations;<br />
<strong>the</strong>se services are provided on occasion <strong>for</strong> out-ofclass<br />
activities such as graduation ceremonies.<br />
The growth in <strong>the</strong> provision of real-time captioning<br />
from FY 2004 to FY 2010 below is reflective of our<br />
strategic planning.<br />
-93-<br />
Administrative<br />
Activity<br />
Overall Total<br />
Fall 6,402 98% 224 65 1% 43 1% 6,510 100%<br />
Winter 6,146 99% 208 44 1% 26 0% 6,216 100%<br />
Spring 5,871 99% 164 30 1% 48 1% 5,949 100%<br />
Summer 558 68% 22 64 8% 196 24% 818 100%<br />
FY 2010 Total 18,977 97% 618 203 1% <strong>31</strong>3 2% 19,493 100%<br />
FY 2004 Total<br />
FY 2005 Total<br />
FY 2006 Total<br />
FY 2007 Total<br />
FY 2008 Total<br />
FY 2009 Total<br />
* Percentages are rounded to <strong>the</strong> nearest percent.<br />
3,140 100% 82 6 0% 0 0% 3,146 100%<br />
7,325 98% 186 160 2% 0 0% 7,485 100%<br />
9,198 98% 2<strong>31</strong> 150 2% 2 0% 9,350 100%<br />
15,074 98% 426 288 2% 78 0% 15,440 100%<br />
16,186 97% 496 356 2% 180 1% 16,722 100%<br />
17,330 95% 538 255 1% 515 3% 18,168 100%<br />
Student Access Services
Access Services: Staff Training<br />
NTID Access Services offers interpreter, notetaker<br />
and C-Print ® training to its staff and student<br />
employees. Captionists are trained when hired and<br />
interpreters have in-service training available.<br />
Notetaker training is provided to hearing RIT<br />
students hired to take classroom notes <strong>for</strong> deaf and<br />
hard-of-hearing students taking classes in <strong>the</strong> o<strong>the</strong>r<br />
colleges of RIT.<br />
Number Enrolled<br />
Programs FY 2006 FY 2007 FY 2008 FY 2009 FY 2010<br />
In-Service Training <strong>for</strong> Interpreters* 93 97 92 37 74<br />
Notetaker Training 201 261 <strong>31</strong>8 223 346<br />
C-Print Training <strong>31</strong> 7 14 0 7<br />
Total 325 365 424 260 427<br />
* Eleven shorter workshops were provided to a total audience of 173 staff interpreters in addition to <strong>the</strong> quarter-long IST courses<br />
reported above.<br />
Student Access Services -94-
Persistence, Graduation & Employment<br />
The NTID Center on Employment hosts a job fair each year to<br />
connect students with employers. Business and industry<br />
continues to be <strong>the</strong> sector where most NTID graduates<br />
find employment.<br />
-95-<br />
Persistence, Graduation & Employment<br />
Persistence, Graduation<br />
& Employment<br />
<strong>National</strong> <strong>Technical</strong> <strong>Institute</strong> <strong>for</strong> <strong>the</strong> <strong>Deaf</strong>
Persistence, Graduation, and Employment Highlights<br />
Preparing deaf and hard-of-hearing students to live and work in <strong>the</strong> mainstream of society is <strong>the</strong> primary<br />
reason NTID was established in 1965. Prior to 1965, <strong>the</strong>re were few postsecondary educational<br />
opportunities <strong>for</strong> deaf and hard-of-hearing students and virtually none in technical studies. As a result,<br />
nearly 85 percent of deaf adults in <strong>the</strong> early 1960s found <strong>the</strong>mselves in unskilled or semi-skilled jobs.<br />
Today, NTID’s highly successful academic programs and services are leading graduates to successful<br />
careers in a broad range of fields. Over <strong>the</strong> past five years, 93 percent of graduates who chose to enter<br />
<strong>the</strong> labor <strong>for</strong>ce found employment that is commensurate with <strong>the</strong> level of <strong>the</strong>ir education and training.<br />
Figures <strong>for</strong> 2009 graduates show that 90 percent, or 94 of <strong>the</strong> 105 students who chose to enter <strong>the</strong><br />
work<strong>for</strong>ce, found employment.<br />
These statistics reflect <strong>the</strong> quality of an NTID education and its value. According to a study conducted by<br />
NTID with <strong>the</strong> Social Security Administration (SSA) in 2004, and updated in 2007, male graduates of<br />
NTID’s sub-baccalaureate programs (diplomas, certificates and associate degrees) earn 43 percent more<br />
in <strong>the</strong>ir lifetimes than students who withdraw from NTID. As a result, NTID graduates pay more in federal<br />
taxes. As <strong>the</strong> numbers of deaf and hard-of-hearing students in baccalaureate and graduate degrees in<br />
o<strong>the</strong>r colleges of RIT increase, so too does <strong>the</strong>ir potential earning power. Female graduates also do<br />
better than females who do not complete degrees, although <strong>the</strong> earnings differences are not as great as<br />
<strong>for</strong> male graduates. Female graduates earn approximately 25 percent less than <strong>the</strong>ir male counterparts<br />
earn upon graduation. This fact needs to be viewed in light of <strong>the</strong> differing career choices made by males<br />
and females. For example, in <strong>the</strong> BS cohorts studied, 69 percent of male graduates have degrees in<br />
Business, Science, Applied Science and Technology, and Engineering, while only 40 percent of females<br />
graduated in <strong>the</strong>se higher-paying fields. Conversely, 60 percent of females received <strong>the</strong>ir BS degrees in<br />
Imaging Arts and Liberal Arts, while only <strong>31</strong> percent of males received degrees in <strong>the</strong>se traditionally<br />
lower-paying areas. There<strong>for</strong>e, a true measure of gender bias, if any, would require matching degree<br />
areas among genders, which this study did not undertake. These gender-based patterns and pay<br />
differentials are very similar to what is seen in <strong>the</strong> general U.S. population.*<br />
We know that quality employment and higher earnings accrue to college graduates. Generally, we also<br />
know that students who withdraw fare no better earnings-wise than <strong>the</strong>ir peers who never went to college.<br />
With this in mind, NTID employs a variety of innovative strategies to improve persistence. All first-year<br />
students take Freshman Seminar, which undergoes continuing curriculum revisions to better address <strong>the</strong><br />
challenges that <strong>the</strong>se students experience. Students who appear to have a higher risk of attrition during<br />
<strong>the</strong>ir first year are identified and worked with closely. For <strong>the</strong> second year, NTID requires all first-year<br />
students to meet with <strong>the</strong>ir academic advisor to review <strong>the</strong>ir program requirements, identify courses <strong>for</strong><br />
<strong>the</strong> following quarter and review <strong>the</strong>ir individual English placement and plans <strong>for</strong> degree completion.<br />
NTID <strong>for</strong>med a retention committee dedicated to studying persistence issues and addressing concerns<br />
related to this issue from faculty, staff and students. As a result, a peer mentorship program was<br />
developed in several of <strong>the</strong> technical programs to provide a smooth transition <strong>for</strong> first-year students. Back<br />
on Track was a pilot program to provide peer support <strong>for</strong> students on academic probation. In fall 2009 (FY<br />
2010), NTID started a Step Up program designed to mentor African-American, Latin American, and<br />
Native American (AALANA) first-year students in <strong>the</strong> Career Exploration Studies program. The goal <strong>for</strong><br />
this program is to provide academic/social support <strong>for</strong> <strong>the</strong>se students, encourage <strong>the</strong>m to become peer<br />
mentors <strong>the</strong>mselves, and improve <strong>the</strong> persistence rate <strong>for</strong> AALANA students from <strong>the</strong>ir second year of<br />
study and beyond.<br />
Persistence is a continuing concern <strong>for</strong> colleges with “open” or “liberal” admissions policies like NTID.<br />
However, <strong>the</strong> college fares quite well; its overall graduation rate <strong>for</strong> students entering degree programs<br />
more closely approximates <strong>the</strong> rate in colleges and universities with higher or more “traditional” entrance<br />
requirements. Notwithstanding <strong>the</strong>se positive comparisons, NTID continues to work at improving its<br />
graduation rate.<br />
* U.S. Bureau of Census, Current Population Survey, 1991 – 2002 Annual Demographic Supplement<br />
Persistence, Graduation & Employment -96-
Persistence, Graduation, and Employment Highlights (continued)<br />
For AY 2009-10, RIT/NTID awarded 306 associate, bachelor’s and master’s degrees as well as diplomas<br />
and certificates to students. Of those graduates, 4 percent earned certificates and diplomas, 39 percent<br />
earned associate degrees, 47 percent earned bachelor’s degrees and 10 percent earned master’s<br />
degrees. Of <strong>the</strong> U.S. students, 27 percent of degrees were granted to minority students.<br />
Most of our graduates who choose to enter <strong>the</strong> labor market, successfully find jobs upon graduation,<br />
and most are in jobs commensurate with <strong>the</strong> level of <strong>the</strong>ir academic training. Of those, <strong>the</strong> majority<br />
are employed in business and industry (59%). The 2004 SSA research also showed that our deaf<br />
and hard-of-hearing graduates with bachelor’s degrees earn 79 percent of what <strong>the</strong>ir hearing peers<br />
earn (hearing RIT graduates). <strong>National</strong> statistics indicate that, in general, disabled workers earn only<br />
70 percent of what <strong>the</strong>ir non-disabled peers earn. If we add to <strong>the</strong> equation <strong>the</strong> fact that a college<br />
degree greatly reduces dependency on Supplemental Social Security transfer payments, <strong>the</strong><br />
reasons <strong>for</strong> <strong>the</strong> dedication of NTID faculty and staff to assure that students graduate and succeed<br />
is clear.<br />
An NTID Alumni Association Board of Directors was established to support <strong>the</strong> more than 6,700<br />
RIT/NTID alumni. In <strong>the</strong> past year, more than 1,900 alumni and guests participated in various alumni<br />
activities via 20 alumni chapters, including events in Washington, D.C.; Berlin, Conn.; Los Angeles,<br />
Calif.; Chicago, Ill.; Long Island, N.Y.; Boston, Mass.; Centralia, Wa.; and Rochester, N.Y. The NTID<br />
Alumni Relations Office, in conjunction with NTID Admissions and NTID Center on Employment, is<br />
focused on providing alumni workshops on how to develop strategies <strong>for</strong> finding employment and<br />
advancing in <strong>the</strong>ir careers during challenging economic times.<br />
Abigail (center), a Business Technology major from Brampton, Ontario, hugs<br />
recent graduates LaTonya of Chicago, Ill. and Tina of Markham, Ontario.<br />
-97-<br />
Persistence, Graduation & Employment
First-Year Persistence Rates<br />
Since <strong>the</strong>re is considerable variability from year to<br />
year in terms of persistence rates <strong>for</strong> entering<br />
cohorts of students, NTID monitors and reports<br />
annually on persistence using a three-year moving<br />
average. The table below presents in<strong>for</strong>mation<br />
about three-year moving averages <strong>for</strong> NTIDsupported<br />
undergraduate students entering<br />
degree-granting programs since 1999. Thus, <strong>the</strong><br />
most recent three-year average is reported <strong>for</strong> <strong>the</strong><br />
Three-Year Entry Cohort<br />
Persistence, Graduation & Employment -98-<br />
First-Year Persistence Rates*<br />
Number<br />
in Cohort<br />
1,118 students who entered degree programs in<br />
<strong>the</strong> years 2007, 2008 and 2009. Data in <strong>the</strong> table<br />
below indicate that <strong>for</strong> <strong>the</strong> most recent three-year<br />
period, 79 percent of new students persisted to <strong>the</strong><br />
second year. This represents one of <strong>the</strong> highest<br />
percentages reported below, resulting from <strong>the</strong><br />
implementation of a variety of student success<br />
strategies. Disaggregated rates can be found on<br />
<strong>the</strong> following page.<br />
Number Registering<br />
Second Year<br />
Overall<br />
Persistence Rate<br />
1999, 2000, <strong>2001</strong> 963 738 77%<br />
2000, <strong>2001</strong>, 2002 982 743 76%<br />
<strong>2001</strong>, 2002, 2003 1,009 759 75%<br />
2002, 2003, 2004 1,019 763 75%<br />
2003, 2004, 2005 1,061 798 75%<br />
2004, 2005, 2006 1,046 809 77%<br />
2005, 2006, 2007 986 777 79%<br />
2006, 2007, 2008 1,054 839 80%<br />
2007, 2008, 2009 1,118 885 79%<br />
* Three-year averages <strong>for</strong> students registering in degree programs <strong>for</strong> fall quarter. ASL-English Interpretation and MSSE students<br />
are not included.
Persistence to Graduation <strong>for</strong> <strong>Deaf</strong> and Hard-of-Hearing Students<br />
<strong>National</strong>ly, four-year public and private colleges’<br />
have first-year persistence rates of 68 to 69<br />
percent. This compares to a 79 percent persistence<br />
rate <strong>for</strong> first-year NTID students in a major, across<br />
two-year and four-year degrees (74% <strong>for</strong> two-year;<br />
87% <strong>for</strong> four-year). Students admitted to NTID have<br />
ACT composite scores that are comparable to<br />
students in two-year colleges with open or liberal<br />
admissions policies; yet, first- year persistence<br />
Two-Year<br />
Colleges<br />
<strong>National</strong> and NTID Persistence Rates*<br />
-99-<br />
rates at NTID are comparable with those of<br />
institutions admitting students who are far better<br />
prepared academically. The table below also<br />
indicates that NTID’s graduation rates (53% <strong>for</strong><br />
students admitted into sub-bachelor-level programs<br />
and 73% <strong>for</strong> those in bachelor-level programs) are<br />
comparable to public colleges with traditional or<br />
selective admission standards.<br />
First-Year<br />
Persistence Rate<br />
Graduation Rate<br />
Public (<strong>National</strong>) 56% 28%<br />
NTID Sub-Baccalaureate** 74% 53%<br />
Four-Year<br />
Public (<strong>National</strong>) 68% 40%<br />
Private (<strong>National</strong>) 69% 55%<br />
O<strong>the</strong>r RIT Colleges (NTID<br />
Baccalaureate) 87% 73%<br />
* Source of <strong>National</strong> Estimates: <strong>National</strong> Collegiate Retention & Persistence to Degree Rates, retrieved from<br />
http://www.ACT.org/research/policymakers/pdf/retain_2010.pdf<br />
** NTID calculates first-year persistence and graduation rates using a three-year moving average.<br />
Persistence, Graduation & Employment
Degrees Granted: FY 2006 to FY 2010<br />
During <strong>the</strong> past five years, NTID has awarded an<br />
average of 282 degrees annually. The number <strong>for</strong><br />
FY 2010 was 306. During this same time frame, <strong>the</strong><br />
number of students achieving bachelor’s and<br />
master’s degrees has increased. This change is<br />
indicative of <strong>the</strong> demands being made by deaf and<br />
hard-of-hearing persons <strong>for</strong> access to higher-level<br />
Persistence, Graduation & Employment -100-<br />
programs and NTID’s success in shifting its<br />
resources to accommodate <strong>the</strong> increasing numbers<br />
of students seeking higher degrees. Of <strong>the</strong> 306<br />
graduate and undergraduate degrees, diplomas<br />
and certificates granted in FY 2010, 76, or<br />
27 percent, were granted to students from<br />
minority backgrounds.*<br />
Five different degree levels are awarded to deaf and hard-of-hearing graduates of RIT.<br />
Sub-Baccalaureate Certification<br />
1. An Associate in Occupational Studies (AOS) degree requires 57-69 credit hours of technical<br />
instruction and permits students to enter <strong>the</strong>ir careers directly upon graduation. In addition to<br />
completing technical courses satisfactorily, students must complete a specific number of credit hours<br />
in English, communication, general education and ma<strong>the</strong>matics.<br />
2. An Associate in Applied Science (AAS) degree permits students to enter <strong>the</strong>ir careers directly upon<br />
graduation, or in many cases, to transfer to upper-division programs in <strong>the</strong> o<strong>the</strong>r colleges of RIT.<br />
Completion of this degree requires 57-69 credit hours of technical instruction. In addition to <strong>the</strong><br />
technical courses, students must complete 20 credit hours through RIT’s College of Liberal Arts and<br />
o<strong>the</strong>r required credit hours as determined by <strong>the</strong> program of study.<br />
3. The Associate in Science (AS) degree is a transfer associate degree <strong>for</strong> students seeking admission<br />
to bachelor-level studies. This degree requires completion of 90-100 credit hours, half of which must<br />
be from liberal arts and science; <strong>the</strong> rest are from technical and professional areas.<br />
Bachelor’s/Master’s Degrees<br />
4. A bachelor’s degree is awarded to students who complete all required courses to graduate from a<br />
four- or five-year program in one of <strong>the</strong> RIT colleges. A bachelor’s degree requires completion of 180-<br />
200 credit hours.<br />
5. A master’s degree indicates that a student has completed a minimum of 45 credit hours beyond <strong>the</strong><br />
baccalaureate level in any RIT master’s degree program.<br />
* Minority status is unknown <strong>for</strong> 24 of <strong>the</strong>se 306 graduates.
Degrees Granted: FY 2006 to FY 2010 (continued)<br />
160<br />
140<br />
120<br />
100<br />
80<br />
60<br />
40<br />
20<br />
0<br />
139<br />
103<br />
42<br />
122<br />
92<br />
37<br />
126 123<br />
115<br />
116<br />
* This number includes hearing graduates from <strong>the</strong> ASL-English Interpretation program.<br />
** This number includes deaf and hard-of-hearing graduates from RIT, as well as deaf, hard-of-hearing and hearing graduates<br />
from <strong>the</strong> MSSE program.<br />
-101-<br />
45 45<br />
143<br />
1<strong>31</strong><br />
2006 2007 2008 2009 2010<br />
Sub-Baccalaureate Baccalaureate Master's<br />
FY 2006 FY 2007 FY 2008 FY 2009 FY 2010<br />
Sub-Baccalaureate* 47.1% 48.9% 48.6% 40.2% 40.9%<br />
Baccalaureate* 38.2% 36.3% 36.7% 44.1% 43.3%<br />
Master’s** 14.7% 14.8% 14.7% 15.7% 15.8%<br />
32<br />
Persistence, Graduation & Employment
Graduates by Program Areas<br />
Of all <strong>the</strong> degrees awarded to NTID students on <strong>the</strong><br />
RIT campus in FY 2010, 57 percent were through<br />
programs offered by NTID and 43 percent through<br />
<strong>the</strong> o<strong>the</strong>r seven colleges of RIT. Historically,<br />
68 percent of <strong>the</strong> degrees have been awarded from<br />
NTID and 32 percent from <strong>the</strong> o<strong>the</strong>r RIT colleges.<br />
This change is <strong>the</strong> result of increased demand<br />
Persistence, Graduation & Employment -102-<br />
by students <strong>for</strong> entry into bachelor-level<br />
programs, better articulation between NTID and<br />
RIT curricula and improved and expanded<br />
access/support services.<br />
Data on minority status of <strong>the</strong>se graduates appear<br />
in <strong>the</strong> Diversity and Pluralism section.<br />
FY 2010 CUMULATIVE<br />
(FY 1970 – FY 2010)<br />
Number Percentage Number Percentage<br />
of<br />
of<br />
of<br />
of<br />
Graduates Graduates Graduates Graduates<br />
NTID<br />
Career-Focused and Transfer Associate<br />
Degrees 123 40% 4,083 57%<br />
ASL-English Interpretation Bachelor <strong>31</strong> 10% 105 1%<br />
ASL-English Interpretation Associate 2 1% 507 7%<br />
ASL-English Interpretation Certificate 0 0% 6 0%<br />
Master of Science in Secondary Education 18 6% 223 3%<br />
Subtotal NTID 174 57% 4,924 68%<br />
O<strong>the</strong>r Colleges of RIT*<br />
College of Applied Science and Technology 63 20% 575 8%<br />
College of Business 21 7% 334 5%<br />
College of Computing and In<strong>for</strong>mation<br />
Sciences 9 3% 251 4%<br />
College of Engineering 5 2% 79 1%<br />
College of Imaging Arts and Sciences 21 7% 520 7%<br />
College of Liberal Arts 8 2% 383 5%<br />
College of Science 5 2% 123 2%<br />
Subtotal O<strong>the</strong>r Colleges 132 43% 2,265 32%<br />
Total 306 100% 7,189 100%<br />
* Includes bachelor’s and master’s degrees granted by <strong>the</strong> o<strong>the</strong>r colleges of RIT, as well as some associate degrees.
Time Required to Complete a Degree<br />
With <strong>the</strong> exception of deaf and hard-of-hearing<br />
students directly admitted to an RIT college o<strong>the</strong>r<br />
than NTID, students who are deaf or hard-ofhearing<br />
take a longer time to complete a degree<br />
than hearing students. There are many reasons <strong>for</strong><br />
this, not <strong>the</strong> least of which is academic<br />
preparedness. <strong>Deaf</strong> and hard-of-hearing students<br />
admitted to NTID generally are academically<br />
behind <strong>the</strong>ir 18- to 19-year-old hearing<br />
counterparts. Many enter NTID with ACT<br />
composite scores of less than 16 and reading<br />
comprehension and language skills between 7 th<br />
and 9 th grade levels. There<strong>for</strong>e, considerable time<br />
and ef<strong>for</strong>t is devoted to remediation and career<br />
exploration. In addition, most programs have<br />
between one- and three-quarter requirements <strong>for</strong><br />
cooperative education experiences (paid<br />
employment in field related to study), while some<br />
programs require more than three quarters of<br />
cooperative education. This extends normal<br />
program length by approximately one year;<br />
typically, associate degree programs require three<br />
years and bachelor’s programs require five years.<br />
First Degree Category<br />
Time Required to Complete a Degree:<br />
Graduates Academic Year 2007, 2008, 2009<br />
Number<br />
of<br />
Students<br />
The table below shows <strong>the</strong> average number of<br />
active quarters and calendar years elapsed<br />
between entry and date of degree.<br />
<strong>Deaf</strong> and hard-of-hearing students who transfer to<br />
an RIT baccalaureate program after completing an<br />
associate degree take seven years total, on<br />
average, to attain a bachelor’s degree. Students<br />
who start at NTID, primarily because <strong>the</strong>y were<br />
initially inadmissible to RIT, who later satisfy <strong>the</strong><br />
RIT requirements be<strong>for</strong>e finishing an NTID<br />
associate degree and <strong>the</strong>n transfer, take 5.7 years,<br />
on average, to attain a bachelor’s degree. <strong>Deaf</strong> and<br />
hard-of-hearing students who directly enter RIT<br />
baccalaureate programs graduate in less than five<br />
years, on average. What is remarkable about <strong>the</strong><br />
three baccalaureate cohorts of students is that all<br />
deaf and hard-of-hearing students typically have<br />
lower entry-level academic skills than do <strong>the</strong>ir<br />
hearing peers, yet with preparation, support and<br />
access services provided by NTID, <strong>the</strong>y are able to<br />
enter and graduate from RIT programs at rates<br />
similar to <strong>the</strong>ir hearing peers.<br />
* Does not include quarters when students were withdrawn or on leave of absence.<br />
** Calculated from <strong>the</strong> day student enters NTID to <strong>the</strong> day he/she graduates, regardless of withdrawals or leaves of absence.<br />
-103-<br />
Average<br />
Active<br />
Quarters*<br />
Average<br />
Calendar<br />
Years**<br />
Bachelor’s degree (transfer after NTID<br />
associate degree) 92 21.5 7.0<br />
Bachelor’s degree (transfer from NTID<br />
without associate degree) 139 17.4 5.7<br />
Bachelor’s degree (direct entry)<br />
AS/AAS degree<br />
AOS degree<br />
86 15.3 4.5<br />
172 13.8 4.8<br />
133 13.0 4.8<br />
Persistence, Graduation & Employment
Origin and Success of <strong>Deaf</strong> and Hard-of-Hearing Students in<br />
Baccalaureate Programs<br />
Historically, 25 percent of deaf and hard-of-hearing<br />
students who begin <strong>the</strong>ir studies within NTID<br />
eventually transfer to one of <strong>the</strong> o<strong>the</strong>r colleges of<br />
RIT. The net result of this transfer pattern is that<br />
more than half of deaf and hard-of-hearing<br />
graduates from RIT baccalaureate programs began<br />
<strong>the</strong>ir college careers within NTID.<br />
Persistence, Graduation & Employment -104-<br />
The table below provides baccalaureate graduation<br />
rates by point of entry to NTID and RIT.<br />
Graduation Rates <strong>for</strong> <strong>Deaf</strong> and Hard-of-Hearing Students<br />
Registered in <strong>the</strong> O<strong>the</strong>r Colleges of RIT<br />
(Cohort Entering <strong>2001</strong> – 2003)*<br />
Withdrawn<br />
Bachelor’s<br />
Degree<br />
Total<br />
Graduation<br />
Rate**<br />
Direct Admit to RIT<br />
<strong>Deaf</strong> and Hard-of-Hearing 53 100 153 65%<br />
Transfer from NTID<br />
Pre-Baccalaureate Program 9 36 45 80%<br />
Transfer from NTID<br />
Associate Degree Program 25 110 135 81%<br />
<strong>Deaf</strong> and Hard-of-Hearing Students<br />
Overall 87 246 333 74%<br />
* NTID rates report three-year moving averages.<br />
** RIT allows seven years <strong>for</strong> completion of degree.<br />
Carla, an interpreting graduate from Dumfries,<br />
Va., displays her graduation cap with a special<br />
message to her parents.
Graduation and Employment <strong>for</strong> Recent Graduates<br />
Employment rates are calculated using <strong>the</strong><br />
methodology of <strong>the</strong> Bureau of Labor Statistics<br />
(BLS) in its Current Population Survey (household<br />
survey), which provides in<strong>for</strong>mation on <strong>the</strong> labor<br />
<strong>for</strong>ce, employment, and unemployment. As <strong>the</strong><br />
BLS defines it, “The civilian labor <strong>for</strong>ce is <strong>the</strong> sum<br />
of employed and unemployed persons. Those not<br />
classified as employed or unemployed are not in<br />
<strong>the</strong> labor <strong>for</strong>ce. The unemployment rate is <strong>the</strong><br />
number unemployed as a percent of <strong>the</strong> labor<br />
<strong>for</strong>ce. The labor <strong>for</strong>ce participation rate is <strong>the</strong> labor<br />
<strong>for</strong>ce as a percent of <strong>the</strong> population... ”<br />
NTID’s labor <strong>for</strong>ce is <strong>the</strong> sum of those graduates<br />
who are employed and those who want to be<br />
employed. Those who do not want to be employed<br />
because <strong>the</strong>y choose to continue to pursue<br />
Degrees<br />
Granted<br />
250<br />
200<br />
150<br />
100<br />
50<br />
0<br />
198<br />
117 111<br />
213<br />
109 103<br />
bachelor’s and master’s degrees at RIT or at<br />
some o<strong>the</strong>r institution of higher education, or<br />
choose to become homemakers, or to be idle<br />
temporarily while traveling, etc., are not in <strong>the</strong><br />
labor <strong>for</strong>ce. During FY 2009*, 218** deaf and<br />
hard-of-hearing students graduated, and 105<br />
chose to enter <strong>the</strong> labor <strong>for</strong>ce. Ninety-four were<br />
employed, while 11 were unable to find<br />
employment. There<strong>for</strong>e, 89.52 percent (94/105)<br />
found employment. NTID’s employment rate over<br />
<strong>the</strong> past five years as calculated above is<br />
93 percent. Of <strong>the</strong> 113 remaining graduates<br />
from 2009, 80 are continuing <strong>the</strong>ir education<br />
toward advanced degrees ei<strong>the</strong>r at RIT or<br />
elsewhere, 17 are not looking <strong>for</strong> employment, and<br />
16 have an unknown status.<br />
203<br />
* As of <strong>the</strong> writing of this report, <strong>the</strong> employment in<strong>for</strong>mation <strong>for</strong> 2010 is incomplete; <strong>the</strong>re<strong>for</strong>e, we report employment rates<br />
of 2009 graduates.<br />
** Students are only counted once in <strong>the</strong> case of multiple degrees, and <strong>the</strong> total number of graduates does not include degrees in<br />
<strong>the</strong> ASL-English Interpretation program, <strong>the</strong> Master of Science program in Secondary Education or any certificates awarded.<br />
-105-<br />
214<br />
118 112<br />
113<br />
102<br />
FY 2005 FY 2006 FY 2007 FY 2008 FY 2009<br />
Graduates In <strong>the</strong> Labor Force Employed<br />
218<br />
105<br />
94<br />
Persistence, Graduation & Employment
Employment Services <strong>for</strong> <strong>Deaf</strong> and Hard-of-Hearing Students and Graduates<br />
Prior to students’ cooperative work experiences,<br />
NTID’s Center on Employment (NCE) offers a Job<br />
Search Process course to support student learning<br />
about how to organize and conduct job search<br />
activities. Students utilize <strong>the</strong> extensive NCE<br />
website and print resources to research<br />
prospective employers, identify appropriate<br />
employment opportunities and obtain in<strong>for</strong>mation<br />
During FY 2010:<br />
Persistence, Graduation & Employment -106-<br />
about applying <strong>for</strong> a job and working. During <strong>the</strong><br />
academic year, employment advisors meet with<br />
students at different locations on campus, and<br />
reach out to students at different NTID events. Our<br />
staff also provide job-seeking advice to students<br />
and graduates through e-mail, instant messaging<br />
and videophone.<br />
One-hundred <strong>for</strong>ty-one NTID students were enrolled in 12 sections of Job Search Process.<br />
NCE personnel provided more than 3,000 hours of student and graduate employment advising.<br />
Students sought individualized job search assistance at various campus locations.<br />
Thirty-nine students took advantage of three sessions offered to review and advise on resumes.<br />
NCE participated in several interactive events each quarter <strong>for</strong> students, along with o<strong>the</strong>r NTID<br />
departments and student groups, to in<strong>for</strong>m students about NCE services.<br />
Employment advisors, faculty, and students traveled to Hawthorne and Yorktown Heights, N.Y. to visit<br />
IBM facilities to learn about employment opportunities and <strong>the</strong> work environment.<br />
Forty-three deaf and hard-of-hearing students attended three career development workshops.
Where Recent Graduates Are Working<br />
In FY 2009, 18 percent of U.S. NTID graduates<br />
accepted jobs in areas near <strong>the</strong>ir hometowns in<br />
<strong>the</strong>ir first jobs after graduation, while 33 percent<br />
found employment in <strong>the</strong> Rochester area and<br />
Area<br />
49 percent in o<strong>the</strong>r areas of <strong>the</strong> country. The<br />
majority of graduates are employed in <strong>the</strong> eastern<br />
parts of <strong>the</strong> country, areas that have been strong<br />
sources of applicants <strong>for</strong> NTID.<br />
-107-<br />
Percent of Placed Graduates<br />
FY 2005 FY 2006 FY 2007 FY 2008 FY 2009*<br />
Rochester 14% 22% 16% 21% 18%<br />
Hometown <strong>31</strong>% 29% 33% 29% 33%<br />
O<strong>the</strong>r 55% 49% 51% 50% 49%<br />
Total 100% 100% 100% 100% 100%<br />
Number of Graduates Placed 111 103 112 102 94<br />
FY 2009 Graduate Placement by Region**<br />
* Placement numbers <strong>for</strong> FY 2010 graduates are incomplete and will be reported next year.<br />
** In addition, 3.2 percent are working in Canada, 1.1 percent are working internationally and 3.1 percent are working in<br />
unknown locations.<br />
Persistence, Graduation & Employment
Employment by Sector of <strong>the</strong> Economy<br />
Of <strong>the</strong> last cohort of graduates tracked <strong>for</strong><br />
employment, 59 percent have acquired jobs in<br />
business and industry, 21 percent in education<br />
and 20 percent in government.<br />
Sector FY 2005 FY 2006 FY 2007 FY 2008 FY 2009*<br />
Business/Industry 69% 60% 63% 71% 59%<br />
Education/Non-Profit 22% 30% 29% 20% 21%<br />
Government 9% 10% 8% 9% 20%<br />
Total 100% 100% 100% 100% 100%<br />
* Placement numbers <strong>for</strong> FY 2010 graduates are incomplete and will be reported next year.<br />
Persistence, Graduation & Employment -108-
Occupations of Recent Graduates: Entry Status by Labor Category<br />
FY 2009 deaf and hard-of-hearing graduates<br />
entered a wide variety of jobs. The following table<br />
reports on <strong>the</strong> occupations of employed alumni<br />
using <strong>the</strong> Standard Occupational Coding system<br />
(SOC) used by <strong>the</strong> U.S. Department of Labor.<br />
Occupations are grouped into 22 categories<br />
plus military.<br />
Percentages among <strong>the</strong> various categories are<br />
somewhat different than seen in <strong>the</strong> FY 2009<br />
Annual Report. There was substantially more postgraduation<br />
employment in <strong>the</strong> Arts, Design,<br />
Entertainment, Sports and Media category – 13.8<br />
percent this year versus 8.8 percent in FY 2009, as<br />
Occupations of<br />
Working 2009 Graduates<br />
Arts, Design, Entertainment,<br />
Sports & Media<br />
Business & Financial<br />
Operations<br />
%<br />
13.8%<br />
10.6%<br />
Computer & Ma<strong>the</strong>matical 9.6%<br />
Office & Administrative Support 9.6%<br />
Architecture & Engineering 8.5%<br />
Production Occupations 7.5%<br />
Education, Training & Library 6.4%<br />
Management 5.3%<br />
well as employment in Sales, Production, and<br />
Community and Social Services. Areas where<br />
relatively fewer jobs were reported than last year<br />
were in Business and Financial Operations and<br />
Office and Administrative Support. O<strong>the</strong>r categories<br />
showed equivalent percentages.<br />
Categories <strong>for</strong> which <strong>the</strong>re was no reported<br />
employment this year were: Legal; Healthcare<br />
Support; Food Preparation and Serving Related;<br />
Construction and Extraction; Installation,<br />
Maintenance and Repair; Transportation and<br />
Material Moving and <strong>the</strong> Military.<br />
Sample Job Titles<br />
Held by 2009 Graduates within Category<br />
Graphic Designer, Studio Manager, Contractor, Media<br />
Specialist, Photo Assistant, Freelance Graphic Artist<br />
Contract Specialist, Logistic Management Specialist,<br />
Accountant, Proposal Analyst<br />
Surveillance In<strong>for</strong>mation Analyst, Support Technician,<br />
Programmer, In<strong>for</strong>mation Technologist,<br />
Automation Technician<br />
Accounting Clerk, <strong>Technical</strong> Specialist, Data Entry Clerk,<br />
Bookkeeper, Document Specialist, Human Resources<br />
Assistant, Office Clerk<br />
Global Sterile Packaging Engineer, Mechanical Process<br />
Engineer, Project Scientist, Field Service Engineer, CAD<br />
Operator, Project Manager<br />
Production Floor Associate, Machinist, Digital Operations<br />
Coordinator, Optical Finishing Technician<br />
Teaching Assistant, Art Teacher, Transition Specialist, Head<br />
Volleyball Coach, Lecturer, Faculty, Teacher’s Aide<br />
Director Project HOPE, Marketing Consultant, Public<br />
Relations Assistant, Communication Specialist<br />
Life, Physical & Social Science 4.3% Packaging Innovation Intern, Chemist, Intern<br />
-109-<br />
Persistence, Graduation & Employment
Occupations of Recent Graduates: Entry Status (continued)<br />
Occupations of<br />
Working 2009 Graduates<br />
Community & Social Services 4.2%<br />
Sales & Related Occupations 3.2% Clerk, Staff<br />
Persistence, Graduation & Employment -110-<br />
%<br />
Sample Job Titles<br />
Held by 2009 Graduates within Category<br />
Life Skills Counselor, Mental Health Technician, Living Well<br />
Specialist, Team Minister<br />
Personal Care & Service 2.1% Child Care Worker, Personal Assistant Coordinator<br />
Protective Services 1.1% Police Officer<br />
Building and Grounds Cleaning<br />
& Maintenance<br />
1.1% Housekeeper<br />
Farming, Fishing & Forestry 1.1% Scale Operator<br />
Healthcare Practitioners and<br />
<strong>Technical</strong> Occupations<br />
Job Title Not Specified 10.6%<br />
Total 100%<br />
1.0% Safety and Health Inspector
Occupations of Alumni by Gender and Labor Categories<br />
NTID alumni from graduation years 1994 – 2009<br />
were surveyed in 2010. The focus was on two<br />
distinct groups: those one to five years from<br />
graduation and those six to 15 years from<br />
graduation. The gender percentages in each<br />
occupational category are of <strong>the</strong> total sample.<br />
The following table reports on <strong>the</strong> occupations of<br />
employed alumni using <strong>the</strong> Standard Occupational<br />
Coding system (SOC) used by <strong>the</strong> U.S.<br />
Department of Labor. Occupations are grouped into<br />
22 major categories plus military.<br />
Percentages of alumni reporting employment in <strong>the</strong><br />
occupational categories are essentially <strong>the</strong> same<br />
Occupations of<br />
Working Alumni*<br />
Education, Training & Library<br />
All<br />
One to Five<br />
Six to 15<br />
Male<br />
Female<br />
Computer & Ma<strong>the</strong>matical<br />
All<br />
One to Five<br />
Six to 15<br />
Male<br />
Female<br />
Business & Financial Operations<br />
All<br />
One to Five<br />
Six to 15<br />
Male<br />
Female<br />
Community & Social Services<br />
All<br />
One to Five<br />
Six to 15<br />
Male<br />
Female<br />
Office & Administrative Support<br />
All<br />
One to Five<br />
Six to 15<br />
Male<br />
Female<br />
%<br />
20.4%<br />
20.4%<br />
20.6%<br />
<strong>31</strong>.2%<br />
68.8%<br />
13.2%<br />
12.2%<br />
13.8%<br />
83.3%<br />
16.7%<br />
11.0%<br />
9.8%<br />
11.7%<br />
48.0%<br />
52.0%<br />
9.9%<br />
7.0%<br />
11.7%<br />
33.3%<br />
66.7%<br />
9.2%<br />
8.7%<br />
9.6%<br />
38.1%<br />
61.9%<br />
as in <strong>the</strong> 2007 survey with a few exceptions. Twice<br />
as many alumni in <strong>the</strong> 2007 survey reported<br />
employment in Arts, Design, Entertainment, Sports<br />
& Media. This is primarily due to <strong>the</strong> exclusion of<br />
interpreters in <strong>the</strong> 2010 survey. This year, <strong>the</strong><br />
percentage of alumni working in Business &<br />
Financial Operations almost doubled compared<br />
with <strong>the</strong> 2007 alumni survey. Also, <strong>the</strong>re were more<br />
alumni in Sales and Related, and fewer alumni in<br />
Management Occupations.<br />
The shift toward more professional and technical<br />
post-graduation employment noted in <strong>the</strong> 2007<br />
survey seems to be continuing.<br />
Sample Job Titles<br />
Held by Alumni within Category<br />
Professor, Practicum Coordinator, Science<br />
Teacher, Itinerant Teacher Assistant, Literacy<br />
Instructor, Substitute Teacher<br />
System Administrator, Webmaster, Software<br />
Developer, Support Technician, Software Test<br />
Engineer, Programmer/Analyst, Application<br />
Developer<br />
Tax Coordinator, Compliance Specialist, Fraud<br />
and Loss Analyst, VP Marketing, Deciding Officer<br />
Advocacy Officer, Case Manager, Clinical<br />
Coordinator, Independent Living Specialist, Job<br />
Coach, Career Consultant, Direct Care Staff<br />
Accounting Technician, Administrative Assistant,<br />
Inventory Clerk, Receipt Log Clerk, Project<br />
Assistant, Rural Letter Carrier, Assistant, Legal<br />
Associate, Scheduler Clerk<br />
* There were several job categories not represented by any of <strong>the</strong> graduates: Protective Services; Farming, Fishing & Forestry;<br />
Construction & Extraction and Military Services.<br />
-111-<br />
Persistence, Graduation & Employment
Occupations of Alumni by Gender and Labor Categories (continued)<br />
Occupations of<br />
Working Alumni*<br />
Arts, Design, Entertainment,<br />
Sports & Media<br />
All<br />
One to Five<br />
Six to 15<br />
Male<br />
Female<br />
Architecture & Engineering<br />
All<br />
One to Five<br />
Six to 15<br />
Male<br />
Female<br />
Production Occupations<br />
All<br />
One to Five<br />
Six to 15<br />
Male<br />
Female<br />
Management<br />
All<br />
One to Five<br />
Six to 15<br />
Male<br />
Female<br />
Sales & Related<br />
All<br />
One to Five<br />
Six to 15<br />
Male<br />
Female<br />
Healthcare Practitioners &<br />
<strong>Technical</strong> Occupations<br />
All<br />
One to Five<br />
Six to 15<br />
Male<br />
Female<br />
Persistence, Graduation & Employment -112-<br />
%<br />
6.2%<br />
7.6%<br />
5.3%<br />
32.2%<br />
67.8%<br />
5.9%<br />
7.6%<br />
5.0%<br />
70.4%<br />
29.6%<br />
3.7%<br />
1.2%<br />
5.3%<br />
82.4%<br />
17.6%<br />
3.1%<br />
2.9%<br />
3.2%<br />
35.7%<br />
64.3%<br />
3.1%<br />
4.6%<br />
2.1%<br />
28.6%<br />
71.4%<br />
2.8%<br />
3.5%<br />
2.5%<br />
23.1%<br />
76.9%<br />
Sample Job Titles<br />
Held by Alumni within Category<br />
Designer, Digital Video Specialist, Exhibit Graphic<br />
Designer, Industrial Designer, Media Specialist,<br />
Interpreter/Transcriptionist<br />
Aerospace Engineer, Machine Designer, Packaging<br />
Engineer, Senior Enterprise Architect, Test<br />
Technician, Transportation Engineer II, Quality<br />
Assurance Analyst<br />
Cabinet Maker, Die Builder, Engraving Specialist,<br />
Typesetter/QC, Optical Technician, CNC<br />
Programmer, Machinist<br />
Disability Policy Manger, Contracts Administrator,<br />
President/Owner, Program Control Officer,<br />
Executive Director<br />
Customer Service Representative, Customer Service<br />
Associate, Representative/Beauty Consultant<br />
Emergency Center Medical Coder, Laboratory<br />
Technician, Discovery Technologist, Registered<br />
Dietician, Sonographer<br />
* There were several job categories not represented by any of <strong>the</strong> graduates: Protective Services; Farming, Fishing & Forestry;<br />
Construction & Extraction and Military Services.
Occupations of Alumni by Gender and Labor Categories (continued)<br />
Occupations of<br />
Working Alumni*<br />
Life, Physical & Social Science<br />
All<br />
One to Five<br />
Six to 15<br />
Male<br />
Female<br />
Building and Grounds Cleaning<br />
& Maintenance<br />
All<br />
One to Five<br />
Six to 15<br />
Male<br />
Female<br />
Personal Care & Service<br />
All<br />
One to Five<br />
Six to 15<br />
Male<br />
Female<br />
Installation, Maintenance &<br />
Repair<br />
All<br />
One to Five<br />
Six to 15<br />
Male<br />
Female<br />
Food Preparation & Serving<br />
All<br />
One to Five<br />
Six to 15<br />
Male<br />
Female<br />
Legal<br />
All<br />
One to Five<br />
Six to 15<br />
Male<br />
Female<br />
%<br />
2.6%<br />
2.3%<br />
2.5%<br />
25.0%<br />
75.0%<br />
2.0%<br />
3.5%<br />
1.1%<br />
77.8%<br />
22.2%<br />
1.5%<br />
2.3%<br />
1.1%<br />
28.6%<br />
71.4%<br />
1.3%<br />
2.3%<br />
0.7%<br />
100.0%<br />
0.0%<br />
1.3%<br />
2.3%<br />
0.7%<br />
66.7%<br />
33.3%<br />
1.1%<br />
0.0%<br />
1.8%<br />
20.0%<br />
80.0%<br />
Sample Job Titles<br />
Held by Alumni within Category<br />
Research Assistant, Project Manager, Research<br />
Associate, School Psychologist<br />
Custodian, Gardener, Bank Cleaner, Environment<br />
Support Service, Rest Area Maintenance<br />
Pit Crew Keeper, Overnight Residential<br />
Counselor, Residential Assistant, Coordinator of<br />
Student Programming<br />
PC Technician, Trainer/Installer, Field Technician,<br />
Support Technician<br />
Food Production Worker, Chef, Busser/Support Staff<br />
Legal Assistant, Paralegal Specialist<br />
* There were several job categories not represented by any of <strong>the</strong> graduates: Protective Services; Farming, Fishing & Forestry;<br />
Construction & Extraction and Military Services.<br />
-113-<br />
Persistence, Graduation & Employment
Occupations of Alumni by Gender and Labor Categories (continued)<br />
Occupations of<br />
Working Alumni*<br />
Healthcare Support<br />
All<br />
One to Five<br />
Six to 15<br />
Male<br />
Female<br />
Transportation and Material<br />
Moving<br />
All<br />
One to Five<br />
Six to 15<br />
Male<br />
Female<br />
Job Title Not Specified<br />
All<br />
One to Five<br />
Six to 15<br />
Male<br />
Female<br />
Persistence, Graduation & Employment -114-<br />
%<br />
0.4%<br />
0.0%<br />
0.7%<br />
0.0%<br />
100.0%<br />
0.4%<br />
0.6%<br />
0.3%<br />
100.0%<br />
0.0%<br />
0.7%<br />
1.2%<br />
0.3%<br />
33.3%<br />
66.7%<br />
Sample Job Titles<br />
Held by Alumni within Category<br />
Massage Therapist, Support Professional<br />
Flight Controls Engineer, Assembly/Shipping<br />
* There were several job categories not represented by any of <strong>the</strong> graduates: Protective Services; Farming, Fishing & Forestry;<br />
Construction & Extraction and Military Services.
Ten-Year Labor Force Status and Earnings of Alumni<br />
The figures below represent <strong>the</strong> changing<br />
employment conditions of deaf and hard-ofhearing<br />
alumni from age 20 to 50. Data<br />
represented in <strong>the</strong>se figures are from a 2007 study<br />
with <strong>the</strong> Social Security Administration and Cornell<br />
University. Findings indicate that individual<br />
graduates benefit significantly from <strong>the</strong>ir education<br />
in terms of increased employability and wages<br />
over individuals who do not graduate, with <strong>the</strong><br />
magnitude of <strong>the</strong> benefit depending in part upon<br />
$40,000<br />
$35,000<br />
$30,000<br />
$25,000<br />
$20,000<br />
$15,000<br />
$10,000<br />
$5,000<br />
$0<br />
degree level attained. At age 50, deaf and<br />
hard-of-hearing bachelor’s degree graduates<br />
earn on average $6,021 more than those with<br />
sub-bachelor’s degrees; who in turn earn<br />
$3,996 more on average than those who withdraw;<br />
who earn close to $4,329 more than those who<br />
are not admitted.<br />
Increased earnings result in greater federal tax<br />
contributions.<br />
20 22 24 26 28 30 32 34 36 38 40 42 44 46 48 50<br />
Age<br />
NTID Associate NTID BS Lost Accepts Not Admitted Withdrawn<br />
Note: From a 2007 collaborative research study conducted with <strong>the</strong> Social Security Administration and<br />
Cornell University. To accomplish this, NTID <strong>for</strong>warded a data file with approximately 13,000 cases to<br />
<strong>the</strong> Social Security Administration. Six study groups were defined by <strong>the</strong> degree attainment variable: (1)<br />
<strong>Deaf</strong> and hard-of-hearing graduates who completed a bachelor’s degree from RIT; (2) Hearing<br />
graduates who completed a bachelor’s degree from RIT (not shown above); (3) <strong>Deaf</strong> and hard-ofhearing<br />
associate degree earners from NTID; (4) <strong>Deaf</strong> and hard-of-hearing individuals who attended<br />
NTID, but withdrew prior to receiving a degree; (5) <strong>Deaf</strong> and hard-of-hearing applicants who were<br />
accepted to NTID, but chose not to attend (Lost Accepts); and (6) <strong>Deaf</strong> and hard-of-hearing applicants to<br />
NTID who were denied admission.<br />
-115-<br />
Persistence, Graduation & Employment
Ten-Year Labor Force Status and Earnings of Alumni (continued)<br />
Recent research in collaboration with <strong>the</strong> Social<br />
Security Administration and Cornell University<br />
demonstrates <strong>the</strong> impact that an RIT/NTID<br />
education has in producing income <strong>for</strong> various<br />
categories of individuals. Baccalaureate graduates<br />
100%<br />
80%<br />
60%<br />
40%<br />
20%<br />
0%<br />
Persistence, Graduation & Employment -116-<br />
show <strong>the</strong> highest percentage generating income at<br />
all ages, followed by associate graduates.<br />
Withdrawn students and those not admitted have<br />
<strong>the</strong> lowest percentages, respectively, that are<br />
generating earnings.<br />
20 22 24 26 28 30 32 34 36 38 40 42 44 46 48 50<br />
Age<br />
NTID Associate NTID BS Lost Accepts Not Admitted Withdrawn<br />
Note: From a 2007 collaborative research study conducted with <strong>the</strong> Social Security Administration and<br />
Cornell University. To accomplish this, NTID <strong>for</strong>warded a data file with approximately 13,000 cases to<br />
<strong>the</strong> Social Security Administration. Six study groups were defined by <strong>the</strong> degree attainment variable: (1)<br />
<strong>Deaf</strong> and hard-of-hearing graduates who completed a bachelor’s degree from RIT; (2) Hearing<br />
graduates who completed a bachelor’s degree from RIT (not shown above); (3) <strong>Deaf</strong> and hard-ofhearing<br />
associate degree earners from NTID; (4) <strong>Deaf</strong> and hard-of-hearing individuals who attended<br />
NTID, but withdrew prior to receiving a degree; (5) <strong>Deaf</strong> and hard-of-hearing applicants who were<br />
accepted to NTID, but chose not to attend (Lost Accepts); and (6) <strong>Deaf</strong> and hard-of-hearing applicants to<br />
NTID who were denied admission.
Effect of College Graduation on Reduction in SSI and SSDI Payments<br />
Recent research in collaboration with <strong>the</strong> Social<br />
Security Administration and Cornell University<br />
shows <strong>the</strong> role that <strong>the</strong> completion of a college<br />
degree plays in reducing dependence on<br />
continuing federal support. These differences exist<br />
<strong>for</strong> both <strong>the</strong> Supplemental Security Income (SSI)<br />
program and <strong>the</strong> Social Security Disability<br />
Insurance (SSDI) program. Completing a degree<br />
from RIT/NTID reduces <strong>the</strong> probability that a deaf<br />
70%<br />
60%<br />
50%<br />
40%<br />
30%<br />
20%<br />
10%<br />
0%<br />
or hard-of-hearing person will collect SSI or SSDI.<br />
By age 50, 1 percent of graduates collected SSI,<br />
while, on average, 19 percent of individuals who<br />
withdrew or have been rejected <strong>for</strong> admission<br />
continued to participate in <strong>the</strong> SSI program. This<br />
reduction is especially noteworthy when one<br />
considers that 77.6 percent of students were<br />
receiving SSI benefits at age 19.<br />
20 22 24 26 28 30 32 34 36 38 40 42 44 46 48 50<br />
Age<br />
NTID Associate NTID BS Lost Accepts Not Admitted Withdrawn<br />
Note: From a 2007 collaborative research study conducted with <strong>the</strong> Social Security Administration and<br />
Cornell University. To accomplish this, NTID <strong>for</strong>warded a data file with approximately 13,000 cases to<br />
<strong>the</strong> Social Security Administration. Six study groups were defined by <strong>the</strong> degree attainment variable: (1)<br />
<strong>Deaf</strong> and hard-of-hearing graduates who completed a bachelor’s degree from RIT; (2) Hearing<br />
graduates who completed a bachelor’s degree from RIT (not shown above); (3) <strong>Deaf</strong> and hard-ofhearing<br />
associate degree earners from NTID; (4) <strong>Deaf</strong> and hard-of-hearing individuals who attended<br />
NTID, but withdrew prior to receiving a degree; (5) <strong>Deaf</strong> and hard-of-hearing applicants who were<br />
accepted to NTID, but chose not to attend (Lost Accepts); and (6) <strong>Deaf</strong> and hard-of-hearing applicants<br />
to NTID who were denied admission.<br />
-117-<br />
Persistence, Graduation & Employment
Effect of College Graduation on Reduction in SSI and SSDI Payments (continued)<br />
While virtually no one participated in <strong>the</strong> SSDI<br />
program when <strong>the</strong>y were students, by age 50 about<br />
22 percent of graduates with a bachelor’s and<br />
26.8 percent of grads with a sub-bachelor’s degree<br />
were receiving SSDI benefits. These rates compare<br />
favorably to 34 percent <strong>for</strong> non-graduates.<br />
70%<br />
60%<br />
50%<br />
40%<br />
30%<br />
20%<br />
10%<br />
0%<br />
20 22 24 26 28 30 32 34 36 38 40 42 44 46 48 50<br />
Persistence, Graduation & Employment -118-<br />
Age<br />
NTID Associate NTID BS Lost Accepts Not Admitted Withdrawn<br />
Note: From a 2007 collaborative research study conducted with <strong>the</strong> Social Security Administration and<br />
Cornell University. To accomplish this, NTID <strong>for</strong>warded a data file with approximately 13,000 cases to<br />
<strong>the</strong> Social Security Administration. Six study groups were defined by <strong>the</strong> degree attainment variable: (1)<br />
<strong>Deaf</strong> and hard-of-hearing graduates who completed a bachelor’s degree from RIT; (2) Hearing<br />
graduates who completed a bachelor’s degree from RIT (not shown above); (3) <strong>Deaf</strong> and hard-ofhearing<br />
associate degree earners from NTID; (4) <strong>Deaf</strong> and hard-of-hearing individuals who attended<br />
NTID, but withdrew prior to receiving a degree; (5) <strong>Deaf</strong> and hard-of-hearing applicants who were<br />
accepted to NTID, but chose not to attend (Lost Accepts); and (6) <strong>Deaf</strong> and hard-of-hearing applicants<br />
to NTID who were denied admission.
Diversity and Pluralism<br />
The Summer Vestibule Program is a 10-day experience that allows<br />
new students to explore careers, adjust to college and assess <strong>the</strong>ir<br />
competencies. For fall 2010, 119 new minority students enrolled,<br />
representing 34 percent of <strong>the</strong> incoming class.<br />
-119-<br />
Diversity and Pluralism<br />
Diversity and<br />
Pluralism<br />
<strong>National</strong> <strong>Technical</strong> <strong>Institute</strong> <strong>for</strong> <strong>the</strong> <strong>Deaf</strong>
Diversity and Pluralism Highlights<br />
Students<br />
Minority students who are deaf or hard-of-hearing are a greater proportion of NTID’s potential student<br />
pool than in <strong>the</strong> past. Students who are deaf or hard-of-hearing and from minority backgrounds represent<br />
nearly 40 percent of all deaf and hard-of-hearing 18- to 21-year-olds in <strong>the</strong> United States, as compared to<br />
29 percent in 1982. This demographic shift is reflected in <strong>the</strong> NTID student body as evidenced by <strong>the</strong><br />
growth in <strong>the</strong> percentage of minority students in our total student enrollment: 29 percent this year, as<br />
compared with an average of approximately 8 percent in <strong>the</strong> years prior to 1988.<br />
As of fall 2010, <strong>the</strong> number of U.S. deaf and hard-of-hearing minority students at NTID is at 359, one of<br />
<strong>the</strong> largest numbers in <strong>the</strong> past five years. FY 2010 highlights follow:<br />
• Thirty-four percent of <strong>the</strong> fall entering class are from minority groups. The percentage in <strong>the</strong> total<br />
student body is 29 percent, which is more than triple what it was 17 years ago.<br />
• Graduation rates <strong>for</strong> <strong>the</strong> current cohort groups were higher than last year <strong>for</strong> Hispanic students<br />
and lower <strong>for</strong> Asian students and Black or African-American students.<br />
• First-year persistence rates <strong>for</strong> <strong>the</strong> current cohort groups were slightly below <strong>the</strong> rates reported<br />
last year <strong>for</strong> Hispanic, Asian and Black or African-American students; however, those rates have<br />
increased considerably over <strong>the</strong> last five years.<br />
Faculty and Staff<br />
In addition to seeking faculty and staff members who are experts in <strong>the</strong>ir field and well versed in teaching<br />
techniques <strong>for</strong> deaf and hard-of-hearing students, NTID has undertaken recruitment and persistence<br />
strategies to attract and keep qualified minority, deaf and hard-of-hearing and disabled employees.<br />
NTID’s commitment to nurturing a multicultural community and providing role models <strong>for</strong> its increasingly<br />
diverse student body is positively reflected in <strong>the</strong> demographic composition of its faculty and staff.<br />
Of 52 employees from ethnic minority populations, 30 are Black or African-American, 10 are Hispanic<br />
and 12 are o<strong>the</strong>r minorities.<br />
Of our employees with disabilities, 110 out of <strong>the</strong> 113 are deaf or hard-of-hearing.<br />
Of <strong>the</strong> 165 employees who have disabilities or are members of a minority group, 145 are in executive,<br />
faculty or exempt positions. Note that some individuals count in more than one category.<br />
NTID continues to exercise a strong Affirmative Action posture with respect to external recruitment of<br />
faculty and staff, which is reflected in <strong>the</strong> fact that 27 percent of all hires over <strong>the</strong> past year were ei<strong>the</strong>r<br />
minority individuals or individuals who have a disability.<br />
NTID’s commitment to Affirmative Action and diversity has become an integral component of <strong>the</strong><br />
institute’s plan of work. Department heads and faculty and staff members are making concerted ef<strong>for</strong>ts to<br />
recruit, hire and retain individuals from <strong>the</strong>se categories.<br />
Diversity and Pluralism -120-
Diversity and Pluralism Philosophy<br />
We provide educational programs that prepare<br />
graduates to live and work in a changing global<br />
community and to enhance <strong>the</strong>ir lifelong learning.<br />
To succeed in <strong>the</strong> global workplace, students need<br />
to develop a solid understanding of <strong>the</strong> diversity of<br />
<strong>the</strong> workplace and possess <strong>the</strong> knowledge, skills<br />
and attributes to thrive in such an environment. The<br />
composition of <strong>the</strong> student body and of <strong>the</strong> faculty<br />
and staff who encounter students needs to reflect<br />
that diversity.<br />
Diversity has become a focus in higher education and, more significantly, in society at large. Diversity<br />
adds richness to our educational endeavors, particularly as <strong>the</strong> college strives <strong>for</strong> pluralism. Pluralism<br />
fosters a society in which members of diverse ethnic, racial, religious and o<strong>the</strong>r social groups are able to<br />
participate and develop individual traditions within <strong>the</strong> context of a community. It fosters <strong>the</strong> contributions<br />
and unique assets of each group and of each individual within any group, to become distinguishing<br />
features of <strong>the</strong> larger community.<br />
We prepare young people who are deaf or hard-of-hearing to be ready to enter a global community. With<br />
<strong>the</strong> continuing shifts in national and international demographics, fulfilling this commitment requires that<br />
students be prepared to enter a progressively more diverse society and workplace. Students need to<br />
develop <strong>the</strong> willingness, <strong>the</strong> knowledge and <strong>the</strong> skills to live and work in such an environment. This is<br />
critical if <strong>the</strong>y are to gain <strong>the</strong> understanding necessary to participate actively in society and contribute in<br />
meaningful ways to <strong>the</strong>ir own success and that of <strong>the</strong> community in which <strong>the</strong>y live.<br />
In addition to preparing students to enter society and <strong>the</strong> workplace, our academic environment must<br />
respond to <strong>the</strong> needs of people who are both deaf or hard-of-hearing and from minority backgrounds. Our<br />
commitment to recognize, celebrate and value cultural diversity and individual differences is grounded in<br />
<strong>the</strong> continuing ef<strong>for</strong>ts of our country to <strong>for</strong>ge a pluralistic society. It does not arise merely from political<br />
pressure or rest solely on public law; instead, it is based on a composite of our mission, on a changing<br />
student body and on <strong>the</strong> changing nature of <strong>the</strong> world.<br />
We believe an educational institution has a responsibility not only to reflect society, but also to lead in<br />
promoting positive change within that society. We have taken to heart that <strong>the</strong> NTID community must<br />
vigorously pursue a course of action that capitalizes on its diversity and continues to promote and nurture<br />
pluralism as a central <strong>the</strong>me.<br />
The significance of diversity is reflected in <strong>the</strong> statement below from RIT’s president in regard to faculty<br />
and staff.<br />
The following guidelines have been established <strong>for</strong> managers:<br />
To recruit, hire and promote <strong>for</strong> all positions without regard to race, color, national origin,<br />
sex, age, marital status, disability, sexual orientation, or status as a disabled veteran or<br />
veteran of <strong>the</strong> wars, including Vietnam.<br />
To make placement decisions based solely upon an individual’s qualifications<br />
<strong>for</strong> <strong>the</strong> position.<br />
To administer fairly and equally all personnel actions such as compensation, benefits,<br />
transfer and sponsored program activities.<br />
To provide reasonable accommodations whenever possible in an ef<strong>for</strong>t to<br />
advance employment <strong>for</strong> disabled individuals, including veterans.<br />
I have a strong personal commitment to equal employment opportunity and expect <strong>the</strong><br />
support of all faculty and staff in attaining <strong>the</strong> institute’s objective of a balanced and<br />
diverse work<strong>for</strong>ce.<br />
William W. Destler<br />
President, RIT<br />
-121-<br />
Diversity and Pluralism
Diversity and Pluralism Philosophy (continued)<br />
Finally, we provide a selected list of functions or activities below to reflect <strong>the</strong> importance of diversity and<br />
pluralism on <strong>the</strong> RIT campus.<br />
RIT has a Chief Diversity Officer, whose core mission is to advocate <strong>for</strong> and advance <strong>the</strong><br />
concerns and needs of <strong>the</strong> human, cultural and ethnic diversity of <strong>the</strong> RIT community.<br />
Persistent diligence is given to <strong>the</strong> specific needs of <strong>the</strong> underrepresented minority<br />
populations on campus. The goal is to increase partnerships that foster greater community<br />
understanding and appreciation <strong>for</strong> one ano<strong>the</strong>r.<br />
The President’s Commission on Pluralism and Inclusion, established in 1991, is a universitywide<br />
committee comprising RIT faculty, staff, students and administrators who regularly<br />
consult with RIT’s president on issues of diversity. The commission organizes both <strong>for</strong>mal and<br />
in<strong>for</strong>mal programs and dialogues about <strong>the</strong> multifaceted aspects of diversity—from celebrating<br />
cultural richness to developing interpersonal skills to interact better within <strong>the</strong> global village.<br />
Pluralism at RIT celebrates individual differences, as members within <strong>the</strong> RIT<br />
community work toge<strong>the</strong>r toward <strong>the</strong> common goal of creating a pluralistic and diverse<br />
community. It combines shared values that are incorporated into <strong>the</strong> vision and mission<br />
of <strong>the</strong> commission, resulting in an enriched RIT organizational culture. The commission<br />
promotes appreciation of diverse individuals in spite of differences in race, color, creed,<br />
religion, gender, age, national origin, marital status, sexual orientation, gender identity,<br />
gender expression, language use and physical ability. Respecting <strong>the</strong>se differences<br />
results in a positive change and becomes a key factor <strong>for</strong> promoting pluralism at RIT.<br />
Diversity and Pluralism -122-<br />
William W. Destler<br />
President, RIT<br />
NTID has three representatives on this commission, who also participate on <strong>the</strong> Community<br />
Affairs Committee, Diversity Leadership Committee, and Program Development Committee.<br />
The newsletter DIVERSITY PERSPECTIVES is published quarterly by <strong>the</strong> Chief Diversity<br />
Officer, in conjunction with <strong>the</strong> RIT President’s Commission on Pluralism and Inclusion.<br />
A Campus Week of Dialogue offers campus members an opportunity to acknowledge, better<br />
understand and offer resolution to <strong>the</strong> important challenges experienced by members of <strong>the</strong><br />
RIT community. This event engages faculty, staff and students in dialogue that ultimately<br />
heightens <strong>the</strong>ir sense of awareness and com<strong>for</strong>t levels, enabling constructive dialogue while<br />
addressing difficult issues related to diversity.<br />
Diversity training is offered regularly through <strong>the</strong> RIT Center <strong>for</strong> Professional Development.
Admissions Activity by Ethnicity<br />
Thirty-eight percent (250) of this year’s 923 deaf<br />
and hard-of-hearing undergraduate applicants<br />
were students from minority backgrounds. The<br />
fall 2010 entering class included 111 minority<br />
students, who represent 38 percent of <strong>the</strong> newly<br />
admitted students.<br />
FY 2011* Percent<br />
Total Applicants 923<br />
Non-Minority 413 62%<br />
Minority 250 38%<br />
Unknown 260<br />
Acceptances 505<br />
Non-Minority 248 61%<br />
Minority 156 39%<br />
Unknown 101<br />
Registrations 351<br />
Non-Minority 178 62%<br />
Minority 111 38%<br />
Unknown 62<br />
Rosemary, a Hospitality and<br />
Service Management student<br />
from Sterling Heights, Mich.,<br />
works a booth at NTID’s Applefest<br />
with fellow RIT student, Diego.<br />
* Figures do not include admissions activity in <strong>the</strong> ASL-English Interpretation program or <strong>the</strong> MSSE program. All percentages are of<br />
individuals <strong>for</strong> whom we have data.<br />
-123-<br />
Diversity and Pluralism
Ethnicity of Entering Students<br />
The FY 2011 entering class included 119 minority<br />
students, who represent 34 percent of <strong>the</strong> entire<br />
incoming class.<br />
FY 2011* Percent<br />
<strong>Deaf</strong> and Hard-of-Hearing Undergraduate and Graduate Students<br />
American Indian or Alaska Native 0 0.0%<br />
Asian 18 6.2%<br />
Black or African-American 35 12.1%<br />
Hispanic of Any Race 52 18.0%<br />
Native Hawaiian or O<strong>the</strong>r Pacific Islander 0 0.0%<br />
White 169 58.5%<br />
Two or More Races 6 2.1%<br />
Non-Resident Alien (International) 9 3.1%<br />
Unknown Race/Ethnicity 62<br />
Subtotal Minority <strong>Deaf</strong> and Hard-of-Hearing Undergraduate and<br />
Graduate Students<br />
111 38.4%<br />
Subtotal <strong>Deaf</strong> and Hard-of-Hearing Undergraduate and Graduate Students 351<br />
FY 2011<br />
Percent<br />
Minority<br />
O<strong>the</strong>r Enrollments<br />
ASL-English Interpretation 57 19.5%<br />
Master of Science in Secondary Education 27 0.0%<br />
Unknown Race/Ethnicity 24<br />
Total Minority Enrollments 119<br />
Total Enrollments 435<br />
Overall Percent Minority 34.1%<br />
* Beginning in AY 2010-11, <strong>the</strong> Department of Education requires that ethnic and racial in<strong>for</strong>mation be reported in a new way.<br />
Due to this change in how ethnic and racial in<strong>for</strong>mation is captured, historical references have been removed to avoid<br />
inaccurate comparisons.<br />
Diversity and Pluralism -124-
Ethnicity of Enrolled Students<br />
Minority enrollment at NTID has increased steadily from<br />
8 percent in FY 1988 to 29 percent in FY 2011, nearly<br />
four times what it was 23 years ago.<br />
Until FY 2000 <strong>the</strong> number of international students was<br />
limited to 10 percent by a federally mandated cap. As a<br />
result of <strong>the</strong> reauthorization of <strong>the</strong> Education of <strong>the</strong><br />
-125-<br />
<strong>Deaf</strong> Act in 1998, <strong>the</strong> cap on international students was<br />
increased to 15 percent. However, a significant<br />
decrease in support from Vocational Rehabilitation<br />
in Canada and limited resources of students from<br />
o<strong>the</strong>r countries have had a negative impact on<br />
international enrollment.<br />
FY 2011* Percent<br />
<strong>Deaf</strong> and Hard-of-Hearing Undergraduate and Graduate Students<br />
American Indian or Alaska Native 9 0.8%<br />
Asian 87 7.6%<br />
Black or African-American 126 11.0%<br />
Hispanic of Any Race 1<strong>31</strong> 11.4%<br />
Native Hawaiian or O<strong>the</strong>r Pacific Islander 0 0.0%<br />
White 747 65.2%<br />
Two or More Races 6 0.5%<br />
Non-Resident Alien (International) 40 3.5%<br />
Unknown Race/Ethnicity 157<br />
Subtotal Minority <strong>Deaf</strong> and Hard-of-Hearing Undergraduate and<br />
Graduate Students<br />
359 <strong>31</strong>.3%<br />
Subtotal <strong>Deaf</strong> and Hard-of-Hearing Undergraduate and Graduate Students 1,303<br />
FY 2011<br />
Percent<br />
Minority<br />
O<strong>the</strong>r Enrollments<br />
ASL-English Interpretation 147 13.7%<br />
Master of Science in Secondary Education** 71 10.3%<br />
Unknown Race/Ethnicity 36<br />
Total Minority Enrollments 382<br />
Total Enrollments 1,521<br />
Overall Percent Minority 28.8%<br />
* Beginning in AY 2010-11, <strong>the</strong> Department of Education requires that ethnic and racial in<strong>for</strong>mation be reported in a new way.<br />
Due to this change in how ethnic and racial in<strong>for</strong>mation is captured, historical references have been removed to avoid<br />
inaccurate comparisons.<br />
** Includes five non-matriculated students.<br />
Diversity and Pluralism
First-Year Student Persistence and Graduation Rates by Diversity Categories*<br />
NTID enrolls students with diverse backgrounds.<br />
This diversity has increased significantly during <strong>the</strong><br />
past decade with enrollment of increased numbers<br />
of ethnic minority and international students as<br />
summarized on <strong>the</strong> previous two pages of this<br />
report. However, <strong>the</strong>re are noticeable differences<br />
among <strong>the</strong> various groups in terms of persistence<br />
and graduation rates.<br />
Three-Year<br />
Entry Cohort<br />
First-Year Persistence Rates <strong>for</strong> Entering Students**<br />
Three-Year Moving Averages<br />
Black or African-<br />
American<br />
Asian<br />
Diversity and Pluralism -126-<br />
Hispanic of<br />
Any Race<br />
Non-Resident<br />
Alien (International)<br />
Non-<br />
Minority<br />
2002, 2003, 2004 59% 89% 65% 81% 70%<br />
2003, 2004, 2005 68% 86% 68% 84% 75%<br />
2004, 2005, 2006 78% 88% 77% 83% 75%<br />
2005, 2006, 2007 86% 88% 72% 88% 78%<br />
2006, 2007, 2008 85% 89% 76% 89% 78%<br />
2007, 2008, 2009 83% 86% 74% 92% 78%<br />
Three-Year<br />
Entry Cohort<br />
Black or African-<br />
American<br />
Graduation Rates After Seven Years**<br />
Three-Year Moving Averages<br />
Asian<br />
Hispanic of<br />
Any Race<br />
Non-Resident<br />
Alien (International)<br />
Non-<br />
Minority<br />
1996, 1997, 1998 37% 71% 33% 63% 50%<br />
1997, 1998, 1999 46% 74% 47% 65% 55%<br />
1998, 1999, 2000 53% 76% 43% 60% 57%<br />
1999, 2000, <strong>2001</strong> 57% 67% 50% 66% 56%<br />
2000, <strong>2001</strong>, 2002 60% 66% 51% 73% 62%<br />
<strong>2001</strong>, 2002, 2003 53% 60% 52% 76% 62%<br />
* Figures reported do not include students in <strong>the</strong> ASL-English Interpretation program or <strong>the</strong> Master of Science program in<br />
Secondary Education. Specific data <strong>for</strong> those two programs are included on separate pages <strong>for</strong> those programs.<br />
** Degree cohort analysis
Graduates by College and Program Areas: Minority Status<br />
This table shows minority student graduates in <strong>the</strong><br />
academic program areas.<br />
NTID<br />
Minority<br />
-127-<br />
Non-<br />
Minority<br />
FY 2010<br />
Number of Graduates<br />
Unknown<br />
Total<br />
Percentage<br />
of Total<br />
Graduates<br />
Career-Focused and Transfer<br />
Associate Degrees 38 74 11 123 40%<br />
ASL-English Interpretation * 26 * 33 11%<br />
Master of Science in Secondary Education * 12 * 18 6%<br />
O<strong>the</strong>r Colleges of RIT**<br />
College of Applied Science and Technology 19 39 5 63 21%<br />
College of Business 6 15 0 21 7%<br />
College of Computing and<br />
In<strong>for</strong>mation Sciences * 8 * 9 3%<br />
College of Engineering * * * 5 1%<br />
College of Imaging Arts and Sciences * 18 * 21 7%<br />
College of Liberal Arts * 6 * 8 3%<br />
College of Science * * * 5 1%<br />
Total*** 76 206 24 306 100%<br />
* Frequency counts small and not reported <strong>for</strong> confidentiality.<br />
** Includes bachelor’s and master’s degrees granted by <strong>the</strong> o<strong>the</strong>r colleges of RIT, as well as some sub-baccalaureate degrees.<br />
*** Totals include small counts shown as asterisks (*), which are not displayed because of confidentiality.<br />
Diversity and Pluralism
Affirmative Action Report: Faculty and Staff<br />
NTID continues to emphasize and encourage<br />
<strong>the</strong> hiring, promotion and persistence of women,<br />
minorities and individuals with disabilities.<br />
Appropriate representation in each category<br />
remains a priority <strong>for</strong> NTID, given <strong>the</strong> students<br />
Total<br />
Employees<br />
Female<br />
Diversity and Pluralism -128-<br />
FY 2010<br />
Black or<br />
African-<br />
American<br />
we serve and <strong>the</strong> ever-increasing ethnic diversity<br />
we are experiencing in <strong>the</strong> student body. In <strong>the</strong><br />
chart below, individuals may appear in more than<br />
one category. Minority status was unknown <strong>for</strong> four<br />
faculty and staff members.<br />
Hispanic<br />
of Any<br />
Race<br />
O<strong>the</strong>r<br />
Minority<br />
<strong>Deaf</strong> and<br />
Hard-of-<br />
Hearing<br />
O<strong>the</strong>r<br />
Disability<br />
Faculty* 203 100 12 ** 9 62 0<br />
Percent 49% 7% ** 4% <strong>31</strong>% 0%<br />
Exempt Staff* 130 72 9 ** ** 32 1<br />
Percent 55% 7% ** ** 25% 1%<br />
Executive/<br />
Administrative<br />
Manager* 51 18 ** ** ** 15 0<br />
Percent 35% ** ** ** 29% 0%<br />
Non-Exempt Staff<br />
C-Print ® 49 48 ** ** 0 0 0<br />
Percent 98% ** ** 0% 0% 0%<br />
Interpreter 127 112 5 ** ** 1 1<br />
Percent 88% 4% ** ** 1% 1%<br />
<strong>Technical</strong>/<br />
Clerical 89 78 6 ** ** 15 1<br />
Percent 88% 7% ** ** 17% 1%<br />
Total 598 410 33 15 17 110 3<br />
Percent 69% 17% 3% 3% 18% 1%<br />
* Of <strong>the</strong> 51 executive/administrative managers, 20 are included on <strong>the</strong> faculty line and <strong>31</strong> are included on <strong>the</strong> exempt staff line.<br />
There<strong>for</strong>e <strong>the</strong> numbers in <strong>the</strong> Executive/Administrative Manger row are not included in <strong>the</strong> column totals, since <strong>the</strong>y are already<br />
included on <strong>the</strong> faculty or exempt staff lines.<br />
** Frequency counts small and not reported <strong>for</strong> confidentiality.
Affirmative Action: Faculty and Staff Applicants<br />
RIT/NTID tracks minority status and gender of<br />
applicants via voluntary self-identification. A<br />
summary of those data are provided below.<br />
RIT/NTID does not solicit, track or maintain<br />
disability status on its applicants. Individuals may<br />
be counted in more than one category.<br />
Number of<br />
Positions<br />
Posted<br />
NTID Applicants <strong>for</strong> Posted Positions<br />
September 1, 2009 – August <strong>31</strong>, 2010<br />
Total<br />
Applicants<br />
Female<br />
-129-<br />
Black or<br />
African-<br />
American<br />
Number of Applicants by Category<br />
Hispanic<br />
of Any<br />
Race<br />
O<strong>the</strong>r<br />
Minority<br />
Unknown<br />
Faculty 19 157 64 14 2 22 9 65<br />
Exempt Staff 38 275 140 23 3 26 25 93<br />
Non-Exempt Staff* 26 609 506 61 18 28 35 64<br />
Total 83 1,041 710 98 23 76 69 222<br />
* Includes technical, clerical, C-Print ® captionists and interpreters.<br />
Diversity and Pluralism<br />
White<br />
Male
Affirmative Action: Faculty and Staff Hiring Results<br />
During FY 2010, individuals from an ethnic<br />
minority totaled 8 percent of all new hires,<br />
disabled individuals totaled 19 percent and<br />
women, 73 percent. Individuals may appear in<br />
more than one Affirmative Action category. Eight<br />
new hires were individuals of unknown ethnicity.<br />
Total New<br />
Employees<br />
Female<br />
Diversity and Pluralism -130-<br />
FY 2010<br />
Black or<br />
African-<br />
American<br />
Hispanic<br />
of Any<br />
Race<br />
O<strong>the</strong>r<br />
Minority<br />
<strong>Deaf</strong><br />
and<br />
Hard-of-<br />
Hearing<br />
O<strong>the</strong>r<br />
Disability<br />
Faculty 14 8 * 0 * 4 0<br />
62% * 0% * <strong>31</strong>% 0%<br />
Exempt Staff 15 7 * 0 * 5 0<br />
50% * 0% * 36% 0%<br />
Executive/<br />
Administrative<br />
Manager** 8 4 * 0 * 2 0<br />
50% * 0% * 25% 0%<br />
Non-Exempt Staff<br />
C-Print ® 6 6 * 0 * 0 0<br />
100% * 0% * 0% 0%<br />
Interpreter 8 8 * 0 * 0 0<br />
100% * 0% * 0% 0%<br />
<strong>Technical</strong>/Clerical 16 9 * 0 * 1 0<br />
82% * 0% * 10% 0%<br />
Total 59 38 2 0 2 10 0<br />
73% 4% 0% 4% 19% 0%<br />
* Frequency counts small and not reported <strong>for</strong> confidentiality.<br />
** These individuals are not included in <strong>the</strong> total of this column since <strong>the</strong>y are all included on <strong>the</strong> faculty or exempt staff lines.
Affirmative Action: Faculty and Staff Termination Results<br />
During FY 2010, 11 percent of terminations were<br />
individuals from ethnic minorities and 72 percent<br />
were women. Eight terminations were individuals<br />
of unknown ethnicity. In <strong>the</strong> chart below,<br />
individuals may appear in more than one<br />
Affirmative Action category.<br />
Total<br />
Terminated<br />
Employees<br />
Female<br />
FY 2010<br />
Black or<br />
African-<br />
American<br />
-1<strong>31</strong>-<br />
Hispanic<br />
of Any<br />
Race<br />
O<strong>the</strong>r<br />
Minority<br />
<strong>Deaf</strong><br />
and<br />
Hard-of-<br />
Hearing<br />
O<strong>the</strong>r<br />
Disability<br />
Faculty 14 5 * 0 * 6 0<br />
36% * 0% * 43% 0%<br />
Exempt Staff 13 8 * 0 * 3 0<br />
62% * 0% * 23% 0%<br />
Non-Exempt<br />
Staff** 26 25 * 0 * 1 0<br />
96% * 0% * 4% 0%<br />
Total 53 38 4 0 1 10 0<br />
72% 9% 0% 2% 19% 0%<br />
* Frequency counts small and not reported <strong>for</strong> confidentiality.<br />
** Includes technical, clerical, C-Print ® captionists and interpreters.<br />
Diversity and Pluralism
Innovation and Creativity<br />
The Imagine RIT: Innovation and Creativity Festival brought more<br />
than 32,000 visitors to campus. RideShare, created by NTID<br />
interpreter Ben Cavaletto, uses social networking and mapping tools<br />
to help students, faculty and staff locate each o<strong>the</strong>r and plan shared<br />
trips online.<br />
-133-<br />
Innovation and Creativity<br />
Innovation and<br />
Creativity<br />
<strong>National</strong> <strong>Technical</strong> <strong>Institute</strong> <strong>for</strong> <strong>the</strong> <strong>Deaf</strong>
Scholarship and Accomplishments<br />
Faculty Scholarship<br />
Tenured and tenure-track RIT/NTID faculty engage in scholarship as part of <strong>the</strong>ir plans of work. The<br />
product of scholarship is most obviously seen in terms of conference presentations, scholarly<br />
publications, artistic exhibitions and per<strong>for</strong>mances. In FY 2010, NTID faculty were principal investigators<br />
on a total of 18 grants, with $4,294,833 awarded in FY 2010 to support areas that include disciplinebased<br />
research, instructional development, STEM education, career development workshops,<br />
conferences, and new access technologies.<br />
During <strong>the</strong> 2009-2010 academic year, faculty gave presentations at more than 25 professional<br />
conferences, including <strong>the</strong> following:<br />
<strong>the</strong> International Congress on Education of <strong>the</strong> <strong>Deaf</strong> (ICED), Vancouver;<br />
<strong>the</strong> International Conference of Education, Research, and Innovation, Madrid, Spain;<br />
<strong>the</strong> International Mental Health and <strong>Deaf</strong>ness Conference, Buenos Aires, Argentina;<br />
<strong>the</strong> Instructional Technology and Education of <strong>the</strong> <strong>Deaf</strong> International Symposium,<br />
Rochester, N.Y.;<br />
<strong>Deaf</strong> Studies Today, Utah Valley, Utah;<br />
New York City <strong>Deaf</strong> Theater Festival;<br />
Sunstone Symposium, Salt Lake, Utah;<br />
American Sign Language Teachers Association (ASLTA), Phoenix, Ariz.;<br />
<strong>the</strong> New York State Engineering Technology Association Conference, Corning, N.Y.;<br />
Teachers of English to Speakers of O<strong>the</strong>r Languages (TESOL), Boston, Mass.;<br />
Sou<strong>the</strong>astern Regional TESOL, Atlanta, Ga.;<br />
<strong>the</strong> First Year Experience Conference, Denver, Colo.;<br />
American Public Health Association, Philadelphia, Pa.;<br />
American Heart Association, Palm Harbor, Fla.;<br />
Association on Higher Education and Disability, Denver, Colo.;<br />
Public Health Education-Prevention Research Centers Conference, Atlanta, Ga.;<br />
<strong>the</strong> Inter-Science of Learning Center Conference, Boston, Mass.;<br />
<strong>the</strong> Computer Science Education Conference, Milwaukee, Wis.;<br />
<strong>the</strong> AHEAD and PEPNet joint conference, Denver, Colo.;<br />
<strong>the</strong> American Psychological Society Conference, Boston, Mass.;<br />
<strong>National</strong> Registry of Interpreters of <strong>the</strong> <strong>Deaf</strong> Conference, Philadelphia, Pa.;<br />
American Popular Culture Association, Albuquerque, N.M.;<br />
Conference on College Composition and Communication, San Francisco, Calif.;<br />
<strong>the</strong> American Society of Electrical Engineering, Rochester, N.Y.;<br />
North East Modern Language Association, Boston, Mass.;<br />
Society <strong>for</strong> Disability Studies, Philadelphia, Pa.;<br />
Conference of <strong>the</strong> Society <strong>for</strong> <strong>the</strong> Interdisciplinary Study of Social Images,<br />
Colorado Springs, Colo.;<br />
College English Association, San Antonio, Texas;<br />
Association of Ma<strong>the</strong>matics Teachers (AMTRA), Rochester, N.Y.;<br />
MBAA International Conference, Chicago, Ill.;<br />
<strong>National</strong> Council of Teachers of Ma<strong>the</strong>matics Eastern Regional Conference, Boston, Mass.;<br />
Materials Research Society, Boston, Mass.;<br />
American Chemical Society <strong>National</strong> Meeting, San Francisco, Calif.;<br />
Health Literacy Annual Research Conference, Washington D.C.; and<br />
<strong>the</strong> American School <strong>for</strong> <strong>the</strong> <strong>Deaf</strong> Outreach Conference, Hart<strong>for</strong>d, Conn.<br />
Innovation and Creativity -134-
Scholarship and Accomplishments (continued)<br />
Faculty also gave workshops at: PEN International, Rochester, N.Y.; Teaching With Technology<br />
Symposium, Ithaca College; University of Louisville; Max Factor, Los Angeles; Bank of New York Mellon<br />
Foundation, Pittsburgh; Connecticut Bureau of Rehabilitation Services; Genesee Valley Region Registry<br />
of Interpreters <strong>for</strong> <strong>the</strong> <strong>Deaf</strong>; Louisiana Department of Education; Educational Interpreter’s Statewide<br />
Workshop, Wausau, Wis.; PaTTAN Training Center, Lancaster, Pa.; Finger Lakes Community College,<br />
N.Y.; Genesee Community College, N.Y.; University of Rochester; Bloomsburg University, Pa.;<br />
Prestonburg, Ky.; Richmond, Ky.; Reynolds Community College, Va.; Colorado School <strong>for</strong> <strong>the</strong> <strong>Deaf</strong> and<br />
Blind, Colo.; Canisius College, N.Y.; Alaska State School <strong>for</strong> <strong>the</strong> <strong>Deaf</strong>, Anchorage; Clarke School <strong>for</strong> <strong>the</strong><br />
<strong>Deaf</strong>, Mass.; Asheville Wordfest; and University of Virginia.<br />
In addition to presentations and workshops, faculty scholarship was also published in <strong>the</strong> <strong>for</strong>m of book<br />
chapters and articles in journals such as: American Annals of <strong>the</strong> <strong>Deaf</strong>; Language Learning; Applied<br />
Psycholinguistics; International Journal <strong>for</strong> <strong>the</strong> History of Ma<strong>the</strong>matics Education; Proceedings of <strong>the</strong><br />
<strong>National</strong> Academy of Sciences; Neuroimage; <strong>Deaf</strong> Studies Digital Journal; Dawn Sign Press; Ox<strong>for</strong>d<br />
Handbook of <strong>Deaf</strong> Studies, Language, and Education, Gallaudet University Press; Journal of <strong>Deaf</strong><br />
Studies and <strong>Deaf</strong> Education; Assessment Update; Reading in a Foreign Language; Language Learning;<br />
Educational Studies in Language and Literature; Volta Review; Journal of Media and Culture; South<br />
Atlantic Review; and o<strong>the</strong>rs.<br />
Faculty exhibited work at <strong>the</strong> Arts & Cultural Center <strong>for</strong> Greater Rochester; Genesee County Council of<br />
<strong>the</strong> Arts, Migrant Center; Gallery r; Ramon Santiago/Gallery 821; Memorial Art Gallery; The Little Theater<br />
Gallery; The Arena Art Group; Sonnenberg Gardens in Canandaigua, N.Y.; and <strong>the</strong> Mansfield (Ohio)<br />
ArtCenter. Faculty developed art and made donations to charitable organizations including <strong>the</strong> AL Sigl<br />
Center, Rochester Breast Cancer Awareness, American Cancer Society, Wilmot Cancer Center, and<br />
Benches on Parade 2010. One faculty member co-published The RIT Big Shot: A Commemorative<br />
Collection of Photographs.<br />
Faculty/Student Scholarship<br />
Increasingly, RIT/NTID faculty are collaborating with <strong>the</strong>ir students on scholarship projects. These<br />
projects may occur as part of courses required of students at every degree level, <strong>for</strong> example, at <strong>the</strong><br />
associate degree level, <strong>the</strong> capstone course, and at <strong>the</strong> graduate level. Faculty-student research may be<br />
<strong>the</strong> product of faculty working with small groups of students or of individual student-based projects.<br />
This year, representative capstone course projects included one related to Habitat <strong>for</strong> Humanity as well<br />
as various o<strong>the</strong>rs in <strong>the</strong> area of sustainability. A representative selection of scholarly projects undertaken<br />
by MSSE students includes: Behavior Management and Classroom Management, Teaching History with<br />
Online Reading Support, Itinerant Teachers: A Need <strong>for</strong> More Educational Training, The Bilingual<br />
Approach to Reading Comprehension, A Bridge to <strong>Deaf</strong> and Multicultural Art in <strong>the</strong> Art Curriculum,<br />
Teaching Ma<strong>the</strong>matics to <strong>Deaf</strong> Students with Autism and Tips <strong>for</strong> Teachers: A <strong>Deaf</strong>/Hoh Student in<br />
Our Classroom.<br />
A number of undergraduate and graduate students conducted research in <strong>the</strong> <strong>Deaf</strong> Studies Laboratory,<br />
Department of Research and Teacher Education. This research in cognition and neuropsychology was<br />
funded by <strong>the</strong> <strong>National</strong> Science Foundation, <strong>the</strong> <strong>National</strong> <strong>Institute</strong>s of Health and <strong>the</strong> U.S. Department of<br />
Education. Eight students contributed to <strong>the</strong> development of assessment instruments <strong>for</strong> American Sign<br />
Language and studies of visual attention, reading and executive function development in individuals who<br />
are deaf or hard-of-hearing.<br />
-135-<br />
Innovation and Creativity
Innovation and Creativity at NTID<br />
Under <strong>the</strong> leadership of RIT President William W.<br />
Destler, <strong>the</strong> university is increasing its emphasis on<br />
innovation and creativity, both in <strong>the</strong> curriculum and<br />
in o<strong>the</strong>r activities across campus. The sampling<br />
NTID/RIT Electric Bike Club<br />
Innovation and Creativity -136-<br />
of projects below reflects <strong>the</strong> innovative and<br />
creative activities underway within <strong>the</strong> <strong>National</strong><br />
<strong>Technical</strong> <strong>Institute</strong> <strong>for</strong> <strong>the</strong> <strong>Deaf</strong>.<br />
NTID and RIT students work toge<strong>the</strong>r to build light plug-in electric vehicles designed to incorporate<br />
battery, motor and controller innovations with zero point-of-use carbon emissions. Designs <strong>for</strong> a campus<br />
fleet of electric bicycles are being developed. Instrumentation <strong>for</strong> logging usage, efficiency, longevity and<br />
per<strong>for</strong>mance are included on <strong>the</strong> electric bicycles.<br />
Laboratory Science Technology (LST) Undergrad Research: Climate Change DOC/phenol<br />
An alarming trend in drinking water treatment is increasing levels of dissolved organic carbon (DOC) and<br />
its phenolic content (DOC/phenol). Both are known precursors to <strong>the</strong> <strong>for</strong>mation of disinfection byproducts,<br />
including <strong>the</strong> potentially carcinogenic trihalomethanes (THMs), upon chlorination drinking water treatment<br />
procedures. To this end, <strong>the</strong> qualitative and quantitative analysis of DOC/phenol in natural water is crucial<br />
to <strong>the</strong> development of mechanisms to assist in <strong>the</strong> improvement of accessibility to safe drinking water.<br />
This project utilizes fluorescence excitation-emission matrices (EEMs) with parallel factor analysis<br />
(PARAFAC) to monitor DOC and its phenolic group content <strong>for</strong> several different geographical water<br />
sources. EEM/PARAFAC techniques have been investigated as a screening tool <strong>for</strong> drinking water<br />
treatment, as well as a tool to characterize a water’s DOC profile. This study will inherently begin an<br />
active data collection campaign to study rising trends in DOC/phenol levels in natural waters that might be<br />
a function of climate change.<br />
LST Undergrad Research: Carcinogens in Cigarettes<br />
The analysis of smoke particulate matter was per<strong>for</strong>med on three different kinds of cigarettes. Cigarette<br />
smoke was generated using a custom-made smoking machine. Samples were collected on filter pads and<br />
run through a detailed extraction procedure be<strong>for</strong>e being analyzed by gas chromatography-mass<br />
spectrometry (GC-MS). The analytes of interest are seven suspected carcinogens/polyaromatic<br />
hydrocarbons and nicotine. The major developments in this research were <strong>the</strong> optimization of <strong>the</strong> GC-MS<br />
instrumentation and extraction procedure involving solid phase extraction-based techniques. This work<br />
will help researchers understand <strong>the</strong> deposition of carcinogens in <strong>the</strong> lungs as <strong>the</strong> result of smoking.<br />
LST Undergrad Research: Energy Transfer<br />
Understanding quenching mechanisms is crucial to <strong>the</strong> quantitative and qualitative utilization of<br />
fluorescence spectroscopy. In <strong>the</strong> presence of inner filtering and oxygen quenching, analysis of<br />
fluorescence data can be difficult without a proper understanding of <strong>the</strong>se quenching mechanisms. This<br />
project involved algorithms <strong>for</strong> <strong>the</strong> compensation of inner filter effects and techniques to remediate<br />
oxygen quenching as well as <strong>the</strong> development of a novel fiber optic-based system that simultaneously<br />
collects steady-state fluorescence, absorbance and fluorescence lifetime measurements. This instrument<br />
aids in <strong>the</strong> characterization of <strong>the</strong>se quenching mechanisms and moves toward a better understanding of<br />
proper protocols to <strong>the</strong> collection and analysis of fluorescence data.<br />
Digital Language Lab <strong>for</strong> Interpreting Instruction<br />
The NTID American Sign Language and Interpreting Education Department uses a state-of-<strong>the</strong>-art digital<br />
laboratory <strong>for</strong> ASL/English interpreting instruction. There are three multimedia labs with 10 stations in<br />
each. Each student station is equipped with a computer, camera, headset and microphone, and dual<br />
monitors. Each lab is equipped with two digital control racks that connect to a 2TB server, two ceilingmounted<br />
robotic video cameras, a microphone, speakers, a ceiling-mounted video projector, and a<br />
separate instructor’s station with room controls.
Innovation and Creativity at NTID (continued)<br />
Interpreting students use digital technology to record <strong>the</strong>ir interpreting between American Sign Language<br />
and spoken English. The labs allow <strong>the</strong>m to review <strong>the</strong>ir work easily and improve <strong>the</strong>ir interpreting skills.<br />
When <strong>the</strong>y are finished with an assignment, students can save <strong>the</strong>ir work to <strong>the</strong>ir own digital folder on <strong>the</strong><br />
server, or <strong>the</strong>y can save it to a USB drive. They also can drop <strong>the</strong>ir files into <strong>the</strong>ir instructor’s digital folder<br />
<strong>for</strong> assessment. The faculty have use of a digital feedback system in <strong>the</strong>ir offices that can record faculty<br />
comments, which are <strong>the</strong>n synched to <strong>the</strong> student's original file. The ability to digitally capture, store, and<br />
receive video and audio files on <strong>the</strong> network, enables students and faculty to assess interpreting work<br />
immediately. The system provides secure anytime, anywhere access to <strong>the</strong> files from any computer on<br />
<strong>the</strong> RIT/NTID network or from home.<br />
<strong>Deaf</strong> Initiative in Technology<br />
<strong>Deaf</strong> Initiative in Technology (DiiT) offers workshops that provide computer, graphic communication and<br />
business-based training <strong>for</strong> deaf and hard-of-hearing adults. Faculty members from NTID’s In<strong>for</strong>mation<br />
and Computing Studies, Arts and Imaging Studies, Engineering Studies, Business Studies and Liberal<br />
Studies Departments offered workshops on a wide range of topics during <strong>the</strong> 2009-2010 academic year.<br />
In addition to providing training <strong>for</strong> adults, <strong>the</strong> project supports professional development <strong>for</strong> faculty and<br />
curriculum development <strong>for</strong> NTID students. To date 675 deaf and hard-of-hearing individuals have<br />
attended 90 different DiiT workshops.<br />
Cochlear Implant Support<br />
The number of students at RIT/NTID with cochlear implants has grown exponentially, from 29 students in<br />
1999 to over 300 students in fall 2010. To accommodate <strong>the</strong> needs of <strong>the</strong>se students, in 2008 NTID<br />
added two additional individual sound-dampened <strong>the</strong>rapy rooms to <strong>the</strong> Cochlear Implant Center. The<br />
<strong>the</strong>rapy rooms contain six new computer stations equipped with innovative aural educational software<br />
programs and telecommunications equipment that students use to improve <strong>the</strong>ir spoken English<br />
language recognition.<br />
Distance Learning Advances<br />
Through a grant from The Sprint Foundation that was matched with internal funds, NTID has taken a<br />
major step in supporting distance learning <strong>for</strong> deaf and hard-of-hearing remote learners—those students<br />
who are not on campus. A classroom in NTID’s Learning Center was converted to The Sprint Relay<br />
Experimental Distance Learning/Access Demonstration Lab in summer 2007. The lab is being used as a<br />
beta testing site <strong>for</strong> adapting and evaluating alternative instructional and access technologies in support<br />
of remote learners who are deaf or hard-of-hearing. It also provides a <strong>for</strong>um <strong>for</strong> in<strong>for</strong>mation exchange<br />
among RIT/NTID faculty, students, instructional designers, technologists, researchers and access service<br />
providers. Projects have included <strong>the</strong> delivery of a joint Web Design course involving students at NTID<br />
and in Mumbai, India; joint credit-bearing course, <strong>Deaf</strong> Theatre History, involving students at NTID and at<br />
Gallaudet University; video-capturing of a math course, Integrated Algebra; and in-class exercises <strong>for</strong><br />
archiving and subsequent anytime, anywhere access by students outside of a classroom.<br />
The lab features desktop computers, wireless laptops, videoconferencing systems and a 3M Ideaboard—<br />
a wall-mounted, computer-based display, featuring network capabilities, supporting real-time interactions<br />
among remote and onsite learners. This distance-learning tool allows deaf and hard-of-hearing students<br />
from anywhere around <strong>the</strong> world to be part of one classroom.<br />
The innovative adaptation of current and emerging technology promises significant contributions in<br />
expanding conventional notions of where, how and with whom learning can happen.<br />
Engaging <strong>the</strong> Millennial Student<br />
Today’s students are technologically savvy because technology has always been a part of <strong>the</strong>ir lives—<br />
whe<strong>the</strong>r it’s surfing <strong>the</strong> Internet, instant messaging, texting or video gaming. Because students are<br />
heavily influenced by interactive technology, NTID instructors are finding new ways to integrate it into <strong>the</strong><br />
-137-<br />
Innovation and Creativity
Innovation and Creativity at NTID (continued)<br />
classroom using a Student Response System (SRS) known as ―clickers,‖ a small wireless unit much like a<br />
television remote control with a keypad of letters and numbers. Clickers allow students to respond in<br />
class by using <strong>the</strong> hand-held device that sends <strong>the</strong>ir in<strong>for</strong>mation to a receiver attached to <strong>the</strong> instructor’s<br />
computer. The computer records and displays student responses in real time. These wireless devices<br />
trans<strong>for</strong>m lectures into interactive learning experiences. Because <strong>the</strong> SRS gives <strong>the</strong> students a sense of<br />
anonymity, it can make <strong>the</strong>m more eager to respond and promotes active participation and learning.<br />
Instructors see <strong>the</strong> use of clickers generating enthusiasm that leads to greater student engagement and<br />
improved learning.<br />
Enhancing <strong>the</strong> Notetaking Support Process: Utilizing Graphic Notes and New Technologies<br />
In <strong>the</strong> past 40 years, notetaking has become an integral part of <strong>the</strong> support provided to deaf and<br />
hard‐of‐hearing students. RIT/NTID faculty and students have been experimenting with innovative<br />
enhancements to <strong>the</strong> traditional notetaking process that show promise <strong>for</strong> increasing <strong>the</strong> learning value of<br />
notetaking to deaf and hard of hearing students, as well as o<strong>the</strong>r students with special needs.<br />
Their experimentation includes alternative enriched notetaking graphics and collaborative support<br />
technologies that could lead to greater learner independence. Specific techniques include graphic support<br />
technologies (e.g., hand drawn, digital pens, and tablets), new speech‐to-text and text‐to‐speech<br />
technologies, digital graphic options (e.g., clipart), and digital camera and cell phone options.<br />
Innovative Teacher Education<br />
A Microteaching course was developed by faculty members in NTID’s Master of Science program in<br />
Secondary Education of Students who are <strong>Deaf</strong> or Hard-of-Hearing (MSSE), in cooperation with <strong>the</strong> NTID<br />
Per<strong>for</strong>ming Arts program, and with NTID’s Educational Design Resources Department and <strong>the</strong> NTID<br />
Learning Center providing technical support. The per<strong>for</strong>ming arts program provides four or five deaf<br />
actors who act out high school student behaviors in mock classroom settings. Two cameras capture both<br />
<strong>the</strong> MSSE teacher-candidate and <strong>the</strong> actors, and split screen videos are uploaded to <strong>the</strong> Web, so <strong>the</strong><br />
teacher-candidates can study and critique <strong>the</strong>ir own ef<strong>for</strong>ts.<br />
The actors model behavior that <strong>the</strong> teacher-candidates likely will face in a high school classroom setting:<br />
everything from dealing with medical issues, addressing students being unprepared <strong>for</strong> class or not<br />
understanding <strong>the</strong> class materials, handling students arguing or falling asleep in class, to boundary issues<br />
such as a student asking a teacher-candidate to <strong>the</strong> prom. The course helps teacher-candidates learn<br />
how to manage situations be<strong>for</strong>e <strong>the</strong>y face <strong>the</strong>m in <strong>the</strong> teaching world.<br />
Ano<strong>the</strong>r collaboration with <strong>the</strong> per<strong>for</strong>ming arts program involves <strong>the</strong> use of a ―time machine‖ to bring back<br />
several characters from deaf education history to speak to <strong>the</strong> teacher-candidates about <strong>the</strong>ir lives and<br />
work, and implications <strong>for</strong> teaching deaf and hard-of-hearing students today. Teacher-candidates are able<br />
to spend time with <strong>the</strong> likes of Anne Sullivan Macy or Edward Miner Gallaudet and ask <strong>the</strong>m about <strong>the</strong>ir<br />
experiences and perspectives.<br />
The need to provide teacher-candidates <strong>the</strong> opportunity to observe best practices of current teachers in<br />
<strong>the</strong> field resulted in <strong>the</strong> creation of ―VETFLIX‖—an online library of videos featuring veteran teachers in<br />
<strong>the</strong>ir classrooms. The teacher-candidates also are required to observe veteran teachers in live classroom<br />
situations and videoconferences are scheduled between <strong>the</strong>se seasoned professionals and teachercandidates<br />
to allow <strong>the</strong> free flow of ideas and strategies.<br />
Speech-to-Text Services<br />
C-Print ® is a real-time captioning system developed at NTID with support from external and internal<br />
funding. It’s an access service <strong>for</strong> students who benefit from a real-time display of English text more than<br />
from sign language interpreting. C-Print currently is used by hundreds of postsecondary and secondary<br />
programs across <strong>the</strong> nation that offer services to deaf students and also is used extensively within RIT to<br />
Innovation and Creativity -138-
Innovation and Creativity at NTID (continued)<br />
provide almost 19,000 hours of classroom service per academic year. The system allows captionists to<br />
transcribe to text what teachers and students say in class. Research continues, currently focusing on <strong>the</strong><br />
use of tablet PCs to allow <strong>the</strong> integration of graphical in<strong>for</strong>mation along with <strong>the</strong> text and <strong>the</strong> use of<br />
mobile devices to transmit captioning over a cellular network in non-traditional learning environments<br />
(i.e., Smartphones).<br />
Online Access Services Request System<br />
NTID has created a unique online Service Request and Assignment System <strong>for</strong> providing streamlined<br />
access to sign language interpreting and real-time captioning services <strong>for</strong> students and o<strong>the</strong>r requesters.<br />
NTID operates <strong>the</strong> largest sign language interpreting and speech-to-text service organization in <strong>the</strong><br />
world, including 127 sign language interpreters and 49 real-time captionists. In addition, technology is<br />
available that provides unique access services <strong>for</strong> vision-impaired students.<br />
Postsecondary Education Network-International (PEN-International)<br />
Created in <strong>2001</strong> through grants funded by The Nippon Foundation of Japan, PEN-International is a<br />
multinational partnership of colleges and universities worldwide. Its goal is to improve and expand<br />
postsecondary education <strong>for</strong> deaf and hard-of-hearing students around <strong>the</strong> world by sharing educational<br />
technology and conducting faculty development and training, particularly in developing countries.<br />
Center <strong>for</strong> Education Research Partnerships<br />
The Center <strong>for</strong> Education Research Partnerships works in research partnerships concerning development<br />
and learning among deaf and hard-of-hearing students across <strong>the</strong> lifespan and in various educational<br />
settings. Primary activities include <strong>the</strong> promotion of collaboration (both nationally and internationally),<br />
hosting workshops and building bridges from research to practice—all intended to optimize educational<br />
opportunities and success <strong>for</strong> students who are deaf or hard-of-hearing. This year saw two books<br />
published on educating deaf students and two more were accepted <strong>for</strong> publication (all by Ox<strong>for</strong>d<br />
University Press). There are currently collaborations with over a dozen universities and organizations in<br />
five countries. In addition, CERP members edit two book series and <strong>the</strong> leading international journal in<br />
deaf education (according to impact factors and subscriptions).<br />
Center on Access Technology<br />
The Center on Access Technology investigates, evaluates and reports on <strong>the</strong> most effective use of<br />
access technologies to accelerate <strong>the</strong> widespread implementation of best practices within deaf education<br />
at <strong>the</strong> postsecondary level. The center’s four areas of focus include: classroom access technologies,<br />
mobile technologies, audio and sound technologies of interest to hard-of-hearing persons, and training<br />
and evaluation services.<br />
CAT Innovation Lab<br />
The NTID Center on Access Technology Innovation Laboratory (CAT Lab), a first-of-its-kind initiative,<br />
provides a place <strong>for</strong> students to get involved in <strong>the</strong> innovation process. The CAT Lab is located on <strong>the</strong><br />
first floor of NTID’s Lyndon B. Johnson Hall, bringing toge<strong>the</strong>r faculty and associate degree-level deaf and<br />
hard-of-hearing students to collaborate on multidisciplinary projects related to developing and adapting<br />
access and instructional technologies, health care technologies and services, and more<br />
(http://www.rit.edu/ntid/cat/catlab).<br />
An Investigation of Cisco Technologies and Access Solutions<br />
The Silicon Valley Community Foundation, following <strong>the</strong> recommendation of <strong>the</strong> Cisco Accessibility Team,<br />
granted CAT a $100,000 award to consider <strong>the</strong> application and adaptation of <strong>the</strong> ways in which Cisco<br />
products can benefit communication access <strong>for</strong> deaf and hard-of-hearing individuals. The three research<br />
strands will examine and provide recommendations related to 911-411-211 telephone response systems;<br />
-139-<br />
Innovation and Creativity
Innovation and Creativity at NTID (continued)<br />
evaluate possible use of avatars to enhance direct communication support <strong>for</strong> deaf and hard-of-hearing<br />
users; and evaluate Cisco TelePresence technologies <strong>for</strong> classroom and remote communication <strong>for</strong> deaf<br />
and hard-of-hearing users.<br />
Technology Symposium<br />
NTID co-hosted, with The Nippon Foundation of Japan and PEN-International, its sixth international<br />
symposium, Technology and <strong>Deaf</strong> Education: Exploring Instructional and Access Technologies, in<br />
June 2010 (http://www.rit.edu/ntid/vp/techsym/). The primary goal of <strong>the</strong> symposium was to provide a<br />
<strong>for</strong>um <strong>for</strong> educators supporting deaf and hard-of-hearing students to disseminate in<strong>for</strong>mation relative to<br />
current and future innovations and developments in <strong>the</strong> use of educational media and technology within<br />
<strong>the</strong> teaching and learning process. The symposium consisted of two plenary addresses, 64 <strong>for</strong>mal<br />
concurrent presentations, 28 poster sessions, and 11 commercial exhibits. The program was designed to<br />
cover a wide range of topics addressing current issues and solutions in both educational and access<br />
technologies at both <strong>the</strong> Pre-K-12 and postsecondary levels. Presentation topics included, among o<strong>the</strong>rs:<br />
Visual Stories of <strong>Deaf</strong>hood<br />
Using Distance Learning Tools to Connect Students, Parents, and Staff<br />
Enhancing <strong>the</strong> Notetaking Support Process: Utilizing Graphic Notes and New Technologies<br />
Using <strong>the</strong> NCES Data Analysis System (DAS) to Answer Questions Posed by Constituents<br />
Second Life ® as a Learning Tool<br />
Structured Online Academic Reading (SOAR): Enhancing Reading Comprehension and Learning<br />
Through Embedded Definitions, Pictures, Videos and Questions<br />
In Our Hands: The Future of Translation of Frozen Texts to Sign Language<br />
English Splash! A Teaching English Online Resource<br />
A total of 289 teachers, administrators, technologists and researchers representing 17 countries attended.<br />
This symposium, <strong>the</strong> largest to date, marked <strong>the</strong> 10 th anniversary of PEN-International. Sixty of PEN-<br />
International’s network partners, representing all 18 partner and affiliate institutions, participated in <strong>the</strong><br />
conference by presenting 18 concurrent sessions and four poster sessions.<br />
Innovation Forum<br />
In April 2010, NTID held its first<br />
Innovation Forum, with more than 450<br />
students, faculty, staff, and community<br />
members in attendance. The full-day<br />
event was intended to generate<br />
innovative ideas <strong>for</strong> implementing<br />
Strategic Decisions 2020 and<br />
encouraging thinking about ways to<br />
address some of <strong>the</strong> challenges ahead<br />
<strong>for</strong> <strong>the</strong> institute. Presentations were<br />
given on computer-generated poetry;<br />
<strong>the</strong> <strong>Deaf</strong> Culture Centre, <strong>the</strong> first<br />
quadra-lingual museum; nanoscience<br />
and nanotechnology; closed-captioned<br />
video accessible tours; captioning <strong>for</strong> mobile learning situations; and more.<br />
NTID Associate Professor of Cultural and Creative Studies Thomas Warfield, seen here, gave a<br />
presentation on Per<strong>for</strong>ming Arts – Partnerships in Innovation and Creativity. The <strong>for</strong>um helped inspire<br />
92 proposals to <strong>the</strong> NTID Innovation Fund <strong>for</strong> possible implementation. Collectively, <strong>the</strong> proposals are a<br />
result of collaborations between 347 faculty and staff and 262 students.<br />
Innovation and Creativity -140-
Innovation and Creativity at NTID (continued)<br />
Showcasing <strong>Deaf</strong> Artists<br />
A team of NTID faculty and staff developed a website that showcases and promotes <strong>the</strong> works of deaf<br />
and hard-of-hearing artists (www.rit.edu/deafartists). The site features art and biographical in<strong>for</strong>mation on<br />
more than 100 professional deaf artists from around <strong>the</strong> world as well as streaming videos and articles<br />
related to deaf artists and deaf art. Also included on <strong>the</strong> site are <strong>the</strong> self portraits of a group of RIT/NTID<br />
students, along with video and/or written descriptions.<br />
Preserving <strong>Deaf</strong> History<br />
The experiences of deaf people during World War II are captured in a website developed by a team of<br />
NTID faculty and staff (www.rit.edu/deafww2). Designed <strong>for</strong> students, teachers, scholars, researchers and<br />
historians, <strong>the</strong> site features articles, scripts, video clips, testimonies, artwork, books and links to related<br />
sites. Also included is an award-winning NTID documentary, Exodus: A <strong>Deaf</strong> Jewish Family Escapes <strong>the</strong><br />
Holocaust and a new documentary, Worry: A Jewish <strong>Deaf</strong>-Blind Survivor Shares Her Story.<br />
-141-<br />
Innovation and Creativity
Imagine RIT: Innovation and Creativity Festival<br />
Innovation and creativity found full expression on<br />
<strong>the</strong> RIT campus in May 2010, when <strong>the</strong> university<br />
held its third-annual Imagine RIT: Innovation and<br />
Creativity Festival. The event showcased RIT’s<br />
unique blend of technology and <strong>the</strong> arts.<br />
More than 32,000 people came to campus <strong>for</strong> Imagine RIT, which featured more than 300 exhibits<br />
highlighting <strong>the</strong> work of students, faculty and staff, who proudly displayed examples of green technology,<br />
new ideas <strong>for</strong> products and services, creative arts and crafts and groundbreaking research—all<br />
demonstrating <strong>the</strong> innovative thinking and creative spirit and energy that are uniquely RIT and that have<br />
shaped RIT President William W. Destler’s vision of RIT as <strong>the</strong> nation’s first ―innovation university.‖ O<strong>the</strong>r<br />
examples of NTID participation follow.<br />
Festival goers learned about NTID Laboratory Science Technology<br />
students’ research related to <strong>the</strong> carcinogens in cigarettes and<br />
improving accessibility to safe drinking water.<br />
Visitors enjoyed a demonstration of distance-learning and access<br />
technologies that allow remote participants to interact using video,<br />
audio and texting communication supported by captions and signlanguage<br />
interpreters.<br />
The NTID Electric Bike Club demonstrated its fleet of electric<br />
bicycles designed to incorporate battery, motor and controller<br />
innovations with zero point-of-use carbon emissions.<br />
A C-Print ® software exhibit showcased applications <strong>for</strong> smartphones and tablet PCs, which provide<br />
captions that deaf and hard-of-hearing students use to understand communication in classrooms and<br />
o<strong>the</strong>r settings.<br />
Festival attendees had <strong>the</strong> opportunity to learn about American Sign Language and <strong>Deaf</strong> culture and<br />
received tips <strong>for</strong> communicating with deaf people.<br />
Visitors saw a PDA/telephone notification system that works with a cell phone or pager to transmit<br />
electronic signals to a bed shaker or lamp to awaken a deaf person.<br />
NTID provided sign language interpreting support <strong>for</strong> <strong>the</strong> festival to ensure that <strong>the</strong> event was<br />
accessible to deaf and hard-of-hearing attendees.<br />
NTID Per<strong>for</strong>ming Arts has a <strong>for</strong>mal<br />
connection with RIT’s School of<br />
Film and Animation that provides a<br />
<strong>the</strong>ater track within <strong>the</strong>ir BFA<br />
program. Seen here are NTID<br />
students participating in a<br />
per<strong>for</strong>mance at Imagine RIT.<br />
Innovation and Creativity -142-
Intellectual Property: Licensed Products, Patents and Inventions<br />
NTID products are categorized into two groups.<br />
Those products developed be<strong>for</strong>e <strong>the</strong> October<br />
1997 RIT Intellectual Property Policy was<br />
implemented are unlicensed products. Those<br />
products developed after RIT implemented <strong>the</strong><br />
policy are licensed products, and <strong>the</strong> sales revenue<br />
is shared by <strong>the</strong> creator(s) of <strong>the</strong> products and<br />
NTID per <strong>the</strong> requirements of <strong>the</strong> policy.<br />
Unlicensed Products<br />
Cumulative Trauma Disorder (manual and training materials)<br />
Distributed through NTID Marketing Communications<br />
From Dream to Reality (NTID’s history book)<br />
Distributed through NTID Marketing Communications<br />
All materials are copyrighted to Rochester <strong>Institute</strong><br />
of Technology and are available through a variety<br />
of vendors. Below is a summary of <strong>the</strong> products in<br />
both categories and distribution in<strong>for</strong>mation.<br />
We have no patents and none are in process.<br />
There are no invention disclosures at this time.<br />
<strong>Technical</strong> Signs (videos and manuals)<br />
Distributed through ADCO Hearing Products, Butte Publications, Harris Communications and NTID<br />
Marketing Communications<br />
Let’s Communicate (brochure)<br />
Distributed through NTID Marketing Communications<br />
Tips <strong>for</strong> Communicating (brochure)<br />
Distributed through NTID Marketing Communications<br />
Project Access Workshop Planner’s Guide<br />
Distributed through NTID Marketing Communications<br />
Licensed Products<br />
Attention Deficit Scales <strong>for</strong> Adults - Sign Language Version<br />
Distributed through NTID Marketing Communications<br />
ASL at Work<br />
Distributed by Dawn Sign Press<br />
ASL Dictionary and Inflection Guide (CD)<br />
Distributed through Harris Communications, HearMore, Captioned Media Program, various college<br />
bookstores and NTID Marketing Communications<br />
ASL Dictionary and Inflection Guide (online subscription)<br />
Order online at www.ntid.rit.edu/dig<br />
C-Print ® Pro Software and C-Print ® online training<br />
Distributed through NTID College Operations<br />
Educational Interpreting (DVDs and companion booklet)<br />
Distributed through Harris Communications, Butte Publications and NTID Marketing Communications<br />
Interpreter Discourse (CDs)<br />
Distributed through Barnes & Noble @ RIT, Dawn Sign Press and NTID Marketing Communications<br />
-143-<br />
Innovation and Creativity
Intellectual Property (continued)<br />
NTID Speechreading (DVD and supplementary materials)<br />
Distributed through AUDiTEC<br />
Processing Skills (CDs)<br />
Distributed through Barnes & Noble @ RIT and NTID Marketing Communications<br />
Processing Skills Development (ASL texts)<br />
Distributed through Barnes & Noble @ RIT and NTID Marketing Communications<br />
The Heart of <strong>the</strong> Hydrogen Jukebox (DVD)<br />
Distributed through NTID Marketing Communications<br />
Innovation and Creativity -144-
Research<br />
E. William Clymer, NTID associate professor and interim director of<br />
<strong>the</strong> Center on Access Technology, is seen here presenting at <strong>the</strong><br />
international symposium Technology and <strong>Deaf</strong> Education: Exploring<br />
Instructional and Access Technologies, held at NTID in June 2010.<br />
-145-<br />
Research<br />
Research<br />
<strong>National</strong> <strong>Technical</strong> <strong>Institute</strong> <strong>for</strong> <strong>the</strong> <strong>Deaf</strong>
Research Overview<br />
NTID Research Agenda<br />
NTID determines topics <strong>for</strong> research on <strong>the</strong> basis of a research agenda and priorities derived from a<br />
variety of sources in <strong>the</strong> college and in <strong>the</strong> field, including <strong>the</strong> NTID <strong>National</strong> Advisory Group and <strong>the</strong><br />
Department of Education. NTID researchers conduct ongoing programmatic research, as well as special<br />
institutional research projects reflecting institute priorities and per<strong>for</strong>mance indicators from <strong>the</strong><br />
Department of Education. As a result of <strong>the</strong> new priorities laid out in Strategic Decisions 2020,<br />
programmatic research projects will fall into four categories:<br />
1. Teaching and Learning<br />
2. Communication<br />
3. Technology, Access, and Support Services<br />
4. Employment and Adaptability to Social Changes and <strong>the</strong> Global Workplace<br />
As required by <strong>the</strong> Education of <strong>the</strong> <strong>Deaf</strong> Act (2008), NTID regularly solicits public input on <strong>the</strong> institute’s<br />
research priorities through its research websites and publications. The total number of page views <strong>for</strong> <strong>the</strong><br />
research units <strong>for</strong> <strong>the</strong> year was 32,166. The research publications that solicited input were NTID<br />
Research Bulletin, NTID Papers and Publications, and Implications of NTID Research.<br />
NTID Research Units<br />
The Department of Research and Teacher Education (www.ntid.rit.edu/research) has as its mission<br />
<strong>the</strong> improvement of <strong>the</strong> lives of deaf and hard-of-hearing people through research than can be<br />
applied in <strong>the</strong> classroom, workplace and society. We recognize that collaboration across<br />
departments, institutions and disciplines is key to fulfilling this mission, and we welcome <strong>the</strong><br />
opportunity to work with o<strong>the</strong>rs in <strong>the</strong> discovery of new knowledge and its application to practice.<br />
In FY 2010, 18 research articles and books were published; 53 external presentations and workshops<br />
were given; and nine grant proposals were submitted. Internally, five reports and 20 presentations<br />
were prepared and offered.<br />
The Center on Access Technology (CAT) addresses <strong>the</strong> challenge of utilizing, developing and/or<br />
adapting new technologies <strong>for</strong> use by people who are deaf or hard-of-hearing to improve access to<br />
personal communication within educational environments, social settings and <strong>the</strong> workplace<br />
(www.rit.edu/ntid/cat). CAT was established in March 2006 to address <strong>the</strong> challenges of utilizing or<br />
adapting new technologies <strong>for</strong> use in postsecondary education. CAT is charged to investigate,<br />
evaluate and report on <strong>the</strong> most effective use of access technologies and to train individuals to<br />
accelerate <strong>the</strong> implementation of best practices within postsecondary deaf education. The center’s<br />
main strands of research include cyber-infrastructure and provision of remote services, classroom<br />
access technologies, mobile and personal communication technologies, training and evaluation<br />
services, and audio technologies of particular interest to hard-of-hearing persons.<br />
The Center <strong>for</strong> Education Research Partnerships (CERP) is charged with establishing and joining<br />
research partnerships concerning development and learning among deaf and hard-of-hearing<br />
students across <strong>the</strong> lifespan and in various educational settings (www.rit.edu/ntid/cerp/home).<br />
Primary activities include promotion of related collaboration among individuals, educational<br />
institutions and organizations, both nationally and internationally. These and o<strong>the</strong>r activities focus on<br />
bridging research and practice to optimize educational opportunities and success <strong>for</strong> students who<br />
are deaf or hard-of-hearing. This notion of serving as a ―collaborator‖ and an ―incubator‖ <strong>for</strong> new ideas<br />
lies at <strong>the</strong> heart of <strong>the</strong> center.<br />
This year, CERP grew by more than 50 percent, from six to 10 people. The addition of an associate<br />
director at <strong>the</strong> end of <strong>the</strong> year is intended particularly to enhance outreach, external contracts<br />
and dissemination.<br />
Research -146-
Research Overview (continued)<br />
CERP was established to contribute to <strong>the</strong> education of deaf and hard-of-hearing students of all ages<br />
through <strong>the</strong> sharing of findings and expertise with o<strong>the</strong>rs. The success of this initiative is evidenced in<br />
CERP members making 19 invited presentations this academic year (18 <strong>for</strong> external organizations).<br />
Beyond this sharing of knowledge, <strong>the</strong>se ef<strong>for</strong>ts bring greater visibility to NTID/CERP and RIT, thus<br />
creating additional opportunities <strong>for</strong> both collaborations and funding. This year, CERP has had to turn<br />
down more such opportunities than it could accept. CERP responded to over 300 requests <strong>for</strong><br />
in<strong>for</strong>mation and/or assistance. Over this past academic year, CERP members have published (or<br />
have in press) seven peer-reviewed journal articles and seven chapters. Two books were published<br />
(one written, one edited), two are in press (one written, one edited), and ano<strong>the</strong>r is under contract.<br />
The center was awarded more than $1 million in grants from <strong>the</strong> <strong>National</strong> Science Foundation (two<br />
grants) and <strong>the</strong> <strong>National</strong> <strong>Institute</strong> <strong>for</strong> Child Health and Human Development (one grant, with <strong>the</strong><br />
University of Aberdeen) to support CERP research activities. In addition, a grant from <strong>the</strong> Nuffield<br />
Foundation and <strong>the</strong> United Kingdom is supporting ano<strong>the</strong>r CERP project in collaboration with <strong>the</strong><br />
University of Edinburgh. Three federal grant proposals are pending.<br />
Throughout higher education, institutional research is conducted to support institutional planning,<br />
policy in<strong>for</strong>mation, decision-making and outcomes reporting. At NTID, institutional research involves<br />
preparing periodic reports <strong>for</strong> institutional units, state and federal agencies, accrediting bodies and<br />
o<strong>the</strong>r external groups, including monitoring and analyzing reporting requirements, and<br />
auditing/verifying data. Assistance also is provided to institutional users in analyzing data with<br />
regard to program trends and effectiveness, and personnel-related issues.<br />
Students ga<strong>the</strong>r in <strong>the</strong> Joseph F.<br />
and Helen C. Dyer Arts Center<br />
to discuss <strong>the</strong> ideas and<br />
research presented at NTID’s<br />
Innovation Forum.<br />
-147-<br />
Research
Examples of Research Activities<br />
1. Teaching and Learning<br />
Expansion of In<strong>for</strong>mation Source <strong>for</strong> Educators and Parents of <strong>Deaf</strong> Children. Last year, with a grant<br />
from <strong>the</strong> Daisy Marquis Jones Foundation, CERP created <strong>the</strong> Raising and Educating a <strong>Deaf</strong> Child<br />
website (www.ntid.rit.edu/educatingdeafchildren also available at www.educatingdeafchildren.org,<br />
.com, .net and .info domains). Utilizing center expertise and collaborating with colleagues around <strong>the</strong><br />
world, <strong>the</strong> site responds to questions with research-based in<strong>for</strong>mation and references. This year, with<br />
a grant from <strong>the</strong> Sorenson Foundation and support from Ox<strong>for</strong>d University Press, <strong>the</strong> site was<br />
expanded to be able to field video questions (i.e., asked and answered in sign language). A proposal<br />
is pending at a private foundation to add additional capabilities to <strong>the</strong> site. Over <strong>the</strong> past year, <strong>the</strong> site<br />
has averaged more than 3,000 hits per month.<br />
CERP Research Findings. A center <strong>for</strong> education research partnerships obviously has, at its heart,<br />
research. Easily <strong>the</strong> most important accomplishments this year are our new and exciting findings<br />
concerning <strong>the</strong> cognitive foundations of learning by deaf and hard-of-hearing students and ways of<br />
potentially ―leveling <strong>the</strong> playing field‖ <strong>for</strong> <strong>the</strong>m in educational settings. Our results have implications<br />
<strong>for</strong> K-12 programming as well as college-level settings; indeed, <strong>the</strong>y pertain to life-long learning by<br />
deaf, hard-of-hearing, and hearing students of all ages. As noted on our website, CERP<br />
dissemination ef<strong>for</strong>ts (invited presentations and publications) and ongoing research seek nothing<br />
less than ―simply to change <strong>the</strong> world through better understanding and improving <strong>the</strong> education of<br />
deaf students.‖<br />
Decoding Strategies Used by <strong>Deaf</strong> and Hard-of-Hearing College Readers: A Miscue Analysis Part 4.<br />
To date, investigations of reading by deaf and hard-of-hearing students have focused mainly on<br />
strategies related to comprehension. However, at its most fundamental level, reading depends on<br />
being able to accurately decode <strong>the</strong> words on <strong>the</strong> page. Our hypo<strong>the</strong>sis is that this ability may not<br />
have been fully mastered by some deaf readers at <strong>the</strong> college level and represents an aspect of <strong>the</strong><br />
reading process that has not been studied in this group. After analyzing <strong>the</strong> miscues of 10 collegeage<br />
readers and <strong>the</strong> results of o<strong>the</strong>r comprehension-related tasks, we concluded that comprehension<br />
of basic grade school-level passages depended on <strong>the</strong> ability to recognize and comprehend key<br />
words and phrases in <strong>the</strong>se texts. We also concluded that <strong>the</strong>se diagnostic procedures provided<br />
useful in<strong>for</strong>mation about <strong>the</strong> reading abilities and strategies of each reader that had implications <strong>for</strong><br />
designing more effective interventions. The report of this study is in press with <strong>the</strong> Journal of <strong>Deaf</strong><br />
Studies and <strong>Deaf</strong> Education.<br />
<strong>Deaf</strong> College Students’ Knowledge of English Verbs and Associated Argument Realizations and<br />
Event Structures. A grant proposal was developed and submitted to <strong>the</strong> <strong>National</strong> Science Foundation<br />
focusing on deaf college students’ knowledge of English verbs and <strong>the</strong>ir associated argument<br />
realizations and event structures. Lexical knowledge of a verb, <strong>the</strong> core of a sentence’s proposition,<br />
entails knowledge of <strong>the</strong> verb’s argument patterns (subject, objects, and prepositional phrases), <strong>the</strong><br />
semantic roles associated with its arguments (e.g., agent, instrument, <strong>the</strong>me), and <strong>the</strong> types of<br />
linguistic events (activities, accomplishments, achievements) in which <strong>the</strong> verb can participate. The<br />
research will examine deaf students’ knowledge of subtle properties of sentences containing different<br />
kinds of English verbs relative to <strong>the</strong> knowledge of <strong>the</strong>ir hearing English-speaking peers. Hypo<strong>the</strong>ses<br />
are <strong>for</strong>mulated in <strong>the</strong> context of established linguistic <strong>the</strong>ories of lexical knowledge and widely<br />
recognized lexical constructs. Hypo<strong>the</strong>ses will be tested in specially constructed sentence<br />
acceptability tasks. The focus on deaf college students is motivated by <strong>the</strong> educational challenges<br />
that deaf learners typically face as a result of acquiring English under conditions of severely restricted<br />
access to spoken language input. Discovering <strong>the</strong> details of such knowledge might define domainspecific<br />
English knowledge that has been undetectable by gross measures such as reading level<br />
assessment and that could contribute to better understanding <strong>the</strong> variables associated with deaf<br />
students’ persistence and success.<br />
Research -148-
Examples of Research Activities (continued)<br />
Continuation of Survive and Thrive Project: A Study of a Sample of <strong>the</strong> 2007, 2008, and 2009 Cohorts<br />
of Entering NTID Students. This study identified factors that influence persistence, academic success,<br />
and attrition <strong>for</strong> entering NTID students. Initiated in 2007, this study examined personal factors of deaf<br />
and hard-of-hearing (D/HH) students relative to college per<strong>for</strong>mance. Two nonverbal visual reasoning<br />
assessments and two personal inventories were administered. These assessed personal factors such<br />
as intellectual interests, academic motivation, dropout proneness, coping, anxiety, attitudes,<br />
confidence, study habits, time management, and sociability. Three cohorts of entering D/HH students<br />
at NTID/RIT have participated (n = 132 in 2007; n = 167 in 2008, n = 248 in 2009) <strong>for</strong> a total of 547.<br />
Students’ personal factors were <strong>the</strong>n statistically analyzed with <strong>the</strong>ir quarterly and cumulative<br />
academic GPA and program status until ei<strong>the</strong>r attrition or graduation. Also, at <strong>the</strong> end of <strong>the</strong>ir firstyear<br />
experience, a follow-up survey assessed <strong>the</strong> students’ self-perception of <strong>the</strong>ir academic<br />
per<strong>for</strong>mance and <strong>the</strong>ir support strategies used. Findings show that a number of personal factors were<br />
significantly associated with students’ academic GPA, most notably attitude and interest in academic<br />
topics, preparation <strong>for</strong> class and tests, time management skills, study habits, attitude toward teachers,<br />
and desire to finish college. In addition, nonverbal reasoning and visual analytical skills were<br />
significantly associated with ma<strong>the</strong>matics placement and students’ entering ma<strong>the</strong>matics, science,<br />
and reading test scores. The results of this research have been presented at national and<br />
international conferences and several manuscripts are currently in process.<br />
Development of Norms <strong>for</strong> <strong>the</strong> ADSA-SLV. We recently published The Attention Deficit Scales <strong>for</strong><br />
Adults—Sign Language Version (ADSA-SLV), which is <strong>the</strong> first sign language-based test to assess<br />
ADHD in deaf and hard-of-hearing adults. At present <strong>the</strong>re are no norms <strong>for</strong> <strong>the</strong> per<strong>for</strong>mance of deaf<br />
and hard-of-hearing adults on this test. One purpose of this project is to develop an appropriate<br />
normative database <strong>for</strong> deaf and hard-of-hearing adults and to compare it to <strong>the</strong> original ADSA<br />
database available <strong>for</strong> <strong>the</strong> hearing population. The second purpose of this project is to determine<br />
whe<strong>the</strong>r <strong>the</strong> modified English sentences in <strong>the</strong> ADSA-SLV are comparable to English sentences in<br />
<strong>the</strong> original ADSA paper-and-pencil test by comparing <strong>the</strong> per<strong>for</strong>mance of hearing college students<br />
on <strong>the</strong>se two tests. Students at NTID and RIT between <strong>the</strong> ages of 18 and 25 with corrected vision<br />
and no o<strong>the</strong>r visual problems were selected to participate in this project. In addition, <strong>the</strong> hearing<br />
students met <strong>the</strong> criteria of having normal hearing, English as <strong>the</strong>ir first language, and no knowledge<br />
of sign language; <strong>the</strong> deaf students met <strong>the</strong> criterion of having at least an 80-dB loss in <strong>the</strong> better ear.<br />
The participants were given a background questionnaire, a screening test <strong>for</strong> neurological integrity<br />
(<strong>the</strong> SDMT), <strong>the</strong> ADSA-SLV, and a cognitive skills test to control <strong>for</strong> IQ (<strong>the</strong> KBITS). Data collection<br />
from hearing students has been completed and is in progress <strong>for</strong> <strong>the</strong> deaf and hard-of-hearing<br />
students as planned.<br />
<strong>Deaf</strong> Readers’ Neural Networks: Impact of Communication Mode. This project includes two<br />
neuroimaging projects that are exploring <strong>the</strong> impact of different educational and language<br />
experiences on (a) <strong>the</strong> processing of written English and (b) single sign recognition. These projects<br />
are externally funded. We collected more neuroimaging data this year and will continue to collect data<br />
over <strong>the</strong> summer and in <strong>the</strong> beginning of <strong>the</strong> next year. Preliminary results suggest that <strong>the</strong>re are<br />
some similar and some different routes used by deaf young adults who were raised orally, those<br />
using sign (not ASL), and native ASL signers. Behavioral data suggest that long-term memory skills<br />
account <strong>for</strong> more of deaf readers' reading process than <strong>the</strong> o<strong>the</strong>r attributes measured, including<br />
phonological awareness. Phonological awareness accounts <strong>for</strong> most of <strong>the</strong> variance of hearing<br />
readers' skills compared to <strong>the</strong> o<strong>the</strong>r cognitive functions measured (including long-term memory<br />
skills). Analysis of <strong>the</strong> results of <strong>the</strong> single sign recognition study are still in progress.<br />
2. Communication<br />
Effect of Sign Task on Speech Timing in Simultaneous Communication by Inexperienced Signers.<br />
Previous research with experienced signers has indicated that <strong>the</strong> complexity of <strong>the</strong> signing task<br />
during simultaneous communication has a moderate effect on some of <strong>the</strong> temporal aspects of<br />
speech. Thus, as <strong>the</strong> sign task becomes more complex in simultaneous communication, temporal<br />
modifications of speech occur that can affect <strong>the</strong> overall intelligibility of speech that accompanies<br />
-149-<br />
Research
Examples of Research Activities (continued)<br />
simultaneous communication. No data are available which address <strong>the</strong> issue of sign complexity<br />
during simultaneous communication produced by inexperienced signers. Such data would provide<br />
in<strong>for</strong>mation regarding <strong>the</strong> speech model being presented to hearing-impaired children by individuals<br />
who are not experienced signers, such as peers, siblings and parents. The measurement of acoustic<br />
data on all subjects was completed.<br />
Comparing <strong>Deaf</strong> and L2 English Learners’ Knowledge of Numeral Quantifiers Phase 2. A multipicture<br />
sentence interpretation task was employed to assess college-level deaf students’ and hearing<br />
second-language (L2) learners’ interpretations of English sentences containing a numeral quantifier<br />
and an indefinite noun phrase. Such sentences, which are prevalent in <strong>the</strong> discourse of STEM<br />
education, are generally ambiguous between a ―collective‖ interpretation and a ―distributive‖<br />
interpretation and <strong>the</strong>re<strong>for</strong>e pose a challenge to learners’ comprehension of academic text. It was<br />
predicted that, unlike hearing native English speakers, both deaf students and hearing L2 English<br />
learners’ sentence interpretations would be influenced by <strong>the</strong> relative degree of complexity inherent in<br />
<strong>the</strong> derivations of superficially similar sentence types. This prediction was supported. Both <strong>the</strong> deaf<br />
students’ and L2 learners’ sentence interpretations were influenced by derivational complexity,<br />
resulting in parallel per<strong>for</strong>mance by <strong>the</strong>se two types of English learner. The participant groups<br />
differed, however, in <strong>the</strong> extent to which discourse-pragmatic factors affect sentence interpretation.<br />
The deaf students with relatively lower overall English proficiency were more affected than deaf<br />
students with higher English proficiency in <strong>the</strong> extent to which pragmatic factors adversely affected<br />
sentence interpretation. The results provide insight into <strong>the</strong> English language and literacy challenges<br />
facing deaf students at <strong>the</strong> college level.<br />
Intelligibility of Simultaneous Communication in Blocked Hands/Face Conditions. The aim of this<br />
project is to better understand Simultaneous Communication (SC), <strong>the</strong> use of speech and sign<br />
produced at <strong>the</strong> same time. Because <strong>the</strong>re are two streams of in<strong>for</strong>mation from <strong>the</strong> sender, study of<br />
SC can yield valuable in<strong>for</strong>mation on <strong>the</strong> linguistic processing of visual language input, about which<br />
little is known despite <strong>the</strong> widespread use of SC when deaf and hearing people come toge<strong>the</strong>r. The<br />
objective of this study was to measure <strong>the</strong> intelligibility of an SC message when view of <strong>the</strong> torso (and<br />
most signing) is blocked versus when view of <strong>the</strong> face (and <strong>the</strong> spoken message) is blocked. The<br />
data collection phase of this project was completed with <strong>the</strong> testing of 24 new subjects whose data<br />
were added to <strong>the</strong> 32 who were tested previously. Although <strong>the</strong> original objective was to test only<br />
congenitally or prelingually deaf students whose first language was ei<strong>the</strong>r American Sign Language<br />
or English, a significant portion of <strong>the</strong> students who volunteered were born and educated outside of<br />
<strong>the</strong> United States, learned English during elementary or high school, and were relatively new to ASL.<br />
Because <strong>the</strong>se students may represent a unique complex of needs, <strong>the</strong>ir data were retained and<br />
ano<strong>the</strong>r grouping variable was added to <strong>the</strong> analysis design, namely, age at introduction to English.<br />
Stimulus and response files <strong>for</strong> our specially constructed set of speech-critical and sign-critical<br />
sentences were converted and <strong>for</strong>matted <strong>for</strong> analysis. Initial results indicate that <strong>the</strong> pattern of results<br />
from this year's participants replicates that of last year's participants. It remains to be seen, however,<br />
how <strong>the</strong> new grouping variable will influence conclusions in <strong>the</strong> next phase of data analysis.<br />
Acoustic and Perceptual Characteristics of Vowels Produced During Simultaneous Communication by<br />
Inexperienced Signers. Speech produced during simultaneous communication is altered in temporal<br />
and suprasegmental characteristics when compared to speech produced alone. There are no data<br />
regarding <strong>the</strong> perception of speech produced during simultaneous communication by inexperienced<br />
signers. Such in<strong>for</strong>mation would be useful because it would indicate whe<strong>the</strong>r <strong>the</strong> changes in speech<br />
that occur during simultaneous communication have a positive or negative impact on <strong>the</strong> perception<br />
of speech. The purpose of this study is to examine <strong>the</strong> acoustical and perceptual features of all<br />
vowels produced in standard American English during experimental conditions of (a) speech alone<br />
and (b) speech combined with simultaneous communication by inexperienced signers. This year,<br />
measurement of data was completed and statistical analysis was initiated.<br />
Research -150-
Examples of Research Activities (continued)<br />
Investigation of Poor and Proficient Readers in Different Countries. This international research<br />
program is investigating <strong>the</strong> cognitive processes deaf students use when reading. We will also be<br />
looking at <strong>the</strong> effects of different orthographies (English, German, Hebrew, Arabic, and Turkish) on<br />
<strong>the</strong> reading process in deaf students, hearing students with phonological dyslexia, and hearing<br />
students without any reading disability. Data collection in Israel, Germany, Turkey, and <strong>the</strong> United<br />
States was begun and is near completion. Preliminary results suggest that deaf readers generally do<br />
not rely on <strong>the</strong> phonological route <strong>for</strong> reading; instead, <strong>the</strong>y appear to be using <strong>the</strong> orthographical<br />
route. Fur<strong>the</strong>r data analyses will be conducted during <strong>the</strong> next academic year.<br />
3. Technology, Access, and Support Services<br />
An Investigation of Cisco Technologies and Access Solutions. The Silicon Valley Community<br />
Foundation, following <strong>the</strong> recommendation of <strong>the</strong> Cisco Accessibility Team, granted CAT a $100,000<br />
award to consider <strong>the</strong> application and adaptation of <strong>the</strong> ways in which Cisco products can benefit<br />
communication access <strong>for</strong> deaf and hard-of-hearing individuals. The three research strands will<br />
examine and provide recommendations related to 911-411-211 telephone response systems;<br />
evaluate possible use of avatars to enhance direct communication support <strong>for</strong> deaf and hard-ofhearing<br />
users; and evaluate Cisco TelePresence technologies <strong>for</strong> classroom and remote<br />
communication <strong>for</strong> deaf and hard-of-hearing users.<br />
CAT Innovation Lab. The NTID CAT Innovation Laboratory (CAT Lab) is a first-of-its-kind initiative,<br />
providing a place <strong>for</strong> students to get involved in <strong>the</strong> innovation process. The CAT Lab brings toge<strong>the</strong>r<br />
faculty and associate degree-level deaf and hard-of-hearing students to collaborate on<br />
multidisciplinary projects related to developing and adapting access and instructional technologies,<br />
health care technologies and services and more. For example, faculty and students collaborated<br />
on <strong>the</strong> development of a wake-up alarm system <strong>for</strong> PDAs that would alert people who are deaf<br />
and hard-of-hearing.<br />
Testing <strong>the</strong> Concept of a Virtual Alliance <strong>for</strong> <strong>Deaf</strong> and Hard-of-Hearing STEM Students at <strong>the</strong><br />
Postsecondary Level. This project is funded by <strong>the</strong> <strong>National</strong> Science Foundation and began in<br />
September 2009. It is a planning grant to investigate <strong>the</strong> creation of a virtual support network <strong>for</strong><br />
mainstreamed deaf/hard-of-hearing college students around <strong>the</strong> country enrolled in science,<br />
technology, engineering, and ma<strong>the</strong>matics (STEM) programs. The virtual support network could<br />
consist of interpreting, captioning, mentoring, tutoring and social networking services.<br />
Development of a Consortium <strong>for</strong> Advanced Collaborative Technologies. The major goals of this<br />
project were to develop an educational plat<strong>for</strong>m called ClassGrid, utilizing <strong>the</strong> capacity of Internet2,<br />
and to establish a framework called <strong>the</strong> University Consortium <strong>for</strong> Advanced Collaborative<br />
Technologies (UCACT) to facilitate its implementation. The project team organized <strong>for</strong> this proposal<br />
had multidisciplinary expertise and was based at geographically separated universities, Rochester<br />
<strong>Institute</strong> of Technology and <strong>the</strong> University of Washington Tacoma. About 80 undergraduate students<br />
were projected to take four courses in geospatial technology and data mining skills, which were<br />
planned to be fully accessible to deaf and hard-of-hearing students, and to students who have<br />
English as <strong>the</strong>ir second language. We designed <strong>the</strong> consortium structure and activities. A grant<br />
proposal was developed and submitted in January to <strong>the</strong> <strong>National</strong> Science Foundation:<br />
ClassGrid: Multi-University Use of Advanced Collaboration Technologies. Pilot research on this<br />
project is continuing.<br />
Feasibility of Achieving Normal Loudness Growth <strong>for</strong> Listeners with Severe or Profound Hearing<br />
Loss: Report. Whereas audibility and loudness are <strong>the</strong> relevant parameters assessed in <strong>the</strong><br />
verification stage of hearing aid fitting, com<strong>for</strong>t and benefit are assessed at <strong>the</strong> validation stage; yet<br />
<strong>the</strong> latter is heavily dependent on <strong>the</strong> <strong>for</strong>mer, especially <strong>for</strong> listeners with severe or profound hearing<br />
loss. The purpose of this study was to document <strong>the</strong> patterns of growth of loudness obtained with<br />
best-fit hearing aids and <strong>the</strong> relationship between goodness of loudness growth functions and<br />
satisfaction with hearing aids in cases of severe or profound hearing loss. Preliminary analysis of <strong>the</strong><br />
data from 23 listeners indicates general satisfaction with hearing aid per<strong>for</strong>mance despite a wide<br />
-151-<br />
Research
Examples of Research Activities (continued)<br />
variety of loudness growth patterns <strong>for</strong> a range of narrow-band speech and tonal signals. Additional<br />
hearing aid and user variables are being studied to explain connections between hearing aid<br />
characteristics and loudness perception.<br />
Supporting <strong>Deaf</strong> and Hard-of-Hearing Undergraduate Students in STEM Field Settings with Remote<br />
Speech-to-Text Services: Year 3. Results from a survey of student users of <strong>the</strong> Remote Speech-to-<br />
Text technology found that student-rated comprehension improved as <strong>the</strong> technology improved. In<br />
<strong>the</strong> first two trials with <strong>the</strong> technology, <strong>the</strong> average rated comprehension was 40-50 percent. In trials<br />
3-9, with improved technology, <strong>the</strong> average rated comprehension was 80-90 percent. Student<br />
interview comments indicated that students felt <strong>the</strong>y had more flexibility in regard to what <strong>the</strong>y could<br />
do and observe on field trips because <strong>the</strong> text display on <strong>the</strong>ir hand-held device provided a reliable<br />
display of what <strong>the</strong> tour speaker was saying. That is, students did not need to be concerned with<br />
being at <strong>the</strong> front of <strong>the</strong> tour to understand <strong>the</strong> speaker or interpreter.<br />
Dissemination of Project Access: Partnerships Internal and External to RIT. NTID’s Project Access is<br />
designed to help educators incorporate basic strategies to foster better learning <strong>for</strong> mainstreamed<br />
deaf and hard-of-hearing students. The focus of Team Access this year has been on dissemination of<br />
Project Access resources and materials, including <strong>the</strong> Project Access Workshop Planner's Guide and<br />
<strong>the</strong> Class Act website (www.rit.edu/classact). The core team of nine collaborators made nine<br />
presentations to campus groups, including new faculty and teaching assistants, current tenure track<br />
and adjunct faculty, and professional staff. Two presentations were given to groups external to NTID,<br />
including members of <strong>the</strong> PEPNet South team and members of <strong>the</strong> PEPNet Board. Team Access<br />
also gave a presentation at <strong>the</strong> 2010 International Congress on <strong>the</strong> Education of <strong>the</strong> <strong>Deaf</strong>.<br />
Examination of Course Completion and Communication Ease in Online Learning Courses. The<br />
research team on online learning at RIT examined three sets of variables and <strong>the</strong>ir interplay in online<br />
and face-to-face (F2F) classes at RIT. We implemented a questionnaire to measure student<br />
perceptions of classroom communication, and we used a second quantitative measure to divide RIT<br />
online courses into quartiles based on <strong>the</strong> actual number of postings. Finally, we looked at how <strong>the</strong><br />
perceptions and quantitative measures of communication related to academic achievement <strong>for</strong> deaf,<br />
hard-of-hearing, and hearing students in RIT classes. Courses were matched; that is, only F2F<br />
courses were included that had <strong>the</strong> same course number <strong>for</strong> online sections of <strong>the</strong> same course. Our<br />
findings were that deaf students in RIT College of Liberal Arts courses had significantly lower GPAs in<br />
F2F classes, but no difference was found in <strong>the</strong> online courses. Thus deaf and hard-of-hearing<br />
students per<strong>for</strong>med as well as <strong>the</strong>ir hearing peers when <strong>the</strong> course content was presented online.<br />
4. Employment and Adaptability to Social Changes and <strong>the</strong> Global Workplace<br />
SSA Research with Cornell University. NTID is a collaborative partner with Cornell University and <strong>the</strong><br />
federal Social Security Administration in a program of research to assess <strong>the</strong> effect of postsecondary<br />
education on <strong>the</strong> economic status of persons who are deaf/hard-of-hearing. Through a data-sharing<br />
agreement, NTID has been able to research such things as dependency on federal disability<br />
programs, work<strong>for</strong>ce participation, and lifetime earnings across various levels of education.<br />
Conclusions drawn from <strong>the</strong>se studies have significantly highlighted <strong>the</strong> benefits that an NTID<br />
education has on our deaf/hard-of-hearing students, and have provided program feedback <strong>for</strong> NTID.<br />
Research -152-
Examples of Research Activities (continued)<br />
5. O<strong>the</strong>r<br />
<strong>National</strong> Center <strong>for</strong> <strong>Deaf</strong> Health Research. The University of Rochester’s <strong>National</strong> Center <strong>for</strong> <strong>Deaf</strong><br />
Health Research (NCDHR) is a national center <strong>for</strong> research on health care and health promotion in<br />
<strong>the</strong> deaf community. It was first funded by a $3.5 million grant from <strong>the</strong> Centers <strong>for</strong> Disease Control<br />
<strong>for</strong> five years starting in September 2004, with participation of <strong>the</strong> <strong>National</strong> <strong>Technical</strong> <strong>Institute</strong> <strong>for</strong> <strong>the</strong><br />
<strong>Deaf</strong> through a subcontract. As of September 2009, <strong>the</strong> NCDHR is now supported by a five-year<br />
renewal grant from <strong>the</strong> CDC. The NTID co-principal investigator on <strong>the</strong> NCDHR team contributed to<br />
this past year’s research agenda and coordinated <strong>the</strong> activities of RIT and outside consultants <strong>for</strong><br />
development of new sign language survey materials <strong>for</strong> <strong>the</strong> <strong>Deaf</strong> Consumer Assessment of<br />
Healthcare Providers and Systems (CAHPS) survey. These activities required <strong>the</strong> <strong>for</strong>mation of a<br />
translation committee that developed signed English translations of CAHPS material and <strong>the</strong><br />
coordination of studio filming of <strong>the</strong> CAHPS material. Ongoing analysis of NCDHR’s College Health<br />
Survey and <strong>the</strong> <strong>Deaf</strong> Community Survey was carried out through collaborative consultation with<br />
NCDHR members on statistical and experimental design issues. Research findings were presented at<br />
two national and international conferences.<br />
-153-<br />
Research
Outreach<br />
Steps to Success is a career exploration mini-camp <strong>for</strong> African-<br />
American, Latin American, and Native American students in grades<br />
7–9 and <strong>the</strong>ir families. Students participate in hands-on activities<br />
that are designed to help <strong>the</strong>m identify possible career paths.<br />
-155-<br />
Outreach<br />
Outreach<br />
<strong>National</strong> <strong>Technical</strong> <strong>Institute</strong> <strong>for</strong> <strong>the</strong> <strong>Deaf</strong>
Outreach Highlights<br />
NTID’s educational outreach ef<strong>for</strong>ts include a number of innovative programs designed to share<br />
educational in<strong>for</strong>mation and provide technical assistance to alumni, o<strong>the</strong>r deaf and hard-of-hearing adults,<br />
teachers of deaf and hard-of-hearing students, employers, Vocational Rehabilitation personnel,<br />
secondary and middle school students and parents of deaf and hard-of-hearing children. FY 2010<br />
outreach program highlights include pre-college, college, post-college and o<strong>the</strong>r outreach activities.<br />
Pre-College Outreach Programs<br />
NTID’s Strategic Vision 2010 called <strong>for</strong> an increase in outreach ef<strong>for</strong>ts aimed at deaf and hard-ofhearing<br />
middle school and high school students. The purpose was to provide educational experiences<br />
<strong>for</strong> <strong>the</strong>se students that would enable <strong>the</strong>m to envision a place <strong>for</strong> <strong>the</strong>mselves in a college environment<br />
after <strong>the</strong>ir high school graduation. A special focus of this ef<strong>for</strong>t was young women and African-<br />
American, Latino-American and Native-American (AALANA) students. During FY 2010, NTID faculty<br />
and staff conducted eight outreach programs: <strong>the</strong> SpiRIT Writing Contest <strong>for</strong> students in grades<br />
10–11; <strong>the</strong> RIT <strong>National</strong> Science Fair <strong>for</strong> students in grades 6–11; Explore Your Future, a summer<br />
program <strong>for</strong> students in grades 10–11; TechGirlz, a summer camp <strong>for</strong> girls in grades 7–9; Steps to<br />
Success, a weekend camp <strong>for</strong> AALANA students in grades 7–9; a math competition <strong>for</strong> middle school<br />
students using problems from MATHCOUNTS ® ; <strong>the</strong> Digital Arts, Film and Animation Competition <strong>for</strong><br />
students in grades 9–12; and FutureQuest, a transition conference <strong>for</strong> high school students in grades<br />
9-12 and <strong>the</strong>ir parents.<br />
Explore Your Future (EYF), a week-long career exploration and evaluation program <strong>for</strong> deaf and hardof-hearing<br />
students about to enter <strong>the</strong>ir junior or senior year of high school, is one of NTID’s most<br />
successful outreach programs. EYF provides opportunities <strong>for</strong> high school<br />
students to learn about <strong>the</strong>mselves and <strong>the</strong>ir educational and life/career choices,<br />
and is based on <strong>the</strong> idea that people have differing interests in six areas: Realistic,<br />
Investigative, Artistic, Social, Enterprising and Conventional (RIASEC). Students<br />
participate in hands-on career exploration classes and personal awareness<br />
instruction. A myriad of social activities and dorm-living opportunities give <strong>the</strong> students a taste of<br />
college life. More than 4,900 students have participated in EYF over <strong>the</strong> past 26 years. In summer<br />
2010, 217 students participated in <strong>the</strong> program.<br />
College Outreach Programs<br />
The Postsecondary Education Programs Network-Nor<strong>the</strong>ast Region (PEPNet-Nor<strong>the</strong>ast) is one of<br />
four regional centers supported by contracts with <strong>the</strong> U.S. Department of Education Office of Special<br />
Education Programs to provide technical assistance, training and resources that enable employers,<br />
and secondary and postsecondary educational institutions to work effectively and successfully with<br />
individuals who are deaf or hard-of-hearing, including<br />
those with co-occurring disabilities. The project<br />
received funding <strong>for</strong> a five-year cycle commencing in<br />
October 2006. Outreach activities provided by <strong>the</strong><br />
project include: technical assistance and dissemination;<br />
linking state, regional and national educators, service providers and individuals in a cooperative<br />
network; personnel development activities that create and promote training opportunities <strong>for</strong><br />
education and rehabilitation professionals on transition and secondary and postsecondary<br />
educational services; and demonstrating innovative technology utilization that provides access to and<br />
accommodations within programs <strong>for</strong> individuals who are deaf or hard-of-hearing.<br />
Outreach -156-
Outreach Highlights (continued)<br />
In its fourth year of operation (FY 2010), PEPNet-Nor<strong>the</strong>ast and <strong>the</strong> three o<strong>the</strong>r regional centers<br />
collaborated with <strong>the</strong> Association of Higher Education and Disability (AHEAD) to co-convene <strong>the</strong> 33 rd<br />
annual AHEAD international conference and <strong>the</strong> PEPNet seventh biennial conference. This first-time<br />
event, which took place in Denver, Colo., in summer 2010, provided one seamlessly integrated place<br />
and time <strong>for</strong> attendees from across <strong>the</strong> disability and education communities to come toge<strong>the</strong>r <strong>for</strong> an<br />
unparalleled professional conference.<br />
During this reporting period, PEPNet-Nor<strong>the</strong>ast produced three live, national webcasts: Online<br />
Accessible Technology (produced in collaboration with PEPNet-South and <strong>the</strong> University of<br />
Tennessee at Knoxville); RKit: An Online Resource <strong>for</strong> Teachers, Parents, and Service Providers (an<br />
introduction and orientation to <strong>the</strong> resources currently available on <strong>the</strong> national PEPNet website), and<br />
Impact on Access: Individuals with COCHLEAR IMPLANTS in Educational And Employment Settings<br />
(a moderated panel of professionals and consumers). Each webcast is archived on <strong>the</strong> national<br />
PEPNet website (www.pepnet.org). Project staff also have completed <strong>the</strong> first phase of <strong>the</strong> initiative to<br />
translate into Spanish <strong>the</strong> more than 35 PEPNet topical briefs or Tipsheets that provide in<strong>for</strong>mation<br />
on a variety of topics relevant to education, accommodations and <strong>the</strong> provision of support services to<br />
deaf and hard-of-hearing students.<br />
Additionally, PEPNet-Nor<strong>the</strong>ast initiated two new pre-GED distance courses <strong>for</strong> deaf and hard-ofhearing<br />
students in rural settings. Each course was offered through cooperative agreements with<br />
LaGuardia Community College; <strong>the</strong> Hiram G. Andrews Center, Johnstown, Pa.; and Nor<strong>the</strong>rn Essex<br />
Community College, Haverhill, Mass. A significant milestone was achieved when <strong>for</strong> <strong>the</strong> first-time a<br />
two-and-a-half-day series of training and awareness programs was implemented <strong>for</strong> service<br />
providers, parents and staff of <strong>the</strong> Department of Education in <strong>the</strong> United States Virgin Islands. The<br />
training series took place on <strong>the</strong> islands of St. Thomas and St. Croix and involved more than 60<br />
participants that also included rehabilitation professionals, disability and advocacy organizations and<br />
teachers. The training team included two PEPNet-Nor<strong>the</strong>ast staff members, a staff member from <strong>the</strong><br />
NTID Student Life Team and a member of <strong>the</strong> NTID <strong>National</strong> Advisory Group. PEPNet-Nor<strong>the</strong>ast<br />
continues to provide opportunities <strong>for</strong> training and professional development <strong>for</strong> regional stakeholders<br />
that involve local, regional and national events. For example, training grants were provided <strong>for</strong> 15<br />
stakeholders to attend <strong>the</strong> AHEAD-PEPNet Co-Convened Conference (including Continuing<br />
Education Credits). Additionally, 22 regional stakeholders received grants to participate in <strong>the</strong> 2010<br />
Technology and <strong>Deaf</strong> Education Symposium held at NTID in June, and four training grants were<br />
provided <strong>for</strong> continuing education training, which was offered by DeKalb <strong>Technical</strong> College, Clarkston,<br />
Ga., <strong>for</strong> practicing C-Print ® captionists to learn new C-Print technologies.<br />
Expanded partnerships and collaboration with key regional stakeholders continue to be a priority <strong>for</strong><br />
PEPNet-Nor<strong>the</strong>ast. Examples of stakeholders with which project staff have worked this year include,<br />
but are not limited to: Nor<strong>the</strong>astern University <strong>National</strong> and Regional Interpreter Education Centers,<br />
NTID FutureQuest Program, New York State Educational Support Service Personnel, New England<br />
<strong>Technical</strong> Assistance Continuing Education Center, Pennsylvania Community of Practice on<br />
Transition, City University of New York Consortium, New York City Board of Education, Pennsylvania<br />
Center <strong>for</strong> Independent Living, and <strong>the</strong> New Jersey Department of Health Pediatric Early Hearing<br />
Detection and Intervention Program. On a national level, some examples of collaborations include:<br />
U.S. Department of Education Rehabilitation Services <strong>National</strong> Conference of VR Personnel Serving<br />
<strong>Deaf</strong>, Hard-of-Hearing, and <strong>Deaf</strong>-Blind Consumers; <strong>the</strong> Assistive Technology Industry Association;<br />
<strong>National</strong> Assistive Technology <strong>Technical</strong> Assistance Partnership; Parent Advocacy Coalition <strong>for</strong><br />
Education Rights; <strong>National</strong> Association of State Directors of Special Education; and <strong>National</strong><br />
Secondary Transition <strong>Technical</strong> Assistance Center.<br />
PEPNet-Nor<strong>the</strong>ast, working closely with <strong>the</strong> three o<strong>the</strong>r regional PEPNet centers, has implemented<br />
a synergistic model of service delivery that significantly enhances <strong>the</strong> capability of project staff to<br />
meet stakeholder needs relevant to high quality, useful training and products, and innovative<br />
accessible technology.<br />
-157-<br />
Outreach
Outreach Highlights (continued)<br />
NTID’s Project Access is designed to help educators incorporate basic strategies to foster better<br />
learning <strong>for</strong> mainstreamed deaf and hard-of-hearing students. NTID faculty have led workshops <strong>for</strong><br />
teachers and o<strong>the</strong>r professionals from across <strong>the</strong> country and have established a resource website<br />
<strong>for</strong> educators called Class Act (http://www.rit.edu/classact). The site includes ready-to-use classroom<br />
handouts, in<strong>for</strong>mation on universal design <strong>for</strong> education, and videotaped faculty and student input.<br />
The site is organized into teaching, communication, support services, and environment categories.<br />
Instructors may use <strong>the</strong> site <strong>for</strong> strategies and tips to address <strong>the</strong> challenges <strong>the</strong>y face and ultimately<br />
foster better learning <strong>for</strong> deaf, hard-of-hearing, and hearing students. Of particular interest are three<br />
online interactive instructional modules: Working with Interpreters, Pace of Instruction, and First Day<br />
of Class. In addition to orientation <strong>for</strong> new faculty and graduate teaching assistants, we are actively<br />
sharing in<strong>for</strong>mation about Project Access with adjuncts and o<strong>the</strong>r faculty groups through <strong>the</strong> RIT<br />
Faculty Learning Communities and New Faculty Orientation. In FY 2010, <strong>the</strong>re were approximately<br />
5,000 visits to <strong>the</strong> Class Act website.<br />
Post-College Outreach Programs<br />
The <strong>Deaf</strong> Initiative in In<strong>for</strong>mation Technology (DIIT) project was established with two continuing<br />
grants from <strong>the</strong> <strong>National</strong> Science Foundation. During <strong>the</strong> six years of NSF funding (2000-2006), DIIT<br />
focused on <strong>the</strong> area of in<strong>for</strong>mation technology. Since <strong>the</strong> end of NSF funding in 2006, NTID has<br />
supported <strong>the</strong> project, expanding <strong>the</strong> DIIT model to o<strong>the</strong>r disciplines and changing <strong>the</strong> name of <strong>the</strong><br />
project to <strong>Deaf</strong> Initiative in Technology (DiiT). Faculty members from <strong>the</strong> In<strong>for</strong>mation and Computing<br />
Studies, Arts and Imaging Studies, Engineering Studies, Business Studies and Liberal Studies<br />
Departments offered workshops on a wider range of topics during <strong>the</strong> 2009-2010 academic year.<br />
Outside funding also has been acquired to support <strong>the</strong> annual offerings of DiiT workshops in <strong>the</strong><br />
Greater Los Angeles and Pittsburgh areas. During AY 2009-2010, <strong>the</strong> DiiT project offered eight<br />
workshops to 64 deaf and hard-of-hearing participants. These included:<br />
o Four workshops offered on <strong>the</strong> RIT/NTID campus.<br />
o One workshop offered in <strong>the</strong> greater Los Angeles area, supported by <strong>the</strong> Max Factor Family<br />
Foundation.<br />
o One workshop offered in Pittsburgh, supported by <strong>the</strong> Bank of New York Mellon Foundation.<br />
This brings <strong>the</strong> 10-year total <strong>for</strong> <strong>the</strong> DiiT project to 92 separate workshops offered to 710 deaf and<br />
hard-of-hearing attendees.<br />
NTID makes available on a national basis 61 sign language videotapes and two CD-ROMs in<br />
26 technical/specialized content areas <strong>for</strong> technical communication. These videotapes and<br />
CDs are available from <strong>the</strong> NTID Marketing Communications Department. The videotapes<br />
also are available from <strong>the</strong> Described and Captioned Media Program. In addition, NTIDproduced<br />
sign language books <strong>for</strong> technical communication are available through ADCO in<br />
Colorado, Butte Publications in Oregon, Harris Communications in Minnesota and <strong>the</strong> Barnes<br />
& Noble @ RIT bookstore.<br />
O<strong>the</strong>r Outreach Activities<br />
In 2009-2010, NTID’s Center on Employment (NCE) served a total of 521 employer representatives<br />
through 29 training sessions and outreach workshops such as Working Toge<strong>the</strong>r: <strong>Deaf</strong> and Hearing<br />
People. NCE successfully completed Pittsburgh and Chicago trips, which included 10 employer<br />
orientations and two alumni workshops. NCE completed <strong>the</strong> fifth and final year of <strong>the</strong> Max<br />
Factor grant, during which a total of 126 employer representatives from Sou<strong>the</strong>rn Cali<strong>for</strong>nia<br />
attended eight different events to promote <strong>the</strong> hiring of deaf and hard-of-hearing RIT/NTID students<br />
and NCE services.<br />
Sign Language Proficiency Interview (SLPI) Workshops and follow-up provide training <strong>for</strong> school<br />
personnel and o<strong>the</strong>rs to implement and conduct sign language communication skills assessment and<br />
development services <strong>for</strong> personnel and o<strong>the</strong>rs who work with or who are preparing to work with deaf<br />
Outreach -158-
Outreach Highlights (continued)<br />
and hard-of-hearing individuals. Project ef<strong>for</strong>ts include support <strong>for</strong> development of sign language<br />
program policy and procedure documents and annual reports to guide implementing SLPI use within<br />
<strong>the</strong> context of sign language communication skills assessment/development programs.<br />
During FY 2010, SLPI training and services included a four-hour SLPI refresher training via<br />
videoconference <strong>for</strong> <strong>the</strong> Alaska School <strong>for</strong> <strong>the</strong> <strong>Deaf</strong> and new SLPI team-member training <strong>for</strong>:<br />
o Kentucky School <strong>for</strong> <strong>the</strong> <strong>Deaf</strong>, Danville, Ky.,<br />
o Colorado School <strong>for</strong> <strong>the</strong> <strong>Deaf</strong> and Blind, Colorado Springs, Colo.,<br />
o Nor<strong>the</strong>rn Virginia Community College, Sterling, Va.,<br />
o J. Sargeant Reynolds Community College, Richmond, Va., and<br />
o Massachusetts Commission <strong>for</strong> <strong>the</strong> <strong>Deaf</strong> and Hard of Hearing, Boston, Mass.<br />
The SLPI website provides responses to frequently asked questions about <strong>the</strong> SLPI, guidelines <strong>for</strong><br />
establishing an SLPI Team, model documents <strong>for</strong> implementing and monitoring SLPI use, SLPI<br />
workshop training materials, and in<strong>for</strong>mation from NTID’s Office of Communication Assessment and<br />
Services (OCAS), which coordinates provision of SLPI services at <strong>the</strong> college.<br />
C-Print ® software, developed at NTID, is used by captionists to produce text of spoken content.<br />
C-Print is an access service option <strong>for</strong> deaf and hard-of-hearing students in educational<br />
environments. Inquiries about C-Print come via e-mail, phone calls and website visits. From October<br />
2009 through September 2010, <strong>the</strong>re were approximately 2000 e-mail dialogues and 800 phone call<br />
discussions with <strong>the</strong> C-Print Development and Training Office. The C-Print main website received<br />
22,380 visits from October 2009 to September 2010. NTID conducts online C-Print captionist training<br />
as a distance-education program designed to give individuals <strong>the</strong> core preparation necessary to<br />
provide speech-to-text services, primarily in a classroom setting. Orders <strong>for</strong> online training totaled 194<br />
from October 2009 through September 2010.<br />
NTID Per<strong>for</strong>ming Arts celebrated its 35 th season in AY 2009-2010 by presenting three mainstage and<br />
three laboratory productions that involved more than 490 deaf, hard-of-hearing and hearing students,<br />
faculty/staff and members of <strong>the</strong> Rochester community as actors, dancers, <strong>the</strong>ater technicians and<br />
front-of-house staff (box office and ushers). These per<strong>for</strong>mances were attended by 4,514 people from<br />
throughout New York State as well as schools and community groups from neighboring states and<br />
Canada. On-campus per<strong>for</strong>mances included Vignettes of <strong>the</strong> <strong>Deaf</strong> Character, Equus, Little Women,<br />
Sleeping Beauty, An Evening of One Act Plays and The Bungler. Additional per<strong>for</strong>mances<br />
included The Visit by members of The RIT Players, a one-woman show per<strong>for</strong>med by alum Rosa Lee,<br />
a per<strong>for</strong>mance by renown <strong>Deaf</strong> actress Michelle Banks, and a special per<strong>for</strong>mance by <strong>the</strong> Sen-Hibiki<br />
Taiko Drummers. Back again, RIT alumnus and well-known <strong>Deaf</strong> playwright, Willy Conley, <strong>the</strong> author<br />
of Vignettes of <strong>the</strong> <strong>Deaf</strong> Character, came to campus to view <strong>the</strong> NTID production of his work and to<br />
provide workshops <strong>for</strong> students on <strong>the</strong>ater and playwriting.<br />
During AY 2009-2010, 581 students registered <strong>for</strong> and attended Per<strong>for</strong>ming Arts classes, an increase<br />
of 86 students from <strong>the</strong> previous year. Ten students were awarded per<strong>for</strong>ming arts scholarships and<br />
six students were awarded per<strong>for</strong>ming arts certificates. In total, approximately 5,595 people were<br />
served by NTID Per<strong>for</strong>ming Arts activities during <strong>the</strong> 2009-2010 production season.<br />
The Office of <strong>the</strong> RIT Provost sponsors an annual Provost Summer Intensive American Sign<br />
Language and <strong>Deaf</strong> Culture Experience <strong>for</strong> selected RIT faculty/staff. The aim of <strong>the</strong> program is to<br />
enhance interactions among deaf and hearing members of <strong>the</strong> RIT community. Up to 15 RIT<br />
faculty/staff, who are not employed within NTID and who represent <strong>the</strong> various academic and nonacademic<br />
areas of RIT, are selected each year to participate in this intensive three-week program<br />
during <strong>the</strong> month of June. The focus of <strong>the</strong> program is to develop basic American Sign Language<br />
skills, an introduction to <strong>Deaf</strong> culture and an introduction to <strong>the</strong> dynamics of deaf and hearing<br />
interactions. The program has enjoyed continuing success and growth in registration since its<br />
inception years ago, and is a valued and coveted offering among RIT and NTID faculty and staff.<br />
-159-<br />
Outreach
Explore Your Future<br />
Explore Your Future (EYF) is a week-long career<br />
exploration and evaluation program conducted at<br />
NTID each summer <strong>for</strong> deaf and hard-of-hearing<br />
students about to enter <strong>the</strong>ir junior or senior year of<br />
high school. It is one of <strong>the</strong> institute’s most<br />
successful outreach programs. The program<br />
provides high school students with <strong>the</strong> opportunity<br />
to learn about <strong>the</strong>mselves and <strong>the</strong>ir educational<br />
and life/career choices. It incorporates <strong>the</strong><br />
framework that people have differing interests in six<br />
areas: Realistic, Investigative, Artistic, Social,<br />
Outreach -160-<br />
Enterprising and Conventional (RIASEC). Students<br />
participate in hands-on career exploration classes<br />
and personal awareness instruction. Myriad<br />
social activities and dorm-living opportunities give<br />
<strong>the</strong> students a taste of college life. A total of<br />
4,973 students have participated in EYF over <strong>the</strong><br />
past 26 years. Sixty-one percent of <strong>the</strong> summer<br />
2009 participants subsequently enrolled at NTID.<br />
Two sessions were offered in summer 2010. This<br />
year’s participants came from 29 states and one<br />
<strong>for</strong>eign country.<br />
FY 2006 FY 2007 FY 2008 FY 2009 FY 2010<br />
Number of Participants 183 253 235 196 217<br />
Percentage of Minorities 20% 15% 29% 30% 33%*<br />
Percentage Enrolling at NTID 44% 59% 62% 61% N/A**<br />
* Eighteen percent of students enrolled in EYF 2010 did not indicate <strong>the</strong>ir ethnicity on <strong>the</strong> registration <strong>for</strong>m.<br />
** Students from EYF 2010 currently are in <strong>the</strong> process of applying to NTID.
Explore Your Future – Enrollment by Location<br />
Summer 2010 EYF students represented 29 states<br />
and one <strong>for</strong>eign country.<br />
Home State or Country<br />
Number in EYF<br />
Summer 2010<br />
Alabama 1<br />
Alaska 0<br />
Arizona 0<br />
Arkansas 0<br />
Cali<strong>for</strong>nia 20<br />
Colorado 0<br />
Connecticut 4<br />
Delaware 1<br />
Florida 7<br />
Georgia 3<br />
Hawaii 0<br />
Idaho 0<br />
Illinois 21<br />
Indiana 2<br />
Iowa 0<br />
Kansas 2<br />
Kentucky 2<br />
Louisiana 0<br />
Maine 2<br />
Maryland 17<br />
Massachusetts 18<br />
Michigan 9<br />
Minnesota 4<br />
Mississippi 0<br />
Missouri 12<br />
Montana 1<br />
Nebraska 2<br />
Nevada 0<br />
New Hampshire 0<br />
New Jersey 11<br />
New Mexico 1<br />
New York 38<br />
North Carolina 1<br />
North Dakota 0<br />
Ohio 5<br />
Oklahoma 0<br />
Oregon 1<br />
Pennsylvania 15<br />
Rhode Island 0<br />
South Carolina 0<br />
South Dakota 0<br />
Tennessee 0<br />
-161-<br />
Outreach
Explore Your Future – Enrollment by Location (continued)<br />
Home State or Country<br />
Number in EYF<br />
Summer 2010<br />
Texas 4<br />
Utah 0<br />
Vermont 1<br />
Virginia 4<br />
Washington 0<br />
West Virginia 0<br />
Wisconsin 7<br />
Wyoming 0<br />
O<strong>the</strong>r (Hong Kong) 1<br />
Total 217<br />
EYF students take a break at <strong>the</strong> RIT Student Alumni Union.<br />
Outreach -162-
Employer Outreach<br />
NTID initiates and delivers consultation, training,<br />
follow-up and o<strong>the</strong>r support services to employers.<br />
Through <strong>the</strong>se services, employers become aware of<br />
<strong>the</strong> needs of deaf and hard-of-hearing people <strong>for</strong><br />
employment and, in partnership with NTID, facilitate<br />
Employer Training and Educational Programs<br />
-163-<br />
graduates entering <strong>the</strong> work<strong>for</strong>ce and<br />
continuing <strong>the</strong>ir career development. A total of<br />
521 employer representatives received training<br />
through <strong>the</strong> NTID Center on Employment (NCE)<br />
in AY 2009-2010.<br />
Conducted, delivered and presented 29 programs <strong>for</strong> 521 human resources professionals, service<br />
providers and company representatives.<br />
NTID Job Fair<br />
The ninth annual NTID Job Fair was held in October 2009 with 33 employers attending and more than<br />
300 students, alumni and members of <strong>the</strong> deaf community participating. During this fair, six employers<br />
participated on a panel attended by student job seekers, with each explaining <strong>the</strong> job search process from<br />
his/her company’s perspective and answering questions from student attendees.<br />
Co-op Visitation Program<br />
Twenty-three NTID faculty and staff visited 63 students on cooperative education assignments and <strong>the</strong>ir<br />
supervisors in 14 states and Washington, D.C.<br />
Outreach to Employers, Alumni and O<strong>the</strong>r <strong>Deaf</strong> and Hard-of-Hearing Adults<br />
Accommodated 18 employers in recruitment visits and 13 on-campus orientations; <strong>the</strong>re were 34<br />
resume packages requested.<br />
Consulted with 130 alumni and o<strong>the</strong>r deaf and hard-of-hearing adults seeking job search assistance.<br />
Successfully completed Pittsburgh and Chicago trips, which included 10 employer orientations and<br />
two alumni workshops.<br />
Completed <strong>the</strong> fifth and final year of <strong>the</strong> Max Factor grant-supported Cali<strong>for</strong>nia workshops. A total of<br />
126 participants attended eight different events.<br />
Brought 11 students from various majors and degree levels plus five faculty/staff to visit IBM in<br />
Hawthorne and Yorktown Heights, N.Y. to learn about employment opportunities and <strong>the</strong><br />
work environment.<br />
NCE Marketing Highlights<br />
Redesigned and revised NCE brochure and co-op flyer <strong>for</strong> employers.<br />
Collected employer testimonial quotes and pictures <strong>for</strong> use on NCE website and publications.<br />
Identified success stories <strong>for</strong> NCE website and media.<br />
Created ―Top 10 Reasons to Participate in Job Fair‖ to target baccalaureate students.<br />
Continued periodic e-newsletters to employers.<br />
Outreach
<strong>Deaf</strong> Initiative in Technology<br />
The <strong>Deaf</strong> Initiative in Technology (DiiT) project was<br />
established with two continuing grants from <strong>the</strong><br />
<strong>National</strong> Science Foundation (NSF) Advanced<br />
Technological Education (ATE). They funded <strong>the</strong><br />
The DiiT project is a unique educational model that:<br />
Outreach -164-<br />
project from July 2000 through September 2006<br />
with a total of $1,213,024. The project has now<br />
moved into an expanded phase and is funded<br />
by NTID.<br />
Addresses <strong>the</strong> continuing education needs of deaf and hard-of-hearing professionals across <strong>the</strong><br />
country currently working in or preparing to enter various technical fields;<br />
Addresses <strong>the</strong> professional development needs of <strong>the</strong> faculty in a variety of NTID departments; and<br />
Enhances <strong>the</strong> curriculum <strong>for</strong> <strong>the</strong> associate degree programs at NTID.<br />
The primary goals of this national project have been to:<br />
1. Develop and offer curriculum and educational materials to “upskill” deaf and hard-of-hearing<br />
professionals currently in <strong>the</strong> work<strong>for</strong>ce or preparing to enter <strong>the</strong> work<strong>for</strong>ce.<br />
2. Enhance <strong>the</strong> skill set and knowledge of <strong>the</strong> NTID faculty.<br />
3. Develop and offer cutting-edge curriculum and materials in courses <strong>for</strong> associate degree deaf and<br />
hard-of-hearing students at NTID.<br />
During <strong>the</strong> six years of <strong>the</strong> NSF funding, <strong>the</strong> DiiT project offered 58 workshops to a total of 409 deaf<br />
and hard-of-hearing participants. Attendees have come from 26 different states, with <strong>the</strong> majority from<br />
large corporations and government agencies. O<strong>the</strong>rs were unemployed and hoping to gain skills<br />
helpful <strong>for</strong> <strong>the</strong>ir job search.<br />
The model used <strong>for</strong> <strong>the</strong> DiiT project (faculty leaves of absence <strong>for</strong> training followed by <strong>the</strong><br />
presentation of a workshop), has successfully contributed to <strong>the</strong> professional development of many<br />
faculty at NTID. As a direct result of <strong>the</strong> DiiT project, six faculty members received a total of 12<br />
professional certifications.<br />
Ano<strong>the</strong>r goal of <strong>the</strong> project is to integrate into NTID’s undergraduate curriculum <strong>the</strong> material faculty<br />
develop while on DiiT-supported leaves. As a result of faculty development through <strong>the</strong> project,<br />
NTID’s associate degree curriculum has been significantly updated; <strong>for</strong> example, <strong>the</strong>re are three new<br />
concentration strands that include 15 new courses in <strong>the</strong> In<strong>for</strong>mation and Computing Studies<br />
Department (ICS).<br />
A fall 2004 survey of DiiT workshop participants revealed that:<br />
o Fifty percent of respondents obtained a new position or had taken on more responsibilities at <strong>the</strong>ir<br />
place of employment following participation in DiiT training.<br />
o Ninety-three percent indicated that participation in <strong>the</strong> DiiT workshops improved <strong>the</strong>ir skills.<br />
o Seventy-six percent said <strong>the</strong>y used workshop in<strong>for</strong>mation on <strong>the</strong> job.<br />
o Eighty-six percent responded that <strong>the</strong>y were more confident with <strong>the</strong>ir skills and with <strong>the</strong>ir ability<br />
to learn new skills. Through this increased confidence comes a willingness to participate in<br />
additional training that will allow <strong>the</strong>se deaf and hard-of-hearing professionals to be competitive<br />
with <strong>the</strong>ir hearing peers and obtain and retain jobs in increasingly demanding fields.<br />
<strong>Deaf</strong> adults attending DiiT workshops also participated in panel presentations <strong>for</strong> deaf and hard-ofhearing<br />
undergraduate students at RIT/NTID. This is <strong>the</strong> first time that many students had <strong>the</strong><br />
opportunity to interact with successful deaf adults working in a technical field.
<strong>Deaf</strong> Initiative in Technology (continued)<br />
Max Factor Family Foundation Gift<br />
In August 2005, NTID received a gift of $100,000 from <strong>the</strong> Max Factor Family Foundation, allowing NTID<br />
to provide skill-building and career-development workshops <strong>for</strong> deaf and hard-of-hearing adults in <strong>the</strong><br />
Greater Los Angeles area. The goal of this project was to combine NTID’s expertise in education and<br />
technology with <strong>the</strong> Max Factor Family Foundation’s strong presence and community influence in <strong>the</strong><br />
Los Angeles area to improve <strong>the</strong> career preparation of deaf and hard-of-hearing Cali<strong>for</strong>nians, with a<br />
special emphasis on <strong>the</strong> Hispanic/Latino population, and <strong>the</strong>ir subsequent successful integration into<br />
<strong>the</strong> workplace.<br />
To accomplish this goal, NTID offered annually, <strong>for</strong> five years, two groups of related workshops that<br />
brought to this area NTID’s proven expertise in preparing deaf people <strong>for</strong> successful careers:<br />
1. <strong>Deaf</strong> Initiative in Technology (DiiT) Workshops designed to streng<strong>the</strong>n and “upskill” <strong>the</strong><br />
computer skills of deaf and hard-of-hearing adults.<br />
2. Employer Awareness Workshops that train employers and education professionals<br />
such as teachers and counselors to prepare deaf people <strong>for</strong> successful careers in<br />
mainstream workplaces.<br />
In March 2010, <strong>the</strong> fifth and final annual series of workshops was offered to <strong>the</strong> deaf and hard-of-hearing<br />
community and employers in <strong>the</strong> Greater Los Angeles area. Six separate workshops were offered to a<br />
total of 135 participants. This brings <strong>the</strong> five-year total <strong>for</strong> <strong>the</strong> Max Factor portion of <strong>the</strong> project to<br />
40 workshops offered to 805 participants.<br />
Bank of New York Mellon Gift<br />
In August 2009, NTID received a gift of $25,000 from <strong>the</strong> Bank of New York Mellon Foundation to provide<br />
skill-building and career-development workshops <strong>for</strong> deaf and hard-of-hearing adults in <strong>the</strong> Greater<br />
Pittsburgh area during <strong>the</strong> 2009-2010 academic year. Using <strong>the</strong> model developed with <strong>the</strong> Max Factor<br />
Family Foundation Gift, <strong>the</strong> goal of this gift was to combine NTID’s expertise in education and technology<br />
with <strong>the</strong> BNY Mellon’s strong presence and community influence in <strong>the</strong> Pittsburgh area to improve <strong>the</strong><br />
career preparation of deaf and hard-of-hearing community members and <strong>the</strong>ir subsequent successful<br />
integration into <strong>the</strong> workplace.<br />
During April 2010 four employer awareness workshops were offered in <strong>the</strong> Pittsburgh area to<br />
64 representatives from several companies, and a five-day Microsoft Office workshop was offered to<br />
16 deaf and hard-of-hearing adults during August 2010.<br />
Continuation and Expansion of <strong>the</strong> DIIT Model<br />
Since <strong>the</strong> end of NSF funding in 2006, NTID has supported <strong>the</strong> project, expanding <strong>the</strong> <strong>Deaf</strong> Initiative in<br />
In<strong>for</strong>mation Technology (DIIT) model to o<strong>the</strong>r disciplines and changing <strong>the</strong> name of <strong>the</strong> project to <strong>Deaf</strong><br />
Initiative in Technology (DiiT). Faculty members from <strong>the</strong> In<strong>for</strong>mation and Computing Studies, Arts and<br />
Imaging Studies, Engineering Studies, Business Studies and Liberal Studies departments offered<br />
workshops on a wider range of topics during <strong>the</strong> 2009-2010 academic year. Outside funding has been<br />
acquired to support <strong>the</strong> annual offerings of DiiT workshops in <strong>the</strong> Greater Los Angeles area <strong>for</strong> <strong>the</strong> past<br />
five years and <strong>the</strong> Pittsburgh area beginning this year (see above).<br />
During AY 2009-2010, <strong>the</strong> DiiT project offered eight workshops to 88 deaf and hard-of-hearing<br />
participants, including four workshops offered on <strong>the</strong> RIT/NTID campus, two workshops offered at<br />
Tobyhanna Army Depot in Pennsylvania, <strong>the</strong> series of workshops in Los Angeles supported by <strong>the</strong> Max<br />
Factor Family Foundation and <strong>the</strong> workshop in Pittsburgh supported by <strong>the</strong> BNY Mellon Foundation. This<br />
brings <strong>the</strong> 10-year total <strong>for</strong> <strong>the</strong> DiiT project to 92 separate workshops offered to 710 deaf and hard-ofhearing<br />
attendees.<br />
-165-<br />
Outreach
PEPNet-Nor<strong>the</strong>ast<br />
The Postsecondary Education Programs Network –<br />
Nor<strong>the</strong>ast Region (PEPNet-Nor<strong>the</strong>ast) is one of four<br />
regional centers supported by contracts with <strong>the</strong> U.S.<br />
Department of Education, Office of Special Education<br />
Programs. PEPNet-Nor<strong>the</strong>ast works with secondary<br />
and postsecondary schools, institutions, school<br />
Outreach -166-<br />
personnel and service providers to enhance<br />
education and training opportunities <strong>for</strong><br />
students who are deaf or hard-of-hearing,<br />
including those with co-occurring disabilities.<br />
The project successfully completed its fourth of<br />
a five-year cycle in September 2010.<br />
The PEPNet-Nor<strong>the</strong>ast central office is located at RIT/NTID, and through <strong>the</strong> coordination of designated<br />
state-based Outreach Specialists, serves <strong>the</strong> following states and territories:<br />
Connecticut Massachusetts Puerto Rico<br />
Delaware New Hampshire Rhode Island<br />
District of Columbia New Jersey U.S. Virgin Islands<br />
Maine New York Vermont<br />
Maryland Pennsylvania<br />
Through collaboration with <strong>the</strong> three o<strong>the</strong>r regional centers located in <strong>the</strong> Midwest, South and Western<br />
regions, PEPNet-Nor<strong>the</strong>ast has implemented a synergistic model of service delivery to a broad national<br />
audience, including secondary and postsecondary school personnel, public and private service<br />
agencies, consumer and professional organizations, state departments of education and various<br />
professional organizations.<br />
New Projects<br />
Highlights of project activities completed during FY 2010 include:<br />
AHEAD and PEPNet Joint Conference. The Association of Higher Education and Disability (AHEAD)<br />
and PEPNet joined toge<strong>the</strong>r to combine AHEAD’s 33 rd annual international conference and PEPNet’s<br />
seventh biennial conference. This event provided one seamlessly integrated place and time <strong>for</strong><br />
attendees from across <strong>the</strong> disability and education communities to come toge<strong>the</strong>r <strong>for</strong> an unparalleled<br />
professional conference. The event took place in Denver, Colo., in summer 2010.<br />
<strong>National</strong> Webcasts. During this reporting period, PEPNet-Nor<strong>the</strong>ast produced three live webcasts to<br />
national audiences. Online Accessible Media was produced in collaboration with Rochester <strong>Institute</strong><br />
of Technology, PEPNet-South, and <strong>the</strong> University of Tennessee at Knoxville. RKIT – An Online<br />
Resource <strong>for</strong> Itinerant Teachers provided an orientation to a comprehensive online reference<br />
resource targeted to teachers as well as o<strong>the</strong>r service providers who work with deaf and hard-ofhearing<br />
students. Impact on Access: Individuals with Cochlear Implants in Educational and<br />
Employment Settings featured a panel of professionals and consumers that shared in<strong>for</strong>mation and<br />
experiences relevant to usage, demographics on, benefits, fiscal/legal responsibilities, and<br />
accommodations provided in education and <strong>the</strong> workplace. The webcasts are archived on <strong>the</strong><br />
national PEPNet website (www.pepnet.org).<br />
Distance Learning Project. PEPNet-Nor<strong>the</strong>ast piloted two additional Developmental English Distance<br />
Learning courses in collaboration with LaGuardia Community College, <strong>the</strong> Hiram G. Andrews Center,<br />
and Nor<strong>the</strong>rn Essex Community College. The two pilot initiatives have involved more than 15<br />
students located in rural or semi-rural locations where access services are not readily available.<br />
The pilot program aims to explore <strong>the</strong> effectiveness of <strong>the</strong> delivery of instruction via accessible<br />
distance technology.<br />
U.S. Virgin Islands Training Program. Following numerous prior attempts, PEPNet-Nor<strong>the</strong>ast<br />
successfully conducted its first training program <strong>for</strong> special education stakeholders serving deaf,<br />
hard-of-hearing and visually challenged consumers in <strong>the</strong> U.S. Virgin Islands. The three-day training
PEPNet-Nor<strong>the</strong>ast (continued)<br />
program was conducted in collaboration with <strong>the</strong> U.S. Virgin Islands Department of Education and<br />
took place on <strong>the</strong> islands of St. Thomas and St. Croix <strong>for</strong> more than 65 vocational rehabilitation<br />
professionals, disability and advocacy personnel, school administrators, teachers and parents.<br />
Partnerships. PEPNet-Nor<strong>the</strong>ast partnered with New England <strong>Technical</strong> Assistance and Continuing<br />
Education Center (TACE) to provide an expanded series of structured training webcasts targeted to<br />
state vocational rehabilitation agencies and partners.<br />
Project Evaluation Activities<br />
Independent Evaluator Focus Groups. Focus group sessions with staff and stakeholders took place<br />
throughout <strong>the</strong> year and were coordinated by <strong>the</strong> project’s Minnesota-based independent evaluator<br />
(Action Consulting and Evaluation Team).<br />
Department of Education Peer Review. PEPNet-Nor<strong>the</strong>ast completed <strong>the</strong> required multi-year ―3+2‖<br />
evaluation required by <strong>the</strong> U.S. Department of Education in order to continue receiving funds during<br />
<strong>the</strong> remaining years of <strong>the</strong> current project cycle. The evaluation process consisted of staff from <strong>the</strong><br />
Department of Education, Division of Research to Practice, Office of Special Education Programs, <strong>the</strong><br />
American <strong>Institute</strong> <strong>for</strong> Research, a representative from <strong>the</strong> independent evaluator team, and a panel<br />
of external reviewers selected by <strong>the</strong> Department of Education. The two-day evaluation process took<br />
place in Washington, D.C. Reviewer feedback and recommendations were very positive and highly<br />
complimentary of <strong>the</strong> activities and documented outcomes achieved by PEPNet-Nor<strong>the</strong>ast, including<br />
collaborative initiatives with <strong>the</strong> three o<strong>the</strong>r PEPNet regional centers.<br />
Regional/<strong>National</strong> Outreach and Training Activities<br />
On-site trainings and professional development activities were conducted by project staff <strong>for</strong> more than<br />
400 school personnel and service providers in <strong>the</strong> Nor<strong>the</strong>ast and in collaboration with <strong>the</strong> three o<strong>the</strong>r<br />
PEPNet regional centers. Topics included Career Awareness, Transition, Literacy and Education of <strong>the</strong><br />
<strong>Deaf</strong>, PEPNet Online Training Programs and Resources, Social Networking to Deliver <strong>Technical</strong><br />
Assistance, and Using <strong>the</strong> Data Analysis System to Respond to Stakeholder Inquiries. Participants in<br />
<strong>the</strong>se training activities included <strong>the</strong> following target audiences:<br />
Itinerant teachers of <strong>the</strong> deaf<br />
Community-based service center staff<br />
State/county school personnel and administrators<br />
Vocational Rehabilitation personnel<br />
Parents of students who are deaf or hard-of-hearing<br />
Community of practice professionals<br />
Support services personnel<br />
Career counselors<br />
O<strong>the</strong>r Activities<br />
Professional Development Mini-Grants. PEPNet-Nor<strong>the</strong>ast offers mini-grants (stipends) to provide<br />
partial support to stakeholders applying <strong>for</strong> professional development opportunities. Applications <strong>for</strong><br />
mini-grants are reviewed on an individual basis. Approval is based on identified needs, statement of<br />
goals, and expected benefits/outcomes consistent with <strong>the</strong> project goals and mission. A total of<br />
46 mini-grants were awarded to stakeholders during this reporting period. Some trainings offered<br />
continuing education credit. Examples of professional development opportunities supported by<br />
mini-grants include continuing education training <strong>for</strong> C-Print ® captionists, incorporating universal<br />
design <strong>for</strong> online access services, and <strong>the</strong> use of accessible technology in support of geographically<br />
distributed teams.<br />
-167-<br />
Outreach
PEPNet-Nor<strong>the</strong>ast (continued)<br />
Exhibiting and Poster Session Activities. During FY 2010, PEPNet-Nor<strong>the</strong>ast exhibited, provided<br />
poster sessions and/or co-sponsored local regional and national conferences that included:<br />
Advanced Job Development Skills Conference – Freeport, Maine<br />
AHEAD/PEPNet Co-Convened Conference – Denver, Colo.<br />
Clarke School <strong>for</strong> <strong>the</strong> <strong>Deaf</strong> Conference – Northampton, Mass.<br />
Educational Support Services Personnel Conference – Syracuse, N.Y.<br />
Imagine RIT Fest – Rochester, N.Y.<br />
Instructional Technology and <strong>Deaf</strong> Education Symposium – Rochester, N.Y.<br />
Maine Center on <strong>Deaf</strong>ness Annual Conference – Portland, Maine<br />
Maryland State Department of Rehabilitation Training Conference – Ocean City, Md.<br />
<strong>National</strong> Association of Relay Administrators Conference – Durham, N.C.<br />
<strong>National</strong> Tele-Rehabilitation Service System Conference – Johnstown, Pa.<br />
New Hampshire Community of Practice Conference – Concord, N.H.<br />
Registry of Interpreters <strong>for</strong> <strong>the</strong> <strong>Deaf</strong> – Albany, N.Y.<br />
Rehabilitation Services Administration, <strong>National</strong> Conference <strong>for</strong> State Coordinators Serving <strong>Deaf</strong>,<br />
<strong>Deaf</strong>-Blind, Hard-of-Hearing and Late <strong>Deaf</strong>ened – Baltimore, Md.<br />
Symposium <strong>for</strong> <strong>Deaf</strong> and Hard-of-Hearing Students – Bergen, N.J.<br />
Texas Statewide Conference on <strong>Deaf</strong>ness – Fort Worth, Texas<br />
Virginia Statewide Conference on <strong>Deaf</strong>ness – Charlottesville, Va.<br />
Regional and <strong>National</strong> Partners. PEPNet-Nor<strong>the</strong>ast has maintained collaborative partnerships with <strong>the</strong><br />
following regional and national organizations and agencies throughout FY 2010:<br />
Association of Higher Education and Disability (AHEAD)<br />
<strong>National</strong> Secondary Transition <strong>Technical</strong> Assistance Center (NSTTAC)<br />
Parent Advocacy Coalition <strong>for</strong> Education Rights (PACER)<br />
<strong>Technical</strong> Assistance Coordinating Center (TACC)<br />
<strong>National</strong> Association of State Directors of Special Education (NASDSE)<br />
<strong>National</strong> Post School Outcome Center<br />
<strong>National</strong> <strong>Deaf</strong>-Blind Project<br />
New England <strong>Technical</strong> Assistance Continuing Education Center<br />
Nor<strong>the</strong>astern University <strong>National</strong> (and Regional) Interpreting Education Center<br />
St. Francis University Center on Excellence <strong>for</strong> Remote and Medically Underserved Areas<br />
Rhode Island School District<br />
Vermont School District<br />
Maine CITE: Statewide Project on Assistive Technology and Universal Design<br />
Hiram G. Andrews Center<br />
Nor<strong>the</strong>rn Essex Community College and Gallaudet Regional Center<br />
Department of Education, U.S. Virgin Islands<br />
PEPNet staff continues to participate in and/or lead <strong>the</strong> following PEPNet <strong>National</strong> Work Groups<br />
established to implement <strong>the</strong> PEPNet <strong>National</strong> Strategic Plan:<br />
College and University Guide<br />
Emerging Technology<br />
Marketing<br />
PEPNet Perspectives Newsletter<br />
Product Development<br />
<strong>Technical</strong> Assistance<br />
Training<br />
Transition<br />
Web Development<br />
PEPNet Evaluation Team<br />
Outreach -168-
Pre-College Outreach<br />
NTID’s Strategic Vision 2010 and Strategic Decisions<br />
2020 called <strong>for</strong> development of an educational<br />
outreach consortium that would allow NTID to share<br />
its expertise to improve <strong>the</strong> education and career<br />
development of individuals who are deaf or hard-ofhearing.<br />
An outgrowth of this decision has been a<br />
series of new outreach initiatives designed to provide<br />
educational experiences <strong>for</strong> students in grades 6–12.<br />
-169-<br />
NTID’s pre-college outreach focuses on<br />
empowering deaf and hard-of-hearing middle<br />
school and secondary students and <strong>the</strong>ir<br />
parents with in<strong>for</strong>mation to help students’ longterm<br />
career success. A special focus of this<br />
ef<strong>for</strong>t is young women and African-American,<br />
Latino-American and Native-American<br />
(AALANA) students.<br />
In 2010, RIT/NTID welcomed more than 600 middle school and high school students and <strong>the</strong>ir parents<br />
from all over <strong>the</strong> country to seven pre-college outreach ef<strong>for</strong>ts—four were outreach competitions and<br />
three were summer camps. Participation is expected to grow annually as marketing and o<strong>the</strong>r<br />
promotional ef<strong>for</strong>ts continue.<br />
Parents, students and teachers alike had high praise <strong>for</strong> <strong>the</strong> 2010 competitions and camps. With <strong>the</strong><br />
success of <strong>the</strong>se initiatives, RIT/NTID is well on <strong>the</strong> way to its goal of making outreach a central focus,<br />
and sharing 40+ years of expertise in access services, program development and <strong>the</strong> application of<br />
technology to ensure that students will possess <strong>the</strong> skills and knowledge necessary to be active<br />
participants in <strong>the</strong> 21 st -century American work<strong>for</strong>ce.<br />
Digital Arts, Film and Animation Competition<br />
<strong>Deaf</strong> and hard-of-hearing students in grades 9–12 submitted<br />
62 entries to <strong>the</strong> 2010 Digital Arts, Film and Animation Competition<br />
in seven different categories: mixed digital media,<br />
Web page design, graphic media, 3-D animation, interactive media,<br />
photo illustration and film. Five winners were selected and invited,<br />
along with a parent, to attend <strong>the</strong> awards ceremony in May 2010, where <strong>the</strong>y received cash prizes and<br />
plaques. Their winning artworks were displayed at <strong>the</strong> RIT Student Alumni Union building.<br />
Math Competition<br />
RIT/NTID’s national Math Competition <strong>for</strong> middle school students challenges <strong>the</strong>ir math skills, develops<br />
<strong>the</strong>ir self-confidence and rewards <strong>the</strong>m <strong>for</strong> <strong>the</strong>ir achievements. Sixty-one students from 17 middle schools<br />
participated in <strong>the</strong> competition at NTID in April 2010. Cash prizes were given to <strong>the</strong> top three teams and<br />
individual winners. NTID worked in close cooperation with <strong>the</strong> national office of MATHCOUNTS ® , which<br />
operates a large successful national competition that has had only<br />
very limited participation from deaf and hard-of-hearing students.<br />
The intent of <strong>the</strong> competition is to foster interest in ma<strong>the</strong>matics, a<br />
national priority.<br />
<strong>National</strong> Science Fair <strong>for</strong> <strong>Deaf</strong> and Hard-of-Hearing Students<br />
In 2010, budding scientists in grades 6–12 from all over <strong>the</strong><br />
United States were invited to submit science project abstracts<br />
<strong>for</strong> review by <strong>the</strong> science fair committee. The students whose<br />
projects were selected were invited to submit a full report on<br />
<strong>the</strong>ir project to NTID science faculty members, who served as<br />
judges. This was <strong>the</strong> fifth year <strong>for</strong> <strong>the</strong> science fair, <strong>the</strong><br />
purpose of which is to encourage students to pursue <strong>the</strong>ir<br />
interest in science. Sixty-six students participated in 2010. Winners in <strong>the</strong> middle school and high school<br />
divisions received cash prizes and plaques.<br />
Outreach
Pre-College Outreach (continued)<br />
SpiRIT Writing Contest<br />
RIT’s fifth annual SpiRIT Writing Contest <strong>for</strong> deaf and hard-of-hearing<br />
students attracted <strong>31</strong> students from <strong>the</strong> 10 th and 11 th grades from around<br />
<strong>the</strong> United States in February 2010. Students and <strong>the</strong>ir teachers<br />
submitted portfolios of <strong>the</strong> students’ best work. The winners received ei<strong>the</strong>r<br />
a full scholarship to NTID’s Explore Your Future program or a $500 cash prize.<br />
Steps to Success<br />
TechGirlz Camp<br />
More than 20 deaf and hard-of-hearing African-American, Latino-American and Native-<br />
American (AALANA) students in grades 7–9 and <strong>the</strong>ir family members attended <strong>the</strong><br />
Steps to Success career exploration mini-camp in August 2010. The students attended<br />
classes designed to expose <strong>the</strong>m to possible career choices and enjoyed hands-on<br />
activities using computers, working with robots, doing science experiments and more.<br />
Parents and guardians benefited from workshops that offered tips on supporting <strong>the</strong>ir<br />
students through <strong>the</strong> college decision-making and selection process.<br />
Here, a group of young<br />
participants in <strong>the</strong> TechGirlz<br />
camp learn how to make dog<br />
tags using a mill machine. The<br />
mill machine cuts <strong>the</strong> metal into<br />
a specific shape, and later, <strong>the</strong><br />
girls use a machine to engrave<br />
<strong>the</strong> tags.<br />
FutureQuest Workshops<br />
Forty-one deaf and hard-of-hearing girls in grades 7–9 attended TechGirlz in<br />
2010 to explore <strong>the</strong>ir interests in science, technology, engineering and math.<br />
The week-long summer camp held in August gave girls <strong>the</strong> opportunity to learn<br />
more about careers in science and technology-related fields. They built <strong>the</strong>ir<br />
own computers, analyzed a ―crime scene‖ and worked with computer-aided<br />
drafting equipment to create a magnifying glass. The program included a daylong<br />
workshop <strong>for</strong> parents that focused on what colleges expect from high<br />
school students, how parents should encourage <strong>the</strong>ir students to prepare <strong>for</strong><br />
college and how to access financial aid.<br />
FutureQuest is a free weekend workshop designed to help deaf and hard-of-hearing high school students<br />
and <strong>the</strong>ir parents plan <strong>for</strong> <strong>the</strong> future, whe<strong>the</strong>r it be <strong>the</strong> transition from high school to college or from high<br />
school to work. Students participate in fun self-awareness activities to explore <strong>the</strong>ir interests, learn what<br />
<strong>the</strong>y’re good at and how things <strong>the</strong>y like to do could become <strong>the</strong>ir focus in college.<br />
Outreach -170-
Pre-College Outreach (continued)<br />
Parents participate in workshops to learn how to best prepare <strong>the</strong>ir children to have a successful future.<br />
They ga<strong>the</strong>r important in<strong>for</strong>mation about financial aspects of college and <strong>the</strong> support and access services<br />
that will help <strong>the</strong>ir child succeed.<br />
FutureQuest presenters are experienced education professionals who help parents and students focus on<br />
strengths and abilities as <strong>the</strong>y consider options and make important decisions about <strong>the</strong> future.<br />
FutureQuest New York City was attended by 38 students, 26 parents and 18 teachers. FutureQuest<br />
Boston was attended by 29 students, 30 parents and 21 teachers. FutureQuest Chicago was attended by<br />
17 students, 18 parents and 19 teachers. FutureQuest Austin (students) and Dallas (parents/teachers)<br />
were attended by 44 students, 68 parents and 17 teachers.<br />
The chart below summarizes participation in NTID outreach programs and lists <strong>the</strong> number of minority<br />
students participating in each event.<br />
Pre-College Outreach AY 2009-2010<br />
Total<br />
Participants<br />
-171-<br />
Minorities<br />
Number Percent<br />
Explore Your Future 217 72 33%<br />
<strong>National</strong> Science Fair 66 25 38%<br />
SpiRIT Writing Contest <strong>31</strong> 5 16%<br />
Digital Arts, Film and Animation 62 14 23%<br />
Math Competition 61 21 34%<br />
Steps to Success 23 22 96%<br />
TechGirlz Camp 41 12 29%<br />
FutureQuest (four sites) 128 79 62%<br />
Project Fast Forward<br />
Project Fast Forward is a project funded in July 2006 by <strong>the</strong> Advanced Technological Education program<br />
of <strong>the</strong> <strong>National</strong> Science Foundation. The project is housed in NTID’s In<strong>for</strong>mation and Computing Studies<br />
Department. The goal of Project Fast Forward is to increase <strong>the</strong> number of deaf and hard-of-hearing<br />
students who pursue a postsecondary education in a computer-related field by creating a pathway <strong>for</strong><br />
students to transition from high school to college in <strong>the</strong> area of in<strong>for</strong>mation technology (IT).<br />
To accomplish this, NTID is partnering with high schools across <strong>the</strong> country to offer dual-credit IT<br />
courses <strong>for</strong> deaf and hard-of-hearing students and professional development <strong>for</strong> teachers and<br />
guidance counselors.<br />
Outreach
Pre-College Outreach (continued)<br />
Original<br />
Partner Schools<br />
2007-08<br />
New<br />
Partner Schools<br />
2008-09<br />
New<br />
Partner Schools<br />
2009-10<br />
Project Fast Forward started with six partner schools in <strong>the</strong> first year of <strong>the</strong> project and has increased to<br />
15 schools in three years. For <strong>the</strong> 2008-2009 school year, <strong>the</strong> project received additional support from a<br />
New York State Postsecondary Vocational and Applied Technology Education (VATEA) grant to expand<br />
recruiting ef<strong>for</strong>ts in New York State. The funding supported, in part, <strong>the</strong> recruitment of <strong>the</strong> three additional<br />
New York partner schools that started teaching dual-credit courses in fall 2009.<br />
Dual-credit courses. Dual-credit courses have been offered <strong>for</strong> three years at our partnering high schools.<br />
Schools have offered one or more of <strong>the</strong> following NTID courses:<br />
Applications Software: an introduction to word processing, spreadsheet, presentation and<br />
database applications<br />
Web Development I: an introduction to Web page development, including XHTML and<br />
Web graphics<br />
Desktop Publishing: an introduction to page layout applications to produce pages and<br />
documents to given specifications<br />
PC Hardware I: an introduction to <strong>the</strong> fundamental hardware concepts of personal computer (PC)<br />
systems including <strong>the</strong>ir structure and components<br />
The course Introduction to Desktop Publishing is offered by <strong>the</strong> NTID Arts and Imaging Studies<br />
Department and demonstrates <strong>the</strong> interest and potential <strong>for</strong> expanding Project Fast Forward to o<strong>the</strong>r<br />
technical programs.<br />
Outreach -172-<br />
1. Florida School <strong>for</strong> <strong>the</strong> <strong>Deaf</strong> and <strong>the</strong> Blind, St. Augustine, Fla.<br />
2. Lexington School <strong>for</strong> <strong>the</strong> <strong>Deaf</strong>, Jackson Heights, Queens, N.Y.<br />
3. Vines High School, Plano, Texas<br />
4. Plano Senior High School, Plano, Texas<br />
5. Rochester School <strong>for</strong> <strong>the</strong> <strong>Deaf</strong>, Rochester, N.Y.<br />
6. University High School, Irvine, Calif.<br />
7. Eastern North Carolina School <strong>for</strong> <strong>the</strong> <strong>Deaf</strong>, Wilson, N.C.<br />
8. Horace Mann School <strong>for</strong> <strong>the</strong> <strong>Deaf</strong>, Allston, Mass.<br />
9. Learning Center <strong>for</strong> <strong>the</strong> <strong>Deaf</strong>, Framingham, Mass.<br />
10. Maryland School <strong>for</strong> <strong>the</strong> <strong>Deaf</strong>, Frederick, Md.<br />
11. Texas School <strong>for</strong> <strong>the</strong> <strong>Deaf</strong>, Austin, Texas<br />
12. WT Woodson High School, Fairfax, Va.<br />
13. Mill Neck Manor School <strong>for</strong> <strong>the</strong> <strong>Deaf</strong>, Mill Neck, N.Y.<br />
14. Murry Bergtraum High School, New York, N.Y.<br />
15. W. Tresper Clarke High School, Westbury, N.Y.
Pre-College Outreach (continued)<br />
Dual-credit course registrations. During <strong>the</strong> three years of offering dual-credit courses, a total of 206<br />
students participated in <strong>the</strong> program at our 15 partner schools. Of those students, 30 took two courses,<br />
<strong>for</strong> a total of 236 registrations in Project Fast Forward dual-credit courses during <strong>the</strong> three years.<br />
School<br />
Year<br />
Number of<br />
Students<br />
Number of<br />
Registrations<br />
-173-<br />
Grades<br />
Awarded<br />
Credit Hours<br />
Awarded<br />
2007-2008 50 60 40 120<br />
2008-2009 72 80 68 204<br />
2009-2010 84 96 67 201<br />
Total 206 236 175 525<br />
Dual-credit grades and credit awarded. Of <strong>the</strong> 236 students registered <strong>for</strong> dual-credit courses during <strong>the</strong><br />
three years, 175 students received passing grades and were awarded RIT credit. A portion of those<br />
students who failed to receive credit did not succeed in <strong>the</strong> course, and o<strong>the</strong>rs did not receive credit<br />
because of <strong>the</strong> high school teachers failing to follow <strong>the</strong> NTID curriculum.<br />
Professional development. Four summer professional development sessions (summer 2007, 2008, 2009<br />
and 2010) have been offered to high school teachers and guidance counselors from our partnering<br />
high schools.<br />
Summer Professional Development Session<br />
2007 2008 2009 2010<br />
Teacher Attendees 7 11 8 3<br />
Counselor Attendees 4 5 6 0<br />
Total 11 16 14 3<br />
The teachers received technical training on course content and teaching methodologies and on improving<br />
access <strong>for</strong> deaf students in mainstream classrooms. Both teachers and counselors received training on IT<br />
career opportunities <strong>for</strong> deaf and hard-of-hearing individuals and on <strong>the</strong> dual-credit program.<br />
Outcomes. The program has been considered an impressive success since original predictions were that<br />
only 65 to 85 students would have qualified <strong>for</strong> and completed a dual-credit course at <strong>the</strong>ir high school by<br />
<strong>the</strong> end of <strong>the</strong> project. Instead, 175 students have earned dual credit. It was also predicted that a total of<br />
20 teachers and 10 counselors would attend <strong>the</strong> professional development activities at NTID during <strong>the</strong><br />
project, while instead <strong>the</strong>re have been 29 teachers and 15 counselors involved in <strong>the</strong> project.<br />
Outreach
Faculty and Staff<br />
NTID’s faculty and staff are dedicated to providing deaf and hard-ofhearing<br />
students with an outstanding educational experience; many<br />
employees have been with NTID <strong>for</strong> 10 to 30 years. Here, associate<br />
professor Antonio Toscano converses with Joel, an Arts and Imaging<br />
Studies student from Chicago, Ill.<br />
-175-<br />
Faculty and Staff<br />
Faculty and<br />
Staff<br />
<strong>National</strong> <strong>Technical</strong> <strong>Institute</strong> <strong>for</strong> <strong>the</strong> <strong>Deaf</strong>
Faculty and Staff Highlights<br />
Attracting and retaining <strong>the</strong> most capable and dedicated faculty and staff members to provide an<br />
exceptional learning environment <strong>for</strong> deaf and hard-of-hearing students is central to fulfilling NTID’s<br />
mission and purpose. NTID’s highly qualified faculty and staff members bring to <strong>the</strong> institute a wide<br />
variety of experiences, skills and backgrounds. Some are veteran educators with many years of higher<br />
education teaching experience, while o<strong>the</strong>rs bring to <strong>the</strong> NTID classroom a wealth of hands-on<br />
knowledge gained from working in business and industry. Among <strong>the</strong> latter group are alumni who, after<br />
gaining significant work experience away from NTID, have returned to <strong>the</strong>ir alma mater to share <strong>the</strong><br />
expertise <strong>the</strong>y have learned on <strong>the</strong> job with a new generation of students.<br />
In 1987, NTID employed 687 faculty and staff. As of fall 2010, with <strong>the</strong> largest number of students in NTID<br />
history, we employ 598.<br />
800<br />
700<br />
600<br />
500<br />
400<br />
300<br />
200<br />
100<br />
0<br />
Faculty and Staff -176-<br />
687<br />
(1987)<br />
598<br />
(2010)
Average Salary: Faculty and Staff<br />
RIT endeavors to maintain faculty salaries that are<br />
on par with <strong>the</strong> colleges and universities with which<br />
it competes. Similarly, RIT provides staff salaries<br />
that are competitive with o<strong>the</strong>r local and regional<br />
colleges and businesses. Annual pay increments<br />
<strong>for</strong> NTID faculty and staff are established by RIT.<br />
Faculty*<br />
Total Number in<br />
Position<br />
-177-<br />
Average Salary<br />
October 2009 – September 2010<br />
Professor 35 $99,501<br />
Associate Professor 58 $79,462<br />
Assistant Professor 53 $64,399<br />
Senior Lecturer 8 $60,230<br />
Lecturer 46 $52,277<br />
Instructor 3 $47,481<br />
Subtotal Faculty 203 $71,594<br />
Staff<br />
Exempt Staff** 130 $62,474<br />
Non-Exempt Staff*** 265 $40,245<br />
Subtotal Staff 395 $47,561<br />
Total 598 $55,720<br />
* Faculty are based on full-time, 9.5 month salaries; visiting faculty are noted within <strong>the</strong>ir rank.<br />
** Based on full-time 12-month salaries.<br />
*** <strong>Technical</strong>, clerical and C-Print ® captionists are based on 35 hours per week/12 months per year. Interpreters are based on 40<br />
hours per week/12 months per year.<br />
Faculty and Staff
Tenure-Track Positions and Faculty Rank<br />
In FY 2010, senior-level faculty members<br />
(professor and associate professor) comprised<br />
68 percent of all ranked tenure-track faculty as<br />
compared to 47 percent in FY 1985. Of <strong>the</strong><br />
133 tenure-track positions, 98 percent are tenured.<br />
The number of tenure-track positions has<br />
decreased from 244 to 133 over <strong>the</strong> past 26 years.<br />
Number of Tenure-Track Positions*<br />
Faculty and Staff -178-<br />
FY 2010<br />
Faculty with Tenure<br />
Rank FY 2006 FY 2007 FY 2008 FY 2009 FY 2010 Number Percent<br />
Professor 34 33 35 40 35 35 100%<br />
Associate Professor 74 68 61 57 55 54 98%<br />
Assistant Professor** 54 50 45 43 42 42 100%<br />
Instructor/Lecturer 2 1 2 1 1 0 0%<br />
Total Positions 164 152 143 141 133 1<strong>31</strong> 98%<br />
* Includes ranked administrators.<br />
** Excluded are assistant professors not in tenure-track positions.
Degree Levels of Tenured and Tenure-Track Faculty<br />
Faculty members join NTID with a wide variety<br />
of backgrounds, including those with substantial<br />
experience in <strong>the</strong> private sector. In FY 2010,<br />
97 percent of full-time, tenure-track faculty<br />
members held graduate degrees.<br />
* Includes ranked administrators.<br />
FY 2010<br />
Highest Degree Level Achieved<br />
Tenure and Tenure-Track Faculty*<br />
Number Percent<br />
Doctorate 48 36%<br />
Master’s 81 61%<br />
Bachelor’s 4 3%<br />
Total 133 100%<br />
-179-<br />
Faculty and Staff
Age, Length of Service and Retirement Status of NTID Faculty and Staff*<br />
NTID’s faculty and staff average 50 years of age<br />
with 15 years of service at NTID. As of October<br />
2010, 34 percent are eligible <strong>for</strong> retirement.**<br />
Percent<br />
Full<br />
Time<br />
Average<br />
Age<br />
Average<br />
Length<br />
of<br />
Service<br />
Faculty and Staff -180-<br />
Age of Faculty/Staff<br />
< 54 55-61 62-64 65-69<br />
>70<br />
Currently in<br />
Retirement<br />
Transition<br />
Professor 100% 61.5 30.9 3 17 8 5 2 2<br />
Associate Professor 100% 59.8 28.9 9 23 12 11 0 2<br />
Assistant Professor 100% 54.1 19.0 17 19 7 1 0 1<br />
Senior Lecturer 100% 55.8 18.7 4 3 0 1 0 0<br />
Lecturer 97% 45.3 4.7 15 2 0 1 0 0<br />
Instructor 100% 39.1 7.9 2 0 0 0 0 0<br />
Exempt Staff 98% 50.2 14.3 61 17 6 7 0 0<br />
Non-Exempt Staff 97% 51.2 12.3 46 12 8 2 0 0<br />
Interpreter 96% 42.9 11.8 92 8 1 3 0 1<br />
C-Print ® 77% 44.8 4.8 34 3 0 0 0 0<br />
Shaniel, a Computer Integrated<br />
Machining Technology major from<br />
Plano, Ill., receives instruction from his<br />
professor, Dr. Sidney McQuay.<br />
* Data not available <strong>for</strong> all faculty and staff.<br />
** To be eligible <strong>for</strong> retirement, an employee’s age and years of service must be greater than or equal to 70, and <strong>the</strong>y must be at<br />
least 55 years of age if hired after 1995, and at least 50 years of age if hired be<strong>for</strong>e 1995.
Faculty and Staff New Hires<br />
The distribution of new hires by category and <strong>for</strong><br />
full-time and part-time positions is shown below.<br />
Full-Time:<br />
-181-<br />
New Hires<br />
FY 2006 FY 2007 FY 2008 FY 2009 FY 2010<br />
Faculty 8 10 13 11 13<br />
Exempt Staff 29 8 8 12 14<br />
Non-Exempt Staff* 3 19 28 18 24<br />
Total Full-Time 40 37 49 41 51<br />
Part-Time:<br />
Faculty 2 1 0 0 1<br />
Exempt Staff 5 0 1 1 1<br />
Non-Exempt Staff* 26 10 9 1 6<br />
Total Part-Time 33 11 10 2 8<br />
Total 73 48 59 43 59<br />
* Includes technical, clerical, C-Print ® captionists and interpreters.<br />
Faculty and Staff
Faculty and Staff Terminations<br />
The faculty and staff turnover rate, 8.9 percent, is a<br />
dramatic increase from last year. Retirements of<br />
current faculty and staff increased and are<br />
expected to continue to increase in <strong>the</strong> near future.<br />
Recruitment of individuals to serve our students will<br />
be a priority in <strong>the</strong> coming years.<br />
FY 2006 FY 2007 FY 2008 FY 2009 FY 2010<br />
Full-Time/Part-Time Percent Number<br />
Faculty 6.5% 5.9% 6.7% 2.5% 6.9% 14<br />
Exempt Staff* 7.8% 14.8% 6.6% 6.9% 10.0% 13<br />
Non-Exempt Staff** 6.3% 0.7% 12.7% 4.2% 9.8% 26<br />
Total 7.0% 8.1% 9.4% 4.2% 8.9% 53<br />
* Includes all exempt staff and educational development and research faculty.<br />
** Includes technical, clerical, C-Print ® captionists and interpreters.<br />
Faculty and Staff -182-
RIT/NTID Leadership<br />
NTID Dean Emeritus and Interim President James J. DeCaro<br />
congratulates a new graduate at NTID’s commencement.<br />
DeCaro served as dean of NTID <strong>for</strong> 14 of <strong>the</strong> 39 years he has<br />
worked at <strong>the</strong> college.<br />
-183-<br />
RIT/NTID Leadership<br />
RIT/NTID<br />
Leadership<br />
<strong>National</strong> <strong>Technical</strong> <strong>Institute</strong> <strong>for</strong> <strong>the</strong> <strong>Deaf</strong>
NTID Administrative Team<br />
Dr. T. Alan Hurwitz<br />
President, NTID<br />
Vice President and Dean, RIT<br />
(Until <strong>December</strong> <strong>31</strong>, 2009)<br />
Donald Beil<br />
Executive Assistant to <strong>the</strong><br />
President, NTID<br />
(Until <strong>December</strong> <strong>31</strong>, 2009)<br />
Dr. Laurie Brewer<br />
Vice Dean and Interim<br />
Associate Vice President <strong>for</strong><br />
Academic Affairs<br />
Dr. Robb Adams<br />
Interim Associate Dean <strong>for</strong><br />
Student and Academic Services<br />
(Effective <strong>December</strong> 1, 2009)<br />
RIT/NTID Leadership -184-<br />
Dr. James J. DeCaro<br />
Interim President, NTID<br />
Interim Vice President and<br />
Dean, RIT<br />
(Effective <strong>December</strong> 1, 2009<br />
until <strong>December</strong> <strong>31</strong>, 2010)<br />
Dr. Jeffrey Porter<br />
Interim Executive Assistant<br />
to <strong>the</strong> President, NTID<br />
(Effective <strong>December</strong> 1, 2009<br />
until <strong>December</strong> <strong>31</strong>, 2010)<br />
Dr. Gerard Buckley<br />
Assistant Vice President<br />
<strong>for</strong> College Advancement;<br />
(NTID President, effective<br />
January 1, 2011)<br />
Albert Smith<br />
Assistant Vice President<br />
<strong>for</strong> College Operations<br />
(Until November 15, 2010)
NTID Administrative Team (continued)<br />
Erwin Smith<br />
Assistant Vice President <strong>for</strong><br />
Finance and Operations<br />
(Effective November 1, 2010)<br />
Dr. Stephen Aldersley<br />
Associate Dean <strong>for</strong><br />
Academic Administration<br />
Pamela Carmichael<br />
Director, Marketing<br />
Communications<br />
-185-<br />
Mike Servé<br />
Director, Financial<br />
Planning and Budgeting<br />
Steve Nelson<br />
Director, Access Services<br />
RIT/NTID Leadership
NTID <strong>National</strong> Advisory Group<br />
The <strong>National</strong> Advisory Group advises <strong>the</strong> NTID<br />
president / RIT vice president and dean <strong>for</strong> NTID in<br />
developing and carrying out policies governing <strong>the</strong><br />
operation and direction of <strong>the</strong> institute. The<br />
<strong>National</strong> Advisory Group comprises professionals<br />
Active Members<br />
Elizabeth Ayers Gibson<br />
Advanced Practice Sonographer, Virginia Mason Medical Center<br />
Andrew N. Brenneman<br />
Senior <strong>National</strong> Account Executive, Sprint Nextel<br />
RIT/NTID Leadership -186-<br />
concerned with <strong>the</strong> education of deaf and hard-ofhearing<br />
students, professionals concerned with<br />
postsecondary education and individuals familiar<br />
with <strong>the</strong> need <strong>for</strong> <strong>the</strong> services provided<br />
by NTID.<br />
Dr. Richard V. Burkhauser<br />
Sarah Gibson Blanding Professor of Policy Analysis in <strong>the</strong> Department of Policy Analysis and<br />
Management, Cornell University<br />
L’Tanya Fish<br />
Adjunct Professor, Winston-Salem State University Rehabilitation Counseling Studies &<br />
<strong>Deaf</strong>ness Program<br />
Claudia Gordon, Esq.<br />
Special Assistant to <strong>the</strong> Director, Office of Federal Contract Compliance Programs, U.S. Department<br />
of Labor<br />
Dr. Ca<strong>the</strong>rine Hunt<br />
Senior R&D Director External Science and Technology, DOW Chemical Company<br />
Cinda Lautenschlegar<br />
Lead Senior Air Pollution Control Engineer, Connecticut Department of Environmental Protection<br />
Lauren Lercher<br />
Research Teaching Specialist, Department of Neuroscience and Cell Biology, University of Medicine and<br />
Dentistry of New Jersey<br />
Jon Levy<br />
Principal, Orange County Department of Education Regional <strong>Deaf</strong> and Hard-of-Hearing Program<br />
James Meisser<br />
Director and Chief Risk Officer, Lake Shore Wisconsin Corporation<br />
Dr. Harold Mowl<br />
Superintendent/CEO, Rochester School <strong>for</strong> <strong>the</strong> <strong>Deaf</strong><br />
Dr. Angel Ramos<br />
Superintendent, Sequoia School <strong>for</strong> <strong>the</strong> <strong>Deaf</strong> and Hard-of-Hearing<br />
Dr. Susan Salvador<br />
Vice President, Student Affairs, Monroe Community College<br />
Thomas Samuels<br />
Assistant to <strong>the</strong> Director (retired), Program <strong>for</strong> <strong>Deaf</strong> Adults, LaGuardia Community College
NTID <strong>National</strong> Advisory Group (continued)<br />
Laurance War<strong>for</strong>d<br />
Senior Work<strong>for</strong>ce Consultant, League <strong>for</strong> Innovation in <strong>the</strong> Community College<br />
Sara Weiner-Collier<br />
Project Coordinator, Women with Disabilities Health Equity Coalition, Oregon Health and<br />
Science University<br />
U.S. Department of Education<br />
Annette Reichman<br />
Director/Liaison, Office of Special Institutions<br />
U.S. Government Representatives<br />
The Honorable Charles E. Schumer<br />
Member, U.S. Senate, New York State<br />
The Honorable Louise M. Slaughter<br />
Member, U.S. House of Representatives, New York State<br />
Honorary Members<br />
W. Frank Blount<br />
Chairman and Chief Executive Officer, JI Ventures Inc.<br />
The Honorable Hugh L. Carey<br />
Former Governor, New York State<br />
Nanette Fabray MacDougall<br />
Actress<br />
Jane Ratcliffe Pulver<br />
Emeritus Member, RIT Board of Trustees; Active Member, NTID Foundation Board; Trustee,<br />
Pennsylvania School <strong>for</strong> <strong>the</strong> <strong>Deaf</strong><br />
-187-<br />
RIT/NTID Leadership
NTID Foundation Board<br />
The NTID Foundation is an organization of<br />
volunteers committed to <strong>the</strong> advancement of career<br />
development and personal growth opportunities <strong>for</strong><br />
deaf and hard-of-hearing students at NTID. It<br />
serves as a link through which foundation board<br />
Active Members:<br />
Richard C. Adamany<br />
Chief Executive Officer, Swiss+Tech Products<br />
Vicky Adamany<br />
RIT/NTID Leadership -188-<br />
members external to <strong>the</strong> institute foster<br />
involvement and private investment to enrich <strong>the</strong><br />
quality and vitality of <strong>the</strong> learning environment<br />
at NTID.<br />
Gary W. Behm ‘81<br />
Instructional/Support Faculty, Engineering Studies, Rochester <strong>Institute</strong> of Technology<br />
Arthur Carroll<br />
Chief <strong>Technical</strong> Officer, Eastman Kodak Company<br />
Gracie P. Coleman<br />
President, Coleman Consulting Services<br />
Meredith M. Crane<br />
Former Executive Director, <strong>Deaf</strong> Initiatives, Inc.<br />
Michael Ellis<br />
<strong>National</strong> Sales Manager, Sprint Relay<br />
Max Factor III<br />
Attorney at Law, Factor Mediation and Arbitration Services, Inc.<br />
Dr. Mary Jane Hellyar<br />
Retired Executive Vice President, Film & Photofinishing Systems Group, Eastman Kodak Company<br />
Gretchen Logue<br />
Kenneth Logue<br />
Sales Manager, ITW Labels<br />
Steven M. Morse<br />
Executive Director, <strong>Institute</strong> Audit, Rochester <strong>Institute</strong> of Technology<br />
Jane Ratcliffe Pulver<br />
Emeritus Member, RIT Board of Trustees<br />
Robert W. Rice ’94, ’97 MBA (Chairman)<br />
President and Managing Partner, BayFirst Solutions, LLC<br />
James J. Stefano<br />
Vice President, Client Services, Synergy Global Solutions<br />
Ricky Thomas<br />
Partner, Maguire & Moore Capital Advisors, Inc.<br />
Christopher Wagner ‘94<br />
Vice President of Marketing, CSDVRS, LLC
NTID Foundation Board (continued)<br />
Cynthia F. Walker<br />
George D. Webb II<br />
Retired Senior Vice President <strong>for</strong> Operations, Great West Life & Annuity Insurance Co.<br />
Diane Weihs<br />
Gary Weihs<br />
Senior Director, Tomato-Based Strategic Development, ConAgra Foods<br />
Sandra Weintraub<br />
Dr. Steven Weintraub, MD<br />
Medical Director, North Shore LIJ, Department of Anes<strong>the</strong>sia<br />
-189-<br />
RIT/NTID Leadership
RIT Officers<br />
Dr. William W. Destler<br />
President<br />
Dr. Donald Boyd<br />
Vice President, Research<br />
Lisa Cauda<br />
Vice President, Development and Alumni Relations<br />
Dr. Mary-Beth A. Cooper<br />
Senior Vice President, Student Affairs<br />
Dr. Jeremy Haefner<br />
Provost / Senior Vice President, Academic Affairs<br />
Dr. James J. DeCaro<br />
Interim President, NTID / Vice President and Dean, RIT<br />
Dr. Ka<strong>the</strong>rine Mayberry<br />
Vice President, Special Projects<br />
Dr. James G. Miller<br />
Senior Vice President, Enrollment Management and Career Services<br />
Deborah Stendardi<br />
Vice President, Government and Community Relations<br />
Dr. James H. Watters<br />
Senior Vice President, Finance and Administration<br />
RIT/NTID Leadership -190-
RIT Board of Trustees Active Members<br />
Kathleen Anderson<br />
’94; Media Director, Travers Collins & Company (TCC)<br />
Willem Appelo<br />
Senior Vice President, Xerox Corporation<br />
Donald N. Boyce<br />
BS ’67; Chair, Board of Trustees, Rochester <strong>Institute</strong> of Technology; Retired Chairman of <strong>the</strong> Board,<br />
IDEX Corporation<br />
Andrew N. Brenneman<br />
AS ’86, BS ’88; Senior Account Executive, Sprint Nextel; also serves as NTID <strong>National</strong> Advisory<br />
Group Representative<br />
Irene Taylor Brodsky<br />
Producer, Director, Writer and Cinematographer, Vermilion Pictures, Inc.<br />
Charles S. Brown, Jr.<br />
MBA ’79; Director <strong>for</strong> <strong>the</strong> Rochester Area Colleges Center <strong>for</strong> Excellence in Math and Science,<br />
Nazareth College<br />
Judy B. von Bucher<br />
William A. Buckingham<br />
BS ’64; Chair Emeritus, Board of Trustees, Rochester <strong>Institute</strong> of Technology; Retired Executive Vice<br />
President, M&T Bank<br />
David J. Burns<br />
President and Chief Operating Officer, Ex One Corporation<br />
Ann L. Burr<br />
Chairman and General Manager, Frontier Communications of Rochester, Frontier Communications Corp.,<br />
Citizens Communications<br />
Essie L. Calhoun<br />
Chief Diversity Officer and Director, Community Affairs Vice President, Eastman Kodak Company<br />
Mark C. Clement<br />
President and Chief Executive Officer, Rochester General Health System; President, Rochester<br />
General Hospital<br />
Thomas Curley<br />
MBA ’77; President and Chief Executive Officer, The Associated Press<br />
William W. Destler<br />
President, Rochester <strong>Institute</strong> of Technology<br />
Robert A. Dobies<br />
Retired Vice President, ExxonMobil Chemical Company<br />
Donna J. Ehrhart<br />
Professor of Business Computer and In<strong>for</strong>mation Systems, Genesee Community College; Women’s<br />
Council Representative, Rochester <strong>Institute</strong> of Technology<br />
-191-<br />
RIT/NTID Leadership
RIT Board of Trustees Active Members (continued)<br />
Nancy L. Fein<br />
BS ’76; Vice President of Lexus Service, Parts, Customer Satisfaction and Training,<br />
Toyota Motor Sales, USA<br />
B. Thomas Golisano<br />
Chairman, Paychex, Inc.<br />
Arthur A. Gosnell<br />
Chairman and Chief Executive Officer, Stonehurst Capital LLC<br />
Bart G. Guerreri<br />
Chairman and Chief Executive Officer, DSD Laboratories, Inc.<br />
Brian H. Hall<br />
MBA ’78; Vice Chair, Board of Trustees, Rochester <strong>Institute</strong> of Technology; Retired Vice Chairman,<br />
The Thomson Corporation<br />
Jeffrey K. Harris<br />
BS ’75; Corporate Vice President, Lockheed Martin<br />
Frank S. Hermance<br />
BS ’71, MS ’73; Chairman and Chief Executive Officer, AMETEK, Inc.<br />
Susan R. Holliday<br />
MBA ’85; President and Publisher, Rochester Business Journal<br />
Jay T. Holmes<br />
Retired Executive Vice President and Chief Administrative Officer, Bausch & Lomb, Inc.<br />
Samuel Tom Hubbard Jr.<br />
Retired Chairman, High Falls Brewing Company, LLP<br />
Thomas F. Judson Jr.<br />
Chairman and Chief Executive Officer, The Pike Company<br />
Richard A. Kaplan<br />
Chief Executive Officer, Torvec Inc.<br />
Kraig H. Kayser<br />
President and Chief Executive Officer, Seneca Foods Corporation<br />
Joyce B. Klemmer<br />
BS ’78; Partner, Smith, Gambrell and Russell LLP<br />
David Koretz<br />
’97; President and Chief Executive Officer, BlackTie, Inc.<br />
Gary J. Lindsay<br />
BS ’64; C.P.A.<br />
Joseph M. Lobozzo II<br />
MBA ’95; Chairman of <strong>the</strong> Board, JML Optical Industries, Inc.<br />
Lawrence J. Matteson<br />
Retired Vice President, Imaging and In<strong>for</strong>mation Systems, Eastman Kodak Company<br />
RIT/NTID Leadership -192-
RIT Board of Trustees Active Members (continued)<br />
Roosevelt Mercer, Jr.<br />
Vice President and Director, ISR Space Systems Division, ITT Industries<br />
Harold M. Mowl<br />
Superintendent and Chief Executive Officer, Rochester School <strong>for</strong> <strong>the</strong> <strong>Deaf</strong>; also serves as NTID <strong>National</strong><br />
Advisory Group Representative<br />
Brian P. O’Shaughnessy, Esq.<br />
BS ’81, MS ’84; Shareholder, Buchanan Ingersoll & Rooney, PC<br />
Sandra A. Parker<br />
Chief Executive Officer, Rochester Business Alliance, Inc.<br />
Wolfgang Pfizenmaier<br />
Retired Member of <strong>the</strong> Management Board, Heidelberger Druckmaschinen AG<br />
Gerard Q. Pierce<br />
MBA ’77; Senior Vice President <strong>for</strong> Human Resources, Wegmans Food Markets, Inc.<br />
Susan M. Puglia<br />
Vice President, IBM; Process Trans<strong>for</strong>mation <strong>for</strong> Development and <strong>Technical</strong> Support, IBM Corporation<br />
Thomas S. Richards<br />
Corporation Counsel, City of Rochester<br />
Susan J. Riley<br />
BS ’81; Executive Vice President, The Children’s Place<br />
Richard E. Sands<br />
Chairman, Constellation Brands, Inc.<br />
Janet F. Sansone<br />
Chief Management Officer, The United States Government Printing Office<br />
Carl E. Sassano<br />
’72; Chairman of <strong>the</strong> Board, Transcat, Inc.<br />
Frank S. Sklarsky<br />
Chief Financial Officer and Executive Vice President, Eastman Kodak Company<br />
Kevin J. Surace<br />
’85; Chief Executive Officer, Serious Materials<br />
Sharon Ting<br />
Partner, Axialent, Inc.<br />
Harry P. Trueheart III<br />
Chairman, Nixon Peabody LLP<br />
Donald J. Truesdale<br />
BS ’87; Partner, Goldman, Sachs & Co.<br />
Chester N. Watson<br />
BS ’74; General Auditor, General Motors Corporation<br />
-193-<br />
RIT/NTID Leadership
RIT Board of Trustees Active Members (continued)<br />
Robert D. Wayland-Smith<br />
Retired Vice President and Manager, Upstate Trust and Investment Division, Chase Manhattan<br />
Bank, N.A.<br />
Christine B. Whitman<br />
Vice Chair, Board of Trustees, Rochester <strong>Institute</strong> of Technology; Chairman and Chief Executive Officer,<br />
Complemar Partners, Inc.<br />
Ronald L. Zarrella<br />
Chairman Emeritus, Bausch & Lomb, Inc.<br />
RIT/NTID Leadership -194-
Results of Financial Operations<br />
Federal funds received by NTID enable <strong>the</strong> institute to provide deaf<br />
and hard-of-hearing students with a state-of-<strong>the</strong>-art education. In<br />
this picture, students at RIT’s Convocation <strong>for</strong> New Students and<br />
Families sign and sing The Star-Spangled Banner.<br />
-195-<br />
Results of Financial Operations<br />
Results of<br />
Financial Operations<br />
<strong>National</strong> <strong>Technical</strong> <strong>Institute</strong> <strong>for</strong> <strong>the</strong> <strong>Deaf</strong>
Financial Operations Highlights<br />
In fiscal year 2010, NTID received $63,037,000 in federal support to operations. This was <strong>the</strong> same level<br />
of appropriation that was granted in fiscal year 2009. In addition to our federal funding, NTID collected<br />
non-federal revenue of $22,849,300 in <strong>the</strong> <strong>for</strong>m of tuition, room, board and fees, a 4.4 percent increase<br />
over <strong>the</strong> previous year. This non-federal revenue increase resulted from <strong>the</strong> combination of significant<br />
enrollment and tuition rate increases. Combined revenues <strong>for</strong> operations totaled $85,886,300 and<br />
represented a 1.1 percent increase over fiscal year 2009.<br />
Total compensation grew by 6.8 percent in 2010. Salaries and wages increased by 3.8 percent while<br />
benefits grew by 16.7 percent. Benefit expenditures are subject to fluctuation as rates paid in previous<br />
years are subject to adjustment <strong>for</strong> actual costs incurred. Compensation represents 53 percent of NTID<br />
expenditures <strong>for</strong> operations.<br />
RIT Services account <strong>for</strong> 35 percent of operations, including payments to our host institution <strong>for</strong> physical<br />
plant services, residence halls and food services, tuition payments <strong>for</strong> our students taking courses in<br />
o<strong>the</strong>r RIT colleges and indirect overhead payments <strong>for</strong> centralized services such as accounting, human<br />
resources, bursar functions and libraries.<br />
Residence hall and food service expenditure growth reflects <strong>the</strong> impact of NTID’s growing enrollment.<br />
Physical Plant services expenditures reflect increases in utilities and facility maintenance.<br />
The indirect costs or overhead is levied based on an allocation which is reviewed and approved annually<br />
by <strong>the</strong> Division of Cost Allocations in <strong>the</strong> Department of Health and Human Services. Overhead costs<br />
represent charges <strong>for</strong> services provided by RIT that benefit <strong>the</strong> entire campus but which are not<br />
specifically identifiable with a particular college or department. The president’s office and <strong>the</strong> human<br />
resources division represent <strong>the</strong> types of costs that are allocated through overhead. In general, NTID is<br />
allocated a proportion of <strong>the</strong>se costs based on <strong>the</strong> relative size of NTID to <strong>the</strong> rest of RIT.<br />
In 2010, NTID continued to direct additional funds <strong>for</strong> scholarships <strong>for</strong> incoming students. We have<br />
found this to be a very successful strategy <strong>for</strong> increasing our enrollments <strong>for</strong> incoming students meeting<br />
admissions standards.<br />
NTID development ef<strong>for</strong>ts are greatly enhanced by <strong>the</strong> ability to assure donors that <strong>the</strong>ir contributions will<br />
be matched on a dollar-<strong>for</strong>-dollar basis. In 2010 NTID directed $1.1 million of its operational resources to<br />
<strong>the</strong> Matching Endowment Program <strong>for</strong> that purpose.<br />
Results of Financial Operations -196-
Financial Operating Results<br />
In FY 2010, NTID received <strong>the</strong> same level of<br />
federal support <strong>for</strong> operations as in FY 2009,<br />
$63,037,000. Of that total, $1,102,800 was directed<br />
to <strong>the</strong> Matching Endowment Program. In addition,<br />
EXPENSES<br />
FY 2009<br />
NTID collected $22,849,300 in non-federal revenue<br />
in <strong>the</strong> <strong>for</strong>m of tuition, room, board and fees. Total<br />
revenue <strong>for</strong> operations, $85,886,300, represented<br />
a 1.1 percent increase over FY 2009.<br />
-197-<br />
FY 2010<br />
Variance $<br />
Variance %<br />
Personnel Compensation Expenditures<br />
Salaries and Wages $32,773,600 $34,027,700 $1,254,100 3.8%<br />
Benefits 9,779,000 11,416,200 1,637,200 16.7%<br />
Total Personnel Compensation $42,552,600 $45,443,900 $2,891,300 6.8%<br />
RIT Services Expenditures<br />
Direct:<br />
Residence Halls/Food Service,<br />
Student Services $7,528,600 $8,273,100 $744,500 9.9%<br />
Cross-Registered Tuition 6,956,800 6,829,600 (127,200) -1.8%<br />
Physical Plant Services 1,885,000 2,092,900 207,900 11.0%<br />
Indirect:<br />
Overhead 12,192,800 12,641,100 448,300 3.7%<br />
Total RIT Services $28,563,200 $29,836,700 $1,273,500 4.5%<br />
O<strong>the</strong>r Expenditures<br />
Support Expenditures $4,378,600 $4,716,100 $337,500 7.7%<br />
Grant Cost Shares 619,700 496,700 (123,000) -19.8%<br />
Financial Aid 2,498,600 2,535,500 36,900 1.5%<br />
Capital 1,178,400 2,712,900 1,534,500 130.2%<br />
Matching Endowment 784,000 1,102,800 <strong>31</strong>8,800 40.7%<br />
Plant Fund 4,343,500 (958,300) (5,301,800) -122.1%<br />
Total O<strong>the</strong>r $13,802,800 $10,605,700 ($3,197,100) -23.2%<br />
Total Expenses $84,918,600 $85,886,300 $967,700 1.1%<br />
REVENUE<br />
Federal Appropriation $63,037,000 $63,037,000 $0 0.0%<br />
Non-federal Funds 21,881,600 22,849,300 967,700 4.4%<br />
Total Revenue $84,918,600 $85,886,300 $967,700 1.1%<br />
Results of Financial Operations
Tuition, Room, Board and O<strong>the</strong>r Fees<br />
Tuition increased by 4.4 percent, while room, board<br />
and o<strong>the</strong>r fees increased by 2.7 percent, <strong>for</strong> a total<br />
combined increase of 3.6 percent. These nonfederal<br />
resources constitute 27 percent of NTID’s<br />
total operating revenue.<br />
Results of Financial Operations -198-<br />
Rates Charged Students<br />
FY 2006 FY 2007 FY 2008 FY 2009 FY 2010<br />
Tuition $7,992 $8,559 $9,153 $9,801 $10,233<br />
Room 4,863 5,034 5,211 5,421 5,583<br />
Board 3,588 3,714 3,843 3,960 4,059<br />
Fees 618 642 669 702 717<br />
Total $17,061 $17,949 $18,876 $19,884 $20,592<br />
Collections $15,382,500 $16,607,500 $19,343,000 $21,881,600 $22,849,300<br />
Enrollment (Fall) 1,256 1,250 1,343 1,450 1,474<br />
Collections Per Student $12,247 $13,286 $14,403 $15,091 $15,502
Financial Aid<br />
The average student receives significant financial aid to apply<br />
against tuition, room, board, fees, books, transportation and<br />
o<strong>the</strong>r expenses.<br />
-199-<br />
Financial Aid<br />
Financial Aid<br />
<strong>National</strong> <strong>Technical</strong> <strong>Institute</strong> <strong>for</strong> <strong>the</strong> <strong>Deaf</strong>
Financial Aid (Domestic Students)<br />
Financial aid awards to students totaled<br />
$20.4 million in 2010, a 12.1 percent increase over<br />
2009. Fewer students received institutionally<br />
sponsored aid, resulting in a 7.4 percent decline in<br />
awards. Conversely <strong>the</strong> number of Pell grants grew<br />
by 27 percent with <strong>the</strong> average award growing by<br />
19 percent – increasing <strong>the</strong> total amount of<br />
Financial Aid -200-<br />
<strong>the</strong> grants by 51.2 percent. More significantly <strong>the</strong>re<br />
was a 30.4 percent increase in <strong>the</strong> number of loans<br />
taken out by students. Student loans in 2010<br />
comprised 26 percent of total financial aid awarded<br />
to students, up from 22 percent in 2009.<br />
SOURCE OF AID 2009* 2010*<br />
Awards* Amount Awards* Amount DIFF %<br />
INSTITUTIONALLY SPONSORED SUPPORT<br />
Grant-in-Aid:<br />
NTID Grant-in-Aid 392 $1,<strong>31</strong>5,198 324 $1,076,232 -18.2%<br />
RIT Grant-in-Aid 32 $100,588 39 $98,712 -1.9%<br />
Subtotal Grant-in-Aid 424 $1,415,786 363 $1,174,944 -17.0%<br />
Scholarships:<br />
NTID Merit 386 $1,147,237 455 $1,260,718 9.9%<br />
RIT Merit 49 $76,057 82 $122,085 60.5%<br />
NTID Endowments 429 $620,872 363 $546,389 -12.0%<br />
External Groups 125 $281,828 84 $176,158 -37.5%<br />
Subtotal Scholarships 989 $2,125,994 984 $2,105,350 -1.0%<br />
Subtotal Institutionally Sponsored Support 1,413 $3,541,780 1,347 $3,280,294 -7.4%<br />
STATE AND FEDERAL SUPPORT<br />
Grants:<br />
Pell Grants 532 $1,839,938 676 $2,781,909 51.2%<br />
State Grants 235 $549,382 251 $548,863 -0.1%<br />
Subtotal Grants 767 $2,389,320 927 $3,330,772 39.4%<br />
O<strong>the</strong>r Federal Support:<br />
Vocational Rehabilitation 873 $8,192,636 905 $8,377,642 2.3%<br />
Federal Work Study 40 $39,916 26 $42,066 5.4%<br />
Subtotal O<strong>the</strong>r Support 913 $8,232,552 9<strong>31</strong> $8,419,708 2.3%<br />
Subtotal State and Federal Support 1,680 $10,621,872 1,858 $11,750,480 10.6%<br />
LOANS<br />
Subsidized Federal Student Loan 512 $1,982,728 602 $2,399,348 21.0%<br />
Unsubsidized Federal Student Loan 385 $1,541,057 582 $2,426,567 57.5%<br />
Parent PLUS Loans 63 $536,972 68 $568,455 5.9%<br />
Subtotal Loans 960 $4,060,757 1,252 $5,394,370 32.8%<br />
TOTAL ALL FINANCIAL AID 4,053 $18,224,409 4,457 $20,425,144 12.1%<br />
Domestic Student Enrollment 1,412 1,432 1.4%<br />
Average Financial Aid per Student $12,907 $14,263 10.5%<br />
Average Financial Aid per Student<br />
Excluding Loans $10,0<strong>31</strong> $10,496 4.6%<br />
* Students receive more than one <strong>for</strong>m of aid; <strong>the</strong>re<strong>for</strong>e <strong>the</strong> numbers of awards (grants, loans, scholarship, etc.) outnumber <strong>the</strong><br />
student body.
External Funding Sources<br />
NTID’s Student Development Center<br />
The substantial external funds that NTID has raised demonstrate <strong>the</strong><br />
institute’s commitment to seeking alternate sources of support.<br />
-201-<br />
External Funding Sources<br />
External Funding<br />
Sources<br />
<strong>National</strong> <strong>Technical</strong> <strong>Institute</strong> <strong>for</strong> <strong>the</strong> <strong>Deaf</strong>
The NTID Foundation<br />
NTID received $2,696,501 in gift income and<br />
deferred bequest intentions <strong>for</strong> FY 2010. These<br />
dollars were designated to support our endowed<br />
scholarship funds, equipment upgrades to<br />
classrooms and laboratories, artwork, <strong>the</strong><br />
Contributions of $1,000 and above received during FY 2010 include:<br />
$1,000,000 and Above Level: The Nippon Foundation<br />
$200,000 - $999,999 Level: The Estate of Joseph F. Dyer<br />
$50,000 - $99,999 Level: Ms. Renate K. Alpert<br />
The Gladys Brooks Foundation<br />
The Heinz Endowments<br />
Johnson Scholarship Foundation<br />
Max Factor Family Foundation<br />
Silicon Valley Community Foundation<br />
Sprint Relay<br />
$20,000 - $49,999 Level:<br />
External Funding Sources -202-<br />
per<strong>for</strong>ming arts program, <strong>the</strong> CSD Student<br />
Development Center, <strong>the</strong> International Hearing and<br />
Speech Center, <strong>the</strong> Joseph F. and<br />
Helen C. Dyer Arts Center and <strong>the</strong> PEN-<br />
International project.<br />
The Estate of Dr. Eleanor D. Rosenfield<br />
Cisco Systems, Inc.<br />
Drs. William Destler and Rebecca Johnson<br />
Dr. Harold M. and Mary Mowl<br />
United States – Japan Foundation<br />
$10,000 - $19,999 Level: Brite Computers<br />
Ewing Marion Kauffman Foundation<br />
Dr. Mary Jane Hellyar<br />
Monroe County Medical Examiner’s Office<br />
John and Joanne Smith<br />
Sorenson Communications, Inc.<br />
Paul L. and Sally A. Taylor<br />
$5,000 - $9,999 Level:<br />
$2,500 - $4,999 Level:<br />
Apple Inc.<br />
Mr. and Mrs. William A. Buckingham<br />
Dr. Robert R. and Donna E. Davila<br />
Dr. T. Alan and Vicki T. Hurwitz<br />
Jephson Educational Trust<br />
Andrew N. and Mary E. Brenneman<br />
Mat<strong>the</strong>w Garland<br />
Graphic Arts Education and Research Foundation<br />
Barbara Mayers<br />
Donald W. and Jane R. Pulver<br />
Rochester Area Community Foundation<br />
Solon E. Summerfield Foundation, Inc.<br />
Sprint Foundation<br />
Louis S. and Molly B. Wolk Foundation<br />
Webb Family Foundation<br />
Barbara and Donald Zucker Foundation
The NTID Foundation (continued)<br />
$1,000 - $2,499 Level:<br />
Bequest Intentions/Estate Planning<br />
BayFirst Solutions LLC<br />
Dr. Laurie C. Brewer<br />
Dianne K. Brooks<br />
Dr. Richard and Ginger Burkhauser<br />
Dr. Karen K. Conner<br />
Dr. James J. and Patricia A. DeCaro<br />
Enfocus Software, Inc.<br />
Dr. Terry and Gail Feigenbaum<br />
Dr. D. Robert Frisina<br />
Gannett Foundation, Inc.<br />
Thomas Gibbons and Linda Siple<br />
Dr. Robert P. and Mary B. Gulick<br />
Dr. Robert I. and Evelyn K. Harris<br />
Interpretek<br />
Andrew R. Jacobson<br />
Dr. Ronald R. and Lyn S. Kelly<br />
Dr. Howard M. and Zje L. Koft<br />
Dr. Marvin and Elaine Lessig<br />
Martin G. Lichtenstein<br />
Lima Design, Inc.<br />
Dr. Mat<strong>the</strong>w A. Lynn<br />
Bruce A. and Kathleen M. Martin<br />
Dr. Stanley D. McKenzie<br />
Steven M. and Kimberly Morse<br />
Dr. Robert F. Panara<br />
Rainbow Alliance of <strong>the</strong> <strong>Deaf</strong>, Inc.<br />
John T. and Shirley M. Reid<br />
Dr. M. Richard and Clarice Rose<br />
Joanne Schmeelk<br />
Michael S. and Barbara N. Servé<br />
Morris S. Smith Foundation<br />
Stefano La Sala Foundation, Inc.<br />
TechSmith Corporation<br />
Telestream Inc.<br />
Dr. Steven J. and Sandra Weintraub<br />
Marsha A. Young<br />
The following individual made significant contributions through her estate in <strong>the</strong> past year:<br />
Dr. Eleanor D. Rosenfield<br />
-203-<br />
External Funding Sources
The NTID Foundation (continued)<br />
Gifts in Kind<br />
The following individuals and companies made significant contributions of equipment or artwork in <strong>the</strong><br />
past year:<br />
Ms. Renate K. Alpert<br />
Boinx Software Ltd.<br />
Cisco Systems, Inc.<br />
Enfocus Software, Inc.<br />
Mat<strong>the</strong>w Garland<br />
Dr. Howard M. and Zje L. Koft<br />
LanSchool Technologies<br />
Barbara Mayers<br />
Dr. Stanley D. McKenzie<br />
Monroe County Medical Examiner’s Office<br />
Jeremy S. Quiroga<br />
John and Jeanne Smith<br />
Sprint Relay<br />
Rita T. Straubhaar<br />
TechSmith Corporation<br />
Telestream Inc.<br />
NTID Projects/Initiatives<br />
The following individuals and organizations made significant contributions to restricted fund accounts in<br />
<strong>the</strong> past year:<br />
Apple Inc.<br />
Dr. Karen K. Conner<br />
Ewing Marion Kauffman Foundation<br />
Graphic Arts Education and Research Foundation<br />
The Heinz Endowments<br />
Interpretek<br />
Dr. Mat<strong>the</strong>w A. Lynn<br />
Nippon Foundation<br />
Rainbow Alliance of <strong>the</strong> <strong>Deaf</strong>, Inc.<br />
Rochester Area Community Foundation<br />
Joanne Schmeelk<br />
Silicon Valley Community Foundation<br />
Morris S. Smith Foundation<br />
Sorenson Communications, Inc.<br />
United States – Japan Foundation<br />
United Way of Greater Rochester<br />
Louis S. and Molly B. Wolk Foundation<br />
External Funding Sources -204-
NTID Annual Fundraising Results<br />
Through <strong>the</strong> ongoing support of <strong>the</strong> NTID<br />
Foundation, <strong>the</strong> institute’s development program<br />
continues to be successful even in this tough<br />
economic climate. The substantial sums that NTID<br />
has raised over <strong>the</strong> past 10 years demonstrate<br />
NTID’s commitment to seeking alternative sources<br />
of public and private support.<br />
In FY 2010, NTID received cash of $2,602,401 <strong>for</strong><br />
endowment and restricted purposes. Of that<br />
amount, $1,102,800 was deemed eligible <strong>for</strong><br />
federal matching dollars toward NTID’s endowed<br />
scholarship funds.<br />
FY 2006 FY 2007 FY 2008 FY 2009 FY 2010<br />
Cash to Endowment and<br />
Restricted Funds $2,489,423 $2,840,116 $2,527,289 $2,085,697 $2,602,401<br />
Equipment and Software 33,148 124,052 254,191 87,660 94,100<br />
Total $2,522,571 $2,964,168 $2,781,480 $2,173,357 $2,696,501<br />
NTID Per<strong>for</strong>ming Arts<br />
celebrated its 35 th season<br />
with six major per<strong>for</strong>mances,<br />
including Sleeping Beauty.<br />
-205-<br />
Photo by Erin Thomas.<br />
External Funding Sources
NTID Endowment Programs<br />
A total of $2,205,600, including matching federal<br />
funds* of $1,102,800, was added to <strong>the</strong> Federal<br />
Matching Endowment Fund corpus in 2010. The<br />
market value of NTID’s Federal Matching<br />
Endowment portfolio stands at $38,645,276. The<br />
market value of NTID’s total endowments, which<br />
External Funding Sources -206-<br />
Value as of September 30, 2010<br />
include privately raised funds prior to <strong>the</strong><br />
establishment of <strong>the</strong> Federal Matching Endowment<br />
program is $43,159,914. This is a 15.0 percent<br />
increase from <strong>the</strong> $37,530,302 portfolio value a<br />
year ago.<br />
Contributed Value<br />
Market Value<br />
Funds Subject to Federal Investment<br />
and Spending Guidelines<br />
Private $7,735,419 $9,832,757<br />
Federal $7,663,821 $9,371,607<br />
Subtotal $15,399,240 $19,204,364<br />
Funds No Longer Subject to Federal<br />
Investment and Spending Guidelines $11,010,814 $19,440,911<br />
Total Federal Endowment $26,410,054 $38,645,275<br />
O<strong>the</strong>r Endowments Contributed Value Market Value<br />
Private $1,856,880 $4,514,639<br />
Total Endowments $28,266,934 $43,159,914<br />
* There is no longer a separate appropriation <strong>for</strong> <strong>the</strong> Matching Endowment Program. Any monies matched must be funded through<br />
operating funds efficiencies.
Scholarships and Endowed Funds<br />
The generosity of a large number of friends of<br />
NTID has resulted in <strong>the</strong> following scholarships<br />
<strong>for</strong> our students.<br />
Barlow Endowed Scholarship Fund<br />
Alice Beardsley Memorial Endowed Scholarship Fund <strong>for</strong> Interpreting Students at NTID<br />
Ned Behnke Memorial Endowed Scholarship Fund<br />
Doris W. Blanchard Endowed Scholarship Fund<br />
Farid Bozorgi Memorial Endowed Scholarship Fund<br />
Bernard Bragg <strong>Deaf</strong> Theatre, Signed Arts and <strong>Deaf</strong> Cinema Endowment Fund<br />
Citicorp/Citibank Endowed Scholarship Fund at NTID<br />
Continental Corporation Endowed Scholarship Fund at NTID<br />
Lillian M. Cowin Memorial Endowed Scholarship Fund<br />
Robert R. and Donna E. Davila Endowed Scholarship Fund<br />
James J. DeCaro Endowed Scholarship Fund<br />
Delta Sigma Phi Fraternity Endowed Scholarship Fund<br />
Ronald Dodge Memorial Endowed Scholarship Fund<br />
Ronald Dodge Faculty/Staff Grants Endowed Fund<br />
Dorothy E. Ann Fund (D.E.A.F.) Endowed Scholarship Fund<br />
Mr. and Mrs. Joseph F. Dyer Endowed Scholarship Fund<br />
Max Factor Family Foundation Endowed Scholarship Fund<br />
Barbara M. Fallon KPMG Memorial Endowed Scholarship Fund<br />
Rose and George Feigenbaum Endowed Scholarship Fund<br />
Ruth H. Fenyvessy Memorial Endowed Scholarship Fund<br />
Maurice and Maxine Forman Endowed Scholarship Fund<br />
Ann Wadsworth Frisina Memorial Endowed Scholarship Fund<br />
Dr. Robert Frisina Award<br />
Max and Helene Frumkes Memorial Endowed Scholarship Fund<br />
Garlinghouse Endowed Scholarship Fund<br />
Warren Goldmann Endowed Scholarship Fund<br />
Allen and Gloria Gopen Endowed Scholarship Fund<br />
Mildred F. Hall Endowed Scholarship Fund<br />
William Randolph Hearst Endowed Scholarship Fund <strong>for</strong> Financially Disadvantaged Students<br />
Dr. Mary Jane Hellyar Endowed Scholarship Fund<br />
Frank Horton Endowed Scholarship Fund<br />
T. Alan and Vicki T. Hurwitz Family Endowed Scholarship Fund<br />
Ralph Hymes Endowed Scholarship Fund<br />
Interpretek Endowed Scholarship Fund<br />
Lucille Ritter Jennings Endowed Scholarship Fund<br />
-207-<br />
External Funding Sources
Scholarships and Endowed Funds (continued)<br />
Jephson Educational Trust Endowed Scholarship Fund <strong>for</strong> <strong>the</strong> Per<strong>for</strong>ming Arts<br />
JHB Anonymous Scholarship Fund<br />
Johnson Scholarship Foundation Endowed Scholarship <strong>for</strong> Innovation and Entrepreneurship<br />
David T. Kearns Endowed Scholarship Fund <strong>for</strong> <strong>Technical</strong> Excellence<br />
Drew and Frances King Endowment Fund<br />
Sara L. Kuhnert Endowed Scholarship Fund<br />
La Sala Foundation Doctoral Fellowship Fund<br />
Edward H. Lichtenstein Memorial Endowed Scholarship Fund<br />
Dr. Frank W. Lovejoy Jr. Endowment <strong>for</strong> <strong>Deaf</strong>ness Research<br />
Edmund Lyon Memorial Lectureship Fund<br />
Dr. James C. Marsters Endowed Scholarship Fund<br />
Dr. Robert S. and Carol D. Menchel Endowed Scholarship Fund<br />
Mageeda Murad Endowed Scholarship Fund<br />
Dr. Genji Murai Endowed Scholarship Fund<br />
Ruth G. Norton Endowed Scholarship Fund<br />
NTID Alumni Association Endowed Scholarship Fund<br />
NTID Anonymous #12 Endowed Scholarship Fund<br />
NTID Architectural Technology Award Endowed Scholarship Fund<br />
NTID Business Careers Endowed Scholarship Fund<br />
NTID Emergency EYF Student Scholarship Fund<br />
NTID Foundation Endowed Scholarship Fund<br />
NTID Merit Scholarship Fund<br />
NTID Per<strong>for</strong>ming Arts Endowed Scholarship Fund<br />
NTID President and Dean’s Scholarship <strong>for</strong> Academic Excellence<br />
NTID Science and Engineering Careers Endowed Scholarship Fund<br />
NTID Student Leadership Endowed Fund<br />
NTID Visual Communications Endowed Scholarship Fund<br />
NYS Federation of Home Bureaus, Inc. Endowed Scholarship Fund in Honor of Martha Perry<br />
Milton H. and Ray B. Ohringer Endowed Scholarship Fund<br />
Robert F. Panara Endowed Scholarship Fund<br />
Shirley M. Panara Memorial Endowed Fund<br />
Pulver Family Endowed Scholarship Fund<br />
RIT Celebration of Community Endowed Fund<br />
Mary Hope Robinson Endowment <strong>for</strong> <strong>the</strong> Per<strong>for</strong>ming Arts<br />
Dr. Ellie Rosenfield Endowed Scholarship Fund<br />
Rothman Family Endowment Fund<br />
Elizabeth Dunlap Sargent Memorial Endowed Scholarship Fund<br />
External Funding Sources -208-
Scholarships and Endowed Funds (continued)<br />
SASAKAWA Endowed Scholarship Fund<br />
Wilfrid and Isabel Searjeant Endowed Scholarship Fund<br />
S. Richard Silverman Endowed Scholarship Fund <strong>for</strong> International <strong>Deaf</strong> Students<br />
Carolie R. Simone Endowed Scholarship Fund<br />
Edy<strong>the</strong> and Edward Sklar Endowed Scholarship Fund<br />
David Smith Memorial Endowed Scholarship Fund<br />
Benjamin J. Soukup Endowed Scholarship Fund<br />
Sprint Endowed Scholarship Fund<br />
Solon E. Summerfield Foundation Endowed Scholarship Fund<br />
Michael A. Swartzman Memorial Endowed Scholarship Fund<br />
Paul L. and Sally A. Taylor Endowed Scholarship Fund<br />
Michael Thomas Endowed Scholarship Fund in <strong>the</strong> Per<strong>for</strong>ming Arts<br />
Eloise Thornberry Endowed Scholarship Fund<br />
W. Paul Urich Memorial Endowed Scholarship Fund<br />
James Ventimiglia Memorial Printing Award Endowed Fund<br />
Elizabeth W. Williams Endowed Fund <strong>for</strong> <strong>the</strong> Per<strong>for</strong>ming Arts<br />
Joseph C. and Loretta F. Wolf Endowed Scholarship Fund<br />
Louis S. and Molly B. Wolk Foundation Endowed Scholarship Fund <strong>for</strong> <strong>Deaf</strong> Students at RIT<br />
The Womans’ Club of Rochester Endowed Scholarship Fund <strong>for</strong> <strong>Deaf</strong> Students at RIT<br />
Women’s Council Endowed Scholarship Fund <strong>for</strong> Hearing-Impaired Students at RIT<br />
-209-<br />
External Funding Sources
Grants and Contracts<br />
During FY 2010 we had 15 new grant proposals<br />
totaling $5,343,426, which were submitted <strong>for</strong><br />
funding. Eight, totaling $1,772,500, were funded;<br />
three are still pending; four were not funded. In<br />
addition, one pre-proposal, <strong>for</strong> $4,861,462, was<br />
Project Title<br />
External Funding Sources -210-<br />
submitted. As of September 30, 2010, <strong>the</strong> annual<br />
value of all grants and contracts at NTID totaled<br />
$4,294,833 with a total value over <strong>the</strong> lives of <strong>the</strong><br />
projects of $22,<strong>31</strong>2,415.<br />
Grant Provider<br />
PEN-International Nippon Foundation of Japan<br />
Year<br />
Amount<br />
FY 2010<br />
Total Value<br />
10 of<br />
10 $1,167,600 $11,461,539<br />
PEPNet-Nor<strong>the</strong>ast U.S. Department of Education 5 of 5 $1,000,000 $5,000,000<br />
Psychological Foundations of<br />
Ma<strong>the</strong>matics Per<strong>for</strong>mance by <strong>Deaf</strong> and<br />
Hearing Students <strong>National</strong> <strong>Institute</strong>s of Health 3 of 4 $4<strong>31</strong>,847 $1,642,170<br />
Cognitive and Metacognitive Foundations<br />
of STEM Learning by <strong>Deaf</strong> Students <strong>National</strong> Science Foundation 3 of 3 $324,301 $966,434<br />
The Science of Learning Center on<br />
Visual Language and Visual Learning <strong>National</strong> Science Foundation 4 of 5 $354,492 $953,701<br />
Substance and Alcohol Abuse<br />
Intervention Services <strong>for</strong> <strong>the</strong> <strong>Deaf</strong><br />
(SAISD)<br />
DHHS Substance Abuse and<br />
Mental Health Services<br />
Administration 5 of 5 $200,973 $1,056,620<br />
Reorganization of Visual Functions After<br />
Early <strong>Deaf</strong>ness <strong>National</strong> <strong>Institute</strong>s of Health 3 of 3 $44,903 $136,495<br />
Administrative Supplement to<br />
―Reorganization of Visual Functions After<br />
Early <strong>Deaf</strong>ness‖ <strong>National</strong> <strong>Institute</strong>s of Health 1 of 1 $78,440 $78,440<br />
DHH Cyber-Community – Supporting<br />
<strong>Deaf</strong> and Hard of Hearing Students in<br />
STEM Fields <strong>National</strong> Science Foundation 2 of 3 $0 $90,124<br />
Enrichment: Testing <strong>the</strong> Concept of a<br />
Virtual Alliance <strong>for</strong> <strong>Deaf</strong> and Hard-of-<br />
Hearing STEM Students at <strong>the</strong><br />
Postsecondary Level <strong>National</strong> Science Foundation<br />
1.5<br />
of 1.5 $0 $199,585<br />
<strong>National</strong> Center <strong>for</strong> <strong>Deaf</strong> Health <strong>National</strong> <strong>Institute</strong>s of Health 1 of 5 $119,224 $119,224<br />
Survive and Thrive in College<br />
(VATEA 09-10) NYS Education Department 1 of 1 $26,246 $26,246<br />
Supporting Women and<br />
Underrepresented <strong>Deaf</strong> Students in<br />
Laboratory Science Technology NYS Education Department 1 of 1 $5,513 $5,513
Grants and Contracts (continued)<br />
Project Title<br />
Grant Provider<br />
-211-<br />
Year<br />
Amount<br />
FY 2010<br />
Total Value<br />
Analyzing <strong>the</strong> Use of C-Print Mobile<br />
Technology in STEM Laboratory Settings<br />
Across Multiple Postsecondary Sites <strong>National</strong> Science Foundation 1 of 3 $394,738 $394,738<br />
Career Development Workshops to<br />
Serve <strong>the</strong> <strong>Deaf</strong> Population in<br />
Southwestern Pennsylvania Heinz Endowments<br />
<strong>Technical</strong> Job Training and Career<br />
Development Workshops <strong>for</strong> <strong>Deaf</strong> and<br />
Hard-of-Hearing Adults<br />
Secondary Educational Enrichment <strong>for</strong><br />
<strong>Deaf</strong> Students – International: Sowing <strong>the</strong><br />
SEEDS of Cross-Cultural Understanding US – Japan Foundation<br />
Investigation of Enhanced<br />
Captioning Support U.S. Department of Education<br />
1 of<br />
1.5 $72,700 $72,700<br />
BNY Mellon Charitable<br />
Foundation 1 of 1 $25,000 $25,000<br />
1 of<br />
1.33 $37,011 $72,041<br />
0.75 of<br />
0.75 $11,845 $11,845<br />
Total $4,294,833 $22,<strong>31</strong>2,415<br />
External Funding Sources