The Effects Of Exercise-Induced Weight Loss On - The Journal of ...
The Effects Of Exercise-Induced Weight Loss On - The Journal of ...
The Effects Of Exercise-Induced Weight Loss On - The Journal of ...
You also want an ePaper? Increase the reach of your titles
YUMPU automatically turns print PDFs into web optimized ePapers that Google loves.
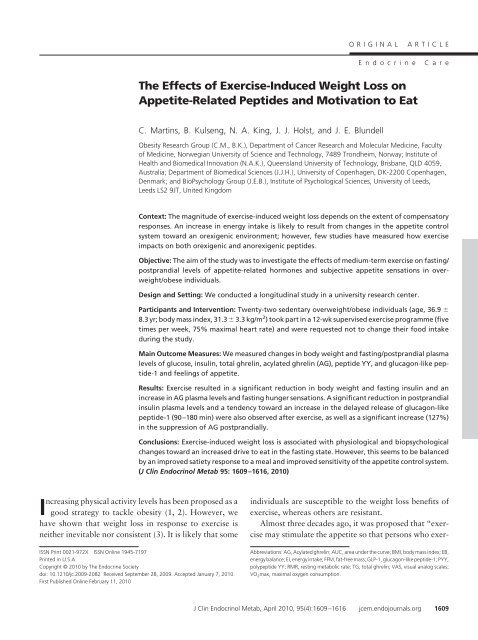
<strong>The</strong> <strong>Effects</strong> <strong>of</strong> <strong>Exercise</strong>-<strong>Induced</strong> <strong>Weight</strong> <strong>Loss</strong> on<br />
Appetite-Related Peptides and Motivation to Eat<br />
C. Martins, B. Kulseng, N. A. King, J. J. Holst, and J. E. Blundell<br />
Obesity Research Group (C.M., B.K.), Department <strong>of</strong> Cancer Research and Molecular Medicine, Faculty<br />
<strong>of</strong> Medicine, Norwegian University <strong>of</strong> Science and Technology, 7489 Trondheim, Norway; Institute <strong>of</strong><br />
Health and Biomedical Innovation (N.A.K.), Queensland University <strong>of</strong> Technology, Brisbane, QLD 4059,<br />
Australia; Department <strong>of</strong> Biomedical Sciences (J.J.H.), University <strong>of</strong> Copenhagen, DK-2200 Copenhagen,<br />
Denmark; and BioPsychology Group (J.E.B.), Institute <strong>of</strong> Psychological Sciences, University <strong>of</strong> Leeds,<br />
Leeds LS2 9JT, United Kingdom<br />
Context: <strong>The</strong> magnitude <strong>of</strong> exercise-induced weight loss depends on the extent <strong>of</strong> compensatory<br />
responses. An increase in energy intake is likely to result from changes in the appetite control<br />
system toward an orexigenic environment; however, few studies have measured how exercise<br />
impacts on both orexigenic and anorexigenic peptides.<br />
Objective: <strong>The</strong> aim <strong>of</strong> the study was to investigate the effects <strong>of</strong> medium-term exercise on fasting/<br />
postprandial levels <strong>of</strong> appetite-related hormones and subjective appetite sensations in overweight/obese<br />
individuals.<br />
Design and Setting: We conducted a longitudinal study in a university research center.<br />
Participants and Intervention: Twenty-two sedentary overweight/obese individuals (age, 36.9 �<br />
8.3 yr; body mass index, 31.3 � 3.3 kg/m 2 ) took part in a 12-wk supervised exercise programme (five<br />
times per week, 75% maximal heart rate) and were requested not to change their food intake<br />
during the study.<br />
Main Outcome Measures: We measured changes in body weight and fasting/postprandial plasma<br />
levels <strong>of</strong> glucose, insulin, total ghrelin, acylated ghrelin (AG), peptide YY, and glucagon-like peptide-1<br />
and feelings <strong>of</strong> appetite.<br />
Results: <strong>Exercise</strong> resulted in a significant reduction in body weight and fasting insulin and an<br />
increase in AG plasma levels and fasting hunger sensations. A significant reduction in postprandial<br />
insulin plasma levels and a tendency toward an increase in the delayed release <strong>of</strong> glucagon-like<br />
peptide-1 (90–180 min) were also observed after exercise, as well as a significant increase (127%)<br />
in the suppression <strong>of</strong> AG postprandially.<br />
Conclusions: <strong>Exercise</strong>-induced weight loss is associated with physiological and biopsychological<br />
changes toward an increased drive to eat in the fasting state. However, this seems to be balanced<br />
by an improved satiety response to a meal and improved sensitivity <strong>of</strong> the appetite control system.<br />
(J Clin Endocrinol Metab 95: 1609–1616, 2010)<br />
Increasing physical activity levels has been proposed as a<br />
good strategy to tackle obesity (1, 2). However, we<br />
have shown that weight loss in response to exercise is<br />
neither inevitable nor consistent (3). It is likely that some<br />
ISSN Print 0021-972X ISSN <strong>On</strong>line 1945-7197<br />
Printed in U.S.A.<br />
Copyright © 2010 by <strong>The</strong> Endocrine Society<br />
doi: 10.1210/jc.2009-2082 Received September 28, 2009. Accepted January 7, 2010.<br />
First Published <strong>On</strong>line February 11, 2010<br />
ORIGINAL ARTICLE<br />
Endocrine Care<br />
individuals are susceptible to the weight loss benefits <strong>of</strong><br />
exercise, whereas others are resistant.<br />
Almost three decades ago, it was proposed that “exercise<br />
may stimulate the appetite so that persons who exer-<br />
Abbreviations: AG, Acylated ghrelin; AUC, area under the curve; BMI, body mass index; EB,<br />
energy balance; EI, energy intake; FFM, fat-free mass; GLP-1, glucagon-like peptide-1; PYY,<br />
polypeptide YY; RMR, resting metabolic rate; TG, total ghrelin; VAS, visual analog scales;<br />
VO 2max, maximal oxygen consumption.<br />
J Clin Endocrinol Metab, April 2010, 95(4):1609–1616 jcem.endojournals.org 1609
1610 Martins et al. <strong>Exercise</strong> and Appetite Control J Clin Endocrinol Metab, April 2010, 95(4):1609–1616<br />
cise increase their eating and do not lose as much weight<br />
as expected” (4). It is generally accepted that the appetite<br />
regulatory system will quickly defend impositions that<br />
promote a negative energy balance (EB). Metabolic and<br />
behavioral compensatory responses, targeting both sides<br />
<strong>of</strong> the EB equation, are likely to influence the magnitude<br />
<strong>of</strong> weight loss in response to exercise. Individual variability<br />
in those compensatory responses could partly explain<br />
interindividual variation in exercise-induced weight loss<br />
and why some individuals fail to lose weight with exercise<br />
(5). It has been proposed that the difficulty in maintaining<br />
EB in a weight-reduced state is a consequence <strong>of</strong> a “compromised<br />
appetite control.” <strong>Weight</strong> loss may lead to counterregulatory<br />
adaptations, possibly through up-regulation<br />
<strong>of</strong> orexigenic (ghrelin) and down-regulation <strong>of</strong> anorexigenic<br />
[polypeptide YY (PYY) and glucagon-like peptide-1<br />
(GLP-1)] peptides (6). <strong>The</strong>se peptides are expected to serve<br />
as food cues and modulate the expression <strong>of</strong> feeding behavior<br />
by increasing hunger and energy intake (EI), in an<br />
attempt to automatically restore EB and prevent further<br />
weight loss.<br />
We have recently shown that participants who lose less<br />
weight than expected in response to a supervised exercise<br />
program experience a compensatory increase in habitual<br />
EI accompanied by an increased drive to eat (3). <strong>The</strong> increase<br />
in EI experienced by some in response to an imposed<br />
exercise program could theoretically be driven by an increase<br />
in the release <strong>of</strong> ghrelin, an orexigenic peptide,<br />
and/or a blunted release <strong>of</strong> satiety gut peptides in response<br />
to a fixed meal.<br />
Not much research has been devoted to the impact <strong>of</strong><br />
long-term exercise on the release <strong>of</strong> appetite-related hormones<br />
in the obese population and how that relates to<br />
weight loss (7). Although it has already been shown that<br />
exercise-induced weight loss induces a compensatory increase<br />
in total ghrelin (TG) plasma levels (8–10), no significant<br />
changes have been reported on acylated ghrelin<br />
(AG) (10, 11). This is the molecular form that is able to<br />
bind to the GH secretagogue receptor, cross the bloodbrain<br />
barrier, and therefore exert its orexigenic effects at<br />
the hypothalamic level. However, the previous two studies<br />
were performed in children and adolescents, and in the<br />
latter study no significant changes in body weight were<br />
observed (11). Evidence regarding the impact <strong>of</strong> chronic<br />
exercise on the plasma levels <strong>of</strong> satiety gut peptides is also<br />
relatively scarce, particularly in the obese population.<br />
However, two studies in adolescents have reported an increase<br />
in the release <strong>of</strong> satiety peptides in response to medium-<br />
to long-term exercise (11, 12).<br />
<strong>The</strong> aim <strong>of</strong> this study was to investigate the effects <strong>of</strong> a<br />
12-wk supervised exercise program on fasting and postprandial<br />
plasma levels <strong>of</strong> appetite-related hormones and<br />
the subjective feelings <strong>of</strong> appetite in sedentary overweight/<br />
obese individuals and to determine whether any changes<br />
were correlated with the magnitude <strong>of</strong> exercise-induced<br />
weight loss.<br />
Subjects and Methods<br />
Participants<br />
Twenty-two overweight and obese healthy sedentary volunteers<br />
(eight men and 14 women) were recruited for this study<br />
through advertisements posted at the university and surrounding<br />
community. Inclusion criteria were as follows: age between 18<br />
and 60 yr; body mass index (BMI) between 27 and 35 kg/m 2 ;<br />
weight stable (�2-kg variation in body weight for the last 3<br />
months); not currently dieting to lose weight; not taking any<br />
medication known to affect body weight or appetite; a sedentary<br />
lifestyle; and a restraint score <strong>of</strong> 12 or less derived from the Three<br />
Factor Eating Behavior Questionnaire (TFEQ) (13). Sedentary<br />
lifestyle was defined as not engaged in strenuous work or in<br />
regular brisk leisure physical activity more than once a week or<br />
in light exercise for more than 20 min/d more than three times per<br />
week and was assessed through an exercise history relating to the<br />
3 months before the study.<br />
This study was conducted according to the guidelines laid<br />
down in the Declaration <strong>of</strong> Helsinki. All participants gave written<br />
consent before enrolling in the study, and approval was obtained<br />
from the regional Ethics Committee (Midt-Norge, Trondheim,<br />
Norway).<br />
Study protocol<br />
Participants underwent a 12-wk supervised exercise program<br />
and were asked to maintain their normal diet throughout the<br />
study. Several measurements were performed before and after<br />
the intervention, including: body weight and composition, maximal<br />
oxygen consumption (VO 2max), resting metabolic rate, habitual<br />
food intake, fasting and postprandial release <strong>of</strong> appetiterelated<br />
hormones, and subjective feelings <strong>of</strong> appetite.<br />
<strong>Exercise</strong> program<br />
Participants underwent a 12-wk exercise program (5 d/wk)<br />
consisting <strong>of</strong> treadmill walking or running. <strong>The</strong> program was<br />
individually designed to induce a 500-kcal energy deficit per<br />
session at approximately 75% <strong>of</strong> their maximal heart rate. All<br />
exercise sessions were supervised in the research unit. Subjects<br />
wore a POLAR (S610; Polar Electro Oy, Kempele, Finland) heart<br />
rate monitor during each exercise session. To account for<br />
changes in fitness and body weight, a submaximal VO 2max test<br />
was performed at wk 4 and 8 to recalculate the exercise duration<br />
needed to induce a 500 kcal energy deficit.<br />
VO 2max measurement<br />
VO 2max was measured during uphill treadmill walking or<br />
running (PPS 55 Med; Woodway, Munich, Germany), using the<br />
system Oxigen Pro (Viasys Healthcare, Hoechberg, Germany). A<br />
warm-up period <strong>of</strong> 10 min (50–60% <strong>of</strong> maximum heart rate)<br />
preceded the test. A plateauing <strong>of</strong> oxygen uptake, despite increased<br />
work load and a respiratory exchange ratio <strong>of</strong> at least<br />
1.05 were used as criteria for VO 2max. Heart rate was measured
J Clin Endocrinol Metab, April 2010, 95(4):1609–1616 jcem.endojournals.org 1611<br />
during the test (Polar type 610; Polar Electro Oy), and maximal<br />
heart rate was defined by adding five beats per minute to the<br />
highest heart rate value obtained during the VO 2max test.<br />
Body composition<br />
Body composition was measured using dual-energy x-ray absorptiometry<br />
(Hologic Discovery-A; Integrity Medical Systems<br />
Inc., Fort Myers, FL).<br />
Resting metabolic rate (RMR)<br />
RMR was measured by indirect calorimetry (Deltatrac II metabolic<br />
monitor; Datex-Ohmeda Division, Helsinki, Finland)<br />
with the participants fasted and laying supine for 30 min under<br />
a ventilated hood. Respiratory quotient was calculated as the<br />
ratio <strong>of</strong> carbon dioxide produced to oxygen consumed.<br />
Habitual food intake<br />
Participants were asked to maintain their normal diet<br />
throughout the study. This was verified by a 3-d estimated food<br />
diary (including at least one weekend day) using appropriate<br />
photographic booklets and household measures to improve the<br />
validity <strong>of</strong> portion size estimates, before the start <strong>of</strong> the study and<br />
at wk 12 <strong>of</strong> the exercise intervention.<br />
Blood sampling and subjective measures <strong>of</strong> appetite<br />
Participants visited the research unit in the fasted state (at least<br />
a 12-h fast), before and after the 12-wk exercise intervention (at<br />
least 48 h after the last exercise session to exclude acute effects <strong>of</strong><br />
exercise). <strong>On</strong> each occasion, an iv cannula was inserted into an<br />
antecubital vein. Two fasting baseline blood samples (�10 and 0<br />
min) were taken, and participants were asked to rate their baseline<br />
appetite using visual analog scales (VAS). Participants were then<br />
instructed to consume a standard breakfast [time (t) � zero] (consisting<br />
<strong>of</strong> bread, orange juice, milk, cheese, and jam: 600 kcal, 17%<br />
protein,35%fat,48%carbohydrate)within10min.Bloodsamples<br />
were taken at regular intervals for a period <strong>of</strong> 3 h (every 15 min in<br />
the first hour and every half hour in the second and third hours), and<br />
subjective appetite was assessed throughout the morning using<br />
VAS. Subjective feelings <strong>of</strong> hunger (“how hungry do you feel?”),<br />
fullness (“how full do you feel?”), desire to eat (“how much would<br />
you like to eat?”) and prospective food consumption (“how much<br />
do you think you can eat?”) were assessed using 10-cm self-rated<br />
VAS, as previously described (14), before and after breakfast and at<br />
every half hour up to 3 h.<br />
Hormone measurement<br />
Venous blood was collected into potassium-oxalate tubes for<br />
analysis <strong>of</strong> glucose and potassium/EDTA-coated tubes containing<br />
500 KIU aprotinin (Pentapharm, Basel, Switzerland)/ml<br />
whole blood for the measurement <strong>of</strong> insulin and gut peptides.<br />
Samples were then centrifuged at 2000 � g for 10 min and<br />
plasma analyzed immediately (for glucose) or kept at �20 C for<br />
later analyses. For the measurement <strong>of</strong> AG, 50 �l <strong>of</strong>a1N hydrochloric<br />
acid solution and 10 �l <strong>of</strong> phenylmethylsulfonyl fluoride<br />
(Sigma, Schnelldorf, Germany) (10 mg/ml <strong>of</strong> isopropanol)<br />
were added to each milliliter <strong>of</strong> plasma immediately after centrifugation.<br />
All samples were batch-analyzed at the end <strong>of</strong> the<br />
study to reduce interassay variability.<br />
Glucose was measured using standard laboratory techniques.<br />
Insulin, TG, and AG were quantified using human-specific RIA<br />
kits (Linco Research, St. Charles, MO) and GLP-1 and PYY<br />
“in-house” RIA methods (15, 16). <strong>The</strong> sensitivity <strong>of</strong> the assays<br />
was 14 pmol/liter for insulin, 93 pg/ml for TG, 7.8 pg/ml for AG,<br />
1 pmol/liter for GLP-1, and 2 pmol/liter for PYY. All samples<br />
were assayed in duplicate, and baseline and end samples <strong>of</strong> the<br />
same individual were analyzed in the same batch. <strong>The</strong> intraassay<br />
coefficient <strong>of</strong> variation was less than 10% for insulin, TG, and<br />
AG and less than 5% for GLP-1 and PYY.<br />
Measurement <strong>of</strong> insulin sensitivity<br />
Fasting insulin sensitivity, as a percentage <strong>of</strong> a normal<br />
reference population, was calculated using the<br />
HOMA2 Calculator version 2.2 (University <strong>of</strong> Oxford,<br />
Oxford, UK) (17).<br />
Statistical analysis<br />
Statistical analysis was carried out using SPSS 15.0 (SPSS Inc.,<br />
Chicago, IL). All variables were checked regarding their normal<br />
distribution using the Shapiro-Wilk test. Statistical significance<br />
was assumed at P � 0.05, unless otherwise stated.<br />
Differences in fasting plasma levels <strong>of</strong> metabolites/hormones<br />
and subjective feelings <strong>of</strong> appetite between the two blood sampling<br />
mornings (before and after the exercise intervention) were<br />
assessed by paired sample t tests. <strong>The</strong> effect <strong>of</strong> time and exercise<br />
(pre- vs. postintervention) on postprandial levels <strong>of</strong> metabolites/<br />
hormones and subjective feelings <strong>of</strong> appetite were assessed by a<br />
repeated measures ANOVA. Amplitude <strong>of</strong> variation for appetite-related<br />
hormones was calculated as peak minus nadir. For<br />
TG and AG, nadir was defined as the single lowest value after<br />
breakfast and peak as the single highest value preceding breakfast<br />
(average fasting plasma level). For GLP-1 and PYY, nadir<br />
was average fasting plasma levels, and peak was the single highest<br />
value after breakfast.<br />
<strong>The</strong> area under the curve (AUC) for plasma levels <strong>of</strong> appetiterelated<br />
hormones and subjective feeling <strong>of</strong> appetite was calculated<br />
from before to 180 min after breakfast using the trapezoidal<br />
rule. <strong>The</strong> effect <strong>of</strong> the exercise intervention on the AUC <strong>of</strong> each<br />
subjective feeling <strong>of</strong> appetite was assessed used paired sample t<br />
tests. Pearson (or Spearman) correlations were used to test the<br />
relationship between changes in the plasma levels <strong>of</strong> the hormones<br />
measured, changes in subjective feelings <strong>of</strong> appetite, and<br />
weight loss.<br />
Results<br />
Seven women did not complete the exercise program for<br />
several reasons including pregnancy, injury, and time constraints.<br />
No significant differences in baseline BMI or fitness<br />
levels (VO 2max in ml/kg/min) were observed between<br />
completers and noncompleters. Results are presented for<br />
15 subjects (seven women and eight men) with a mean age<br />
<strong>of</strong> 36.9 � 8.3 yr.<br />
<strong>Exercise</strong> compliance<br />
Participants who completed the intervention exercised<br />
at least 80% <strong>of</strong> the expected sessions (average,<br />
89 � 5.9%).
1612 Martins et al. <strong>Exercise</strong> and Appetite Control J Clin Endocrinol Metab, April 2010, 95(4):1609–1616<br />
TABLE 1. Anthropometry, body composition, and<br />
fitness levels at baseline and the end <strong>of</strong> the exercise<br />
intervention (n � 15)<br />
Baseline End<br />
<strong>Weight</strong> (kg) 96.1 � 12.0 b<br />
92.6 � 11.7 b<br />
BMI (kg/m 2 ) 31.3 � 2.3 b<br />
30.1 � 2.3 b<br />
Body fat (%) 35.3 � 5.6 b<br />
33.5 � 5.9 b<br />
Total fat mass (kg) 34.1 � 4.9 b<br />
31.2 � 5.0 b<br />
Total FFM (kg) 60.8 � 11.3 60.2 � 11.1<br />
RMR (kcal/d) 1830.7 � 317.3 a<br />
1741.7 � 324.9 a<br />
Fitness level VO2max (ml/kg/min)<br />
32.9 � 6.6 b<br />
37.7 � 5.9 b<br />
Results are expressed as means � SD.<br />
Means sharing the same symbol denote significant differences<br />
between baseline and end: a P � 0.05; b P � 0.0001.<br />
Anthropometry, body composition, RMR, fitness<br />
levels, and eating behavior<br />
Changes in anthropometry, body composition, RMR,<br />
and fitness levels in the 15 participants who completed the<br />
study are shown in Table 1. <strong>The</strong>re was a significant reduction<br />
in body weight, BMI, percentage body fat, total<br />
fat mass, and RMR and a significant increase in VO 2max<br />
after the 12 wk <strong>of</strong> exercise (t � 9.46, df � 14, P � 0.0001;<br />
t � 9.11, df � 14, P � 0.0001; t � 4.65, df � 14, P �<br />
0.0001; t � 7.981, df � 14, P � 0.0001; t � 2.297, df �<br />
14, P � 0.05; and t ��5.68, df � 14; P � 0.0001,<br />
respectively), but no change in total fat-free mass (FFM)<br />
(t � 1.344; df � 14; P � 0.2).<br />
Habitual energy and macronutrient intake<br />
<strong>The</strong>re were no significant changes in energy (2252 �<br />
569 vs. 2228 � 667 kcal; t � 0.17; df � 14; P � 0.05 or<br />
macronutrient intake, assessed by the 3-d food diaries,<br />
with the exercise intervention.<br />
Plasma metabolites and hormones and insulin<br />
sensitivity<br />
Fasting plasma levels and insulin sensitivity<br />
<strong>On</strong>e outlier was removed due to abnormally high levels<br />
<strong>of</strong> AG plasma levels at baseline [214.5 pmol/liter for fasting<br />
and 44,655 pmol/liter�min for postprandial total AUC<br />
(3.4 and 3.5 SD values away from the mean, respectively)].<br />
<strong>The</strong> fasting plasma levels <strong>of</strong> the metabolites and hormones<br />
measured and insulin sensitivity, before and after the<br />
12-wk exercise intervention, are displayed in Table 2.<br />
<strong>The</strong> exercise intervention resulted in a significant reduction<br />
in insulin and a significant increase in AG fasting<br />
plasma levels (t � 3.49, df � 14, P � 0.004; t ��2960,<br />
df � 13, P � 0.011, respectively), but no significant<br />
changes in glucose, TG, GLP-1, or PYY fasting plasma<br />
levels. <strong>The</strong> exercise intervention resulted also in a signif-<br />
TABLE 2. Fasting plasma levels <strong>of</strong> metabolites and<br />
hormones and insulin sensitivity at baseline and the end<br />
<strong>of</strong> the exercise intervention (n � 15)<br />
Baseline End<br />
Glucose (mmol/liter) 5.2 � 0.4 5.3 � 0.3<br />
Insulin (pmol/liter) 109.0 � 68.2 b<br />
62.8 � 24.8 b<br />
TG (pmol/liter) 616.6 � 271 704.7 � 303.7<br />
AG (pmol/liter) 37.2 � 18.2 a<br />
51.7 � 26.0 a<br />
GLP-1 (pmol/liter) 12.8 � 6.1 11.7 � 2.3<br />
PYY (pmol/liter) 10.6 � 5.5 10.3 � 4.8<br />
S I (%) 69.5 � 50.4 c<br />
99.4 � 51.8 c<br />
Results are expressed as mean � SD. SI (%), Fasting insulin sensitivity as<br />
a percentage <strong>of</strong> a normal reference population.<br />
Means sharing the same symbol denote significant differences<br />
between baseline and end: a P � 0.05; b P � 0.01; c P � 0.0001.<br />
icant increase in fasting insulin sensitivity (t ��5.37; df �<br />
13; P � 0.0001).<br />
Postprandial plasma levels<br />
Glucose and insulin. A significant main effect <strong>of</strong> time<br />
[F(1.720, 17.197) � 9.951; P � 0.0001], but no effect <strong>of</strong><br />
exercise or interaction, was observed on glucose plasma levels,<br />
which increased from breakfast until t � 30 min and<br />
decreased afterward (data not shown). A significant effect <strong>of</strong><br />
time [F(1.895, 23.819) � 25.53; P � 0.0001] and exercise<br />
(P � 0.05), but no interaction, was observed in insulin<br />
plasma levels (Fig. 1). Insulin plasma levels increased from<br />
breakfast until t � 45 min and decreased afterward and were<br />
significantly lower after the exercise intervention.<br />
Appetite-related hormones. A significant main effect <strong>of</strong><br />
time [F(7,91) � 21.565; P � 0.0001], but no effect <strong>of</strong><br />
exercise or interaction, was observed on TG plasma levels,<br />
which decreased from breakfast until t � 90 min and increased<br />
progressively afterward (Fig. 2). <strong>The</strong> amplitude <strong>of</strong><br />
change in TG plasma levels (peak � nadir) increased, on<br />
average, 30% with the exercise intervention (204 � 123<br />
vs. 261 � 151 pmol/liter), but this was not significant (t �<br />
�1.519; df � 14; P � 0.151).<br />
FIG. 1. Insulin plasma levels (pmol/liter) over time after breakfast,<br />
before (�) and after a 12-wk exercise intervention (�). Values<br />
represent means � SEM for 15 subjects. Repeated measures ANOVA<br />
showed a significant effect <strong>of</strong> time (P � 0.0001) and exercise (P �<br />
0.05), but no interactions.
J Clin Endocrinol Metab, April 2010, 95(4):1609–1616 jcem.endojournals.org 1613<br />
FIG. 2. TG (top) and acylated ghrelin (AG) (bottom) plasma levels (pg/<br />
ml) over time after breakfast, before (�) and after a 12-wk exercise<br />
intervention (�). Values represent means � SEM for 15 subjects.<br />
Repeated measures ANOVA showed a significant effect <strong>of</strong> time (P �<br />
0.0001), but no effect <strong>of</strong> exercise or interactions for TG and no<br />
significant main effect <strong>of</strong> time, exercise, or interactions for AG.<br />
No significant effects <strong>of</strong> time, exercise, or exercise �<br />
time interaction were observed on AG plasma levels (Fig.<br />
2). However, a closer analysis <strong>of</strong> the data revealed no<br />
significant effect <strong>of</strong> time at baseline between fasting at t �<br />
90 min [F(2.57, 30.79) � 3.14; P � 0.05], but a significant<br />
effect <strong>of</strong> time (suppression) at the end <strong>of</strong> the intervention<br />
[F(1.62, 19.42) � 9.79; P � 0.002]. Moreover, a significant<br />
increase (127%) in the amplitude <strong>of</strong> change in AG<br />
plasma levels (peak � nadir) was observed with the exercise<br />
intervention (12.4 � 11.1 vs. 28.1 � 21.4 pmol/liter;<br />
t ��3.061; df � 13; P � 0.009).<br />
A significant effect <strong>of</strong> time [F(2.599, 33.781) � 12.839;<br />
P � 0.0001], but no main effect <strong>of</strong> exercise or interaction<br />
was observed on GLP-1 plasma levels (Fig. 3). Total<br />
GLP-1 AUC (fasting up to 180 min) did not change with<br />
the exercise intervention, but there was a tendency for a<br />
higher GLP-1 AUC on the last 90 (90–180 min) and 60<br />
postprandial minutes (120–180 min) after the 12-wk exercise<br />
intervention compared with baseline (1491 � 365<br />
vs. 1689 � 430 pmol/liter�min, t ��2.242, df � 14, P �<br />
0.042; and 991 � 231 vs. 1126 � 248, t ��2.388, df �<br />
14, P � 0.032, respectively).<br />
A significant effect <strong>of</strong> time [F(3.291, 42.789) � 10.802;<br />
P � 0.0001], but no effect <strong>of</strong> exercise or interaction, was<br />
observed on PYY plasma levels (Fig. 3). Total PYY AUC<br />
(fasting up to 180 min) did not change with the exercise<br />
intervention, but there was a tendency for higher PYY<br />
AUC between 120 and 180 min after the 12-wk exercise<br />
intervention compared with baseline (798 � 224 vs.<br />
888 � 211; t ��1.770; df � 14; P � 0.099).<br />
FIG. 3. GLP-1 (top) and PYY (bottom) plasma levels (pmol/liter) over<br />
time after breakfast, before (�) and after a 12-wk exercise<br />
intervention (�). Values represent means � SEM for 15 subjects.<br />
Repeated measures ANOVA showed a significant effect <strong>of</strong> time (P �<br />
0.0001; P � 0.001), but no effect <strong>of</strong> exercise or interactions for both<br />
GLP-1 and PYY, respectively.<br />
Subjective feelings <strong>of</strong> appetite<br />
Fasting state<br />
<strong>The</strong>re was a significant increase in fasted subjective<br />
feelings <strong>of</strong> hunger (4.1 � 1.6 vs. 6.5 � 2.5 cm; t ��3.126;<br />
df � 14; P � 0.01), desire to eat (4.8 � 1.5 vs. 6.4 � 2.3<br />
cm; t ��2.604; df � 14; P � 0.05), and prospective food<br />
consumption (6.0 � 1.6 vs. 7.1 � 2.0 cm; t ��2.286; df �<br />
14; P � 0.05), and a significant reduction in fullness feelings<br />
(3.5 � 1.1 vs. 1.9 � 1.5 cm; t � 3.261; df � 14; P �<br />
0.01) after the 12-wk exercise intervention.<br />
Postprandial state<br />
A significant effect <strong>of</strong> time [F(3.039, 42.553) � 20.910;<br />
P � 0.0001] and exercise [F(1,14) � 10.901; P � 0.01]<br />
was observed on subjective feelings <strong>of</strong> hunger, which<br />
increased after the 12-wk exercise intervention compared<br />
with baseline levels (Fig. 4). A significant effect <strong>of</strong><br />
time [F(3.425, 47.944) � 30.693; P � 0.0001] and a<br />
time � exercise interaction [F(3.908, 54.707) � 4.319; P �<br />
0.01], but no main effect <strong>of</strong> exercise, was observed on<br />
subjective feelings <strong>of</strong> fullness (Fig. 4). A significant effect<br />
<strong>of</strong> time [F(7,91) � 16.724; P � 0.0001] and exercise<br />
[F(1,13) � 5.517; P � 0.05] was also observed on subjective<br />
feelings <strong>of</strong> desire to eat, with a similar pattern to<br />
that described for hunger feelings (data not shown). A<br />
significant effect <strong>of</strong> time [F(2.716, 38.027) � 17.846; P �<br />
0.0001], but no main effect <strong>of</strong> exercise or interaction, was<br />
observed on subjective feelings <strong>of</strong> prospective food consumption<br />
(data not shown).
1614 Martins et al. <strong>Exercise</strong> and Appetite Control J Clin Endocrinol Metab, April 2010, 95(4):1609–1616<br />
FIG. 4. Subjective feelings <strong>of</strong> hunger (top) and fullness (bottom) (cm)<br />
over time after breakfast, before (�) and after a 12-wk exercise<br />
intervention (�). Values represent means � SEM for 15 subjects.<br />
Repeated measures ANOVA showed a significant effect <strong>of</strong> time (P �<br />
0.0001) and exercise (P � 0.01), but no interactions for hunger and a<br />
significant effect <strong>of</strong> time (P � 0.0001), and a time�exercise interaction<br />
(P � 0.01) for fullness feelings.<br />
<strong>The</strong>re was a significant increase in the total AUC for<br />
hunger (530 � 310 vs. 720 � 342 cm�min; t ��2.920;<br />
df � 14; P � 0.05) and desire to eat scores (601 � 352 vs.<br />
794 � 375 cm�min; t ��2.331; df � 14; P � 0.05) with<br />
the exercise intervention, but no significant change in total<br />
AUC for fullness (988 � 375 vs. 1001 � 324 cm�min; t �<br />
�0.149; df � 14; P � 0.05) or prospective food consumption<br />
(937 � 460 vs. 998 � 396 cm�min; t ��0.805; df �<br />
14; P � 0.05).<br />
Relationships among weight loss changes,<br />
subjective appetite sensations, and plasma levels<br />
<strong>of</strong> appetite-related hormones<br />
<strong>The</strong>re was a large variability in exercise-induced weight<br />
loss and body composition changes: fat mass (FM) and<br />
FFM, ranging from �5.9 to �1.2 kg for body weight,<br />
�5.2 to �0.6 kg for FM, and �4.0 to �2.7 kg for FFM.<br />
<strong>Weight</strong> loss was not correlated with baseline (pre-intervention)<br />
appetite sensations or appetite-related hormone<br />
plasma levels or with the changes experienced in response<br />
to the exercise program.<br />
Discussion<br />
To the best <strong>of</strong> our knowledge, this is the first study to assess<br />
the impact <strong>of</strong> a medium-term supervised exercise program<br />
on fasting and postprandial plasma levels <strong>of</strong> both orexi-<br />
genic (TG and AG) and anorexigenic (GLP-1 and PYY)<br />
peptides involved in appetite control in sedentary overweight/obese<br />
individuals. We have shown that although<br />
12 wk <strong>of</strong> exercise, inducing an average 3.5-kg weight loss,<br />
significantly increased fasting AG plasma levels and subjective<br />
feelings <strong>of</strong> hunger, it also led to a tendency for an<br />
increase in late postprandial release <strong>of</strong> GLP-1 and a significant<br />
increase in the amplitude <strong>of</strong> change <strong>of</strong> AG in response<br />
to a fixed meal. It is important to note that because<br />
participants were asked not to alter their food intake, some<br />
dietary restraint was exerted, which in turn could have<br />
contributed to the outcome. <strong>The</strong>refore, the observed<br />
changes could not be attributed exclusively to exerciseinduced<br />
weight loss. Moreover, although it can be argued<br />
that the test meal used might not have been large enough<br />
to induce significant changes in appetite-related hormones,<br />
the energy content <strong>of</strong> our test meal was higher than<br />
that used in other appetite studies (18, 19).<br />
Previous studies on the impact <strong>of</strong> exercise-induced<br />
weight loss on appetite-related hormones have reported an<br />
increase (8–10) or no change in fasting TG plasma levels<br />
(20) and no change in fasting AG plasma levels (10, 11);<br />
however, none had previously measured simultaneously<br />
changes in fasting and postprandial plasma levels <strong>of</strong> TG<br />
and AG in overweight and obese adults. Moreover, the<br />
only available studies on the impact <strong>of</strong> chronic exercise on<br />
the release <strong>of</strong> satiety peptides are limited by their short<br />
duration (5 d <strong>of</strong> exercise) (12) and absence <strong>of</strong> postprandial<br />
blood sampling (11). <strong>The</strong> fact that in these two studies no<br />
significant change in body weight were observed (11, 12)<br />
makes it difficult to compare with the results <strong>of</strong> the present<br />
investigation.<br />
We hypothesize that the type and magnitude <strong>of</strong> counterregulatory<br />
adaptations in response to weight loss are<br />
likely to differ, depending on the type <strong>of</strong> weight loss intervention.<br />
<strong>The</strong>re is some evidence to suggest that dietinduced<br />
weight loss is associated with a compensatory<br />
increase in TG plasma levels and a blunted postprandial<br />
release <strong>of</strong> PYY and GLP-1 (6, 19). Our findings suggest<br />
that exercise-induced changes are different. <strong>Exercise</strong>-induced<br />
weight loss may increase the drive to eat, as shown<br />
by increased levels <strong>of</strong> AG and subjective feelings <strong>of</strong> hunger<br />
in fasting, but it may also improve satiety consistent with<br />
the tendency toward an increase in the late postprandial<br />
release <strong>of</strong> GLP-1. <strong>The</strong>se findings are in line with our previous<br />
observation that although medium-term exerciseinduced<br />
weight loss increases both fasting hunger and<br />
hunger across the day, it also improves the satiety efficiency<br />
<strong>of</strong> a breakfast (as shown by a significant increase in<br />
the satiety quotient) (21). Moreover, we have shown here<br />
that the suppression <strong>of</strong> TG and AG in response to food<br />
intake (calculated as amplitude: peak � nadir) increases
J Clin Endocrinol Metab, April 2010, 95(4):1609–1616 jcem.endojournals.org 1615<br />
with exercise, although only significantly for AG. <strong>The</strong> increase<br />
in the amplitude <strong>of</strong> change <strong>of</strong> AG observed with the<br />
exercise intervention was due to the increase in fasting AG<br />
and not to a more pronounced decrease after the breakfast<br />
meal. However, it is important to acknowledge that before<br />
the exercise intervention, when participants were sedentary,<br />
AG plasma levels were irresponsive to food intake.<br />
This pattern was changed after 12 wk <strong>of</strong> exercise with an<br />
associated 3.5-kg average weight loss. Unfortunately, reports<br />
on the impact <strong>of</strong> weight loss or changes in physical<br />
activity levels on the postprandial release <strong>of</strong> AG are limited,<br />
and from our knowledge only one study has looked<br />
at the role <strong>of</strong> body weight on AG postprandial secretion<br />
(18). Zwirska-Korczala et al. (18) reported a significant<br />
suppression <strong>of</strong> AG after the ingestion <strong>of</strong> a mixed meal in<br />
normal-weight women, but not in moderately or morbidly<br />
obese women with the metabolic syndrome. <strong>The</strong>se findings<br />
are consistent with our results and suggest that obesity<br />
is characterized by the maintenance <strong>of</strong> high levels <strong>of</strong> AG<br />
which may supply a constant feeding drive in these individuals.<br />
We have shown that this “abnormal” pattern can<br />
be changed with exercise-induced weight loss.<br />
We have also previously reported that exercise improves<br />
the ability to adjust EI according to previous food consumption<br />
(energy compensation) in both normal-weight (22) and<br />
overweight/obese sedentary individuals (Martins, C., B.<br />
Kulseng, N. A. King, and J. E. Blundell, submitted for publication).<br />
<strong>The</strong>se findings suggest that sedentary individuals<br />
suffer from a malfunctioning or insensitive appetite control<br />
system that can be ameliorated by exercise.<br />
Another important outcome <strong>of</strong> this study was the fact<br />
that the increase in fasting AG plasma levels and hunger<br />
(as well as other appetite) sensations, in response to the<br />
12-wk exercise program, were unrelated to the magnitude<br />
<strong>of</strong> weight loss. This finding challenges the hypothesis that<br />
these changes are part <strong>of</strong> a homeostatic compensatory<br />
mechanism to restore EB. If this was the case, these<br />
changes would be expected to increase with the magnitude<br />
<strong>of</strong> weight loss. However, we are aware that our study has<br />
a small sample size and more power is required to detect<br />
such associations. Moreover, because all our participants<br />
lost weight with the exercise intervention, it is difficult to<br />
speculate whether the observed changes were a result <strong>of</strong><br />
weight loss or exercise per se. <strong>On</strong>ly a study with sufficient<br />
power and where exercise is performed in EB (by matching<br />
the energy costs <strong>of</strong> exercise with an equivalent increase in<br />
EI) and energy deficit can clearly establish whether the<br />
increase in fasting hunger feelings and AG plasma levels is<br />
a result <strong>of</strong> weight loss (and therefore part <strong>of</strong> a compensatory<br />
homeostatic mechanism) or exercise.<br />
We can conclude that although exercise-induced<br />
weight loss leads to an increase in fasting AG and hunger<br />
sensations, similar to what has been reported in response<br />
to dietary-induced weight loss, exercise appears to balance<br />
this increased orexigenic drive by improving the satiety<br />
response to a meal and the sensitivity <strong>of</strong> the appetite control<br />
system.<br />
Acknowledgments<br />
We thank all the participants that took part in this study for their<br />
time and enthusiasm, and Mrs. Sissel Salater, Trude Haugen, and<br />
Ingrid Hals for technical and clinical assistance.<br />
Address all correspondence and requests for reprints to: C.<br />
Martins, Obesity Research Group, Department <strong>of</strong> Cancer Research<br />
and Molecular Medicine, Faculty <strong>of</strong> Medicine, Norwegian<br />
University <strong>of</strong> Science and Technology, 7489 Trondheim,<br />
Norway. E-mail: catia.martins@ntnu.no.<br />
C.M. was supported by postdoctoral Grant SFRH/BPD/<br />
36940/2007 from Fundação para a Ciência e Tecnologia (Portugal)<br />
under the Third European Union Community Support<br />
Program. J.J.H. was supported by the Danish Medical Research<br />
Council and Danorc. J.E.B. was supported by the Biotechnology<br />
and Biological Sciences Research Council (BBS/B/05079). We<br />
also thank the Norwegian Research Council in partnership with<br />
the Institute for Cancer Research and Molecular Medicine, Faculty<br />
<strong>of</strong> Medicine, Norwegian University <strong>of</strong> Science and Technology,<br />
Trondheim, Norway, for financial support.<br />
Disclosure Summary: <strong>The</strong> authors have nothing to disclose.<br />
References<br />
1. World Health Organization 2003 Global strategy on diet, physical<br />
activity and health—obesity and overweight. http://www.who.int/<br />
hpr/NPH/docs/gs_obesity.pdf<br />
2. World Health Organization 2006 Obesity and overweight—fact<br />
sheet no. 311. http://www.who.int/mediacentre/factsheets/fs311/<br />
en/print.html<br />
3. King NA, Hopkins M, Caudwell P, Stubbs RJ, Blundell JE 2008<br />
Individual variability following 12 weeks <strong>of</strong> supervised exercise:<br />
identification and characterization <strong>of</strong> compensation for exerciseinduced<br />
weight loss. Int J Obes (Lond) 32:177–184<br />
4. Epstein LH, Wing RR 1980 Aerobic exercise and weight. Addict<br />
Behav 5:371–388<br />
5. King NA, Caudwell P, Hopkins M, Byrne NM, Colley R, Hills AP,<br />
Stubbs JR, Blundell JE 2007 Metabolic and behavioral compensatory<br />
responses to exercise interventions: barriers to weight loss. Obesity<br />
(Silver Spring) 15:1373–1383<br />
6. Doucet E, Cameron J 2007 Appetite control after weight loss: what<br />
is the role <strong>of</strong> bloodborne peptides? Appl Physiol Nutr Metab 32:<br />
523–532<br />
7. Martins C, Morgan L, Truby H 2008 A review <strong>of</strong> the effects <strong>of</strong><br />
exercise on appetite regulation: an obesity perspective. Int J Obes<br />
(Lond) 32:1337–1347<br />
8. Foster-Schubert KE, McTiernan A, Frayo RS, Schwartz RS, Rajan<br />
KB, Yasui Y, Tworoger SS, Cummings DE 2005 Human plasma<br />
ghrelin levels increase during a one-year exercise program. J Clin<br />
Endocrinol Metab 90:820–825<br />
9. Leidy HJ, Gardner JK, Frye BR, Snook ML, Schuchert MK, Richard<br />
EL, Williams NI 2004 Circulating ghrelin is sensitive to changes in<br />
body weight during a diet and exercise program in normal-weight<br />
young women. J Clin Endocrinol Metab 89:2659–2664
1616 Martins et al. <strong>Exercise</strong> and Appetite Control J Clin Endocrinol Metab, April 2010, 95(4):1609–1616<br />
10. Kim HJ, Lee S, Kim TW, Kim HH, Jeon TY, Yoon YS, Oh SW, Kwak<br />
H, Lee JG 2008 <strong>Effects</strong> <strong>of</strong> exercise-induced weight loss on acylated<br />
and unacylated ghrelin in overweight children. Clin Endocrinol<br />
(Oxf) 68:416–422<br />
11. Jones TE, Basilio JL, Brophy PM, McCammon MR, Hickner RC<br />
2009 Long-term exercise training in overweight adolescents improves<br />
plasma peptide YY and resistin. Obesity (Silver Spring) 17:<br />
1189–1195<br />
12. Chanoine JP, Mackelvie KJ, Barr SI, Wong AC, Meneilly GS, Elahi<br />
DH 2008 GLP-1 and Appetite Responses to a Meal in Lean and<br />
Overweight Adolescents Following <strong>Exercise</strong>. Obesity (Silver Spring)<br />
16:202–204<br />
13. Stunkard AJ, Messick S 1985 <strong>The</strong> Three-factor Eating Questionnaire<br />
to measure dietary restraint, desinhibition and hunger. J Psychosom<br />
Res 29:71–83<br />
14. Hill AJ, Leathwood PD, Blundell JE 1987 Some evidence for shortterm<br />
caloric compensation in normal weight human subjects: the<br />
effects <strong>of</strong> high- and low-energy meals on hunger, food preference<br />
and food intake. Hum Nutr Appl Nutr 41:244–257<br />
15. Schmidt PT, Ljung T, Hartmann B, Hare KJ, Holst JJ, HellströmPM<br />
2005 Tissue levels and postprandial secretion <strong>of</strong> the intestinal<br />
growth factor, GLP-2, in inflammatory bowel disease: comparison<br />
with PYY. Eur J Gastroenterol Hepatol 17:207–212<br />
16. Orskov C, Rabenhøj L, Wettergren A, K<strong>of</strong>od H, Holst JJ 1994<br />
Tissue and plasma concentrations <strong>of</strong> amidated and glycine- extended<br />
glucagon-like peptide I in humans. Diabetes 43:535–539<br />
17. University <strong>of</strong> Oxford 2007 HOMA2 calculator, version 2.2. http://<br />
www.dtu.ox.ac.uk/index.php?maindoc�/homa/history.php<br />
18. Zwirska-Korczala K, Konturek SJ, Sodowski M, Wylezol M, Kuka<br />
D, Sowa P, Adamczyk-Sowa M, Kukla M, Berdowska A, Rehfeld JF,<br />
Bielanski W, Brzozowski T 2007 Basal and postprandial plasma<br />
levels <strong>of</strong> PYY, ghrelin, cholecystokinin, gastrin and insulin in women<br />
with moderate and morbid obesity and metabolic syndrome.<br />
J Physiol Pharmacol 58(Suppl 1):13–35<br />
19. Adam TC, Jocken J, Westerterp-Plantenga MS 2005 Decreased glucagon-like<br />
peptide 1 release after weight loss in overweight/obese<br />
subjects. Obes Res 13:710–716<br />
20. Ravussin E, Tschöp M, Morales S, Bouchard C, Heiman ML 2001<br />
Plasma ghrelin concentration and energy balance: overfeeding and<br />
negative energy balance studies in twins. J Clin Endocrinol Metab<br />
86:4547–4551<br />
21. King NA, Caudwell PP, Hopkins M, Stubbs JR, Naslund E, Blundell<br />
JE 2009 Dual process action <strong>of</strong> exercise on appetite control: increase<br />
in orexigenic drive but improvement in meal-induced satiety. Am J<br />
Clin Nutr 90:921–927<br />
22. Martins C, Truby H, Morgan LM 2007 Short-term appetite control<br />
in response to a 6-week exercise programme in sedentary<br />
volunteers. Br J Nutr 98:834–842


