The Effects Of Exercise-Induced Weight Loss On - The Journal of ...
The Effects Of Exercise-Induced Weight Loss On - The Journal of ...
The Effects Of Exercise-Induced Weight Loss On - The Journal of ...

You also want an ePaper? Increase the reach of your titles
YUMPU automatically turns print PDFs into web optimized ePapers that Google loves.
J Clin Endocrinol Metab, April 2010, 95(4):1609–1616 jcem.endojournals.org 1613<br />
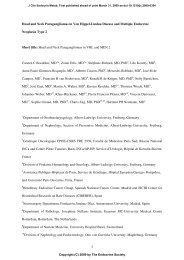
FIG. 2. TG (top) and acylated ghrelin (AG) (bottom) plasma levels (pg/<br />
ml) over time after breakfast, before (�) and after a 12-wk exercise<br />
intervention (�). Values represent means � SEM for 15 subjects.<br />
Repeated measures ANOVA showed a significant effect <strong>of</strong> time (P �<br />
0.0001), but no effect <strong>of</strong> exercise or interactions for TG and no<br />
significant main effect <strong>of</strong> time, exercise, or interactions for AG.<br />
No significant effects <strong>of</strong> time, exercise, or exercise �<br />
time interaction were observed on AG plasma levels (Fig.<br />
2). However, a closer analysis <strong>of</strong> the data revealed no<br />
significant effect <strong>of</strong> time at baseline between fasting at t �<br />
90 min [F(2.57, 30.79) � 3.14; P � 0.05], but a significant<br />
effect <strong>of</strong> time (suppression) at the end <strong>of</strong> the intervention<br />
[F(1.62, 19.42) � 9.79; P � 0.002]. Moreover, a significant<br />
increase (127%) in the amplitude <strong>of</strong> change in AG<br />
plasma levels (peak � nadir) was observed with the exercise<br />
intervention (12.4 � 11.1 vs. 28.1 � 21.4 pmol/liter;<br />
t ��3.061; df � 13; P � 0.009).<br />
A significant effect <strong>of</strong> time [F(2.599, 33.781) � 12.839;<br />
P � 0.0001], but no main effect <strong>of</strong> exercise or interaction<br />
was observed on GLP-1 plasma levels (Fig. 3). Total<br />
GLP-1 AUC (fasting up to 180 min) did not change with<br />
the exercise intervention, but there was a tendency for a<br />
higher GLP-1 AUC on the last 90 (90–180 min) and 60<br />
postprandial minutes (120–180 min) after the 12-wk exercise<br />
intervention compared with baseline (1491 � 365<br />
vs. 1689 � 430 pmol/liter�min, t ��2.242, df � 14, P �<br />
0.042; and 991 � 231 vs. 1126 � 248, t ��2.388, df �<br />
14, P � 0.032, respectively).<br />
A significant effect <strong>of</strong> time [F(3.291, 42.789) � 10.802;<br />
P � 0.0001], but no effect <strong>of</strong> exercise or interaction, was<br />
observed on PYY plasma levels (Fig. 3). Total PYY AUC<br />
(fasting up to 180 min) did not change with the exercise<br />
intervention, but there was a tendency for higher PYY<br />
AUC between 120 and 180 min after the 12-wk exercise<br />
intervention compared with baseline (798 � 224 vs.<br />
888 � 211; t ��1.770; df � 14; P � 0.099).<br />
FIG. 3. GLP-1 (top) and PYY (bottom) plasma levels (pmol/liter) over<br />
time after breakfast, before (�) and after a 12-wk exercise<br />
intervention (�). Values represent means � SEM for 15 subjects.<br />
Repeated measures ANOVA showed a significant effect <strong>of</strong> time (P �<br />
0.0001; P � 0.001), but no effect <strong>of</strong> exercise or interactions for both<br />
GLP-1 and PYY, respectively.<br />
Subjective feelings <strong>of</strong> appetite<br />
Fasting state<br />
<strong>The</strong>re was a significant increase in fasted subjective<br />
feelings <strong>of</strong> hunger (4.1 � 1.6 vs. 6.5 � 2.5 cm; t ��3.126;<br />
df � 14; P � 0.01), desire to eat (4.8 � 1.5 vs. 6.4 � 2.3<br />
cm; t ��2.604; df � 14; P � 0.05), and prospective food<br />
consumption (6.0 � 1.6 vs. 7.1 � 2.0 cm; t ��2.286; df �<br />
14; P � 0.05), and a significant reduction in fullness feelings<br />
(3.5 � 1.1 vs. 1.9 � 1.5 cm; t � 3.261; df � 14; P �<br />
0.01) after the 12-wk exercise intervention.<br />
Postprandial state<br />
A significant effect <strong>of</strong> time [F(3.039, 42.553) � 20.910;<br />
P � 0.0001] and exercise [F(1,14) � 10.901; P � 0.01]<br />
was observed on subjective feelings <strong>of</strong> hunger, which<br />
increased after the 12-wk exercise intervention compared<br />
with baseline levels (Fig. 4). A significant effect <strong>of</strong><br />
time [F(3.425, 47.944) � 30.693; P � 0.0001] and a<br />
time � exercise interaction [F(3.908, 54.707) � 4.319; P �<br />
0.01], but no main effect <strong>of</strong> exercise, was observed on<br />
subjective feelings <strong>of</strong> fullness (Fig. 4). A significant effect<br />
<strong>of</strong> time [F(7,91) � 16.724; P � 0.0001] and exercise<br />
[F(1,13) � 5.517; P � 0.05] was also observed on subjective<br />
feelings <strong>of</strong> desire to eat, with a similar pattern to<br />
that described for hunger feelings (data not shown). A<br />
significant effect <strong>of</strong> time [F(2.716, 38.027) � 17.846; P �<br />
0.0001], but no main effect <strong>of</strong> exercise or interaction, was<br />
observed on subjective feelings <strong>of</strong> prospective food consumption<br />
(data not shown).