Life cycle environmental impacts of Spanish tuna fisheries
Life cycle environmental impacts of Spanish tuna fisheries
Life cycle environmental impacts of Spanish tuna fisheries

Create successful ePaper yourself
Turn your PDF publications into a flip-book with our unique Google optimized e-Paper software.
Abstract<br />
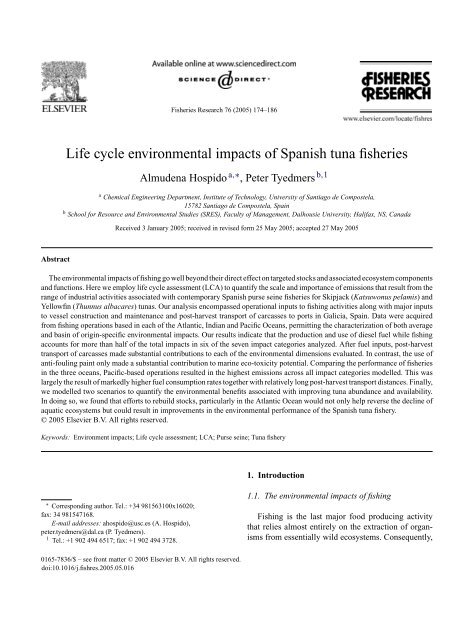
Fisheries Research 76 (2005) 174–186<br />
<strong>Life</strong> <strong>cycle</strong> <strong>environmental</strong> <strong>impacts</strong> <strong>of</strong> <strong>Spanish</strong> <strong>tuna</strong> <strong>fisheries</strong><br />
Almudena Hospido a,∗ , Peter Tyedmers b,1<br />
a Chemical Engineering Department, Institute <strong>of</strong> Technology, University <strong>of</strong> Santiago de Compostela,<br />
15782Santiago de Compostela, Spain<br />
b School for Resource and Environmental Studies (SRES), Faculty <strong>of</strong> Management, Dalhousie University, Halifax, NS, Canada<br />
Received 3 January 2005; received in revised form 25 May 2005; accepted 27 May 2005<br />
The <strong>environmental</strong> <strong>impacts</strong> <strong>of</strong> fishing go well beyond their direct effect on targeted stocks and associated ecosystem components<br />
and functions. Here we employ life <strong>cycle</strong> assessment (LCA) to quantify the scale and importance <strong>of</strong> emissions that result from the<br />
range <strong>of</strong> industrial activities associated with contemporary <strong>Spanish</strong> purse seine <strong>fisheries</strong> for Skipjack (Katsuwonus pelamis) and<br />
Yellowfin (Thunnus albacares) <strong>tuna</strong>s. Our analysis encompassed operational inputs to fishing activities along with major inputs<br />
to vessel construction and maintenance and post-harvest transport <strong>of</strong> carcasses to ports in Galicia, Spain. Data were acquired<br />
from fishing operations based in each <strong>of</strong> the Atlantic, Indian and Pacific Oceans, permitting the characterization <strong>of</strong> both average<br />
and basin <strong>of</strong> origin-specific <strong>environmental</strong> <strong>impacts</strong>. Our results indicate that the production and use <strong>of</strong> diesel fuel while fishing<br />
accounts for more than half <strong>of</strong> the total <strong>impacts</strong> in six <strong>of</strong> the seven impact categories analyzed. After fuel inputs, post-harvest<br />
transport <strong>of</strong> carcasses made substantial contributions to each <strong>of</strong> the <strong>environmental</strong> dimensions evaluated. In contrast, the use <strong>of</strong><br />
anti-fouling paint only made a substantial contribution to marine eco-toxicity potential. Comparing the performance <strong>of</strong> <strong>fisheries</strong><br />
in the three oceans, Pacific-based operations resulted in the highest emissions across all impact categories modelled. This was<br />
largely the result <strong>of</strong> markedly higher fuel consumption rates together with relatively long post-harvest transport distances. Finally,<br />
we modelled two scenarios to quantify the <strong>environmental</strong> benefits associated with improving <strong>tuna</strong> abundance and availability.<br />
In doing so, we found that efforts to rebuild stocks, particularly in the Atlantic Ocean would not only help reverse the decline <strong>of</strong><br />
aquatic ecosystems but could result in improvements in the <strong>environmental</strong> performance <strong>of</strong> the <strong>Spanish</strong> <strong>tuna</strong> fishery.<br />
© 2005 Elsevier B.V. All rights reserved.<br />
Keywords: Environment <strong>impacts</strong>; <strong>Life</strong> <strong>cycle</strong> assessment; LCA; Purse seine; Tuna fishery<br />
∗ Corresponding author. Tel.: +34 981563100x16020;<br />
fax: 34 981547168.<br />
E-mail addresses: ahospido@usc.es (A. Hospido),<br />
peter.tyedmers@dal.ca (P. Tyedmers).<br />
1 Tel.: +1 902 494 6517; fax: +1 902 494 3728.<br />
0165-7836/$ – see front matter © 2005 Elsevier B.V. All rights reserved.<br />
doi:10.1016/j.fishres.2005.05.016<br />
1. Introduction<br />
1.1. The <strong>environmental</strong> <strong>impacts</strong> <strong>of</strong> fishing<br />
Fishing is the last major food producing activity<br />
that relies almost entirely on the extraction <strong>of</strong> organisms<br />
from essentially wild ecosystems. Consequently,
most concern regarding the <strong>environmental</strong> <strong>impacts</strong> <strong>of</strong><br />
fishing has traditionally focused on its direct <strong>impacts</strong><br />
on targeted stocks (Pauly et al., 2002; Christensen<br />
et al., 2003; Myers and Worm, 2003), incidentally<br />
caught and <strong>of</strong>ten discarded organisms (Alverson et al.,<br />
1994; Glass, 2000), physical damage to benthic communities<br />
and substrates (Johnson, 2002; Chuenpagdee<br />
et al., 2003) and the general alteration <strong>of</strong> ecosystem<br />
structure and function (Jackson et al., 2001). While<br />
this focus on largely proximate biological concerns<br />
is understandable given the degraded state <strong>of</strong> many<br />
fish populations and aquatic ecosystems, it is essentially<br />
myopic as it effectively overlooks the diverse<br />
range <strong>of</strong> <strong>environmental</strong> <strong>impacts</strong> that flow from the interlinked<br />
series <strong>of</strong> industrial activities that characterize<br />
most modern fishing systems. These include, but are<br />
not limited to the <strong>impacts</strong> associated with the material<br />
and energy dissipated in the construction and maintenance<br />
<strong>of</strong> fishing vessels (Watanabe and Okubo, 1989;<br />
Hayman et al., 2000), the provision <strong>of</strong> fishing gear<br />
(Ziegler et al., 2003), the combustion <strong>of</strong> fuel while<br />
fishing (Ziegler and Hansson, 2003; Thrane, 2004a;<br />
Tyedmers, 2004) and transporting catch to markets or<br />
for further processing (Karlsen and Angelfoos, 2000;<br />
Andersen, 2002), and the discharge <strong>of</strong> wastes and loss<br />
<strong>of</strong> fishing gear at sea (Derraik, 2002).<br />
One way to systematically describe and quantify<br />
the range <strong>of</strong> <strong>environmental</strong> <strong>impacts</strong> associated with the<br />
industrial aspects <strong>of</strong> fishing is through the use <strong>of</strong> life<br />
<strong>cycle</strong> assessment (LCA). LCA is a standardized, structured<br />
method for calculating a product’s, process’ or<br />
activity’s <strong>environmental</strong> load throughout all its phases,<br />
from the extraction <strong>of</strong> raw materials through production,<br />
distribution, use and, where appropriate, recycling<br />
and treatment <strong>of</strong> waste (Consoli, 1993). While originally<br />
designed to evaluate the life <strong>cycle</strong> <strong>impacts</strong> associated<br />
with manufactured products, LCA is increasingly<br />
being applied to food production systems (Mattsson<br />
and Sonesson, 2003). Within the food sector, it has<br />
been used to both compare the <strong>environmental</strong> performance<br />
<strong>of</strong> competing products, processes, or scales <strong>of</strong><br />
activities (Andersson and Ohlsson, 1999; Haas et al.,<br />
2001), and to identify specific activities or subsystems<br />
that contribute most to the total <strong>environmental</strong> impact<br />
<strong>of</strong> a foodstuff (Andersson et al., 1998; Hospido et al.,<br />
2003). To date, LCA has been used to evaluate relatively<br />
few <strong>fisheries</strong> or seafood products (Ziegler et al.,<br />
2003; Thrane, 2004b). While the number <strong>of</strong> <strong>fisheries</strong><br />
A. Hospido, P. Tyedmers / Fisheries Research 76 (2005) 174–186 175<br />
evaluated has been small, a finding common to all is that<br />
the fish harvesting stage <strong>of</strong> the production <strong>cycle</strong> typically<br />
accounts for between 70 and 95% total <strong>impacts</strong><br />
regardless <strong>of</strong> the impact category considered.<br />
Here we evaluate the life <strong>cycle</strong> <strong>environmental</strong><br />
<strong>impacts</strong> that result from the industrial processes associated<br />
with contemporary <strong>Spanish</strong> purse seine <strong>fisheries</strong><br />
for Skipjack (Katsuwonus pelamis) and Yellowfin <strong>tuna</strong><br />
(Thunnus albacares) undertaken in each <strong>of</strong> the Atlantic,<br />
Pacific and Indian Oceans. As these highly valuable<br />
species are processed into a variety <strong>of</strong> forms and consumed<br />
in countless markets, in order to provide a standard<br />
basis <strong>of</strong> comparison, we characterize <strong>impacts</strong> up<br />
to the point at which frozen carcasses are delivered to<br />
ports in Galicia, NW Spain. While the primary purpose<br />
<strong>of</strong> this work is to illustrate the scale <strong>of</strong> <strong>impacts</strong> associated<br />
with contemporary <strong>Spanish</strong> <strong>tuna</strong> fishing operations<br />
and contrast potential differences arising from<br />
operations undertaken in different oceans, we have a<br />
second equally important rationale; identifying opportunities<br />
to improve the <strong>environmental</strong> performance <strong>of</strong><br />
these <strong>fisheries</strong>. To this end, we pinpoint those subactivities<br />
that contribute most to the overall <strong>impacts</strong> to<br />
focus attention on where future efforts to improve performance<br />
could have greatest effect. As an illustration,<br />
we explore the potential emission reduction benefits to<br />
be gained from efforts to rebuild <strong>tuna</strong> stocks through<br />
the use <strong>of</strong> two modelled scenarios. Taken together,<br />
this research should be <strong>of</strong> particular value to <strong>fisheries</strong><br />
managers, LCA practitioners, those organizations and<br />
individuals with an interest in the <strong>environmental</strong> costs<br />
associated with providing this important food and, <strong>of</strong><br />
course, fishing company owners who are not only in<br />
the best position to effect change but are likely to face<br />
increased costs in the future as a result <strong>of</strong> the <strong>environmental</strong><br />
<strong>impacts</strong> <strong>of</strong> their activities.<br />
1.2. The <strong>Spanish</strong> fishery for Skipjack and Yellowfin<br />
<strong>tuna</strong><br />
Skipjack and Yellowfin <strong>tuna</strong> are, respectively, midand<br />
large-sized members <strong>of</strong> the Scombridae family.<br />
Both are relatively abundant and widely distributed in<br />
tropical and subtropical marine waters where they <strong>of</strong>ten<br />
form large mono-specific and multi-species schools,<br />
frequently in association with floating debris (Scott<br />
et al., 1999; Girard et al., 2004). In the eastern tropical<br />
Pacific, schools <strong>of</strong> large Yellowfin <strong>tuna</strong> are <strong>of</strong>ten
176 A. Hospido, P. Tyedmers / Fisheries Research 76 (2005) 174–186<br />
associated with dolphin, giving rise to one <strong>of</strong> the more<br />
infamous examples <strong>of</strong> by-catch and incidental mortality<br />
<strong>of</strong> marine mammals as a result <strong>of</strong> fishing activities<br />
(Lo and Smith, 1986). Driven by consumer pressure<br />
and trade sanctions, dolphin by-catch and mortality<br />
rates have been greatly reduced but not entirely eliminated<br />
within this fishery (Archer et al., 2004). While<br />
this issue remains a <strong>fisheries</strong> management concern in<br />
the eastern tropical Pacific, it is explicitly excluded<br />
from this analysis reflecting both the certified “dolphinfriendly”<br />
nature <strong>of</strong> the fishing operations analyzed here<br />
and the more general difficulty incorporating biodiversity<br />
<strong>impacts</strong> within the LCA methodology (Haas et al.,<br />
2001).<br />
Globally, catches <strong>of</strong> Skipjack and Yellowfin <strong>tuna</strong><br />
together represent over 70% <strong>of</strong> total <strong>tuna</strong> landings. Of<br />
the nearly 100 countries that regularly report catches<br />
<strong>of</strong> these two species, Spain consistently ranks among<br />
the top five, accounting for approximately 7% <strong>of</strong> the<br />
total aggregate catch, based on annual landings that<br />
routinely exceed 200,000 tonnes (FAO, 2004). Not surprisingly,<br />
<strong>Spanish</strong> catches <strong>of</strong> Skipjack and Yellowfin<br />
traditionally came from Atlantic waters with smaller<br />
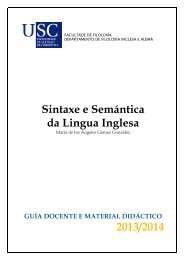
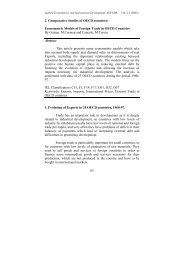
quantities taken in the Pacific (Fig. 1). Beginning in the<br />
mid-1980s, however, <strong>Spanish</strong> vessels began pursuing<br />
Skipjack and Yellowfin in the Indian Ocean. Landings<br />
from these operations increased rapidly to the point that<br />
they now represent approximately two thirds <strong>of</strong> Spain’s<br />
total catch <strong>of</strong> these species (Fig. 1). <strong>Spanish</strong>, along with<br />
other European <strong>tuna</strong> fishing efforts are likely to con-<br />
tinue to expand in the Indian Ocean as it is believed that<br />
almost 70% <strong>of</strong> the world’s remaining <strong>tuna</strong> biomass is<br />
located here (DGF, 2004).<br />
Regardless <strong>of</strong> where they are taken, virtually all<br />
<strong>Spanish</strong> <strong>tuna</strong> catches are shipped home, mostly to ports<br />
in Galicia, for processing and distribution. Within its<br />
borders, Galician-based <strong>tuna</strong> fishing and processing<br />
activities are some <strong>of</strong> the largest and most valuable<br />
<strong>fisheries</strong> industries in Spain (Department <strong>of</strong> Maritime<br />
Affairs and Fisheries, 2001).<br />
From a technological perspective, while a diverse<br />
range <strong>of</strong> fishing gears is used to capture <strong>tuna</strong>s, purse<br />
seining accounts for the majority <strong>of</strong> landings globally.<br />
In 2003, fully 60% <strong>of</strong> all <strong>tuna</strong>s, and 70% <strong>of</strong> all Skipjack<br />
and Yellowfin landed globally were caught by purse<br />
seiners (FAO, 2005).<br />
2. Materials and methods<br />
2.1. LCA: definition and stages<br />
Through the efforts <strong>of</strong> the Society <strong>of</strong> Environmental<br />
Toxicology and Chemistry (SETAC) and the International<br />
Organization for Standardization (ISO), formal<br />
life <strong>cycle</strong> assessments have been methodologically<br />
standardized into a four step process (ISO, 2000):<br />
• Step 1. Goal and scope definition. In which the functional<br />
unit <strong>of</strong> the analysis, essentially the basis upon<br />
Fig. 1. History <strong>of</strong> annual <strong>Spanish</strong> and Worldwide <strong>tuna</strong> catches, 1970–2002. Source: FAO (2004).
which <strong>impacts</strong> are quantified and compared, is first<br />
defined, and then the boundaries <strong>of</strong> the system to be<br />
analyzed and the <strong>environmental</strong> impact categories <strong>of</strong><br />
concern are determined.<br />
In our analysis, the functional unit selected<br />
is 1 tonne <strong>of</strong> frozen unprocessed <strong>tuna</strong>, while its<br />
boundaries encompass all major industrial activities<br />
required to catch and deliver frozen <strong>tuna</strong> carcasses<br />
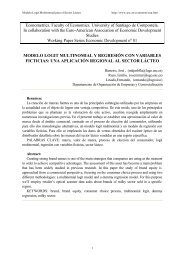
to the dockside in Galician ports (Fig. 2).<br />
More specifically, we analyzed major operational<br />
inputs and outputs associated with both fishing activities<br />
undertaken by <strong>Spanish</strong> purse seiners in each <strong>of</strong><br />
the Atlantic, Pacific and Indian Oceans and postharvest<br />
transportation activities. In addition, our<br />
analysis encompassed three pre-harvest activities<br />
namely vessel construction, diesel fuel production,<br />
and the manufacture <strong>of</strong> anti-fouling paint used on<br />
fishing vessels to reduce drag.<br />
Methodologically, a problem-oriented (midpoint)<br />
approach was adopted and following the recommendations<br />
<strong>of</strong> Guinèe et al. (2001), seven <strong>environmental</strong><br />
impact categories, namely global warming<br />
potential (GWP), stratospheric ozone depletion<br />
potential (ODP), acidification potential (AP),<br />
eutrophication potential (EP), photo-oxidant formation<br />
potential (POFP), and finally human toxicity<br />
and marine aquatic eco-toxicity potentials (HTP and<br />
MTP, respectively), were chosen to quantify the<br />
<strong>environmental</strong> <strong>impacts</strong> associated with the activities<br />
under consideration.<br />
A. Hospido, P. Tyedmers / Fisheries Research 76 (2005) 174–186 177<br />
• Step 2. Inventory analysis. This time-consuming step<br />
involves the compilation and quantification, to the<br />
extent that is practicable, <strong>of</strong> relevant inputs and outputs<br />
associated with the activities within the system<br />
boundaries, including the use <strong>of</strong> resources and emissions<br />
to air, water and soil. Details <strong>of</strong> the inventory<br />
analysis data collection steps undertaken appear in<br />
Section 2.2.<br />
• Step 3. Impact assessment. To understand and evaluate<br />
the magnitude and significance <strong>of</strong> the resulting<br />
<strong>environmental</strong> <strong>impacts</strong>, raw resource inputs and<br />
emissions associated with the provision <strong>of</strong> the<br />
functional unit are classified and converted into<br />
standardized indicators based on standardized characterization<br />
factors; e.g. all greenhouse gases are<br />
expressed in terms <strong>of</strong> CO2 equivalents (Goedkoop<br />
and Oele, 2003b). A further optional step, but<br />
one undertaken here, entails the re-expression <strong>of</strong><br />
the scale <strong>of</strong> <strong>impacts</strong> based on their proportional<br />
contribution to a given region’s or global resource<br />
consumption or emission rates (ISO, 2000). This<br />
step, typically referred to as the normalization <strong>of</strong><br />
<strong>impacts</strong> stage, is particularly useful in highlighting<br />
the most serious <strong>environmental</strong> dimensions <strong>of</strong> the<br />
activity under study. Here, normalization scores<br />
were based on global resource consumption and<br />
emission rates for 1995 as this was the most recent<br />
complete list <strong>of</strong> global data available (Huijbregts<br />
et al., 2003). While all impact assessment computations,<br />
including the normalization <strong>of</strong> results,<br />
Fig. 2. Block diagram <strong>of</strong> the system studied. Dotted line represents the system boundaries.
178 A. Hospido, P. Tyedmers / Fisheries Research 76 (2005) 174–186<br />
can be undertaken manually, the process is greatly<br />
facilitated with the use <strong>of</strong> dedicated LCA s<strong>of</strong>tware.<br />
In this analysis, we used PRé Consultants’ SimaPro<br />
5.1, LCA s<strong>of</strong>tware (Goedkoop and Oele, 2002).<br />
• Step 4. Interpretation. This phase entails the analysis<br />
and reporting <strong>of</strong> results, limitations and implications<br />
<strong>of</strong> the research. In order to more fully explore the<br />
latter, we modelled two hypothetical scenarios<br />
derived from the base case analysis to assess the<br />
potential <strong>environmental</strong> <strong>impacts</strong> that could result<br />
from changes in how easily and where <strong>tuna</strong> are<br />
caught by <strong>Spanish</strong> vessels. Specific details regarding<br />
the scenarios modelled appear in Section 2.3. As<br />
LCAs typically draw upon diverse data sources <strong>of</strong><br />
variable quality, we undertook sensitivity analyses<br />
to explore the impact <strong>of</strong> changes in input parameters.<br />
Results <strong>of</strong> two <strong>of</strong> these sensitivity analyses are<br />
included.<br />
2.2. Data acquisition<br />
2.2.1. Operational inputs to fishing<br />
Prior LCA and similar analyses <strong>of</strong> fishing systems<br />
have found that direct operational inputs, and in<br />
particular fuel consumption, generally dominate the<br />
energetic and <strong>environmental</strong> performance <strong>of</strong> seafood<br />
production (Edwardson, 1976; Watanabe and Okubo,<br />
1989; Ziegler et al., 2003; Thrane, 2004a; Tyedmers,<br />
2004). Consequently, care was taken to acquire<br />
detailed, broadly representative data regarding the<br />
inputs and outputs associated with contemporary <strong>Spanish</strong><br />
purse seine operations in each <strong>of</strong> the Atlantic,<br />
Pacific and Indian Oceans. To this end, three Galician<br />
<strong>tuna</strong> fishing companies were surveyed. Vesselspecific<br />
data requested included the number and identity<br />
<strong>of</strong> purse seine vessels engaged in <strong>tuna</strong> fishing,<br />
together with their overall length, gross registered tonnage,<br />
propulsive engine power and base <strong>of</strong> operations<br />
in 2003. For each vessel, operational data requested<br />
included the type, quality and amount <strong>of</strong> diesel fuel<br />
burned, days at sea, crew size, and the quantity, type<br />
and application frequency <strong>of</strong> anti-fouling paint used.<br />
Finally, resulting species-specific annual catch data<br />
were requested for each vessel.<br />
2.2.2. Vessel construction<br />
As material and energy inputs to vessel construction<br />
and maintenance have previously been found to<br />
make relatively small contributions to the <strong>environmental</strong><br />
<strong>impacts</strong> <strong>of</strong> seafood products (Hayman et al.,<br />
2000; Huse et al., 2002), we restricted our analysis<br />
to quantifying only those <strong>impacts</strong> associated with<br />
providing the steel used in vessel hulls, superstructures<br />
and engines. In this regard, data were solicited<br />
from the technical manager <strong>of</strong> a <strong>Spanish</strong> shipyard<br />
(Mr. Pedro Lopez, Shipyard Barreras, September 2004,<br />
pers. commun.) and two manufacturers <strong>of</strong> marine diesel<br />
engines (Caterpillar, 2004; Wärtsilä, 2003). Following<br />
Tyedmers (2000), the amount <strong>of</strong> steel required<br />
to build each vessel was increased by 25% for the<br />
hull and 50% for the engines to account for additional<br />
inputs required for repairs and maintenance over<br />
the life <strong>of</strong> the vessel. Total mass <strong>of</strong> steel inputs per<br />
vessel were re-expressed on the basis <strong>of</strong> an average<br />
tonne <strong>of</strong> <strong>tuna</strong> caught by assuming a functional working<br />
life for the hull and engine <strong>of</strong> 30 and 10 years,<br />
respectively (Tyedmers, 2000), and an average annual<br />
catch equivalent to 2003 landings. As prior analyses<br />
have found that the provision <strong>of</strong> fishing gear typically<br />
makes a smaller contribution to the overall material<br />
and energy pr<strong>of</strong>ile <strong>of</strong> a fishery when compared with<br />
inputs to vessel construction (Rawitscher and Mayer,<br />
1977; Tyedmers, 2000; Ziegler et al., 2003; Tyedmers,<br />
2004), particularly within the context <strong>of</strong> purse seine<br />
<strong>fisheries</strong> (Tyedmers, 2000), we have excluded it from<br />
this analysis.<br />
2.2.3. Quantifying un-monitored emissions<br />
While actual fuel consumption data were solicited<br />
from fishing companies, resulting emissions <strong>of</strong> exhaust<br />
gases had to be calculated. This was done using emission<br />
factors derived from a study <strong>of</strong> 40 vessels <strong>of</strong><br />
various sizes, operating under real-world conditions<br />
(Engineering Services Group, 1995). Although none<br />
<strong>of</strong> the vessels monitored in this prior study were fishing<br />
boats (vessels monitored included container ships,<br />
tugs, Ro-Ro ferries, dredges, bulk carriers and tankers),<br />
given the diverse range <strong>of</strong> operations represented and<br />
the current lack <strong>of</strong> published emission data derived<br />
from the monitoring <strong>of</strong> fishing vessels <strong>of</strong> any kind operating<br />
under real-world conditions, we believe that these<br />
values provide a reasonable first approximation <strong>of</strong> reality.<br />
<strong>Life</strong> <strong>cycle</strong> inputs and outputs associated with the<br />
extraction, production and distribution <strong>of</strong> diesel fuel<br />
were taken from SimaPro (Table 1). In order to quan-
A. Hospido, P. Tyedmers / Fisheries Research 76 (2005) 174–186 179<br />
Table 1<br />
Sources, period and geographical origin <strong>of</strong> data for the LCA<br />
Element Databasea Fuels<br />
Period Geographic area<br />
Diesel oil B BUWAL 300 1990–1994 Europe, Western<br />
Heavy oil<br />
Raw materials for vessel building<br />
BUWAL 300 1990–1994 Europe, Western<br />
Steel IDEMAT 2001 1995–1999 Europe, Western<br />
Iron<br />
Anti-fouling ingredients<br />
IDEMAT 2001 1995–1999 Europe, Western<br />
Dicopper oxide Not available – –<br />
Zinc oxide Not available – –<br />
Xylene PRe 4 database 1990–1994 Europe, Western<br />
Ethyl benzene PRe 4 database 1985–1999 Europe, Western<br />
Sea nine 211<br />
Energy<br />
Not available – –<br />
Electricity BUWAL 250 1990–1994 Europe, Western<br />
Thermal BUWAL 250 1990–1994 Europe, Western<br />
a Consult literature references at SimaPro 5.1.<br />
tify the amount <strong>of</strong> anti-fouling paint lost to the marine<br />
environment, a typical loss rate <strong>of</strong> two-thirds <strong>of</strong> that<br />
applied was employed (Mr. Martin Porsbjerg, Hempel,<br />
August 2004, pers. commun.). Data regarding the material<br />
and energy consumption and resulting emissions<br />
associated with the production <strong>of</strong> anti-fouling paints<br />
were obtained from a leading manufacturer, Hempel<br />
A/S (Hempel, 2004).<br />
In the normal course <strong>of</strong> life on board ship, crew<br />
members generate solid and liquid wastes. Quantities<br />
<strong>of</strong> solid wastes generated and later delivered to land<br />
for disposal were estimated at 2.5 kg per crewmember<br />
per day (Mr. Aage Heie, Interconsult Norsas, July 2004,<br />
pers. commun.). Discharges <strong>of</strong> organic matter to the sea<br />
were calculated based on the typical amount <strong>of</strong> wastewater<br />
generated per inhabitant-equivalent (Ronzano and<br />
Dapena, 2002) and the standard removal rate for biological<br />
filters (García, 2000).<br />
In all other situations in which no direct data were<br />
available, the databases available with SimaPro 5.1<br />
(Goedkoop and Oele, 2003a) were used to complete<br />
the inventory (Table 1).<br />
2.2.4. Operational inputs to marine transport<br />
As the fishing activities analyzed span the globe,<br />
and the basis <strong>of</strong> comparison is a tonne <strong>of</strong> frozen <strong>tuna</strong><br />
delivered to the dockside in Galicia, it was necessary<br />
to account for major operational inputs and emissions<br />
associated with the trans-shipment <strong>of</strong> frozen carcasses.<br />
To this end, the shortest maritime route between<br />
each fishing vessel’s base <strong>of</strong> operations and the final<br />
destination harbours in Galicia (A. Coruña, La Puebla,<br />
among others) was quantified using Dataloy’s online<br />
shipping mileage calculator (Dataloy, 2000). Associated<br />
fuel consumption and resulting emissions were<br />
estimated from a real-world analysis <strong>of</strong> Norwegian<br />
frozen fish transport systems (Karlsen and Angelfoos,<br />
2000).<br />
2.3. Scenario modelling<br />
In addition to characterizing the <strong>environmental</strong> performance<br />
<strong>of</strong> contemporary <strong>Spanish</strong> <strong>tuna</strong> fishing activities<br />
(Scenario 0), we modelled two scenarios to quantify<br />
the secondary <strong>environmental</strong> benefits that could<br />
result from improvements in <strong>tuna</strong> abundance and availability.<br />
The first scenario modelled (Sc 1) reflects a<br />
situation in which the fuel use intensity <strong>of</strong> fishing operations,<br />
essentially the amount <strong>of</strong> fuel burned per tonne<br />
<strong>of</strong> fish landed, in two <strong>of</strong> the three oceans is decreased<br />
to the level <strong>of</strong> the most productive fishery in 2003<br />
(i.e. in the third ocean) while keeping all other aspects<br />
<strong>of</strong> <strong>Spanish</strong> <strong>tuna</strong> fishing activities in 2003, including<br />
the distribution <strong>of</strong> harvests, constant. The second scenario<br />
modelled (Sc 2) builds on the first in which all<br />
<strong>tuna</strong> are caught using relatively low fuel inputs but<br />
reflects a situation, similar to that <strong>of</strong> the early 1980s,<br />
in which all <strong>Spanish</strong> catches <strong>of</strong> Skipjack and Yel-
180 A. Hospido, P. Tyedmers / Fisheries Research 76 (2005) 174–186<br />
lowfin are caught exclusively from the Atlantic Ocean<br />
(Fig. 1).<br />
3. Results<br />
3.1. Inputs to fishing<br />
Of the three companies contacted, two provided the<br />
complete range <strong>of</strong> data requested. In 2003, these two<br />
companies operated a total <strong>of</strong> nine purse seiners that<br />
targeted Skipjack and Yellowfin <strong>tuna</strong>, three in each<br />
<strong>of</strong> the Atlantic, Pacific and Indian Oceans. Together,<br />
these vessels landed a total <strong>of</strong> 78,000 tonnes <strong>of</strong> these<br />
two species, representing fully 25% <strong>of</strong> total <strong>Spanish</strong>,<br />
and nearly 2% <strong>of</strong> global <strong>tuna</strong> landings in 2003 (FAO,<br />
2005). In the process <strong>of</strong> doing so, the nine boats burned<br />
just over 34 million litres <strong>of</strong> low sulphur (maximum<br />
0.2% S) diesel fuel for an average fuel use intensity<br />
<strong>of</strong> 436 l/tonne (Table 2). Interestingly, average fuel<br />
use inputs ranged widely between fishing operations.<br />
Vessels based in the Indian Ocean burned an average<br />
<strong>of</strong> 373 l/tonne (S.D. 31) <strong>of</strong> <strong>tuna</strong> landed while vessels<br />
operating in the Atlantic and Pacific Oceans averaged<br />
442 l/tonne (S.D. 80) and 527 l/tonne (S.D. 43),<br />
respectively (Table 2). Both companies painted their<br />
vessels every second year with tin-free anti-fouling<br />
paint containing two active ingredients, dicopper oxide<br />
Table 2<br />
Summary <strong>of</strong> inventory data<br />
(Cu2O) and sea-nine 211 (4,5-dichloro-2-n-octyl-4isothiazolin-3-one).<br />
Across all vessels, an average <strong>of</strong><br />
just under 0.1 l <strong>of</strong> paint was applied per tonne <strong>of</strong> <strong>tuna</strong><br />
landed resulting in emissions <strong>of</strong> 0.06 l <strong>of</strong> paint to the<br />
marine environment per tonne <strong>of</strong> <strong>tuna</strong> (Table 2). This<br />
rate <strong>of</strong> paint loss to the environment is generally consistent<br />
with that reported by Thrane (2004b) for Danish<br />
<strong>fisheries</strong>.<br />
Steel inputs vary with vessel size. As a result, the<br />
three boats operating in the Pacific Ocean, with an<br />
average length <strong>of</strong> just over 80 m, not only embodied<br />
the greatest mass <strong>of</strong> steel in their hulls, superstructure<br />
and engines but because <strong>of</strong> their proportionally smaller<br />
catches in 2003, also had the highest estimated inputs<br />
<strong>of</strong> steel per tonne <strong>of</strong> <strong>tuna</strong> landed at 8.7 kg (Table 2).<br />
Minimum post-harvest transport distances ranged from<br />
4538 km in the case <strong>of</strong> <strong>tuna</strong> caught in the Atlantic Ocean<br />
to 9165 and 10,140 km in the case <strong>of</strong> fish caught in the<br />
Pacific and Indian Oceans, respectively.<br />
3.2. <strong>Life</strong> <strong>cycle</strong> impact assessment<br />
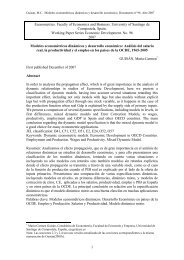
Fig. 3 presents the relative contribution that various<br />
fishing-related activities make to the seven impact categories<br />
<strong>of</strong> interest. In the case <strong>of</strong> all but one <strong>of</strong> the impact<br />
categories analyzed (marine toxicity potential), the production<br />
and/or use <strong>of</strong> diesel fuel accounts for more than<br />
half <strong>of</strong> the total impact (ranging between 54 and 74%).<br />
Ocean <strong>of</strong> capture Total/average<br />
Atlantic Indian Pacific<br />
Vessel characteristics<br />
Number <strong>of</strong> vessels 3 3 3 9<br />
Average length (m) 63.3 65.7 80.5 69.9<br />
Average main engine power (kW) 3182 3305 4386 3625<br />
Average number <strong>of</strong> crew<br />
Annual operating inputs and outputs in 2003—all vessels<br />
28 30 29 29<br />
Low sulphur diesel B (m3 ) 10131 10946 13061 34138<br />
Tin-free anti-fouling paint (l) 2100 2460 2480 7040<br />
Catch <strong>of</strong> Skipjack and Yellowfin <strong>tuna</strong> (tonne) 23452 29554 24994 78000<br />
Inputs <strong>of</strong> steel for vessels and engines—average per vessel and tonne landed<br />
Steel in hull/vessel (tonne) 897 921 1280 1033<br />
Steel in hull/tonne <strong>of</strong> <strong>tuna</strong> (kg) 4.83 3.97 6.40 4.48<br />
Steel for main engines/vessel (tonne) 125 125 125 125<br />
Steel for main engines/tonne <strong>of</strong> <strong>tuna</strong> (kg) 2.44 1.95 2.28 2.12<br />
Transport <strong>of</strong> frozen carcasses to harbours in Galicia (Spain)<br />
Distance (km) 4538 10140 9165 8623
Fig. 3. Relative contribution to <strong>environmental</strong> <strong>impacts</strong> associated<br />
with the catching and delivery <strong>of</strong> frozen <strong>tuna</strong> to Galician harbours.<br />
Note: Impacts associated with the production <strong>of</strong> anti-fouling paint<br />
and emissions <strong>of</strong> both solid waste and wastewater are not presented<br />
as they each contributed less than 1% <strong>of</strong> the total impact in all the<br />
categories.<br />
More specifically, in the case <strong>of</strong> most emissions, it is<br />
the direct combustion <strong>of</strong> fuel while fishing that accounts<br />
for the majority <strong>of</strong> fuel use related <strong>impacts</strong>. Reflecting<br />
the great distances that a large proportion <strong>of</strong> <strong>Spanish</strong>caught<br />
<strong>tuna</strong> are transported post-harvest, this activity<br />
makes a substantial contribution, <strong>of</strong> between 26 and<br />
45%, to each <strong>of</strong> the <strong>environmental</strong> dimensions characterized<br />
(Fig. 3). In contrast, the use <strong>of</strong> anti-fouling<br />
paint only makes a considerable impact, accounting for<br />
46% <strong>of</strong> the total contribution, to a single impact category,<br />
marine toxicity potential. Of dramatically less<br />
importance were the <strong>impacts</strong> that flowed from vessel<br />
construction, anti-fouling paint production, and the<br />
discharge <strong>of</strong> crew-generated solid and liquid wastes.<br />
Indeed, all <strong>of</strong> these activities combined contributed less<br />
than 7%, and typically well under 2% to all <strong>of</strong> the emission<br />
categories quantified.<br />
A. Hospido, P. Tyedmers / Fisheries Research 76 (2005) 174–186 181<br />
Fig. 4. Weighted average, and ocean <strong>of</strong> origin specific absolute contributions<br />
<strong>of</strong> <strong>Spanish</strong> <strong>tuna</strong> <strong>fisheries</strong> for Skipjack and Yellowfin <strong>tuna</strong> in<br />
2003. All values per tonne <strong>of</strong> <strong>tuna</strong> delivered to Galician ports normalized<br />
relative to total global emissions in 1995. Error bars reflect the<br />
range <strong>of</strong> outcomes that result from increasing or decreasing average<br />
fuel inputs by 1 S.D.<br />
By combining the highest average fuel consumption<br />
rates with relatively long post-harvest transport<br />
distances (Table 2), vessels operating in the eastern<br />
tropical Pacific gave rise to consistently higher life<br />
<strong>cycle</strong> emissions in comparison with operations in either<br />
the Atlantic or Indian Oceans (Table 3, Fig. 4).<br />
On average, for every tonne <strong>of</strong> frozen <strong>tuna</strong> delivered<br />
to the dockside, <strong>Spanish</strong> <strong>fisheries</strong> released the<br />
equivalent <strong>of</strong> 62 tonnes <strong>of</strong> 1,4-dichlorobenzene <strong>of</strong><br />
Table 3<br />
Characterization values associated with the capture and delivery <strong>of</strong> 1 tonne <strong>of</strong> <strong>tuna</strong> to Galician ports<br />
Impact category (reference substance) Ocean <strong>of</strong> capture Weighted average<br />
Atlantic Indian Pacific<br />
Global warming potential (kg CO2) 1600 1700 2200 1800<br />
Ozone depletion potential (g CFC11) 1.4 1.4 1.8 1.5<br />
Acidification potential (kg SO2) 20 25 29 24<br />
Eutrophication potential (kg PO4 3− ) 3.4 3.6 4.5 3.7<br />
Photo-oxidant formation potential (kg C2H4) 0.12 0.12 0.15 0.12<br />
Human toxicity potential (kg 1,4DCB) 180 190 230 190<br />
Marine toxicity potential (kg 1,4DCB) 56000 63000 72000 62000
182 A. Hospido, P. Tyedmers / Fisheries Research 76 (2005) 174–186<br />
Table 4<br />
Potential <strong>environmental</strong> impact reductions (%) associated with hypothetical<br />
scenarios<br />
Impact category Sc 1 Sc 2<br />
Global warming potential (GWP) 6.3 19.3<br />
Acidification potential (AP) 4.7 26.1<br />
Eutrophication potential (EP) 6.4 18.7<br />
Marine toxicity potential (MTP) 2.5 13.9<br />
toxic substances to the marine environment, along<br />
with the equivalent <strong>of</strong> 1.8 tonne CO2, 190 kg 1,4dichlorobenzene,<br />
24 kg SO4, 3.7 kg PO4 3− , 120 g<br />
C2H4 and 1.5 g CFC11 to the atmosphere (Table 3).<br />
The relative importance <strong>of</strong> these emissions is easily<br />
seen when compared to global emissions in 1995<br />
(Fig. 4). Regardless <strong>of</strong> where they were conducted, the<br />
<strong>fisheries</strong> analyzed had the greatest relative impact on,<br />
in descending order <strong>of</strong> importance, marine eco-toxicity,<br />
acid precipitation, global warming and eutrophication.<br />
Markedly less important still were contributions made<br />
to human toxicity, ozone depletion and photo-chemical<br />
smog generation (Fig. 4).<br />
3.3. Modelled scenarios<br />
The first scenario modelled (Sc 1) in which direct<br />
fuel inputs to fishing operations in both the Atlantic and<br />
Pacific are reduced to the level at which vessels operating<br />
in the Indian Ocean currently burn fuel, while<br />
keeping all other aspects <strong>of</strong> <strong>Spanish</strong> <strong>tuna</strong> <strong>fisheries</strong> constant,<br />
would only result in reductions <strong>of</strong> between 2 and<br />
6% across the four most important impact categories<br />
(Sc1inTable 4). However, a larger <strong>environmental</strong> performance<br />
improvement could be achieved if all <strong>Spanish</strong><br />
fishing activities for Yellowfin and Skipjack were<br />
undertaken exclusively in the Atlantic Ocean, thereby<br />
reducing the sizable emissions that result from the postharvest<br />
transport <strong>of</strong> carcasses. Combining these two<br />
possible changes, i.e. all <strong>tuna</strong> are taken in the Atlantic<br />
at an average fuel combustion rate <strong>of</strong> 373 l/tonne (Sc<br />
2), would result in improvements <strong>of</strong> between 14 and<br />
26% over the current situation (Table 4).<br />
3.4. Sensitivity analysis<br />
The <strong>environmental</strong> <strong>impacts</strong> described above in the<br />
base case analysis result from data derived from a wide<br />
range <strong>of</strong> sources. Consequently, we undertook sensi-<br />
tivity analyses to explore the effect <strong>of</strong> changing key<br />
input parameters associated with the most important<br />
hot spots and report here on the effect <strong>of</strong> changes to two<br />
parameters that directly affect emissions from fuel use.<br />
Not surprisingly, increasing and decreasing average<br />
fuel inputs by one standard deviation directly translated<br />
into larger and smaller emissions across all impact<br />
categories (Fig. 4, error bars). However, the scale <strong>of</strong><br />
these changes in relation to the base case values is<br />
relatively small—typically amounting to under 15%.<br />
Emissions associated with fish caught in the Atlantic<br />
display the largest potential variation reflecting the fact<br />
that average fuel inputs amongst the three Atlanticbased<br />
vessels were most varied—mean 442 l/tonne and<br />
a standard deviation <strong>of</strong> 80 l/tonne. As a result, in five <strong>of</strong><br />
the seven impact categories the range <strong>of</strong> emission values<br />
associated with Indian Ocean-based fishing falls<br />
within the range <strong>of</strong> values associated with Atlanticbased<br />
fishing. In no case, however, did the range <strong>of</strong><br />
values associated with Pacific-based vessels fall within<br />
the range <strong>of</strong> emissions associated with either Atlantic<br />
or Indian Ocean-based vessels (Fig. 4).<br />
Although we used data from a large, detailed study<br />
<strong>of</strong> real-world emissions from ships to characterize the<br />
direct emissions from the fishing operations analyzed<br />
here, uncertainties remain. To explore the effect <strong>of</strong><br />
applying alternative emission factors, we substituted<br />
values derived from two alternative sources, the International<br />
Maritime Organization’s regulations that stipulate<br />
the maximum allowable emission rates from ships<br />
(The MARPOL 73/78 Annex VI) that is set to come<br />
into force on May 2005 (IMO, 2004) and Wärtsilä, one<br />
<strong>of</strong> the leading manufacturers <strong>of</strong> marine diesel engines<br />
(Hellén, 2003) (Table 5). As neither the IMO regulations<br />
nor Wärtsilä data provide as wide a range <strong>of</strong><br />
emissions factors as those used in the base case analysis,<br />
our sensitivity analysis was limited to only those<br />
Table 5<br />
Alternative emission factors used in sensitivity analysis (all values<br />
in grams per kilogram <strong>of</strong> fuel burned)<br />
Data source NOx SOx CO2 CO HC<br />
IMO regulationsa 66.0 33.0 3626 – –<br />
Wartsilab 44.0 11.0 3297 0.5 –<br />
Lloyd’s registerc 57.0 4.0 3170 7.4 2.4<br />
a Source: MARPOL 73/78 Annex VI 1997.<br />
b Source: Wärtsilä Corporation (2003).<br />
c Source: Engineering Services Group (1995).
Fig. 5. Results <strong>of</strong> sensitivity analysis <strong>of</strong> alternative emission factors.<br />
impact categories most directly affected, namely global<br />
warming, acidification and eutrophication potentials.<br />
In all instances save one, the real-world emission data<br />
used in our base case analysis resulted in lower <strong>impacts</strong><br />
(Fig. 5). The one exception being the Wärtsilä emission<br />
factor data resulted in lower acidification potentials.<br />
4. Discussion<br />
4.1. Fuel consumption<br />
In burning just under 440 l <strong>of</strong> fuel per tonne <strong>of</strong><br />
<strong>tuna</strong> landed, <strong>Spanish</strong> purse seiners targeting Skipjack<br />
and Yellowfin <strong>tuna</strong> are relatively energy efficient when<br />
compared with many other <strong>fisheries</strong> for human consumption<br />
(Tyedmers, 2004). While no data are available<br />
from other contemporary <strong>tuna</strong> purse seine fleets,<br />
data from U.S. and Japanese purse seiners operating<br />
in the 1970s and 1980s provide contrast. U.S.based<br />
vessels fishing in the eastern tropical Pacific<br />
in the mid-70s burned about 1700 l/tonne <strong>of</strong> all <strong>tuna</strong>s<br />
landed (Rawitscher and Mayer, 1977) while Japanese<br />
purse seiners fishing in the mid-1980s burned about<br />
1200 l <strong>of</strong> fuel per tonne <strong>of</strong> <strong>tuna</strong> caught (Watanabe and<br />
Okubo, 1989). Although the data may not be directly<br />
comparable, the lower average fuel consumption rates<br />
amongst contemporary <strong>tuna</strong> fishing operations is heartening<br />
if somewhat surprising given the extent to which<br />
global <strong>fisheries</strong> have become dependant on this finite<br />
resource (Pauly et al., 2003; Tyedmers et al., in press)<br />
and the widespread trend to generally poorer energy<br />
performance over time in many <strong>fisheries</strong> (Tyedmers,<br />
2004). While lower average fuel inputs could result<br />
from a general increase in the abundance <strong>of</strong> Yellowfin<br />
A. Hospido, P. Tyedmers / Fisheries Research 76 (2005) 174–186 183<br />
and Skipjack stocks, given the widespread declines in<br />
predatory fish communities that have been described<br />
(Myers and Worm, 2003), this seems unlikely. An alternative<br />
explanation for the apparent reduction in average<br />
fuel inputs associated with <strong>tuna</strong> purse seining is that<br />
it results from a combination <strong>of</strong> technical efficiency<br />
improvements. In addition to the wide array <strong>of</strong> fish<br />
finding technologies currently available, over the last<br />
30 years major improvements have been made in hull<br />
and propeller design and the efficiency <strong>of</strong> marine diesel<br />
engines (Corbett, 2004).<br />
The fact that <strong>tuna</strong> caught in the Pacific entail higher<br />
average fuel inputs and relatively long post-harvest<br />
transport distances, both factors that translate directly<br />
into higher costs <strong>of</strong> production when compared to fish<br />
caught in other oceans, is well known within the industry<br />
(Mr. Antonio Cuevas, Conservas Calvo, June 2004,<br />
pers. commun.). As a result, an increasing fraction <strong>of</strong><br />
Pacific caught <strong>tuna</strong> are being partially processed at<br />
plants in Central-America so that only those portions <strong>of</strong><br />
the fish suitable for canning are transported to Galicia<br />
for final processing. While this variant <strong>of</strong> the harvestprocessing<br />
system has not been modelled, it has the<br />
potential to reduce the overall <strong>environmental</strong> <strong>impacts</strong><br />
associated with Pacific caught fish ceteris paribus.<br />
4.2. Major contributions to <strong>environmental</strong> <strong>impacts</strong><br />
One <strong>of</strong> the most important uses <strong>of</strong> LCA is the identification<br />
<strong>of</strong> <strong>environmental</strong> “hot spots” or activities that<br />
contribute disproportionately to the total <strong>environmental</strong><br />
impact <strong>of</strong> the system under study, so that steps can<br />
be taken to address them either proactively by <strong>environmental</strong>ly<br />
concerned producers or through regulation.<br />
Here, both fishing-related inputs <strong>of</strong> diesel fuel (its production<br />
and its use) and the use <strong>of</strong> anti-fouling paint<br />
emerge as hot spots <strong>of</strong> concern. Our finding that fuel<br />
inputs have a major impact on the overall <strong>environmental</strong><br />
performance <strong>of</strong> <strong>tuna</strong> fishing echoes results <strong>of</strong><br />
earlier work in other <strong>fisheries</strong> (Ziegler et al., 2003).<br />
Reducing the fuel intensity <strong>of</strong> contemporary <strong>Spanish</strong><br />
<strong>tuna</strong> <strong>fisheries</strong> could, in theory, be achieved in a number<br />
<strong>of</strong> ways. Further technological advances, for example<br />
in the areas <strong>of</strong> long-range target identification or<br />
the thermal efficiency <strong>of</strong> engines, are both possible.<br />
Alternatively, increasing the general abundance and<br />
availability <strong>of</strong> the targeted species could also result in<br />
lower fuel inputs as we explored in our Scenario 1.
184 A. Hospido, P. Tyedmers / Fisheries Research 76 (2005) 174–186<br />
Unfor<strong>tuna</strong>tely, many technologically driven pathways<br />
to improved energy performance can work against the<br />
stock rebuilding option, ceteris paribus, as they <strong>of</strong>ten<br />
reduce the economic costs <strong>of</strong> fishing making it possible<br />
to fish longer and harder. Moreover, opportunities<br />
to effect substantial reductions in fuel use, regardless <strong>of</strong><br />
means, may be limited given the already comparatively<br />
low fuel use intensity <strong>of</strong> these <strong>fisheries</strong> when compared<br />
to comparable <strong>tuna</strong> <strong>fisheries</strong> as explored above<br />
and other <strong>fisheries</strong> for high value species (Tyedmers,<br />
2004).<br />
The seeming importance <strong>of</strong> anti-fouling paint has<br />
not previously been described as an important hot spot<br />
in fishing systems and as such deserves wider consideration.<br />
Moreover, losses <strong>of</strong> anti-fouling paint had<br />
the largest apparent impact on marine eco-toxicity, the<br />
most problematic impact category quantified from a<br />
global perspective (Figs. 3 and 4). It should be noted,<br />
however, that the methods used for establishing toxicity<br />
factors for non-ferrous metals are currently being<br />
reviewed and a clear consensus is lacking (Mr. Alain<br />
Dubreuil. Government <strong>of</strong> Canada, December 2004,<br />
pers. commun.). In our analysis, toxicity factors for<br />
both human and marine toxicity potentials were taken<br />
from the list included in the CML methodology as<br />
originally defined by Huijbregts (1999, 2000). And<br />
although this list does not include a toxicity factor<br />
for Cu(I), the species <strong>of</strong> copper that enters the water<br />
when anti-fouling paint breaks down, from discussions<br />
with Mark Huijbregts (September 2004, pers. commun.)<br />
it was assumed to be the same as Cu(II) or the<br />
equivalent <strong>of</strong> 1.5E6 kg 1,4DCB/kg (for MTP). It should<br />
be noted, however, that in an April 2004 meeting <strong>of</strong><br />
LCA and related specialists, it was recommended that<br />
the toxicity characterization factor applied to essential<br />
metals, such as zinc and copper, in marine waters be<br />
set at zero as the oceans are deficient in these metals<br />
and additional inputs will probably not lead to toxic<br />
effects (Aboussouan et al., 2004). Although this perspective<br />
overlooks the fact that most anti-fouling paint<br />
is likely lost in harbours and other high traffic coastal<br />
environments where they are known to cause toxic<br />
effects (Alzieu, 1998; Matthiessen and Law, 2002),<br />
and it remains, for the present, only a recommendation,<br />
if it is widely adopted the modelled marine<br />
eco-toxicity associated with <strong>tuna</strong> fishing, and all other<br />
activities that use anti-fouling paint, would be greatly<br />
reduced.<br />
Interestingly, while not as large a process chain hot<br />
spot as fuel consumption (Fig. 3), the post-harvest<br />
transport <strong>of</strong> carcasses potentially provides greater<br />
scope to effect <strong>environmental</strong> performance improvements<br />
as suggested by the results <strong>of</strong> our two modelled<br />
scenarios. This is because the differences in the minimum<br />
transport distances associated with operations<br />
in the Atlantic, Pacific and Indian Oceans, conservatively<br />
estimated at just over 4500, 9100 and 10,100 km,<br />
respectively, are much larger than the differences in<br />
the corresponding direct fuel inputs to those operations<br />
at 440, 525 and 370 l/tonne. Consequently, any<br />
set <strong>of</strong> circumstances, from stock rebuilding efforts, as<br />
we suggest in our Scenario 2, to changes in international<br />
<strong>fisheries</strong> management arrangements that results<br />
in <strong>Spanish</strong> purse seiners once again operating exclusively<br />
in the Atlantic Ocean would result in the effective<br />
halving <strong>of</strong> the <strong>environmental</strong> <strong>impacts</strong> associated<br />
with post-harvest transport and overall emission reductions<br />
<strong>of</strong> up to 26% (Table 4). To achieve a comparable<br />
scale <strong>of</strong> improvement in at least one impact category<br />
exclusively through reductions in fuel use intensities,<br />
average inputs would have to be reduced to around<br />
250 l/tonne—fully 40% below the current average <strong>of</strong><br />
almost 440 l/tonne.<br />
In contrast to the above noted hot spots, our novel<br />
consideration <strong>of</strong> the <strong>impacts</strong> associated with solid and<br />
liquid wastes generated by crew members indicates that<br />
this aspect <strong>of</strong> the <strong>fisheries</strong> considered does not warrant<br />
immediate attention.<br />
5. Conclusions<br />
We used data from nine large purse seiners that<br />
targeted Skipjack and Yellowfin <strong>tuna</strong>, three in each<br />
<strong>of</strong> the Atlantic, Pacific and Indian Oceans, to evaluate<br />
the <strong>environmental</strong> performance <strong>of</strong> these important<br />
contemporary <strong>Spanish</strong> <strong>tuna</strong> <strong>fisheries</strong>. As purse seining<br />
accounts for roughly 90, 88 and 60% <strong>of</strong> <strong>Spanish</strong>,<br />
European and Global <strong>tuna</strong> landings, respectively,<br />
and the nine vessels inventoried account for approximately<br />
one-quarter <strong>of</strong> Spain’s and over 15% <strong>of</strong> total<br />
European <strong>tuna</strong> landings (308,469 and 507,772 tones<br />
in 2003), our results should be broadly representative<br />
(FAO, 2005). Overall, the provision and direct combustion<br />
<strong>of</strong> fuel along with anti-fouling paint use while<br />
fishing had the biggest <strong>impacts</strong> on all the life <strong>cycle</strong>
emissions modelled. Consequently, efforts to improve<br />
the <strong>environmental</strong> performance <strong>of</strong> <strong>Spanish</strong> <strong>tuna</strong> fishing<br />
operations should focus on these aspects <strong>of</strong> the<br />
fishery first. Comparing the performance <strong>of</strong> <strong>fisheries</strong><br />
based in the three oceans, Pacific-based operations<br />
resulted in the highest emissions across all impact<br />
categories modelled. This was largely the result <strong>of</strong><br />
markedly higher fuel consumption rates together with<br />
relatively long post-harvest transport distances. Efforts<br />
to rebuild stocks, particularly in the Atlantic Ocean<br />
would not only help reverse the decline <strong>of</strong> aquatic<br />
ecosystems but could result in marked improvements<br />
in the <strong>environmental</strong> performance <strong>of</strong> the <strong>Spanish</strong> <strong>tuna</strong><br />
fishery.<br />
Acknowledgements<br />
The authors wish to express their gratitude to<br />
the collaborators at the canning holding companies<br />
for providing information on Galician <strong>tuna</strong> <strong>fisheries</strong><br />
and to two anonymous reviewers for their valuable<br />
input. Almudena Hospido would like to thank the<br />
<strong>Spanish</strong> Ministry <strong>of</strong> Education for the financial support<br />
(AP2001-3410) during her temporary stay at<br />
SRES. This work was supported by the Galician<br />
Autonomous Government, Xunta de Galicia (Project<br />
ref.: PGIDIT04TAL262003PR).<br />
References<br />
Aboussouan, L., van de Meent, D., Schönnenbeck, M., Hauschild,<br />
M., Delbeke, K., Struijs, J., Russell, A., Udo de Haes, H.,<br />
Atherton, J., van Tilborg, W., Karman, C., Korenromp, R.,<br />
Sap, G., Baukloh, A., Dubreuil, A., Adams, W., Heijungs,<br />
R., Jolliet, O., de Koning, A., Chapman, P., Ligthart, T.,<br />
Verdonck, F., van der Loos, R., Eikelboom, R., Kuyper, J.,<br />
2004. Declaration <strong>of</strong> Apeldoorn on LCIA <strong>of</strong> Non-Ferrous Metals.<br />
Available at http://www.uneptie.org/pc/sustain/reports/lcini/<br />
Declaration<strong>of</strong>Apeldoorn final.pdf.<br />
Alverson, D.L., Freeberg, M.H., Murawski, S.A., Pope J.G., 1994. A<br />
global assessment <strong>of</strong> <strong>fisheries</strong> bycatch and discards. FAO FISH.<br />
Technical Paper no. 339. FAO, Rome, Italy.<br />
Alzieu, C., 1998. Tributyltin: case study <strong>of</strong> a chronic contaminant in<br />
the coastal environment. Ocean Coast. Manage. 40 (1), 23–36.<br />
Andersen, O., 2002. Transport <strong>of</strong> fish from Norway: energy analysis<br />
using industrial ecology as the framework. J. Clean. Prod. 10,<br />
581–588.<br />
Andersson, K., Ohlsson, T., 1999. <strong>Life</strong> <strong>cycle</strong> assessment <strong>of</strong> bread<br />
produced on different scales. Int. J. LCA 4 (1), 25–40.<br />
A. Hospido, P. Tyedmers / Fisheries Research 76 (2005) 174–186 185<br />
Andersson, K., Ohlsson, T., Olsson, P., 1998. Screening life <strong>cycle</strong><br />
assessment (LCA) <strong>of</strong> tomato ketchup: a case. J. Clean. Prod. 6,<br />
277–288.<br />
Archer, F., Gerrodette, T., Chivers, S., Jackson, A., 2004. Annual<br />
estimates <strong>of</strong> the unobserved incidental kill <strong>of</strong> pantropical spotted<br />
dolphin (Stenella attenuata attenuata) calves in the <strong>tuna</strong> purseseine<br />
fishery <strong>of</strong> the eastern tropical Pacific. Fish. Bull. 102 (2),<br />
233–244.<br />
Caterpillar, 2004. http://www.cat.com.<br />
Christensen, V., Guenette, S., Heymans, J.J., Walters, C.J., Watson,<br />
R., Zeller, D., Pauly, D., 2003. Hundred-year decline <strong>of</strong> North<br />
Atlantic predatory fishes. Fish Fish. 4 (1), 1–24.<br />
Chuenpagdee, R., Morgan, L.E., Maxwell, S.M., Norse, E.A., Pauly,<br />
D., 2003. Shifting gears: assessing collateral <strong>impacts</strong> <strong>of</strong> fishing<br />
methods in US waters. Front. Ecol. Environ. 1 (10), 517–524.<br />
Consoli, F., 1993. Guidelines for <strong>Life</strong> Cycle Assessment: A Code <strong>of</strong><br />
Practice. SETAC, Sesimbra, Portugal.<br />
Corbett, J.J., 2004. Marine transportation and energy use. In: Cleveland,<br />
C. (Ed.), Encyclopedia <strong>of</strong> Energy, vol. 3. Elsevier, Amsterdam,<br />
pp. 745–758.<br />
Dataloy, 2000. Dataloy Distance Table. http://www.dataloy.com.<br />
Department <strong>of</strong> Maritime Affairs and Fisheries (Autonomous Government),<br />
2001. Available at http//www.xunta.es/conselle/pe/<br />
sector industria.htm (in Galician).<br />
Derraik, J.G.B., 2002. The pollution <strong>of</strong> the marine environment by<br />
plastic debris: a review Mar. Pollut. Bull. 44 (9), 842–852.<br />
Directorate-General for Fisheries <strong>of</strong> the European Commission<br />
(DGF), 2004. Tuna: a global fishing activity. Fishing Europe 23.<br />
Edwardson, W., 1976. The Energy Cost <strong>of</strong> Fishing. Fishing News<br />
Int. 15 (2), 36–39.<br />
Engineering Services Group, 1995. Marine exhaust emissions<br />
research programme. Lloyds Register <strong>of</strong> Shipping, London, UK.<br />
Food and Agriculture Organization <strong>of</strong> the United Nations<br />
(FAO), 2004. Fishery Statistical Databases. Available at<br />
http://www.fao.org/fi/statist/statist.asp.<br />
Food and Agriculture Organization <strong>of</strong> the United Nations<br />
(FAO), 2005. Global Tuna Nominal Catches. Available at<br />
http://www.fao.org/figis/servlet/static?dom=collection&xml=<strong>tuna</strong>nomcatch.xml.<br />
García, R., 2000. Depuración de aguas residuals de bajo costo en<br />
pequños núcleos. In: Cursos de verano. Universidad de Cantabria,<br />
Laredo, Spain (in <strong>Spanish</strong>).<br />
Girard, C., Benhamou, S., Dagorn, L., 2004. FAD: fish aggregating<br />
device or fish attracting device? A new analysis <strong>of</strong> Yellowfin<br />
<strong>tuna</strong> movements around floating objects. Anim. Behav. 67 (2),<br />
319–326.<br />
Glass, C.W., 2000. Conservation <strong>of</strong> fish stocks through bycatch<br />
reduction: a review. Northeast Nat. 7 (4), 395–410.<br />
Goedkoop, M., Oele, M., 2002. SimaPro 5.1—User Manual. PRé<br />
Consultants, Amersfoort, The Netherlands.<br />
Goedkoop, M., Oele, M., 2003a. Database Manual—General Introduction.<br />
PRé Consultants, Amersfoort, The Netherlands.<br />
Goedkoop, M., Oele, M., 2003b. Database Manual—Methods<br />
Library. PRé Consultants, Amersfoort, The Netherlands.<br />
Guinèe, J.B., Gorreé, M., Heijungs, R., Huppes, G., Kleijn, R., de<br />
Koning, A., van Oers, L., Weneger, A., Suh, S., Udo de Haes,<br />
H.A., de Bruijn, H., van Duin, R., Huijbregts, M., 2001. <strong>Life</strong>
186 A. Hospido, P. Tyedmers / Fisheries Research 76 (2005) 174–186<br />
Cycle Assessment: An Operational Guide to the ISO Standards,<br />
Part 2. Ministry <strong>of</strong> Housing, Spatial Planning and Environment,<br />
The Hague, The Netherlands.<br />
Haas, G., Wetterich, F., Köpke, U., 2001. Comparing intensive,<br />
extensified and organic grassland farming in southern Germany<br />
by process life <strong>cycle</strong> assessment. Agric. Ecosyst. Environ. 83,<br />
43–53.<br />
Hayman, B., Dogliani, M., Kvale, I., Fet, A.M., 2000. Technologies<br />
for reduced <strong>environmental</strong> impact from ships—Ship building,<br />
maintenance and dismantling aspects. ENSUS-2000, Newcastle<br />
upon Tyne, UK.<br />
Hellén, G., 2003. Guide to diesel exhaust emissions control. Available<br />
at http://www.wartsila.com.<br />
Hempel, 2004. Annual Report 2003. Hempel A/S Communications<br />
Department. Available at http://www.hempel.com.<br />
Hospido, A., Moreira, M.T., Feijoo, G., 2003. Simplified life<br />
<strong>cycle</strong> assessment <strong>of</strong> Galician milk production. Int. Dairy J. 13,<br />
783–796.<br />
Huijbregts, M.A.J., 1999. Priority assessment <strong>of</strong> toxic substances in<br />
LCA. In: Development and Application <strong>of</strong> the Multi-media Fate,<br />
Exposure and Effect Model USES-LCA. IVAM Environmental<br />
Research, University <strong>of</strong> Amsterdam, Amsterdam, The Netherlands.<br />
Huijbregts, M.A.J., 2000. Priority assessment <strong>of</strong> toxic substances<br />
in the frame <strong>of</strong> LCA. In: Time Horizon Dependency <strong>of</strong> Toxicity<br />
Potentials Calculated with the Multi-media Fate, Exposure<br />
and Effects Model USES-LCA. Institute for Biodiversity and<br />
Ecosystem Dynamics, University <strong>of</strong> Amsterdam, Amsterdam,<br />
The Netherlands, http://www.leidenuniv.nl/interfac/cml/lca2/.<br />
Huijbregts, M.A.J., Breedveld, L., Huppes, G., de Koning, A., van<br />
Oers, L., Suh, S., 1995. Normalisation figures for <strong>environmental</strong><br />
life-<strong>cycle</strong> assessment: The Netherlands (1997/1998), Western<br />
Europe (1995) and the world (1990 and 1995). J. Clean. Prod.<br />
11, 737–748.<br />
Huse, I., Aanondsen, S., Ellingsen, H., Eng˚as, A., Furevik, D., Graham,<br />
N., Isaksen, B., Jørgensen, T., Løkkeborg, S., Nøttestad, L.,<br />
Soldal, A.V., 2002. A Desk-study <strong>of</strong> Diverse Methods <strong>of</strong> Fishing<br />
when Considered in Perspective <strong>of</strong> Responsible Fishing, and the<br />
Effect on the Ecosystem Caused by Fishing Activity. Institute <strong>of</strong><br />
Marine Research and SINTEF, Bergen, Norway.<br />
International Maritime Organization (IMO), 2004. http://www.imo.<br />
org.<br />
International Organization for Standardization (ISO), 2000. ISO<br />
14000—Environmental Management, ISO Standards Collection<br />
on CD-ROM, Geneva, Switzerland.<br />
Jackson, J.B.C., Kirby, M.X., Berger, W.H., Bjorndal, K.A., Botsford,<br />
L.W., Bourque, B.J., Bradbury, R.H., Cooke, R., Erlandson,<br />
J., Estes, J.A., Hughes, T.P., Kidwell, S., Lange, C.B., Warner,<br />
R.R., 2001. Historical overfishing and the recent collapse <strong>of</strong><br />
coastal ecosystems. Science 293, 629–638.<br />
Johnson, K.A., 2002. Review <strong>of</strong> National and International Literature<br />
on the Effects <strong>of</strong> Fishing on Benthic Habitats. NOAA Technical<br />
Memorandum NMFS F/SPO no. 57, Maryland, USA.<br />
Karlsen, H., Angelfoos, A., 2000. Transport <strong>of</strong> frozen fish<br />
between ˚Alensund and Paris—a case study. ˚Alensund College,<br />
˚Alensund, Norway. Available at http://research.dnv.com/marmil/<br />
life<strong>cycle</strong>/results phase 2.htm.<br />
Lo, N.C.H., Smith, T.D., 1986. Incidental mortality <strong>of</strong> dolphins in<br />
the eastern tropic pacific 1959–1972. Fish. Bull. 84 (1), 27–<br />
34.<br />
Matthiessen, P., Law, R.J., 2002. Contaminants and their effects on<br />
estuarine and coastal organism in the UK in the late twentieth<br />
century. Environ. Pollut. 120 (3), 739–757.<br />
Mattsson, B., Sonesson, U., 2003. Environmentally-friendly<br />
Food Processing. Woodhead Publishing Limited, Cambridge,<br />
UK.<br />
Myers, R.A., Worm, B., 2003. Rapid worldwide depletion <strong>of</strong> predatory<br />
fish communities. Nature 423, 280–283.<br />
Pauly, D., Christensen, V., Guénette, S., Pitcher, T.J., Sumaila, R.U.,<br />
Walters, C.J., Watson, R., Zeller, D., 2002. Towards sustainability<br />
in world <strong>fisheries</strong>. Nature 418, 689–695.<br />
Pauly, D., Alder, J., Bennett, E., Christensen, V., Tyedmers, P.,<br />
Watson, R., 2003. The future for <strong>fisheries</strong>. Science 302, 1359–<br />
1361.<br />
Rawitscher, M.A., Mayer, J., 1977. Nutritional outputs and energy<br />
inputs in seafoods. Science 198, 261–264.<br />
Ronzano, E., Dapena, J.L., 2002. Tratamiento biológico de aguas<br />
residuales. Diáz de Santos, Madrid, Spain (in <strong>Spanish</strong>).<br />
Scott, M.D., Bayliff, W.H., Lennert-Cody, C.E., Schaefer, K.M.,<br />
1999. Proceedings <strong>of</strong> the International Workshop on the Ecology<br />
and Fisheries for Tunas Associated with Floating Objects.<br />
Inter-American Tropical Tuna Commission Special Report 11.<br />
IATTC, La Jolla, CA, USA.<br />
Thrane, M., 2004a. Energy consumption in the Danish fishery. J. Ind.<br />
Ecol. 8, 223–239.<br />
Thrane, M., 2004b. Environmental <strong>impacts</strong> from danish fish<br />
product—hot spots and <strong>environmental</strong> policies. PhD Thesis.<br />
˚Alborg University, ˚Alborg, Denmark.<br />
Tyedmers, P., 2000. Salmon and sustainability: the biophysical cost<br />
<strong>of</strong> producing salmon through the commercial salmon fishery and<br />
the intensive salmon culture industry. PhD Thesis. University <strong>of</strong><br />
British Columbia, Vancouver, BC, Canada.<br />
Tyedmers, P., 2004. Fisheries and Energy Use. In: Cleveland, C.<br />
(Ed.), Encyclopedia <strong>of</strong> Energy, vol. 2. Elsevier, Amsterdam, pp.<br />
683–693.<br />
Tyedmers, P., Watson, R., Pauly, D., in press. Fuelling global fishing<br />
fleets. Ambio.<br />
Watanabe, H., Okubo, M., 1989. Energy input in marine <strong>fisheries</strong> in<br />
Japan. Jpn. Soc. Sci. Fish. B 53, 1525–1531.<br />
Wärtsilä, 2003. http://www.wartsila.com.<br />
Ziegler, F., Hansson, P.A., 2003. Emissions from fuel combustion in<br />
Swedish cod fishery. J. Clean. Prod. 11, 303–314.<br />
Ziegler, F., Nilsson, P., Mattsson, B., Walther, Y., 2003. <strong>Life</strong> <strong>cycle</strong><br />
assessment <strong>of</strong> frozen cod fillets including fishery-specific <strong>environmental</strong><br />
<strong>impacts</strong>. Int. J. LCA 8 (1), 39–47.