Mgambo Forest Reserve: A biodiversity survey. - Eastern Arc ...
Mgambo Forest Reserve: A biodiversity survey. - Eastern Arc ...
Mgambo Forest Reserve: A biodiversity survey. - Eastern Arc ...

You also want an ePaper? Increase the reach of your titles
YUMPU automatically turns print PDFs into web optimized ePapers that Google loves.
<strong>Mgambo</strong> <strong>Forest</strong> <strong>Reserve</strong><br />
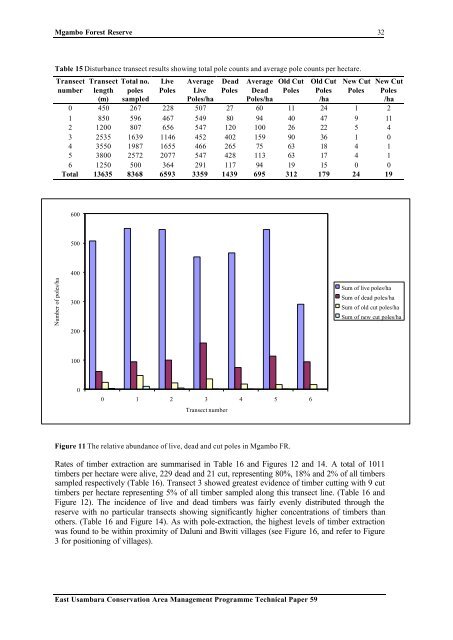
Table 15 Disturbance transect results showing total pole counts and average pole counts per hectare.<br />
Number of poles/ha<br />
Transect<br />
number<br />
Transect<br />
length<br />
(m)<br />
Total no.<br />
poles<br />
sampled<br />
Live<br />
Poles<br />
Average<br />
Live<br />
Poles/ha<br />
Dead<br />
Poles<br />
Average<br />
Dead<br />
Poles/ha<br />
Old Cut<br />
Poles<br />
East Usambara Conservation Area Management Programme Technical Paper 59<br />
Old Cut<br />
Poles<br />
/ha<br />
New Cut<br />
Poles<br />
32<br />
New Cut<br />
Poles<br />
/ha<br />
0 450 267 228 507 27 60 11 24 1 2<br />
1 850 596 467 549 80 94 40 47 9 11<br />
2 1200 807 656 547 120 100 26 22 5 4<br />
3 2535 1639 1146 452 402 159 90 36 1 0<br />
4 3550 1987 1655 466 265 75 63 18 4 1<br />
5 3800 2572 2077 547 428 113 63 17 4 1<br />
6 1250 500 364 291 117 94 19 15 0 0<br />
Total 13635 8368 6593 3359 1439 695 312 179 24 19<br />
600<br />
500<br />
400<br />
300<br />
200<br />
100<br />
0<br />
0 1 2 3 4 5 6<br />
Transect number<br />
Figure 11 The relative abundance of live, dead and cut poles in <strong>Mgambo</strong> FR.<br />
Sum of live poles/ha<br />
Sum of dead poles/ha<br />
Sum of old cut poles/ha<br />
Sum of new cut poles/ha<br />
Rates of timber extraction are summarised in Table 16 and Figures 12 and 14. A total of 1011<br />
timbers per hectare were alive, 229 dead and 21 cut, representing 80%, 18% and 2% of all timbers<br />
sampled respectively (Table 16). Transect 3 showed greatest evidence of timber cutting with 9 cut<br />
timbers per hectare representing 5% of all timber sampled along this transect line. (Table 16 and<br />
Figure 12). The incidence of live and dead timbers was fairly evenly distributed through the<br />
reserve with no particular transects showing significantly higher concentrations of timbers than<br />
others. (Table 16 and Figure 14). As with pole-extraction, the highest levels of timber extraction<br />
was found to be within proximity of Daluni and Bwiti villages (see Figure 16, and refer to Figure<br />
3 for positioning of villages).