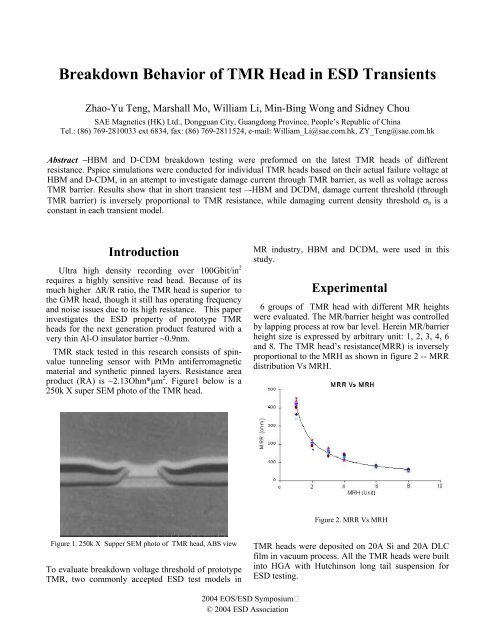
Breakdown Behavior of TMR Head in ESD Transients - Lirmm
Breakdown Behavior of TMR Head in ESD Transients - Lirmm
Breakdown Behavior of TMR Head in ESD Transients - Lirmm

Create successful ePaper yourself
Turn your PDF publications into a flip-book with our unique Google optimized e-Paper software.
<strong>Breakdown</strong> <strong>Behavior</strong> <strong>of</strong> <strong>TMR</strong> <strong>Head</strong> <strong>in</strong> <strong>ESD</strong> <strong>Transients</strong><br />
Zhao-Yu Teng, Marshall Mo, William Li, M<strong>in</strong>-B<strong>in</strong>g Wong and Sidney Chou<br />
SAE Magnetics (HK) Ltd., Dongguan City, Guangdong Prov<strong>in</strong>ce, People’s Republic <strong>of</strong> Ch<strong>in</strong>a<br />
Tel.: (86) 769-2810033 ext 6834, fax: (86) 769-2811524, e-mail: William_Li@sae.com.hk, ZY_Teng@sae.com.hk<br />
Abstract –HBM and D-CDM breakdown test<strong>in</strong>g were preformed on the latest <strong>TMR</strong> heads <strong>of</strong> different<br />
resistance. Pspice simulations were conducted for <strong>in</strong>dividual <strong>TMR</strong> heads based on their actual failure voltage at<br />
HBM and D-CDM, <strong>in</strong> an attempt to <strong>in</strong>vestigate damage current through <strong>TMR</strong> barrier, as well as voltage across<br />
<strong>TMR</strong> barrier. Results show that <strong>in</strong> short transient test –-HBM and DCDM, damage current threshold (through<br />
<strong>TMR</strong> barrier) is <strong>in</strong>versely proportional to <strong>TMR</strong> resistance, while damag<strong>in</strong>g current density threshold σh is a<br />
constant <strong>in</strong> each transient model.<br />
Introduction<br />
Ultra high density record<strong>in</strong>g over 100Gbit/<strong>in</strong> 2<br />
requires a highly sensitive read head. Because <strong>of</strong> its<br />
much higher ∆R/R ratio, the <strong>TMR</strong> head is superior to<br />
the GMR head, though it still has operat<strong>in</strong>g frequency<br />
and noise issues due to its high resistance. This paper<br />
<strong>in</strong>vestigates the <strong>ESD</strong> property <strong>of</strong> prototype <strong>TMR</strong><br />
heads for the next generation product featured with a<br />
very th<strong>in</strong> Al-O <strong>in</strong>sulator barrier ~0.9nm.<br />
<strong>TMR</strong> stack tested <strong>in</strong> this research consists <strong>of</strong> sp<strong>in</strong>value<br />
tunnel<strong>in</strong>g sensor with PtMn antiferromagnetic<br />
material and synthetic p<strong>in</strong>ned layers. Resistance area<br />
product (RA) is ~2.13Ohm*µm 2 . Figure1 below is a<br />
250k X super SEM photo <strong>of</strong> the <strong>TMR</strong> head.<br />
Figure 1. 250k X Supper SEM photo <strong>of</strong> <strong>TMR</strong> head, ABS view<br />
To evaluate breakdown voltage threshold <strong>of</strong> prototype<br />
<strong>TMR</strong>, two commonly accepted <strong>ESD</strong> test models <strong>in</strong><br />
MR <strong>in</strong>dustry, HBM and DCDM, were used <strong>in</strong> this<br />
study.<br />
Experimental<br />
6 groups <strong>of</strong> <strong>TMR</strong> head with different MR heights<br />
were evaluated. The MR/barrier height was controlled<br />
by lapp<strong>in</strong>g process at row bar level. Here<strong>in</strong> MR/barrier<br />
height size is expressed by arbitrary unit: 1, 2, 3, 4, 6<br />
and 8. The <strong>TMR</strong> head’s resistance(MRR) is <strong>in</strong>versely<br />
proportional to the MRH as shown <strong>in</strong> figure 2 -- MRR<br />
distribution Vs MRH.<br />
Figure 2. MRR Vs MRH<br />
<strong>TMR</strong> heads were deposited on 20A Si and 20A DLC<br />
film <strong>in</strong> vacuum process. All the <strong>TMR</strong> heads were built<br />
<strong>in</strong>to HGA with Hutch<strong>in</strong>son long tail suspension for<br />
<strong>ESD</strong> test<strong>in</strong>g.
HBM test was performed on Orxy700H tester where<br />
QST parameters were recorded automatically after<br />
each discharge. Bias current <strong>of</strong> QST test<strong>in</strong>g was<br />
0.4mA, with +/-150Oe magnetic field sweep. Start<strong>in</strong>g<br />
from 2.0V, the votage applied to the head was raised<br />
every 0.5V, untill the head broke down. The HBM<br />
<strong>ESD</strong> test circuit consists <strong>of</strong> a 100pF capacitor and a<br />
1.5kOhm resistor. HBM transient current has a ris<strong>in</strong>g<br />
time (10% Imax to 90% Imax) <strong>of</strong> 2nS~20nS (affected<br />
by the parasitic test board capacitance), and decays<br />
with a time constant RC <strong>of</strong> ~150ns;<br />
DCDM <strong>ESD</strong> test was performed on ISI2002 tester,<br />
QST parameters were recorded automatically after<br />
each discharge. Bias current <strong>of</strong> QST test was 0.4mA,<br />
with +/-150Oe magnetic field sweep. The voltage<br />
applied to the head was raised from 0.2V, with a<br />
coarse step <strong>of</strong> 0.2V and a f<strong>in</strong>e step <strong>of</strong> 0.1V when it<br />
reached 0.8V, untill the head broke dowm. Contrary<br />
to HBM, DCDM transient has a very short duration to<br />
simulate “metal to metal” contact discharge, and<br />
actual current through MR sensor is much less than<br />
the total discharge current <strong>in</strong> DCDM module. Its<br />
waveform is related to trace design <strong>of</strong> HGA<br />
suspension. More specifically <strong>in</strong> this evaluation,<br />
DCDM has a ris<strong>in</strong>g time (10% Imax to 90% Imax) <strong>of</strong><br />
~370ps and PW50 ~2.5ns.<br />
A Tektronix CT-6 current transformer and a 2GHz<br />
LeCory 960M digital oscilloscope were used to<br />
measure the discharge currents <strong>in</strong> HBM and DCDM<br />
<strong>ESD</strong> tests.<br />
Results & Discussion<br />
The tests prove that most <strong>of</strong> <strong>TMR</strong>’s QST amplitude<br />
showed the same decl<strong>in</strong>e trend with resistance after<br />
<strong>ESD</strong> discharge. Dr. Wallash and Baril have arrived at<br />
similar conclusions <strong>in</strong> their researches [1] and [2].<br />
This paper focuses on the study <strong>of</strong> resistance<br />
degradation caused by <strong>ESD</strong> discharge. Often, there is<br />
a knee area (<strong>in</strong>dicated with arrow) before breakdown<br />
<strong>in</strong> the diagram <strong>of</strong> MRR vs <strong>ESD</strong> charge voltage, as<br />
shown <strong>in</strong> figure 3.<br />
Figure 3. <strong>TMR</strong> head breakdown <strong>in</strong> HBM and DCDM <strong>ESD</strong> test<br />
When R(Resistence) drops more than 3% <strong>of</strong> it <strong>in</strong>itial<br />
value, the degradation trend <strong>of</strong> R becomes<br />
irreversible. The lagg<strong>in</strong>g R drop <strong>in</strong> the “knee area” is<br />
considered as “p<strong>in</strong> hole enlargment” after <strong>ESD</strong><br />
discharg<strong>in</strong>g. Once R drop reaches 10% after <strong>ESD</strong><br />
discharge, <strong>TMR</strong> head’s QST amplitude will drop more<br />
than 20% dramatically.<br />
The MRR drop dur<strong>in</strong>g <strong>ESD</strong> charge is considered as<br />
short path/ p<strong>in</strong> hole formation <strong>in</strong>side barrier, so MRR<br />
is the total resistance <strong>of</strong> R<strong>TMR</strong> paralell-connected with<br />
RShort which is caused by p<strong>in</strong>hole. R=<br />
(RShort*R<strong>TMR</strong>)/(RShort+R<strong>TMR</strong>). In theory, if we normalize<br />
resistance <strong>of</strong> <strong>TMR</strong> head without p<strong>in</strong>hole R=R<strong>TMR</strong>=1,<br />
then MR ratio is expressed as ∆R/R=∆R<strong>TMR</strong>. After<br />
<strong>ESD</strong> charge, R=RShort/(RShort+1), the MR ratio is<br />
expressed as ∆R/R=R*∆R<strong>TMR</strong>/[1+∆R<strong>TMR</strong>*(1-R)].<br />
Therefor <strong>TMR</strong> resistance(MRR) should be roughly<br />
proportional to MR ratio(∆R/R) when MR ratio is<br />
only several percent <strong>in</strong> the 0.4mA and 150Oe QST<br />
test<strong>in</strong>g. The <strong>ESD</strong> transient test<strong>in</strong>g also proved this<br />
po<strong>in</strong>t, two typical curves are shown <strong>in</strong> figure 4.
Figure4. <strong>TMR</strong> MRR Vs MR ratio—∆R/R (normalized) <strong>in</strong> HBM<br />
and DCDM <strong>ESD</strong> test<br />
Therefore, two criteria were adopted for <strong>TMR</strong><br />
breakdown: 3% R drop and 10% R drop, which<br />
correponds to 6% amplitude drop and 20% amplitude<br />
drop respectively accord<strong>in</strong>g to the l<strong>in</strong>ear relationship<br />
between MRR and MR ratio.<br />
S<strong>in</strong>ce barrier thickness was only close to 0.9nm, and<br />
the breakdown position after <strong>ESD</strong> discharge was<br />
uncerta<strong>in</strong> <strong>in</strong>side the <strong>TMR</strong> barrier, supper SEM failed<br />
to give any clear evidence <strong>of</strong> 10% R drop sample after<br />
<strong>ESD</strong> short transient charge.<br />
Below are the results <strong>of</strong> two <strong>ESD</strong> test models —HBM<br />
and DCDM.<br />
A) HBM test<strong>in</strong>g<br />
Experimental HBM test result <strong>in</strong>dicates that HBM<br />
threshold voltage is <strong>in</strong>versely proportional to the MRR<br />
<strong>of</strong> <strong>TMR</strong>, as shown <strong>in</strong> figure 5 for 3% R drop criterion<br />
and for 10% R drop criterion.<br />
Figure 5. HBM failure threshold Vs MRR --R 3% drop and R<br />
10% drop criteria<br />
Circuit simulation proposed by Van Roozendaal [3]<br />
and Verhaege [4], as shown <strong>in</strong> figure 6, was used to<br />
analyze the damag<strong>in</strong>g current through the <strong>TMR</strong><br />
barrier dur<strong>in</strong>g HBM discharge. The simulation results<br />
show a good agreement with experimental results<br />
measured with a CT-6 and an oscilloscope LeCroy<br />
960M, as illustrated <strong>in</strong> figure 7.<br />
The test result also <strong>in</strong>dicates that, for the parasitic test<br />
board capacitance <strong>in</strong> HBM test circuit and high<br />
resistance <strong>of</strong> <strong>TMR</strong> head, ris<strong>in</strong>g time <strong>of</strong> HBM transient<br />
becomes longer, which agrees with Van Roozendaal<br />
[3] and Verhaege [4]’s f<strong>in</strong>d<strong>in</strong>gs.<br />
Figure 6. HBM simulation circuit, conta<strong>in</strong><strong>in</strong>g the HBM capacitor<br />
C1, the HBM resistor R3, a shunt capacitance C4 across R3, the<br />
series <strong>in</strong>ductance L1 <strong>of</strong> the discharge path, the test board<br />
capacitance C2 and the resistive load R1 --MRR.<br />
Figure 7. Waveform tested and simulated for 10V HBM, HGA<br />
MRR=294.7ohm, MRR=50.9ohm.<br />
Circuit simulation for breakdown current (Ih) through<br />
<strong>TMR</strong> barrier shows that breakdown current Ih (3% R<br />
drop) <strong>of</strong> <strong>TMR</strong> is <strong>in</strong>versely proportional to MRR<br />
(figure 8). The trend is very clear—a power function<br />
Ih= 677.36*R -1 , However, the breakdown voltage Vh<br />
across the barrier has no clear correlation with MRR.<br />
Some high MRR heads showed higher breakdown<br />
voltage threshold Vh than low MRR ones.
Both breakdown current Ih (mA) and breakdown<br />
voltage Vh (Vh=Ih*R) are ploted <strong>in</strong> figure 8. For<br />
300Ohm MRR target, breakdown current is ~2.26mA,<br />
voltage threshold Vh is ~0.68V <strong>in</strong> HBM test<strong>in</strong>g.<br />
Figure 8. Current threshold It and voltage threshold Vt <strong>of</strong> HBM<br />
B). DCDM test<strong>in</strong>g<br />
The DCDM test<strong>in</strong>g <strong>of</strong> MR head has been well<br />
discussed <strong>in</strong> Baril and Cheung’s papers [5]. It is<br />
believed that the current through <strong>TMR</strong> barrier is only<br />
a part <strong>of</strong> the current measured us<strong>in</strong>g a CT-6 <strong>in</strong> ISI<br />
DCDM tool. Pspice simulation is needed to obta<strong>in</strong> the<br />
current through <strong>TMR</strong> barrier.<br />
As shown <strong>in</strong> figure 9, a detailed model for an HGA<br />
used <strong>in</strong> this test<strong>in</strong>g is given. The discharge current <strong>in</strong><br />
DCDM is determ<strong>in</strong>ed by transmission l<strong>in</strong>e model <strong>of</strong><br />
HGA suspension circuit.<br />
Figure 9. Simulation circuit for HGA DCDM test<strong>in</strong>g. The HGA<br />
circuit part conat<strong>in</strong>s the transmission l<strong>in</strong>e elements: Llx, Clx, Rlx<br />
(left trace), Lrx, Crx, Rrx (right trace) and <strong>TMR</strong> resistance Rmr;<br />
the discharge circuit part conta<strong>in</strong>s the resistive load Rd, the<br />
parasitic elements: Cd (effective shunt capacitance), Ld1 and Ld2<br />
(effective series <strong>in</strong>ductances).<br />
Experimental DCDM test result also <strong>in</strong>dicates that<br />
DCDM threshold is <strong>in</strong>versely proportional to the MRR<br />
<strong>of</strong> <strong>TMR</strong>. Figure 10 illustrates this relationship.<br />
Figure 10. DCDM failure threshold Vs MRR--R 3% drop and R<br />
10% drop criteria<br />
The DCDM circuit as mentioned above (figure 9) was<br />
also used to analyze the current through <strong>TMR</strong> barrier<br />
dur<strong>in</strong>g DCDM charge. The simulation results <strong>in</strong>dicate<br />
a good agreement with the test results measured with a<br />
CT-6 and an oscilloscope LeCroy 960M, as shown<br />
figure11.<br />
Figure11. DCDM waveform tested and simulated @1V DCDM,<br />
HGA MRR=320ohm and short --MRR=3.8 ohm<br />
The total DCDM current and current through MR <strong>of</strong> a<br />
320 ohm HGA are illustrated <strong>in</strong> figure 12. The current<br />
through <strong>TMR</strong> barrier is only about one third <strong>of</strong> the<br />
total current measured us<strong>in</strong>g a CT-6 <strong>in</strong> DCDM tool.
Figure 12. DCDM current comparison-- total and through MR ,<br />
320Ohm HGA @1V DCDM<br />
Circuit simulation for the current through <strong>TMR</strong><br />
barrier shows that breakdown current Ih (3% R drop)<br />
<strong>of</strong> <strong>TMR</strong> is <strong>in</strong>versely proportional to MRR. The trend<br />
is very clear—a power function Ih=755.21*R -1 , and<br />
aga<strong>in</strong>, there is no clear correlation between breakdown<br />
voltage Vh across barrier and MRR. Some high MRR<br />
heads also showed higher breakdown threshold Vh.<br />
Both breakdown current Ih (mA) and breakdown<br />
voltage Vh (Vh=Ih*MRR) are ploted <strong>in</strong> figure13. For<br />
300ohm MRR target, the breakdown current is<br />
~2.52mA, breakdown voltage Vh is ~0.76V <strong>in</strong><br />
DCDM.<br />
Figure13 Current threshold It and voltage threshold Vt <strong>of</strong> DCDM-<br />
-R 3% drop criteria<br />
Figure 14 shows breakdown current Ih (mA) <strong>of</strong> both<br />
HBM and DCDM. The breakdown current Ih <strong>of</strong><br />
DCDM is slightly higher than that <strong>of</strong> HBM.<br />
Figure14. Current threshold Ih Vs MRR---- HBM and DCDM<br />
Summary and Conclusions<br />
Circuit simulation proves that, for both HBM and<br />
DCDM, breakdown current Ih through barrier is<br />
roughly <strong>in</strong>versely proportional to MRR, while<br />
breakdown voltage Vh across barrier has no clear<br />
dependence on MRR (MRH), the value <strong>of</strong> most heads<br />
ranges from 0.6V to 1.0V. Consider<strong>in</strong>g the Al-O<br />
barrier’s thickness is close to 0.9nm, the breakdown E<br />
field is 6.7E8V/m--1.1E9V/m.<br />
The scatter<strong>in</strong>g <strong>of</strong> breakdown threshold Vh is affected<br />
by the quality <strong>of</strong> <strong>TMR</strong> barrier—p<strong>in</strong>hole distribution<br />
and surface condition <strong>of</strong> pole area after slider<br />
processes. Vh (Vh=Ih*MRR) <strong>of</strong> some high MRR<br />
heads is higher than normal value, it may result from<br />
the p<strong>in</strong>hole distribution <strong>in</strong> <strong>TMR</strong> barrier, high MRR<br />
heads have a much smaller barrier area which should<br />
have less p<strong>in</strong>hole probability <strong>in</strong> wafer process.<br />
Based on the test results, it is concluded that the<br />
equation <strong>of</strong> the damag<strong>in</strong>g current threshold Ih can be<br />
expressed <strong>in</strong> the form:<br />
K K * MRW * MRH<br />
Ih ≈ =<br />
(mA)<br />
MRR RA<br />
K---Constant related with <strong>ESD</strong> transient pulse width<br />
(Ohm*mA).<br />
MRW ---MR sensor/barrier width (µm).<br />
MRH---MR sensor/barrier height (µm).<br />
RA---Resistance (barrier) area product (Ohm*µm 2 ).<br />
The damag<strong>in</strong>g current density threshold σh can be<br />
expressed <strong>in</strong> the form:
Ih Ih K<br />
σ h = =<br />
≈ (mA/µm<br />
S MRW * MRH RA<br />
2 )<br />
In the two <strong>ESD</strong> short transient tests--- HBM and<br />
DCDM, the K is 677.36mA*µm 2 and 755.21mA*µm 2<br />
respectively, RA is 2.13Ohm*µm 2 , therefore the<br />
current density threshold σh is 318.0mA/µm 2 and<br />
354.6mA/µm 2 . Once the damag<strong>in</strong>g current density σ<br />
reaches the threshold σh, <strong>TMR</strong> head will break down<br />
with MRR drop. The slight threshold difference<br />
between HBM and DCDM is considered related with<br />
the duration <strong>of</strong> <strong>ESD</strong> transient, it needs further studies.<br />
Acknowledgement<br />
The authors would extend s<strong>in</strong>cere thanks to Mr. Quick<br />
Qi, Mr. Kunihiro Ueda, Mr. Nozomu Hachisuka<br />
(TDK), Mr. Kazuhiro Barada (TDK), Mr. Takeo<br />
Kagami (TDK), Mr. YouGui Wang, Ms. YuP<strong>in</strong> Qiu,<br />
Mr. XueB<strong>in</strong> Shu, Mr. KePeng Sun, Mr. ZhongHua<br />
Yang, Dr. Ge Yan, Dr. Lydia Baril (Maxtor) and Mr.<br />
Tai Ch<strong>in</strong>g Lee for their k<strong>in</strong>d support and helpful<br />
discussions. Also a “thank you” to Mr. JianFeng<br />
Zheng for his supper SEM photos.<br />
Reference<br />
[1]. A. Wallash, J. Hillman, and D. Wang, “<strong>ESD</strong><br />
Evaluation <strong>of</strong> Tunnel<strong>in</strong>g Magnetoresistive (<strong>TMR</strong>)<br />
Devices”, EOS/<strong>ESD</strong> Symposium Proceed<strong>in</strong>gs, pp.<br />
470-474, 2000.<br />
[2]. L. Baril, M. Nichols, and A. Wallash<br />
“Degradation <strong>of</strong> GMR and <strong>TMR</strong> Record<strong>in</strong>g <strong>Head</strong>s<br />
Us<strong>in</strong>g very short Duration <strong>ESD</strong> <strong>Transients</strong>”, IEEE<br />
Trans. Magn., Vol. 38, No.5, pp. 2283-2286,<br />
2002.<br />
[3]. L. van Roozendaal, A. Amerasekera, P. Bos, W.<br />
Baelde, F. Bontekoe, P. Kersten, E. Korma, P.<br />
Rommers, P. Krys, U. Weber and P. Ashby,<br />
“Standard <strong>ESD</strong> Test<strong>in</strong>g <strong>of</strong> Integrated Circuits”<br />
EOS/<strong>ESD</strong> Symposium Proceed<strong>in</strong>gs, pp. 119-130,<br />
1990<br />
[4]. K. Verhaege, P.J. Roussel, G. Groeseneken, H.E.<br />
Maes, H. Gieser, C. Russ, P. Egger, X.<br />
Guggenmos, and F. Kuper, “Analysis <strong>of</strong> HBM<br />
<strong>ESD</strong> Testers and Specifications us<strong>in</strong>g a 4th Order<br />
Lumped Element Model”, EOS/<strong>ESD</strong> Symposium<br />
Proceed<strong>in</strong>gs, pp. 129-137, 1993.<br />
[5]. L. Baril, T. Cheung, and A. Wallash. “Direct<br />
Charge Device <strong>ESD</strong> Test for Magnetoresistive<br />
Record<strong>in</strong>g <strong>Head</strong>s: Study and Standards” Journal<br />
<strong>of</strong> Electrostatics 59, pp. 301-316, 2003