Evaluating particle size of forages and TMRs using the New Penn ...
Evaluating particle size of forages and TMRs using the New Penn ...
Evaluating particle size of forages and TMRs using the New Penn ...

Create successful ePaper yourself
Turn your PDF publications into a flip-book with our unique Google optimized e-Paper software.
College <strong>of</strong> Agricultural Sciences • Cooperative Extension<br />
<strong>Evaluating</strong> <strong>particle</strong> <strong>size</strong> <strong>of</strong><br />
<strong>forages</strong> <strong>and</strong> <strong>TMRs</strong> <strong>using</strong><br />
<strong>the</strong> <strong>New</strong> <strong>Penn</strong> State Forage<br />
Particle Separator<br />
Jud Heinrichs <strong>and</strong> Paul Konon<strong>of</strong>f<br />
Department <strong>of</strong> Dairy <strong>and</strong> Animal Science<br />
The <strong>Penn</strong>sylvania State University<br />
324 Henning Building<br />
University Park, PA 16802<br />
(814) 865-5491 • FAX (814) 865-7442<br />
www.das.psu.edu/teamdairy/<br />
––––––––––––––––––––––––––––––––––––––––––––––––––––––––––––––––––––––––––––––––––––––––––––––––––––<br />
Topics Include:<br />
Introduction<br />
Guidelines for <strong>particle</strong> <strong>size</strong><br />
Particle separator instructions<br />
Particle <strong>size</strong> effects on <strong>the</strong> dairy cow<br />
Recommended fiber intakes<br />
Blank data sheet <strong>and</strong> graphs<br />
Sample input <strong>and</strong> output from spreadsheet<br />
DAS 02-42 IVEI
INTRODUCTION<br />
Having <strong>the</strong> proper <strong>particle</strong> <strong>size</strong><br />
distribution <strong>of</strong> feeds is an important part <strong>of</strong><br />
ration formulation. However, until recently,<br />
<strong>particle</strong> <strong>size</strong> has been difficult to measure on<br />
farms. Many dairy nutritionists have<br />
developed subjective measures <strong>of</strong> this aspect<br />
<strong>of</strong> <strong>the</strong> diet, <strong>and</strong> most have been quite<br />
effective making ration changes with respect<br />
to <strong>particle</strong> <strong>size</strong> measurements.<br />
The new <strong>Penn</strong> State Forage Particle<br />
Separator provides a tool to quantitatively<br />
determine <strong>the</strong> <strong>particle</strong> <strong>size</strong> <strong>of</strong> <strong>forages</strong> <strong>and</strong><br />
total mixed rations (<strong>TMRs</strong>). The concept <strong>of</strong><br />
measuring feed <strong>particle</strong> <strong>size</strong> <strong>using</strong> a st<strong>and</strong>ard<br />
method is not new. The American Society <strong>of</strong><br />
Agricultural Engineers’ (ASAE) st<strong>and</strong>ard<br />
for <strong>particle</strong> <strong>size</strong> analysis <strong>and</strong> distribution has<br />
been available for many years.<br />
Unfortunately, <strong>the</strong> ASAE method is a<br />
cumbersome laboratory procedure that is<br />
impractical for farm use. The objective <strong>of</strong><br />
developing <strong>the</strong> <strong>Penn</strong> State Forage Particle<br />
Separator was to mimic <strong>the</strong> complex lab<br />
method with a simpler, on-farm method.<br />
Management <strong>of</strong> forage <strong>particle</strong> <strong>size</strong><br />
begins with harvesting <strong>forages</strong> at <strong>the</strong> proper<br />
stage <strong>of</strong> maturity. Chopping <strong>the</strong> crop at <strong>the</strong><br />
proper length produces <strong>forages</strong> that can be<br />
combined to achieve <strong>the</strong> desired <strong>particle</strong><br />
length in a TMR.<br />
Measuring <strong>the</strong> <strong>particle</strong> length <strong>of</strong><br />
individual <strong>forages</strong> is only one part <strong>of</strong> <strong>the</strong><br />
solution. In fact, measuring single <strong>forages</strong><br />
for <strong>particle</strong> <strong>size</strong> is similar to analyzing that<br />
forage for crude protein. There are<br />
recommended ranges for individual <strong>forages</strong>,<br />
but <strong>the</strong> real value <strong>of</strong> <strong>the</strong> <strong>particle</strong> <strong>size</strong><br />
measurement is in combining <strong>forages</strong> to<br />
achieve <strong>the</strong> proper TMR <strong>particle</strong> <strong>size</strong>, much<br />
like combining feeds to achieve <strong>the</strong> proper<br />
protein level in <strong>the</strong> ration.<br />
The main goal <strong>of</strong> analyzing TMR<br />
<strong>particle</strong> <strong>size</strong> is measuring <strong>the</strong> distribution <strong>of</strong><br />
feed <strong>and</strong> forage <strong>particle</strong>s that <strong>the</strong> cow<br />
actually consumes. Examine not only <strong>the</strong><br />
<strong>particle</strong>s greater than a particular <strong>size</strong>, but<br />
also <strong>the</strong> overall distribution <strong>of</strong> feed <strong>particle</strong>s<br />
being consumed by <strong>the</strong> cow. Measuring<br />
TMR samples fresh from <strong>the</strong> feed bunk <strong>and</strong><br />
before <strong>the</strong> cows eat or sort <strong>the</strong> feed is<br />
recommended. Mixing <strong>and</strong> distribution<br />
equipment can reduce <strong>particle</strong> <strong>size</strong> <strong>of</strong> feeds<br />
<strong>and</strong> <strong>forages</strong> <strong>and</strong> need to be accounted for<br />
when evaluating <strong>the</strong> actual diet being fed.<br />
An Additional Sieve<br />
The original <strong>particle</strong> separator, first<br />
introduced in 1996, has proven valuable in<br />
measuring feed <strong>particle</strong> <strong>size</strong>. However, in a<br />
survey <strong>of</strong> 831 TMR samples collected on<br />
commercial dairy farms, an average <strong>of</strong> 58<br />
percent <strong>of</strong> <strong>the</strong> material passed through both<br />
sieves (0.75 <strong>and</strong> 0.31 inches). Better<br />
characterization <strong>of</strong> <strong>the</strong>se smaller feed<br />
<strong>particle</strong>s requires a more detailed<br />
measurement. Thus, a sieve designed to<br />
fur<strong>the</strong>r partition <strong>particle</strong>s less than 0.31<br />
inches should be useful. As a result <strong>of</strong> this<br />
observation, an additional sieve was added<br />
to <strong>the</strong> separator device. A pore <strong>size</strong> <strong>of</strong> 0.05<br />
inches was chosen, since feed <strong>particle</strong>s less<br />
than this <strong>size</strong> ei<strong>the</strong>r are digested rapidly in<br />
<strong>the</strong> rumen or pass rapidly through <strong>the</strong><br />
rumen. The use <strong>of</strong> <strong>the</strong> additional sieve is<br />
most applicable when measuring <strong>the</strong> <strong>particle</strong><br />
<strong>size</strong> <strong>of</strong> a TMR; it is possible that with some<br />
<strong>forages</strong> very few <strong>particle</strong>s will pass through<br />
<strong>the</strong> additional smaller sieve.<br />
DAS 02-42 <strong>Evaluating</strong> <strong>forages</strong> <strong>and</strong> <strong>TMRs</strong> <strong>using</strong> <strong>the</strong> <strong>Penn</strong> State Forage Particle Separator 1
GUIDELINES FOR PARTICLE SIZE<br />
Achieving adequate ration <strong>particle</strong> <strong>size</strong><br />
requires <strong>using</strong> recommended guidelines for<br />
<strong>forages</strong> <strong>and</strong> <strong>TMRs</strong> (Table 1). Original<br />
<strong>particle</strong> <strong>size</strong> guidelines were based on field<br />
data consisting <strong>of</strong> a large number <strong>of</strong> farms.<br />
Since that time, three intensive research<br />
studies have been conducted at <strong>Penn</strong> State to<br />
fur<strong>the</strong>r refine <strong>the</strong>se guidelines. The results <strong>of</strong><br />
forage <strong>and</strong> TMR <strong>particle</strong> <strong>size</strong> distribution<br />
can be used in formulating rations <strong>and</strong> when<br />
trouble shooting nutrition problems.<br />
Corn silage<br />
Corn silage can be quite variable, <strong>and</strong><br />
<strong>the</strong> required <strong>particle</strong> <strong>size</strong> depends largely on<br />
<strong>the</strong> amount fed in <strong>the</strong> diet. If corn silage is<br />
<strong>the</strong> sole forage, at least 8 percent <strong>of</strong> <strong>the</strong><br />
<strong>particle</strong>s should be in <strong>the</strong> upper sieve <strong>of</strong> <strong>the</strong><br />
separator, compared to a minimum <strong>of</strong> 3<br />
percent when corn silage is not <strong>the</strong> sole<br />
forage.<br />
The chop length <strong>of</strong> corn silage must<br />
balance good packing <strong>and</strong> fermentation with<br />
extremely short, pulverized forage. This<br />
means 45 to 65 percent <strong>of</strong> <strong>the</strong> silage material<br />
should remain on <strong>the</strong> middle sieve <strong>and</strong> 30 to<br />
40 percent on <strong>the</strong> lower sieve <strong>of</strong> <strong>the</strong><br />
separator. If <strong>the</strong> last screen is used for corn<br />
silage, no more than 5 percent should be<br />
recovered in <strong>the</strong> bottom pan. As corn silage<br />
makes up a greater proportion <strong>of</strong> <strong>the</strong> ration,<br />
more material should remain in <strong>the</strong> middle<br />
two sieves <strong>and</strong> less in <strong>the</strong> top sieve <strong>and</strong><br />
bottom pan.<br />
<strong>New</strong>er systems for harvesting corn<br />
silage (chopping <strong>and</strong> rolling in one process)<br />
can create silage with a large percentage <strong>of</strong><br />
long forage <strong>particle</strong>s without large pieces <strong>of</strong><br />
whole cobs or stalks. This forage can be<br />
excellent quality because it packs <strong>and</strong><br />
ferments well in <strong>the</strong> silo.<br />
Typically, when conventional choppers<br />
are set to harvest corn silage at a long<br />
<strong>particle</strong> <strong>size</strong>, forage is predisposed to poor<br />
silo compaction <strong>and</strong> mold formation. The<br />
material usually has large pieces <strong>of</strong> cob, dry<br />
stalks <strong>and</strong> leaves that allow a great deal <strong>of</strong><br />
sorting <strong>and</strong> may <strong>of</strong>ten be refused by high<br />
producing cows.<br />
Haylage<br />
There is a lot <strong>of</strong> variability with haylage<br />
due to <strong>the</strong> type <strong>and</strong> use <strong>of</strong> machinery, sward<br />
type <strong>and</strong> density, <strong>and</strong> most <strong>of</strong> all, <strong>the</strong> dry<br />
matter <strong>of</strong> <strong>the</strong> crop harvested. Ten to 20<br />
percent <strong>of</strong> <strong>the</strong> crop should be in <strong>the</strong> upper<br />
sieve <strong>of</strong> <strong>the</strong> <strong>particle</strong> separator. Particle <strong>size</strong><br />
recommendations may need to be altered<br />
based on silo type. Forages stored in upright,<br />
sealed silos would likely fall at <strong>the</strong> lower<br />
end <strong>of</strong> <strong>the</strong> range (10 percent). Bunker silos<br />
can h<strong>and</strong>le appreciably longer material, up<br />
to 20 percent on <strong>the</strong> upper sieve. The middle<br />
sieve should contain 45 to 75 percent <strong>of</strong> <strong>the</strong><br />
material <strong>and</strong> <strong>the</strong> lower sieve 20 to 30<br />
percent. As with corn silage, no more than 5<br />
percent <strong>of</strong> <strong>the</strong> material should be retained on<br />
<strong>the</strong> bottom pan<br />
TMR<br />
Field investigations conducted at <strong>Penn</strong><br />
State have found considerable variability in<br />
overall rations. Feeding management plays<br />
an important role in <strong>the</strong> <strong>particle</strong> length needs<br />
<strong>of</strong> <strong>the</strong> cow. Ideally no more than 8 percent<br />
<strong>of</strong> <strong>the</strong> material should be retained on <strong>the</strong><br />
upper sieve. Guidelines for <strong>TMRs</strong> for high<br />
producing dairy cows are 2 to 8 percent <strong>of</strong><br />
<strong>the</strong> <strong>particle</strong>s in <strong>the</strong> upper sieve, 30 to 50<br />
percent in <strong>the</strong> middle <strong>and</strong> lower sieves, <strong>and</strong><br />
no more than 20 percent in <strong>the</strong> bottom pan.<br />
DAS 02-42 <strong>Evaluating</strong> <strong>forages</strong> <strong>and</strong> <strong>TMRs</strong> <strong>using</strong> <strong>the</strong> <strong>Penn</strong> State Forage Particle Separator 2
GUIDELINES FOR PARTICLE SIZE (CONTINUED)<br />
Table 1. Forage <strong>and</strong> TMR <strong>particle</strong> <strong>size</strong> recommendations based on three experiments <strong>using</strong> early<br />
lactation cows fed ei<strong>the</strong>r alfalfa haylage or corn silage with or without cottonseed hulls.<br />
Screen<br />
Pore Size<br />
(inches)<br />
Particle Size<br />
(inches)<br />
Corn Silage Haylage TMR<br />
Upper Sieve 0.75 > 0.75 3 to 8 10 to 20 2 to 8<br />
Middle Sieve 0.31 0.31 to 0.75 45 to 65 45 to 75 30 to 50<br />
Lower Sieve 0.05 a 0.07 to 0.31 30 to 40 20 to 30 30 to 50<br />
Bottom Pan < 0.07 < 5 < 5 < 20<br />
a<br />
Pores are square, so largest opening is <strong>the</strong> diagonal, which is 0.07 inches. This is <strong>the</strong> reason <strong>the</strong> largest <strong>particle</strong>s<br />
that can pass through <strong>the</strong> Lower Sieve are 0.07 inches in length.<br />
PARTICLE SEPARATOR INSTRUCTIONS<br />
The <strong>Penn</strong> State Forage Particle Separator<br />
is currently available from Nasco. For <strong>the</strong>ir<br />
free phone order service, dial 1-800-558-<br />
9595. To use <strong>the</strong> separator an accurate scale<br />
is needed to weigh <strong>the</strong> samples <strong>and</strong> <strong>the</strong><br />
boxes. A data sheet <strong>and</strong> blank lognormal<br />
paper are attached to <strong>the</strong> back <strong>of</strong> this<br />
publication.<br />
A spreadsheet that performs all <strong>of</strong> <strong>the</strong><br />
calculations <strong>and</strong> graphs <strong>the</strong> results can be<br />
downloaded from <strong>the</strong> <strong>Penn</strong> State<br />
Dairy Cattle Nutrition Website. Visit<br />
http://www.das.psu.edu/dcn/catforg/<strong>particle</strong><br />
<strong>and</strong> download “<strong>particle</strong> <strong>size</strong>.xls.”<br />
Using <strong>the</strong> separator<br />
Stack <strong>the</strong> four plastic separator boxes on<br />
top <strong>of</strong> each o<strong>the</strong>r in <strong>the</strong> following order:<br />
sieve with <strong>the</strong> largest holes (upper sieve) on<br />
top, <strong>the</strong> medium-<strong>size</strong>d holes (middle sieve)<br />
next, <strong>the</strong>n <strong>the</strong> smallest holes (lower sieve),<br />
<strong>and</strong> <strong>the</strong> solid pan on <strong>the</strong> bottom. Place<br />
approximately 3 pints <strong>of</strong> forage or TMR on<br />
<strong>the</strong> upper sieve. Moisture content may cause<br />
small effects on sieving properties, but it is<br />
not practical to recommend analysis at a<br />
st<strong>and</strong>ard moisture content. Very wet<br />
samples (less than 45 percent dry matter)<br />
may not separate accurately. The separator<br />
is designed to describe <strong>particle</strong> <strong>size</strong> <strong>of</strong> <strong>the</strong><br />
feed <strong>of</strong>fered to <strong>the</strong> animal. Thus, samples<br />
should not be chemically or physically<br />
altered from what was fed before sieving.<br />
On a flat surface, shake <strong>the</strong> sieves in one<br />
direction 5 times <strong>the</strong>n rotate <strong>the</strong> separator<br />
box one-quarter turn. There should be no<br />
vertical motion during shaking. Repeat this<br />
process 7 times, for a total <strong>of</strong> 8 sets or 40<br />
shakes, rotating <strong>the</strong> separator after each set<br />
<strong>of</strong> 5 shakes. See <strong>the</strong> sieve shaking pattern<br />
shown in Figure 1.<br />
The force <strong>and</strong> frequency <strong>of</strong> shaking must<br />
be enough to slide <strong>particle</strong>s over <strong>the</strong> sieve<br />
surface, allowing those smaller than <strong>the</strong> pore<br />
<strong>size</strong> to fall through. We recommend shaking<br />
<strong>the</strong> <strong>particle</strong> separator at a frequency <strong>of</strong> at<br />
least 1.1 Hz (approximately 1.1 shake per<br />
second) with a stroke length <strong>of</strong> 7 in (or 17<br />
cm). For best results, calibrate <strong>the</strong> frequency<br />
<strong>of</strong> movement over a distance <strong>of</strong> 7 inches for<br />
a specified number <strong>of</strong> times. The number <strong>of</strong><br />
full movements divided by time in seconds<br />
DAS 02-42 <strong>Evaluating</strong> <strong>forages</strong> <strong>and</strong> <strong>TMRs</strong> <strong>using</strong> <strong>the</strong> <strong>Penn</strong> State Forage Particle Separator 3
PARTICLE SEPARATOR INSTRUCTIONS (CONTINUED)<br />
results in a frequency value that can be<br />
compared to <strong>the</strong> 1.1 Hz recommendation.<br />
After shaking is completed, weigh <strong>the</strong><br />
material on each sieve <strong>and</strong> on <strong>the</strong> bottom<br />
pan. Note that material on <strong>the</strong> upper sieve is<br />
greater than 0.75 inches long, material on<br />
<strong>the</strong> middle sieve is between 0.31 <strong>and</strong> 0.75<br />
inches, material on <strong>the</strong> third sieve is<br />
between 0.07 <strong>and</strong> 0.31 inches, <strong>and</strong> material<br />
in <strong>the</strong> bottom pan is less than 0.07 inches.<br />
See Table 2 for data entry <strong>and</strong> procedures to<br />
compute <strong>the</strong> percentage under each sieve.<br />
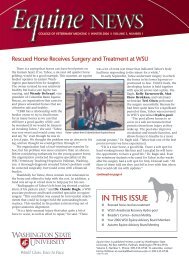
Using Lognormal Paper<br />
There is currently some debate as to <strong>the</strong><br />
best type <strong>of</strong> graphing paper to use when<br />
plotting <strong>particle</strong> <strong>size</strong> results. The <strong>size</strong> <strong>of</strong><br />
forage <strong>and</strong> TMR <strong>particle</strong>s in a sample does<br />
not follow a normal distribution pattern,<br />
however it can be plotted as a straight-line<br />
distribution <strong>using</strong> lognormal graphing paper.<br />
We recommend lognormal paper be used to<br />
graph <strong>the</strong> distribution <strong>of</strong> forage <strong>and</strong> TMR<br />
<strong>particle</strong> <strong>size</strong> as this is <strong>the</strong> most simple<br />
method <strong>and</strong> it fits most data accurately.<br />
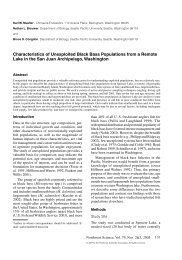
The cumulative percentage under<strong>size</strong>d<br />
for each sieve is plotted on <strong>the</strong> graph.<br />
5 5 5<br />
Figure 1. Shaking pattern for <strong>particle</strong> <strong>size</strong> separation.<br />
Referring to Table 2, value [f] refers to 0.75<br />
inches, value [g] to 0.31 inches, <strong>and</strong> value<br />
[h] to 0.07 inches. These percentages are<br />
plotted on lognormal paper <strong>and</strong> an<br />
appropriate line drawn between <strong>the</strong> three<br />
points (best-fit line).<br />
On <strong>the</strong> graph paper, <strong>the</strong> horizontal axis<br />
represents <strong>particle</strong> <strong>size</strong> <strong>and</strong> <strong>the</strong> vertical axis<br />
represents <strong>the</strong> cumulative percentage<br />
under<strong>size</strong>d. The axes are not linear. For <strong>the</strong><br />
example given in Table 2, <strong>the</strong> following<br />
deductions or statements can be made:<br />
• Approximately 5% <strong>of</strong> <strong>the</strong> feed is more<br />
than 0.75 inches in length.<br />
• Approximately 40% <strong>of</strong> <strong>the</strong> feed falls<br />
between 0.31 <strong>and</strong> 0.75 inches in length.<br />
• Approximately 40% <strong>of</strong> <strong>the</strong> feed falls<br />
between 0.07 <strong>and</strong> 0.31 inches in length.<br />
• Approximately 15% <strong>of</strong> <strong>the</strong> feed is less<br />
than 0.07 inches long.<br />
Ano<strong>the</strong>r interpretation could be:<br />
• Approximately 95% <strong>of</strong> <strong>the</strong> feed is less<br />
than 0.75 inches in length.<br />
• Approximately 55% <strong>of</strong> <strong>the</strong> feed is less<br />
than 0.31 inches in length.<br />
• Approximately 15% <strong>of</strong> <strong>the</strong> feed is less<br />
than 0.07 inches long.<br />
1. 2. 3. 4.<br />
5<br />
5 5<br />
5. 6. 7.<br />
8.<br />
DAS 02-42 <strong>Evaluating</strong> <strong>forages</strong> <strong>and</strong> <strong>TMRs</strong> <strong>using</strong> <strong>the</strong> <strong>Penn</strong> State Forage Particle Separator 4<br />
5<br />
5
PARTICLE SEPARATOR INSTRUCTIONS (CONTINUED)<br />
Table 2. Example <strong>of</strong> <strong>the</strong> calculation <strong>of</strong> total weight <strong>and</strong> cumulative percentages under each sieve.<br />
Record <strong>and</strong> Calculate Data<br />
Sample Weight Retained Proportion Remaining On Each Sieve<br />
Upper sieve (0.75 inches) 10 grams [a] a/e * 100 10/200 * 100 = 5%<br />
Middle sieve (0.31 inches) 80 grams [b] b/e *100 80/200 * 100 = 40%<br />
Lower sieve (0.07 inches) 80 grams [c] c/e * 100 80/200 * 100 = 40%<br />
Bottom pan (< 0.07 inches) 30 grams [d] d/e * 100 30/200 * 100 = 15%<br />
Sum <strong>of</strong> Weights 200 grams [e]<br />
Compute Cumulative Percentage Under<strong>size</strong>d 1<br />
% Under upper sieve f = 100 – (a/e *100) 100 – 5 = 95% under<strong>size</strong>d<br />
% Under middle sieve g = f – (b/e*100) 95 – 40 = 55% under<strong>size</strong>d<br />
% Under lower sieve h = g – (c/e*100) 55 – 40 = 15% under<strong>size</strong>d<br />
1<br />
Cumulative percentage under<strong>size</strong>d refers to <strong>the</strong> proportion <strong>of</strong> <strong>particle</strong>s smaller than a given <strong>size</strong>. For example, on<br />
average, 95% <strong>of</strong> feed is smaller than 0.75 inches, 55% <strong>of</strong> feed is smaller than 0.31 inches <strong>and</strong> 0.15% <strong>of</strong> feed is<br />
smaller than 0.07 inches.<br />
Cumulative Percentage Under<strong>size</strong>d<br />
99.9<br />
99<br />
95<br />
90<br />
80<br />
70<br />
60<br />
50<br />
40<br />
30<br />
20<br />
10<br />
5<br />
2<br />
1<br />
0.1<br />
0.01<br />
0.07<br />
0.1<br />
0.31 0.75<br />
1 10<br />
Particle <strong>size</strong> (inches)<br />
Figure 2. Data from example in Table 2 plotted on lognormal paper.<br />
DAS 02-42 <strong>Evaluating</strong> <strong>forages</strong> <strong>and</strong> <strong>TMRs</strong> <strong>using</strong> <strong>the</strong> <strong>Penn</strong> State Forage Particle Separator 5<br />
target<br />
sample 1
PARTICLE SIZE EFFECTS ON THE DAIRY COW<br />
The dairy cow's need for increasingly<br />
higher levels <strong>of</strong> energy have led to diets<br />
relatively high in concentrates. However, cows<br />
still require adequate fiber in <strong>the</strong> ration to<br />
function properly. When <strong>the</strong> minimum fiber<br />
levels are not met, cows may show one or more<br />
<strong>of</strong> <strong>the</strong> following disorders: reduced milk fat<br />
percentage, displaced abomasum, <strong>and</strong>/or an<br />
increase in <strong>the</strong> incidence <strong>of</strong> rumen<br />
parakeratosis, laminitis, or rumen acidosis.<br />
Cows consuming sufficient NDF with severely<br />
reduced forage <strong>particle</strong> <strong>size</strong> may exhibit <strong>the</strong><br />
same metabolic disorders as cows fed a diet<br />
deficient in fiber.<br />
Adequate forage <strong>particle</strong> length is<br />
necessary for proper rumen function. Reduced<br />
forage <strong>particle</strong> <strong>size</strong> has been shown to decrease<br />
<strong>the</strong> time spent chewing <strong>and</strong> cause a trend<br />
toward decreased rumen pH. When cows spend<br />
less time chewing, <strong>the</strong>y produce less saliva,<br />
which is needed to buffer <strong>the</strong> rumen. In<br />
comparison, when feed <strong>particle</strong>s are too long,<br />
animals are more likely to sort <strong>the</strong> ration, <strong>and</strong><br />
ultimately <strong>the</strong> diet consumed is very different<br />
than <strong>the</strong> one originally formulated.<br />
If rations or <strong>forages</strong> are too fine, feeding a<br />
small amount <strong>of</strong> long hay or balage can<br />
improve <strong>the</strong> average ration <strong>particle</strong> <strong>size</strong>. Farms<br />
feeding 5 or more pounds <strong>of</strong> long hay per cow<br />
daily would not likely have problems with<br />
overall <strong>particle</strong> <strong>size</strong>. Many farms, however, do<br />
not have long hay as an option. In <strong>the</strong>se<br />
situations, <strong>the</strong> distribution <strong>of</strong> <strong>particle</strong> <strong>size</strong> in <strong>the</strong><br />
total ration is likely more important than <strong>the</strong><br />
proportion <strong>of</strong> <strong>particle</strong>s greater than a certain<br />
length.<br />
Visit <strong>Penn</strong> State's College <strong>of</strong> Agricultural Sciences on <strong>the</strong> Web: http://www.cas.psu.edu/<br />
In addition to analysis <strong>of</strong> both forage <strong>and</strong><br />
TMR <strong>particle</strong> <strong>size</strong>, <strong>the</strong> <strong>particle</strong> separator may<br />
also be used to monitor <strong>the</strong> possibility <strong>of</strong> feed<br />
bunk sorting <strong>and</strong> may aid in trouble shooting<br />
feeding, metabolic, or production problems. To<br />
evaluate sorting, measure <strong>the</strong> TMR remaining<br />
in <strong>the</strong> bunk several times throughout <strong>the</strong> day<br />
(e.g. 4, 8, 12, <strong>and</strong> 48 hours after feeding). The<br />
resulting <strong>particle</strong> <strong>size</strong> distribution should not<br />
differ more than 3 to 5 percent from <strong>the</strong><br />
original TMR. If cows are sorting throughout<br />
<strong>the</strong> day, pH may fluctuate more than expected<br />
<strong>and</strong> may affect intake, rumen fermentation, or<br />
overall digestion. Problems may be more<br />
pronounced if bunks are overcrowded or if<br />
first-calf heifers are grouped with older cows.<br />
In <strong>the</strong>se situations more aggressive animals<br />
may preferentially consume grain <strong>and</strong> o<strong>the</strong>r<br />
more palatable, readily fermentable feeds<br />
leaving high fiber, poorly digestible feeds for<br />
<strong>the</strong> o<strong>the</strong>r animals.<br />
Feeding a ration containing extremely fine<br />
or coarse <strong>particle</strong> <strong>size</strong> is not recommended.<br />
Diets on ei<strong>the</strong>r end <strong>of</strong> <strong>the</strong> spectrum can<br />
predispose cows to rumen acidosis <strong>and</strong> o<strong>the</strong>r<br />
associated problems <strong>and</strong> should be avoided.<br />
Particle <strong>size</strong> analysis is not a crystal ball for<br />
determining ration problems. However, <strong>the</strong><br />
<strong>Penn</strong> State Particle Separator does provide an<br />
objective measurement <strong>of</strong> <strong>particle</strong> <strong>size</strong>, <strong>and</strong> it<br />
can be a useful tool to improve <strong>the</strong> overall<br />
nutrition <strong>of</strong> <strong>the</strong> dairy cow.<br />
This publication is available in alternative media on request.<br />
The <strong>Penn</strong>sylvania State University is committed to <strong>the</strong> policy that all persons shall have equal access to programs, facilities,<br />
admission, <strong>and</strong> employment without regard to personal characteristics not related to ability, performance, or qualifications as<br />
determined by University policy or by state or federal authorities. It is <strong>the</strong> policy <strong>of</strong> <strong>the</strong> University to maintain an academic <strong>and</strong> work<br />
environment free <strong>of</strong> discrimination, including harassment. The <strong>Penn</strong>sylvania State University prohibits discrimination <strong>and</strong><br />
harassment against any person because <strong>of</strong> age, ancestry, color, disability or h<strong>and</strong>icap, national origin, race, religious creed, sex,<br />
sexual orientation, or veteran status. Discrimination or harassment against faculty, staff, or students will not be tolerated at The<br />
<strong>Penn</strong>sylvania State University. Direct all inquiries regarding <strong>the</strong> nondiscrimination policy to <strong>the</strong> Affirmative Action Director, The<br />
<strong>Penn</strong>sylvania State University, 201 Willard Building, University Park, PA 16802-2801, Tel 814-865-4700/V, 814-863-1150/TTY.<br />
DAS 02-42 <strong>Evaluating</strong> <strong>forages</strong> <strong>and</strong> <strong>TMRs</strong> <strong>using</strong> <strong>the</strong> <strong>Penn</strong> State Forage Particle Separator 6
RECOMMENDED FIBER INTAKES<br />
Adequate NDF intake by <strong>the</strong> dairy cow<br />
is necessary for normal rumen function,<br />
production, <strong>and</strong> health. A majority <strong>of</strong> <strong>the</strong><br />
NDF in <strong>the</strong> ration must be in <strong>the</strong> form <strong>of</strong><br />
forage NDF along with sufficient ration<br />
<strong>particle</strong> <strong>size</strong> to maintain a healthy rumen<br />
environment. Under conditions <strong>of</strong> marginal<br />
<strong>particle</strong> <strong>size</strong>, special attention must be paid<br />
to maintaining adequate levels <strong>of</strong> total NDF<br />
<strong>and</strong> forage NDF intakes (Tables 3 <strong>and</strong> 4).<br />
Table 3. Guidelines for forage NDF intake.<br />
Forage NDF<br />
as % <strong>of</strong> body weight 1 Intake level<br />
Suggested ranges for total NDF are at<br />
least 1.10 to 1.20 percent <strong>of</strong> body weight.<br />
Forage NDF intake can range from 0.75 to<br />
1.10 percent <strong>of</strong> body weight. However, if<br />
<strong>the</strong> forage or TMR <strong>particle</strong> length is too<br />
fine, <strong>the</strong>n a higher minimum (less than 0.85<br />
percent <strong>of</strong> body weight) should be used.<br />
0.75% 2 Minimum if ration provides 1.30 to 1.40% total<br />
NDF by use <strong>of</strong> byproduct feeds.<br />
0.85% 2 Minimum if ration provides 1.00 to 1.20% total<br />
NDF by use <strong>of</strong> grains or starchy feeds.<br />
0.90% Moderately low<br />
0.95% Average<br />
1.00% Moderately low<br />
1.10% Maximum<br />
1 Forage dry matter intake should range between 1.40% <strong>and</strong> 2.40% <strong>of</strong> body weight,<br />
regardless <strong>of</strong> forage NDF intake parameters.<br />
2 Higher minimum may be necessary if forage is chopped too fine.<br />
Table 4. Guidelines for total NDF <strong>and</strong> forage NDF intakes as a percent <strong>of</strong> <strong>the</strong> total ration dry<br />
matter when feeding concentrates with low NDF.<br />
Milk production Total NDF intake Forage NDF intake<br />
High (> 80 pounds) 28-32% 21-27%<br />
Medium (60-80 pounds) 33-37% 25-32%<br />
Low (< 60 pounds) 38-42% 29-36%<br />
DAS 02-42 <strong>Evaluating</strong> <strong>forages</strong> <strong>and</strong> <strong>TMRs</strong> <strong>using</strong> <strong>the</strong> <strong>Penn</strong> State Forage Particle Separator 7
Data Sheet For Forage <strong>and</strong> TMR Particle Size Analysis<br />
Weight <strong>of</strong> Material Retained<br />
Upper (a) __________ __________ __________<br />
Middle (b) __________ __________ __________<br />
Lower (c) __________ __________ __________<br />
Bottom Pan (d) __________ __________ __________<br />
Sum <strong>of</strong> Weights (e) __________ __________ __________<br />
Calculations for percentage retained on each sieve<br />
Upper __________ __________ __________<br />
[= a/e *100]<br />
Middle _________ __________ __________<br />
[= b/e *100]<br />
Lower __________ __________ __________<br />
[= c/e *100]<br />
Bottom Pan __________ __________ __________<br />
[= d/e *100]<br />
Calculations for percentage under each sieve<br />
Total Weight __________ __________ __________<br />
[e = a+b+c+d]<br />
Upper Sieve __________ __________ __________<br />
[f = 100 – a/e*100)]<br />
Middle Sieve __________ __________ __________<br />
[g = f – (b/e*100)]<br />
Lower Sieve __________ __________ __________<br />
[h = g – (c/e*100)]<br />
DAS 02-42 <strong>Evaluating</strong> <strong>forages</strong> <strong>and</strong> <strong>TMRs</strong> <strong>using</strong> <strong>the</strong> <strong>Penn</strong> State Forage Particle Separator 8
Cumulative Percentage Under<strong>size</strong>d<br />
99.9<br />
99<br />
95<br />
90<br />
80<br />
70<br />
60<br />
50<br />
40<br />
30<br />
20<br />
10<br />
5<br />
2<br />
1<br />
For:<br />
TMR Particle Size Analysis<br />
0.1<br />
0.07 0.31 0.75<br />
0.01 0.1 1 10<br />
Particle <strong>size</strong> (inches)<br />
DAIRY&<br />
ANIMAL<br />
SCIENCE<br />
target<br />
DAS 02-42 <strong>Evaluating</strong> <strong>forages</strong> <strong>and</strong> <strong>TMRs</strong> <strong>using</strong> <strong>the</strong> <strong>Penn</strong> State Forage Particle Separator 9
Cumulative Percentage Under<strong>size</strong>d<br />
99.9<br />
99<br />
95<br />
90<br />
80<br />
70<br />
60<br />
50<br />
40<br />
30<br />
20<br />
10<br />
5<br />
2<br />
1<br />
Corn Silage Particle Size Analysis<br />
For:<br />
0.1<br />
0.07 0.31 0.75<br />
0.01 0.1 1 10<br />
Particle <strong>size</strong> (inches)<br />
DAIRY&<br />
ANIMAL<br />
SCIENCE<br />
target<br />
DAS 02-42 <strong>Evaluating</strong> <strong>forages</strong> <strong>and</strong> <strong>TMRs</strong> <strong>using</strong> <strong>the</strong> <strong>Penn</strong> State Forage Particle Separator 10
Cumulative Percentage Under<strong>size</strong>d<br />
99.9<br />
99<br />
95<br />
90<br />
80<br />
70<br />
60<br />
50<br />
40<br />
30<br />
20<br />
10<br />
5<br />
2<br />
1<br />
For:<br />
Haylage Particle Size Analysis<br />
0.1<br />
0.07 0.31 0.75<br />
0.01 0.1 1 10<br />
Particle <strong>size</strong> (inches)<br />
DAIRY&<br />
ANIMAL<br />
SCIENCE<br />
target<br />
DAS 02-42 <strong>Evaluating</strong> <strong>forages</strong> <strong>and</strong> <strong>TMRs</strong> <strong>using</strong> <strong>the</strong> <strong>Penn</strong> State Forage Particle Separator 11
Appendix. Particle Size Spreadsheet, Instructions<br />
Particle Size Analysis<br />
http://www.das.psu.edu/dcn/catforg/<strong>particle</strong>/<br />
Instructions<br />
Summary: Enter <strong>the</strong> weight <strong>of</strong> <strong>particle</strong>s on each sieve on <strong>the</strong> "Data" tab. The distribution will be<br />
calculated <strong>and</strong> shown below your entries. View a graph <strong>of</strong> <strong>the</strong> results by clicking on <strong>the</strong> "Graph" tab.<br />
See <strong>the</strong> explanation below for more details.<br />
Entering Sample Data<br />
1. Click on <strong>the</strong> "Data" tab below.<br />
2. Enter information in cells with blue text; always replace or delete <strong>the</strong> example text.<br />
3. Be sure to enter <strong>the</strong> type <strong>of</strong> sample. Target ranges on <strong>the</strong> graph are based on sample type.<br />
Use <strong>the</strong> following numeric code to identify <strong>the</strong> sample type:<br />
TMR = 1 Corn silage = 2 Haylage = 3<br />
4. Enter <strong>the</strong> sample name <strong>and</strong> <strong>the</strong> weight <strong>of</strong> <strong>particle</strong>s left on each sieve.<br />
If only one sample is analyzed, delete <strong>the</strong> example data for "Sample 2".<br />
Reading <strong>the</strong> Output<br />
1. The output from your measurements has two forms.<br />
The "Output" section on <strong>the</strong> "Data" tab below.<br />
A graph <strong>of</strong> your results on <strong>the</strong> "Graph" tab below.<br />
2. The "Output" section<br />
Percentage <strong>of</strong> <strong>particle</strong>s on each sieve<br />
Cummulative percent under<strong>size</strong>d, which is <strong>the</strong> amount under each sieve<br />
Average length <strong>of</strong> <strong>particle</strong>s in <strong>the</strong> sample<br />
St<strong>and</strong>ard deviation for length <strong>of</strong> <strong>particle</strong>s in <strong>the</strong> sample<br />
Recommended <strong>particle</strong> <strong>size</strong> distribution for your sample type<br />
3. The Graph<br />
Blue <strong>and</strong> orange points plot <strong>the</strong> cummulative percent under<strong>size</strong>d<br />
Blue <strong>and</strong> orange lines show <strong>the</strong> "line <strong>of</strong> best fit" for <strong>the</strong> sample (regression)<br />
Green boxes indicate a recommended target range for your sample type<br />
Unless you are interested in <strong>the</strong> math <strong>and</strong> equations behind <strong>the</strong>se calculations, you will not<br />
need to use <strong>the</strong> "Calculations" tab below.<br />
Developed by Coleen Jones, Paul Konon<strong>of</strong>f, <strong>and</strong> Jud Heinrichs<br />
DAIRY&<br />
ANIMAL<br />
SCIENCE<br />
Questions?<br />
If <strong>the</strong>y concern <strong>using</strong> this spreadsheet, contact Coleen Jones at cjones@psu.edu<br />
If you are interested in <strong>particle</strong> <strong>size</strong> <strong>and</strong> target ranges, contact Jud Heinrichs at ajh@psu.edu<br />
DAS 02-42 <strong>Evaluating</strong> <strong>forages</strong> <strong>and</strong> <strong>TMRs</strong> <strong>using</strong> <strong>the</strong> <strong>Penn</strong> State Forage Particle Separator 12
Appendix. Particle Size Spreadsheet, Data<br />
Farm Name Maximum Milk Makers<br />
Sample Date 7/15/2002<br />
Address 658 Dairy Lane<br />
Sample Type 1<br />
Anytown, PA 17956<br />
1 = TMR, 2 = Corn silage, 3 = Haylage<br />
INPUT<br />
Seive<br />
Upper<br />
Middle<br />
Lower<br />
Bottom Pan<br />
Total<br />
OUTPUT<br />
Section 1. Distribution <strong>of</strong> Particles<br />
Seive<br />
Upper<br />
Middle<br />
Lower<br />
Bottom Pan<br />
Section 2. Sample Parameters<br />
Average Particle Size (in)<br />
St<strong>and</strong>ard Deviation (in)<br />
Sample 1: High Group TMR Sample 2: Low Group TMR<br />
Weight (grams) Weight (grams)<br />
40.0 50.0<br />
310.0 275.0<br />
330.0 235.0<br />
120.0 90.0<br />
800.0 650.0<br />
Sample 1: High Group TMR<br />
Sample 2: Low Group TMR<br />
Particles Remaining Cumulative Particles Particles Remaining Cumulative Particles<br />
(% <strong>of</strong> total) (% under each sieve) (% <strong>of</strong> total) (% under each sieve)<br />
5 95 8 92<br />
39 56 42 50<br />
41 15 36 14<br />
15 14<br />
Sample 1 Sample 2<br />
0.21 0.23<br />
0.11 0.11<br />
Section 3. Recommended Distribution <strong>of</strong> Particles Sample Type: TMR<br />
Seive<br />
Upper<br />
Middle<br />
Lower<br />
Bottom Pan<br />
Particles Remaining<br />
(% <strong>of</strong> total)<br />
2 to 8<br />
30 to 50<br />
30 to 50<br />
20 or less<br />
Particle Size Analysis<br />
Datasheet<br />
DAIRY&<br />
ANIMAL<br />
SCIENCE<br />
DAS 02-42 <strong>Evaluating</strong> <strong>forages</strong> <strong>and</strong> <strong>TMRs</strong> <strong>using</strong> <strong>the</strong> <strong>Penn</strong> State Forage Particle Separator 13
Cumulative Percentage Under<strong>size</strong>d<br />
99.9<br />
99<br />
95<br />
90<br />
80<br />
70<br />
60<br />
50<br />
40<br />
30<br />
20<br />
10<br />
5<br />
2<br />
1<br />
Appendix. Particle Size Spreadsheet, Graph<br />
TMR Particle Size Analysis<br />
For: Maximum Milk Makers<br />
0.1<br />
0.07 0.31 0.75<br />
0.01 0.1 1 10<br />
Particle <strong>size</strong> (inches)<br />
DAIRY&<br />
ANIMAL<br />
SCIENCE<br />
DAS 02-42 <strong>Evaluating</strong> <strong>forages</strong> <strong>and</strong> <strong>TMRs</strong> <strong>using</strong> <strong>the</strong> <strong>Penn</strong> State Forage Particle Separator 14<br />
target<br />
sample 1<br />
sample 2