An Introduction to Determining Optimum Quadrat Size and Shape
An Introduction to Determining Optimum Quadrat Size and Shape
An Introduction to Determining Optimum Quadrat Size and Shape

You also want an ePaper? Increase the reach of your titles
YUMPU automatically turns print PDFs into web optimized ePapers that Google loves.
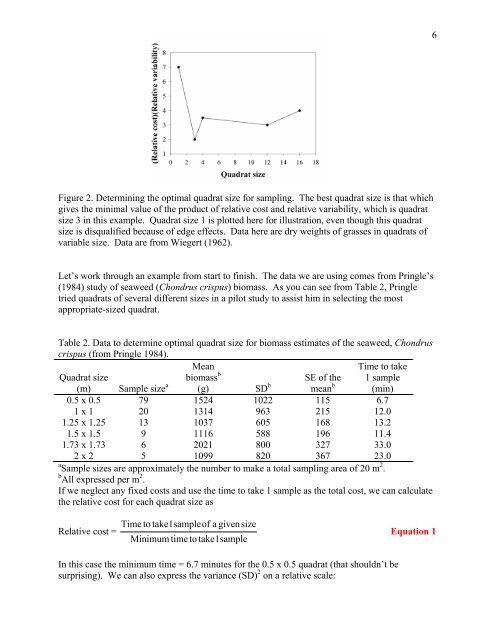
Figure 2. <strong>Determining</strong> the optimal quadrat size for sampling. The best quadrat size is that which<br />
gives the minimal value of the product of relative cost <strong>and</strong> relative variability, which is quadrat<br />
size 3 in this example. <strong>Quadrat</strong> size 1 is plotted here for illustration, even though this quadrat<br />
size is disqualified because of edge effects. Data here are dry weights of grasses in quadrats of<br />
variable size. Data are from Wiegert (1962).<br />
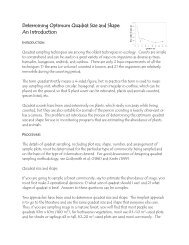
Let’s work through an example from start <strong>to</strong> finish. The data we are using comes from Pringle’s<br />
(1984) study of seaweed (Chondrus crispus) biomass. As you can see from Table 2, Pringle<br />
tried quadrats of several different sizes in a pilot study <strong>to</strong> assist him in selecting the most<br />
appropriate-sized quadrat.<br />
Table 2. Data <strong>to</strong> determine optimal quadrat size for biomass estimates of the seaweed, Chondrus<br />
crispus (from Pringle 1984).<br />
<strong>Quadrat</strong> size<br />
(m) Sample size a<br />
Mean<br />
biomass b<br />
(g) SD b<br />
SE of the<br />
mean b<br />
Time <strong>to</strong> take<br />
1 sample<br />
(min)<br />
0.5 x 0.5 79 1524 1022 115 6.7<br />
1 x 1 20 1314 963 215 12.0<br />
1.25 x 1.25 13 1037 605 168 13.2<br />
1.5 x 1.5 9 1116 588 196 11.4<br />
1.73 x 1.73 6 2021 800 327 33.0<br />
2 x 2 5 1099 820 367 23.0<br />
a 2<br />
Sample sizes are approximately the number <strong>to</strong> make a <strong>to</strong>tal sampling area of 20 m .<br />
b 2<br />
All expressed per m .<br />
If we neglect any fixed costs <strong>and</strong> use the time <strong>to</strong> take 1 sample as the <strong>to</strong>tal cost, we can calculate<br />
the relative cost for each quadrat size as<br />
Relative cost =<br />
Time <strong>to</strong> take1sampleof<br />
a givensize<br />
Minimum time <strong>to</strong> take1sample<br />
In this case the minimum time = 6.7 minutes for the 0.5 x 0.5 quadrat (that shouldn’t be<br />
surprising). We can also express the variance (SD) 2 on a relative scale:<br />
6<br />
Equation 1