Charts for interpreting wildland fire behavior characteristics - NWCC
Charts for interpreting wildland fire behavior characteristics - NWCC
Charts for interpreting wildland fire behavior characteristics - NWCC

You also want an ePaper? Increase the reach of your titles
YUMPU automatically turns print PDFs into web optimized ePapers that Google loves.
NATIONAL FIRE DANGER<br />
RATING SYSTEM<br />
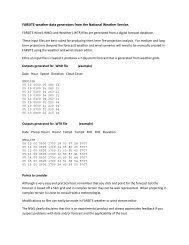
Fire Characteristics Chart<br />
ENERGY RELEASE COMPONENT, ERC<br />
F~gure 9 -SC, ERC, and BI <strong>for</strong> August 3,<br />
August 4, and October 3 from the seasonal<br />
plots In f~gure 8 plotted on an NFDRS chart.<br />
A review of each index and the relationship between<br />
them will clarify the use of the NFDRS chart. Spread<br />
component is related to the rate of <strong>fire</strong> spread and is<br />
strongly affected by windspeed; SC can there<strong>for</strong>e have<br />
wide daily fluctuations. On the other hand. windspeed<br />
has no effect on energy release component. ERC is<br />
related to the energy released in the flaming zone and<br />
mainly reflects changes in fuel moisture. Because ERC<br />
is not affected by wind, it shows a more definite<br />
seasonal trend than either SC or BI. Burning index is<br />
derived from the spread and energy release components<br />
and has the same underlying trend as ERC with the<br />
daily fluctuations of SC imposed on it. Depending on<br />
the type of management decisions to be made, SC,<br />
ERC, BI, or a combination of these values can be used.<br />
Application of NFDRS <strong>Charts</strong><br />
EXAMPLE: FIRE MANAGEMENT PLANS<br />
USDA Forest Service <strong>fire</strong> management policy cur-<br />
rently recognizes two categories of <strong>fire</strong>s on its lands:<br />
wild<strong>fire</strong>s and prescribed <strong>fire</strong>s. Every wild<strong>fire</strong> requires an<br />
appropriate suppression response. Every prescribed <strong>fire</strong><br />
is to be conducted in compliance with an approved<br />
plan. Unplanned ignitions can be allowed to burn as<br />
prescribed <strong>fire</strong>s as long as they meet criteria established<br />
in approved <strong>fire</strong> prescriptions.<br />
The Troy Ranger District in northwestern Montana<br />
prepared a <strong>fire</strong> management plan that covered the<br />
entire district. The plan was approved in early 1979,<br />
and several unplanned ignitions were used as pre-<br />
scribed <strong>fire</strong>s that summer. A <strong>fire</strong> management prescrip-<br />
tion covers each of five <strong>fire</strong> management categories.<br />
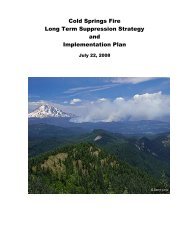
Figure 10 is a flowchart <strong>for</strong> managing <strong>fire</strong>s on big-game<br />
spring and winter ranges on operational <strong>fire</strong> manage-<br />
ment areas. Among the conditions that must be satis-<br />
fied <strong>for</strong> a <strong>fire</strong> to be allowed to burn in these areas are<br />
limits on burning index and energy release component.<br />
The shaded area of the NFDRS chart: in figure 11 illus-<br />
trates these limits. If the plotted points from the last 4<br />
days fall to the left of the vertical line where ERC = 30,<br />
and if the current day's point and the point <strong>for</strong>ecasted<br />
<strong>for</strong> the next day fall in the smaller area limited by BI =<br />
28. then the portion of the <strong>fire</strong> prescription based on<br />
the National Fire-Danger Rating System is satisfied.<br />
As the <strong>fire</strong> season progresses, current in<strong>for</strong>mation on<br />
weather, <strong>fire</strong> danger, <strong>fire</strong> activity, and prescription cri-<br />
teria must be readily available, as illustrated in figure<br />
12. The NFDRS chart is a visual aid that clearly illus-<br />
trates the limits determined from the National Fire-<br />
Danger Rating System.<br />
-<br />
Fire Start<br />
I + Yes -, Lifei property endangered ? Suppress<br />
4<br />
Smoke management conditions favorable ? Suppress<br />
I Yes<br />
I<br />
+<br />
Suppress<br />
Yes<br />
Fire weather,acceptable ? Nob<br />
Suppress<br />
1 Yes<br />
Fire <strong>behavior</strong> acceptable ? Nob<br />
Suppress<br />
I Yes + NO<br />
Forecasted <strong>fire</strong> weather and <strong>behavior</strong> acceptable ? .-p Suppress<br />
I Yes + NO<br />
1 Equipment and manpower a,vailabe if needed ? -p Suppress<br />
No , Suppress<br />
No , Suppress<br />
/ Yes<br />
Boundary threatened ? Yes+ Suppress<br />
(limited<br />
or total)<br />
1<br />
Allow to burn,<br />
Continue to evaluate<br />
I<br />
+<br />
Management objective satisfied ?<br />
I<br />
Contain and a$\hl to burn out<br />
Figure 10.-Example flow chart <strong>for</strong><br />
managing <strong>fire</strong>s on big-game spring and<br />
winter ranges on operational <strong>fire</strong><br />
management areas.