Charts for interpreting wildland fire behavior characteristics - NWCC
Charts for interpreting wildland fire behavior characteristics - NWCC
Charts for interpreting wildland fire behavior characteristics - NWCC

Create successful ePaper yourself
Turn your PDF publications into a flip-book with our unique Google optimized e-Paper software.
United States<br />
Department of<br />
Agriculture <strong>Charts</strong><br />
Forest Serv~ce<br />
Intermountain<br />
Forest and Range<br />
Experiment Station<br />
Ogden, UT 84401<br />
General Technical<br />
Report INT-131<br />
September 1982 Characteristics<br />
<strong>for</strong><br />
Interpreting Wildland<br />
Fire Behavior<br />
Patricia L. Andrews<br />
and Richard C. Rothermel<br />
This file was created by scanning the printed publication.<br />
Errors identified by the software have been corrected;<br />
however, some errors may remain.
THE AUTHORS<br />
PATRICIA L. ANDREWS is a mathematician stat~oned at<br />
the Northern Forest Fire Laboratory in Missoula, Mont.<br />
She rece~ved her B.A. in mathematics and chemistry from<br />
Eastern Montana College, Bill~ngs, in 1970, and her M.A.<br />
in mathematics and computer science in 1973 from the<br />
University of Montana, Missoula. She has been employed<br />
at the Northern Forest Fire Laboratory since 1973.<br />
RICHARD C. ROTHERMEL is a research engineer<br />
stationed at the Northern Forest Fire Laboratory in<br />
Missoula, Mont. Rothermel received his B.S. degree in<br />
aeronautical engineering at the University of Washington,<br />
Seattle, in 1953. He served in the U.S. Air Force as a<br />
special weapons aircraft development officer from<br />
1953-55. Upon his discharge he was employed at Douglas<br />
Aircraft Company as a designer and troubleshooter in the<br />
Armarnent Group. From 1957 to 1961 Rothermel was em-<br />
ployed by General Electric Co. in the aircraft nuclear pro-<br />
pulsion department at the National Reactor Testing<br />
Station in Idaho. In 1961, Rothermel joined the Northern<br />
Forest Fire Laboratory where he has been engaged in<br />
research on the mechanisms of <strong>fire</strong> spread. He received<br />
his master's degree in mechanical engineering at the<br />
University of Colorado, Fort Collins, in 1971. He was<br />
project leader of the Fire Fundamentals research work<br />
unit from 1966 until 1979, and is currently project leader<br />
of the Fire Behavior research work unit at the <strong>fire</strong><br />
laboratory.<br />
RESEARCH SUMMARY<br />
The <strong>fire</strong> <strong>characteristics</strong> chart is proposed as a<br />
graphical method of presenting two primary character-<br />
istics of <strong>fire</strong> <strong>behavior</strong>: spread rate and intensity. Its<br />
primary use is communicating and <strong>interpreting</strong> either site-<br />
specific predictions of <strong>fire</strong> <strong>behavior</strong> or National Fire-<br />
Danger Rating System (NF3RS) indexes and components.<br />
Rate of spread, heat per unit area, flame length, and<br />
<strong>fire</strong>line intensity are plotted on a <strong>fire</strong> <strong>behavior</strong> chart.<br />
Spread component, energy release component, and<br />
burning index are plotted on an NFDRS chart.<br />
Specific examples illustrate use of a <strong>fire</strong> <strong>characteristics</strong><br />
chart in conjunction with <strong>fire</strong> prescriptions, <strong>fire</strong> <strong>behavior</strong><br />
<strong>for</strong>ecasts, <strong>fire</strong> .management plans, and briefings.<br />
The equations used in creating the charts are given;<br />
and a method of obtaining heat per unit area from <strong>fire</strong><br />
<strong>behavior</strong> nomograms is illustrated.<br />
The use of trade, firm, or corporation names in this publication is <strong>for</strong> the<br />
in<strong>for</strong>mation and convenience of the reader. Such use does not constitute an<br />
official endorsement or approval by the U.S. Department of Agriculture of any<br />
product or service to the exclusion of others which may be suitable.<br />
Approved <strong>for</strong> publication by Intermountain Station<br />
September 1981
United States<br />
Department of<br />
Agricullure <strong>Charts</strong><br />
Forest Serv~ce<br />
Intermountain<br />
Forest and Range<br />
Experiment Station<br />
Ogden, UT 84401<br />
General Techn~cal<br />
Report INT-131<br />
September 1982 Characteristics<br />
<strong>for</strong><br />
Interpreting Wildland<br />
Fire Behavior<br />
Patricia L. Andrews<br />
and Richard C. Rothermel<br />
FIRE CHARACTERISTICS CHARTS<br />
A <strong>fire</strong> <strong>characteristics</strong> chart is a graph that illustraies<br />
the two primary <strong>characteristics</strong> of <strong>fire</strong> <strong>behavior</strong>-spread<br />
rate and intensity. Overall <strong>fire</strong> severity, as well as the<br />
character of the <strong>fire</strong>, can be inferred from the location<br />
of a point representing the <strong>fire</strong> on the chart. The chart<br />
is mainly useful as a communication aid. The <strong>fire</strong> char-<br />
acteristics chart can be used <strong>for</strong> site-specific predictions<br />
of <strong>fire</strong> <strong>behavior</strong> (fig. 1) or <strong>for</strong> National Fire-Danger Rat-<br />
ing System (NFDRS) indexes and components (fig 2).<br />
There is a pressing need <strong>for</strong> analysis of <strong>fire</strong> <strong>behavior</strong><br />
and a clear understanding of the analysis at all levels of<br />
management. Fire policy on National Forests has<br />
shifted emphasis from <strong>fire</strong> control to <strong>fire</strong> management.<br />
In addition to traditional <strong>fire</strong> control and use activitles,<br />
a successful <strong>fire</strong> manager must also evaluate altcrnative<br />
<strong>fire</strong> management strategies in relation to land and<br />
resource management objectives. A vital part of this<br />
process is communication with other resource special-<br />
ists who may not be familiar with the National Fire-<br />
Danger Rating System or methods <strong>for</strong> predicting slte-<br />
specific <strong>fire</strong> <strong>behavior</strong>. Quantitative descriptors of <strong>fire</strong><br />
<strong>behavior</strong> are becoming more widely used due to the<br />
prevalence of automated systems (Rothermel 1980).<br />
The hand-held TI-59 calculator with a Fire DangeriFire<br />
Behavior Custom Read Only Memory (CROM) is an<br />
examplc of techllology that is reaching every level of<br />
lire manager- from dispatchers to regional planners<br />
(Burgan 1980). Fire <strong>characteristics</strong> charts allow graphic<br />
presentation of quantitative <strong>fire</strong> <strong>behavior</strong> in<strong>for</strong>mation in<br />
a <strong>for</strong>m that is readily understood.<br />
0<br />
Fire Characteristics Chart<br />
HEAT PER UNIT AREA, BTUl FT2<br />
Figure I.-Fire <strong>behavior</strong> <strong>fire</strong> <strong>characteristics</strong><br />
chart.
Fire Characteristics Chart<br />
ENERGY RELEASE COMPONENT, ERC<br />
F~gure 2.-Natronal F~re-Danger Rating<br />
System (NFDRS) frre characterrstrcs chart.<br />
FIRE BEHAVIOR CHARTS<br />
The values that are plotted on the <strong>fire</strong> <strong>behavior</strong> charts<br />
are based on a mathematical model <strong>for</strong> predicting <strong>fire</strong><br />
spread in <strong>wildland</strong> fuels (Rothermel 1972). Calculations<br />
are made using nomograms (Albini 1976a), computer<br />
(Albini 1976b), or calculator (Burgan 1979). The model<br />
estimates actual <strong>fire</strong> <strong>behavior</strong> from specific descriptions<br />
of fuel type, fuel moisture, topography, and wind. The<br />
four descriptors of <strong>fire</strong> <strong>behavior</strong> that are plotted as a<br />
single point on the chart are:<br />
1. Rate of spread (chainslhour), the <strong>for</strong>ward rate of<br />
spread at the head of a surface <strong>fire</strong>.<br />
2. Heat per unit area (~tulft~), a measure of the<br />
amount of heat that is released by a square foot of fuel<br />
while the flaming zone of the <strong>fire</strong> is in that area.<br />
(Procedures <strong>for</strong> obtaining this value from nomograms<br />
and the equation <strong>for</strong> modifying existing computer programs<br />
are given in appendix A.)<br />
3. Flame length (feet), the length of the flame at the<br />
head of the <strong>fire</strong> measured from the middle of the combustion<br />
zone to the average position of the flame tip.<br />
Flame length is determined by the rate of spread and<br />
the heat per unit area of the <strong>fire</strong>.<br />
4. Fireline intensity (Btulftls], the amount of heat<br />
released per second by a foot-wide slice of the flaming<br />
combustion zone (Byram 1959). This value has been<br />
directly related to flame length, an observable char-<br />
acteristic of <strong>fire</strong> <strong>behavior</strong>. Fireline intensity is indicative<br />
of the heat that would be experienced by a person<br />
working near the <strong>fire</strong>.<br />
Flame length and <strong>fire</strong>line intensity can be interpreted<br />
in terms of suppression capabilities as shown in table 1.<br />
The curved lines on the <strong>fire</strong> <strong>behavior</strong> chart define the<br />
areas of interpretations shown in table 1. The inter-<br />
pretations range from <strong>fire</strong>s being easily controlled by<br />
hand crews, to <strong>fire</strong> o ich equipment can be effec-<br />
tive, lo <strong>fire</strong>s on whlcl ,trol ef<strong>for</strong>t at the head will be<br />
ineffective.<br />
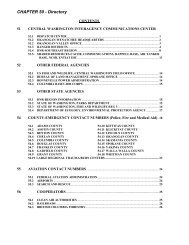
As an illustration of how the <strong>fire</strong> <strong>behavior</strong> chart<br />
works, the <strong>fire</strong> <strong>behavior</strong> prediction values listed in table<br />
2 are plotted in figure 3. These predictions are <strong>for</strong> <strong>fire</strong>s<br />
in three fuel types burning under the same wind, slope,<br />
and fuel moisture conditions. The fuel types were<br />
chosen from the 13 stylized <strong>fire</strong> <strong>behavior</strong> fuel models<br />
(Anderson 1982). Fuel model 1 represents continuous<br />
stands of arid western grass: fuel model 10, litter and<br />
understory of a timber stand with heavy accumi~lations<br />
of deadfall; and fuel model 8, short-needle litter.<br />
The differences among the <strong>characteristics</strong> of the <strong>fire</strong>s<br />
in these three fuel types are readily apparent from their<br />
r-<br />
.t\f ' b<br />
FIRE BEHAVIOR<br />
Fire Characteristics Chart<br />
HEAT PER UNIT AREA. BTUI Fr2<br />
Figure 3.-Fire <strong>behavior</strong> predictions from<br />
table 2 plotted on a <strong>fire</strong> <strong>behavior</strong> chart.
Table 1.-Fire suppression interpretations of flame length and <strong>fire</strong>line intensity<br />
Flame length Fireline internsity Interpretation<br />
Feet<br />
< 4<br />
B tulf tls<br />
< 100 Fire can generally be attacked at the head or flanks by persons using handtools.<br />
Handline should hold the lire.<br />
4-8 100-500 Fires are too intense <strong>for</strong> direct attack on the head by persons using handtools.<br />
Handline cannot be relied on to hold <strong>fire</strong>.<br />
Equipment such as plows, dozers, pumpers, and retardant aircraft can be effective.<br />
500 - 1,000 Fires may present serious control problems-torching out, crowning, and spotting.<br />
Control ef<strong>for</strong>ts at the <strong>fire</strong> head will probably be ineffective.<br />
' 11 > 1,000 Crowning, spotting, and major <strong>fire</strong> run's are probable.<br />
Control ef<strong>for</strong>ts at head of <strong>fire</strong> are ineffective.<br />
Table 2.-Fire <strong>behavior</strong> predictions <strong>for</strong> specific fuel, moisture, wind, and slope conditions<br />
Descriptors<br />
Fuel and environmenthl conditions:<br />
Fuel model<br />
Dead fuel moisture, percent<br />
Live fuel moisture, percent<br />
Midflame windspeed, milh<br />
Slope, percent<br />
Fire <strong>behavior</strong> predictions:<br />
Rate of spread, chainslh<br />
Heat per unit area, Btulft2<br />
Fireline intensity, Btulftls<br />
Flame length, ft<br />
placement on the chart. Notice that flame length and<br />
<strong>fire</strong>line intensity are essentially the same <strong>for</strong> <strong>fire</strong>s A and<br />
B. Fire A is very fasi spreading and has a low heat per<br />
unit area. On the other hand, <strong>fire</strong> B is slow spreading,<br />
but has a high heat per unit area. Both <strong>fire</strong>s A and B<br />
are predicted to be too intense <strong>for</strong> direct attack at the<br />
head by persons using handtools (table l), but this<br />
degree of severity is caused by <strong>fire</strong>s of very different<br />
character.<br />
Fire C occurs under the same wind, slope, and fuel<br />
moisture conditions as <strong>fire</strong>s A and B. But the handline<br />
should easily hold <strong>fire</strong> C, whereas plows, dozers.<br />
pumpers, or retardant would probably be required on<br />
<strong>fire</strong>s A and B. Notice that the character of these three<br />
<strong>fire</strong>s can be determined by a glance at the chart. The<br />
same in<strong>for</strong>mation is on table 2, but is not as easily<br />
interpreted.<br />
In general, <strong>fire</strong>s with a high rate of spread and low<br />
heat per unit area are plotted near the upper end of the<br />
vertical axis, whereas <strong>fire</strong>s with low rates of spread and<br />
high heat per unit area fall to the right, near the horizontal<br />
axis. Fires with both high spread rate and high<br />
values of heat per unit area will lie in the center of the<br />
graph far from the origin. The overall severity of the<br />
<strong>fire</strong> is shown by increasing flame length and <strong>fire</strong>line<br />
intensity curves.<br />
Fire<br />
Although a point on the chart represents the charac-<br />
teristics of a <strong>fire</strong>, a circle around the point would more<br />
appropriately indicate the probable range of <strong>fire</strong><br />
<strong>behavior</strong>. The numbers used to characterize <strong>fire</strong><br />
<strong>behavior</strong> are a best estimate based on a mathematical<br />
model, and are subject to the assumptions and limita-<br />
tions of that model as described by Rothermel (1972)<br />
and Albini (1976a). In addition, <strong>fire</strong> is inherently vari-<br />
able and cannot be uniquely described over an area.<br />
The circle around a point becomes larger with more<br />
nonuni<strong>for</strong>m fuels, more variable wind, and increasing<br />
<strong>fire</strong> severity. There are no simple techniques <strong>for</strong> esti-<br />
mating the range of <strong>fire</strong> <strong>behavior</strong> <strong>characteristics</strong> caused<br />
by nonuni<strong>for</strong>mities at this time.<br />
Because several <strong>fire</strong> <strong>behavior</strong> <strong>characteristics</strong> are<br />
plotted as a single point and because it is easier to<br />
interpret illustrations than arrays of numbers, the <strong>fire</strong><br />
<strong>behavior</strong> chart lends itself to many applications. The<br />
chart can be used to illustrate the <strong>fire</strong> management<br />
activities and associated <strong>fire</strong> <strong>characteristics</strong> listed below:<br />
Project <strong>fire</strong>s<br />
Expected <strong>fire</strong> <strong>behavior</strong> given as written narrative<br />
in the <strong>fire</strong> <strong>behavior</strong> <strong>for</strong>ecast.<br />
Expected change in <strong>fire</strong> <strong>behavior</strong> that may accompany<br />
a <strong>for</strong>ecasted weather change.<br />
@ Level of <strong>fire</strong> <strong>behavior</strong> considered in an escaped<br />
I
<strong>fire</strong> analysis.<br />
Expected change in <strong>fire</strong> <strong>behavior</strong> with a change<br />
in fuel type.<br />
Prescribed<strong>fire</strong><br />
Fire <strong>characteristics</strong> required to achieve specific<br />
burn objectives.<br />
Fire <strong>behavior</strong> expected under a range of weather<br />
conditions.<br />
Behavior of an escaped <strong>fire</strong>.<br />
Conditions that will require using ignition<br />
patterns to draw the <strong>fire</strong> and produce the desired<br />
intensity.<br />
Behavior of strip <strong>fire</strong>s-bracketed by plotting the<br />
<strong>behavior</strong> of a backing <strong>fire</strong> and a free-burning<br />
head <strong>fire</strong>.<br />
Long-range planning<br />
Variation of <strong>fire</strong> <strong>behavior</strong> between planning units<br />
under the same weather conditions.<br />
Effect of a change in fuel type on <strong>fire</strong> <strong>behavior</strong>.<br />
Application of Fire Behavior <strong>Charts</strong><br />
EXAMPLE: FIRE PRESCRIPTIONS<br />
Successful prescribed burning requires planning.<br />
Fischer (1978) propbses a four-point <strong>fire</strong> use plan and<br />
report: treatment area and objectives, <strong>fire</strong> prescription,<br />
Part 2 - Fire Prescription<br />
2.1 Treatment Specifications<br />
2.11 Desired Accomplishment<br />
- Kiii shrubs and trees C5" D.B.H. without kiillng the<br />
overstory of western larch.<br />
- Expose mineral soils over 60% of the area<br />
- Reduce duff by 86%.<br />
2.12 Desired Fire Behavior<br />
- The fiame iength must be iess than 4 feet to ensure that<br />
less than 60% of the crowns will be scorched, there<strong>for</strong>e<br />
aliowlng the larch to survive.<br />
- Due to dlscontinulty of fuels, a head flre wlth a flame<br />
length of at least 2 feet IS required to achleve a unl<strong>for</strong>m<br />
burn pattern<br />
- The fiame iength should be iess than 4 feet to reduce the<br />
risk of torching and spot <strong>fire</strong>s. The burn area is within<br />
a mile of some 2.year old logging siash. if a spot fre<br />
occurs in the siash, it wiii require pumpers and possibiy<br />
retaidant <strong>for</strong> control.<br />
- Under the burning conditions that are required to meet<br />
desired duff reduction objectives, a free-burning, <strong>for</strong>ward.<br />
spreadng <strong>fire</strong> would make torching. crowning, and spottirig<br />
probable. Strip head<strong>fire</strong>s will be used to keep the <strong>fire</strong><br />
<strong>behavior</strong> wthin the required range.<br />
2.13 Required Environmental Conditions<br />
Relative Humidity - 20.30%<br />
Temperature - 70-80 F<br />
Windspeed (midflame) - N-NW - 3-7<br />
1.H Fuel Moisture - 10.14%<br />
10.H Fuel Moisture - 12.14%<br />
Live Fuel Moisture - 75.125%<br />
Duff Moisture - 50%<br />
Figure 4.-The <strong>fire</strong> prescription part of a <strong>fire</strong><br />
use plan and report.<br />
burning plan, and report. The <strong>fire</strong> prescription portion<br />
includes a section on <strong>fire</strong> <strong>behavior</strong> and associated en-<br />
vironmental conditions desired to meet burn objectives.<br />
Increasingly specific <strong>fire</strong> management objectives have<br />
created a need <strong>for</strong> more quantitative descriptions of <strong>fire</strong><br />
<strong>behavior</strong>. Rate of spread described as fast or slow, or<br />
<strong>fire</strong> intensity as hot or cool, is often not adequate. The<br />
four values plotted on the <strong>fire</strong> cliaracteristics chart<br />
describe aspects of <strong>fire</strong> <strong>behavior</strong> that are important in<br />
both <strong>fire</strong> control and <strong>fire</strong> effects considerations. Flame<br />
length and <strong>fire</strong>line intensity are directly related Lo the<br />
effectiveness of control <strong>for</strong>ces. Many prescribed burns<br />
are conducted under conditions that produce flame<br />
lengths less than 3 feet. Rothermel and Deeming (1980)<br />
have suggested that <strong>fire</strong>line intensity be correlated to<br />
<strong>fire</strong> effects in the flames or in the convection column,<br />
and heat per unit area be correlated to <strong>fire</strong> effects near<br />
the base of the <strong>fire</strong> in the duff and litter. Fire <strong>behavior</strong><br />
can be quantified on a <strong>fire</strong> characteristic chart without<br />
dwelling on tables and numbers. An example of a sec-<br />
tion of a <strong>fire</strong> use plan and report and the associated <strong>fire</strong><br />
<strong>behavior</strong> chart are shown in figures 4 and 5.<br />
300<br />
250<br />
200<br />
-<br />
-.<br />
-<br />
FIRE BEHAVIOR<br />
Fire Characteristics Chart<br />
4 s Fee - bumin he~dGre<br />
4<br />
B : Backin Cire<br />
9<br />
c: Desired &.;-re<br />
0 500 1000 1500 2000<br />
HEAT PER UNIT AREA, BTUI d2<br />
Figure 5.-Use of a <strong>fire</strong> <strong>characteristics</strong> chart<br />
to illustrate the desired <strong>fire</strong> <strong>behavior</strong> portion<br />
of the prescription given in figure 4.<br />
<strong>behavior</strong>
EXAMPLE: FIRE BEHAVIOR FORECAST<br />
A <strong>fire</strong> <strong>behavior</strong> officer (FBO) is normally part of an<br />
overhead team on a project <strong>fire</strong>. His duties include<br />
identifying critical <strong>fire</strong> <strong>behavior</strong> conditions and project-<br />
ing <strong>fire</strong> size. He prepares a <strong>fire</strong> <strong>behavior</strong> <strong>for</strong>ecast which<br />
includes a written narrative describing potential <strong>fire</strong><br />
<strong>behavior</strong>. This is done <strong>for</strong> briefing the <strong>fire</strong> overhead<br />
team and is revised whenever conditions warrant a new<br />
appraisal of <strong>fire</strong> <strong>behavior</strong>. One of the tools the FBO uses<br />
in his job is the <strong>fire</strong> <strong>behavior</strong> model in the <strong>for</strong>m of<br />
FlRE BEHAVIOR FORECAST NO.<br />
nomograms or the TI-59 calculator. The numerical out-<br />
put from the model must be interpreted by the FBO<br />
be<strong>for</strong>e it is communicated. In addition to the narrative<br />
<strong>fire</strong> <strong>behavior</strong> <strong>for</strong>ecast and a map indicating expected<br />
<strong>fire</strong> growth, a <strong>fire</strong> <strong>characteristics</strong> chart can be used in<br />
the oral briefing to illustrate potential <strong>fire</strong> <strong>behavior</strong> <strong>for</strong><br />
different sectors of the <strong>fire</strong>. A <strong>fire</strong> <strong>behavior</strong> <strong>for</strong>ecast and<br />
the associated <strong>fire</strong> <strong>characteristics</strong> chart are shown in<br />
figures 6 and 7.<br />
NAME OF FIRE: PREDICTION FOR: Day SHIFT<br />
FOREST: SHIFT DATE:<br />
TIME AND DATE<br />
FORECAST ISSUED: 0900 SIGNED:<br />
WEATHER SUMMARY RED FLAG ALERT SEE ATTACHED SPOT FORECAST<br />
FlRE BEHAVIOR OFFICER<br />
Note Terrain channeling of the general wind up the river will produce up-canyon winds of 5 to 10 milh<br />
along the lower slopes and 10 to 15 milh along upper slopes by early afternoon.<br />
FlRE BEHAVIOR<br />
GENERAL: Fire will be relatively inactive until the inversion breaks, about 1200. Fire activity will<br />
increase sharply at that time with <strong>fire</strong> spread mainly up-canyon to the southwest. Some torching<br />
will occur where fuel concentrations exist with short range spotting possible.<br />
SPECIFIC:<br />
SECTOR A. Fire spread will be relatively low on this sector (3 chains per hour), but rolling <strong>fire</strong>-<br />
brands will be a problem, especially in the small draws to the south. Roll into unburned fuels will result in<br />
upslope runs with some torching and short range spotting.<br />
SECTOR B. This will be a hot sector on the <strong>fire</strong> today. Direct attack with hand crews will be<br />
marginal until 1100 and impossible after the inversion breaks. Roll and spotting will cause short runs to the<br />
ridge, especially in the small draws to the south.<br />
SECTOR C. The <strong>fire</strong> will back slowly down canyon against the wind. Rolling material may cause<br />
some problems, but this will be the coolest sector on the <strong>fire</strong>. Conditions will be good <strong>for</strong> direct attack to<br />
succeed.<br />
AIR OPERATIONS: Strong inversion will limit air operations until about noon. Any thunderstornls that<br />
occur later in the day will produce turbulent flying conditions.<br />
SAFETY: Crews should be alert to the danger of roll igniting fuels below them on steep slopes.<br />
If thunderstorms enter the <strong>fire</strong> area, be alert <strong>for</strong> the possibility of erratic <strong>fire</strong> <strong>behavior</strong> from down-<br />
draft winds. A weather watch has been established to give warning of approaching thunderstorms.<br />
Figure 6.-F~re <strong>behavior</strong> <strong>for</strong>ecast.
HEAT PER UNIT AREA, BTUI FT2<br />
Figure 7.-Use of a <strong>fire</strong> <strong>characteristics</strong> chart<br />
to illustrate the <strong>fire</strong> <strong>behavior</strong> glven in the f~re<br />
<strong>behavior</strong> <strong>for</strong>ecast in figure 6.<br />
NATIONAL FIRE-DANGER RATING<br />
SYSTEM CHARTS<br />
The National Fire-Danger Rating System [NFDRS)<br />
(Deeming and others 1977) is used throughout the<br />
country <strong>for</strong> <strong>fire</strong> management planning. Most users<br />
obtain daily ratings using a centralized computer<br />
(Helfman and others 1980): some use nomograms<br />
(Burgan and others 1977), or the TI-59 calculator with<br />
a <strong>fire</strong> dangeri<strong>fire</strong> <strong>behavior</strong> CROM (Burgan 1979).<br />
Management guidelines are often based on indexes<br />
obtained by processing historical weather records<br />
through standard computer programs (Main and others<br />
in press: Bradshaw and Fischer 1981a, 1981b).<br />
The NFDRS is comprised of many components and<br />
indexes related to <strong>fire</strong> occurrence, <strong>fire</strong> <strong>behavior</strong>, and <strong>fire</strong><br />
suppression. The following items can be plotted on a<br />
<strong>fire</strong> <strong>characteristics</strong> chart similar to the one used <strong>for</strong> site-<br />
specific <strong>fire</strong> <strong>behavior</strong> estimation:<br />
1. Spread component (SC)-related to rate of <strong>fire</strong><br />
spread.<br />
2. Energy release component (ERC)-related to<br />
energy or heat that will be released in a passing <strong>fire</strong><br />
front.<br />
3. Burning index (B1)-related to the magnitude of<br />
the <strong>fire</strong> containment problem. The burning index is<br />
derived from the spread component and the energy<br />
release component.<br />
The three values are related to the corresponding<br />
values on the <strong>fire</strong> <strong>behavior</strong>-<strong>fire</strong> characterisiics chart.<br />
Procedures used to calculate spread component, energy<br />
release component, and burning index were in fact<br />
derived from the equations <strong>for</strong> rate of spread, heat per<br />
unit area, and flame length. NFDRS indexes and com-<br />
ponents are designed to give broad area rating of <strong>fire</strong><br />
potential and are not meant to predict actual site-<br />
specific <strong>fire</strong> <strong>behavior</strong>. The indexes are based on fuel<br />
models that describe large areas and on weather taken<br />
at a specific location once per day.<br />
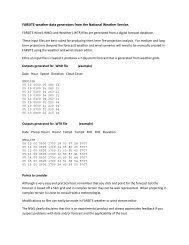
Because NFDRS components and indexes are relative<br />
indicators of <strong>fire</strong> danger, a value is meaningful only<br />
when it is compared with other values. Seasonal plots<br />
illustrated in figure 8 help one make such comparisons.<br />
An index value can be readily related to previous<br />
values in the season or, if plots are overlaid, to those<br />
from other seasons. As can be seen in figure 8, ERC<br />
had climbed to the highest point thus far that season<br />
by August 3, and did not change on August 4. How-<br />
ever, SC <strong>for</strong> August 4 was four times as high as that on<br />
August 3, and BI nearly doubled from August 3 to<br />
August 4. Notice also that on October 3, BI was<br />
approximately the same as it had been on August 3,<br />
but SC was much higher and ERC much lower.<br />
The <strong>fire</strong> <strong>characteristics</strong> chart offers another means of<br />
<strong>interpreting</strong> SC, ERC, and BI in terms of potential <strong>fire</strong><br />
<strong>behavior</strong>. The values <strong>for</strong> August 3, August 4, and<br />
October 3 are plotted on the NFDRS chart in figure 9.<br />
The curved lines on the <strong>fire</strong> <strong>characteristics</strong> chart cor-<br />
respond to the horizonal lines on the seasonal plot of<br />
burning index. Notice how the character of <strong>fire</strong> danger<br />
on all 3 days is readily apparent.<br />
The seasonal plots and the <strong>fire</strong> <strong>characteristics</strong> chart<br />
illustrate different aspects of SC, ERC, and BI. A<br />
seasonal plot reflects the change of conditions in a<br />
component or index over time, whereas the NFDRS<br />
chart is best suited <strong>for</strong> illustrating the relationship<br />
among all three values at a particular time.<br />
NFDRS calculations are normally done on a day-to-<br />
day basis using standard weather observations as<br />
input. The TI-59 calculator with a <strong>fire</strong> dangerl<strong>fire</strong><br />
b;havior CROM allows another option: fuel moisture<br />
can be entered directly in lieu of weather input. This<br />
allows the user to look at situations that are not based<br />
on the seasonal trend. For example, "under the same<br />
conditions, how does the <strong>fire</strong> danger change with a<br />
change of fuel models?" or "what would the <strong>fire</strong> danger<br />
be if the moisture content of the large fuels were 3<br />
percent less?" The NFDRS chart is an ideal way of<br />
illustrating the change in <strong>fire</strong> danger due to a specific<br />
change in conditions.
ERC<br />
MAY JUNE JULY AUG. SEPT. OCT.<br />
Figure 8.-Seasonal plots of spread component (SC),<br />
energy release component (ERC), and burnrng index (BI).
NATIONAL FIRE DANGER<br />
RATING SYSTEM<br />
Fire Characteristics Chart<br />
ENERGY RELEASE COMPONENT, ERC<br />
F~gure 9 -SC, ERC, and BI <strong>for</strong> August 3,<br />
August 4, and October 3 from the seasonal<br />
plots In f~gure 8 plotted on an NFDRS chart.<br />
A review of each index and the relationship between<br />
them will clarify the use of the NFDRS chart. Spread<br />
component is related to the rate of <strong>fire</strong> spread and is<br />
strongly affected by windspeed; SC can there<strong>for</strong>e have<br />
wide daily fluctuations. On the other hand. windspeed<br />
has no effect on energy release component. ERC is<br />
related to the energy released in the flaming zone and<br />
mainly reflects changes in fuel moisture. Because ERC<br />
is not affected by wind, it shows a more definite<br />
seasonal trend than either SC or BI. Burning index is<br />
derived from the spread and energy release components<br />
and has the same underlying trend as ERC with the<br />
daily fluctuations of SC imposed on it. Depending on<br />
the type of management decisions to be made, SC,<br />
ERC, BI, or a combination of these values can be used.<br />
Application of NFDRS <strong>Charts</strong><br />
EXAMPLE: FIRE MANAGEMENT PLANS<br />
USDA Forest Service <strong>fire</strong> management policy cur-<br />
rently recognizes two categories of <strong>fire</strong>s on its lands:<br />
wild<strong>fire</strong>s and prescribed <strong>fire</strong>s. Every wild<strong>fire</strong> requires an<br />
appropriate suppression response. Every prescribed <strong>fire</strong><br />
is to be conducted in compliance with an approved<br />
plan. Unplanned ignitions can be allowed to burn as<br />
prescribed <strong>fire</strong>s as long as they meet criteria established<br />
in approved <strong>fire</strong> prescriptions.<br />
The Troy Ranger District in northwestern Montana<br />
prepared a <strong>fire</strong> management plan that covered the<br />
entire district. The plan was approved in early 1979,<br />
and several unplanned ignitions were used as pre-<br />
scribed <strong>fire</strong>s that summer. A <strong>fire</strong> management prescrip-<br />
tion covers each of five <strong>fire</strong> management categories.<br />
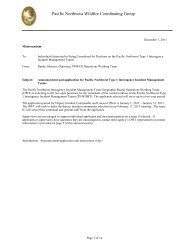
Figure 10 is a flowchart <strong>for</strong> managing <strong>fire</strong>s on big-game<br />
spring and winter ranges on operational <strong>fire</strong> manage-<br />
ment areas. Among the conditions that must be satis-<br />
fied <strong>for</strong> a <strong>fire</strong> to be allowed to burn in these areas are<br />
limits on burning index and energy release component.<br />
The shaded area of the NFDRS chart: in figure 11 illus-<br />
trates these limits. If the plotted points from the last 4<br />
days fall to the left of the vertical line where ERC = 30,<br />
and if the current day's point and the point <strong>for</strong>ecasted<br />
<strong>for</strong> the next day fall in the smaller area limited by BI =<br />
28. then the portion of the <strong>fire</strong> prescription based on<br />
the National Fire-Danger Rating System is satisfied.<br />
As the <strong>fire</strong> season progresses, current in<strong>for</strong>mation on<br />
weather, <strong>fire</strong> danger, <strong>fire</strong> activity, and prescription cri-<br />
teria must be readily available, as illustrated in figure<br />
12. The NFDRS chart is a visual aid that clearly illus-<br />
trates the limits determined from the National Fire-<br />
Danger Rating System.<br />
-<br />
Fire Start<br />
I + Yes -, Lifei property endangered ? Suppress<br />
4<br />
Smoke management conditions favorable ? Suppress<br />
I Yes<br />
I<br />
+<br />
Suppress<br />
Yes<br />
Fire weather,acceptable ? Nob<br />
Suppress<br />
1 Yes<br />
Fire <strong>behavior</strong> acceptable ? Nob<br />
Suppress<br />
I Yes + NO<br />
Forecasted <strong>fire</strong> weather and <strong>behavior</strong> acceptable ? .-p Suppress<br />
I Yes + NO<br />
1 Equipment and manpower a,vailabe if needed ? -p Suppress<br />
No , Suppress<br />
No , Suppress<br />
/ Yes<br />
Boundary threatened ? Yes+ Suppress<br />
(limited<br />
or total)<br />
1<br />
Allow to burn,<br />
Continue to evaluate<br />
I<br />
+<br />
Management objective satisfied ?<br />
I<br />
Contain and a$\hl to burn out<br />
Figure 10.-Example flow chart <strong>for</strong><br />
managing <strong>fire</strong>s on big-game spring and<br />
winter ranges on operational <strong>fire</strong><br />
management areas.
0 20 40 60 80 100 120 140<br />
ENERGY RELEASE COMPONENT, ERC<br />
F~gure 11 -NFDRS chart used to illustrate<br />
the llm~ts on BI and ERC glven In the flow<br />
chart In flgure 10 For the port~on of thls flre<br />
prescr~pt~on that IS based on NFDRS<br />
Indexes to be satsfled, plotted polnts from<br />
the last 4 days must fall to the left of the<br />
vertlcal llne where ERC = 30 and the<br />
current day's polnt and the polnt <strong>for</strong>ecasted<br />
<strong>for</strong> the next day must fall In the smaller area<br />
llmlted by the BI = 28 Ilne.<br />
Figure 12.-The <strong>fire</strong> <strong>characteristics</strong> chart<br />
can be part of a display that includes<br />
current in<strong>for</strong>mation on weather, <strong>fire</strong> danger,<br />
<strong>fire</strong> activity, and prescription criteria that a<br />
<strong>fire</strong> manager uses to make decisions.<br />
EXAMPLE: BRIEFINGS<br />
During the <strong>fire</strong> season, briefings are often held to<br />
describe the general <strong>fire</strong> situation. The audience can<br />
include members of the news media, staff personnel, or<br />
others who are not familiar with the National Fire-<br />
Danger Rating System. Statements such as "the <strong>fire</strong><br />
danger is high" or "the burning index is 85" can be<br />
misinterpreted. The NFDRS chart can serve as a yisual<br />
aid and focal point <strong>for</strong> discussion. The chart can be<br />
explained easily: as a point falls farther to the right on<br />
the chart, there is an indication that <strong>fire</strong>s will be hotter.<br />
A point falling farther up on the chart indicates the<br />
potential <strong>for</strong> faster spreading <strong>fire</strong>s. Overall severity<br />
increases as a point falls farther from the origin in<br />
either direction.<br />
Consider the following briefing of <strong>fire</strong> danger of a<br />
USDA Forest Service region, represented by the <strong>fire</strong><br />
<strong>characteristics</strong> chart in figure 13.<br />
The <strong>fire</strong> danger of most of the west side of the<br />
region is low as indicated by point A, although<br />
there are a couple of districts that may cause prob-<br />
lems [point B). Point C refers to the <strong>fire</strong> danger on<br />
the east side of the region. If we have another week<br />
of dry weather, the situation on the east side could<br />
become critical (point D).<br />
RATING SYSTEM<br />
Fire Characteristics Chart<br />
ENERGY RELEASE COMPONENT, ERC<br />
Figure 13.-NFDRS chart used in a briefing<br />
of current and potential <strong>fire</strong> danger.
FORMS OF THE CHART<br />
The <strong>fire</strong> <strong>behavior</strong> chart and the NFDRS chart illus-<br />
trated in figures 1 and 2 have scales that do not cover<br />
the entire range of possible values. The scales were<br />
chosen to give resolution to the lower values and allow<br />
the majority of values to be plotted on the chart. Never-<br />
theless, some points will fall beyond the limits of the<br />
graph. A <strong>for</strong>m of the <strong>fire</strong> <strong>behavior</strong> chart that overcomes<br />
this limitation uses logarithmic scales on the axes. In<br />
this way the entire range of values can be covered. The<br />
curved flame length lines become straight lines on the<br />
log scale version of the chart.<br />
Figure 14 shows six points plotted on both linear and<br />
logarithmic scale <strong>fire</strong> <strong>behavior</strong> charts. This illustrates<br />
that a relatively small change in the <strong>behavior</strong> of a low-<br />
intensity <strong>fire</strong> is amplified, and a large change in the<br />
<strong>behavior</strong> of a high-intensity <strong>fire</strong> is compressed on the<br />
logarithmic chart. Because a primary purpose of the <strong>fire</strong><br />
<strong>characteristics</strong> chart is to visually illustrate changes in<br />
<strong>fire</strong> <strong>behavior</strong>, care should be taken in interpretation of<br />
relative location or points plotted on the logarithmic<br />
chart.<br />
Figure 14.-The same six points (A, B, C. X, Y. Z) plotted <strong>for</strong> comparison on both a linear<br />
scale (A) and a logarithmic scale (B) <strong>fire</strong> <strong>behavior</strong> chart.<br />
11 may be necessary to change the scales of a chart<br />
primarily used <strong>for</strong> a specific fuel type. For example, a<br />
chart primarily used to display <strong>fire</strong> <strong>behavior</strong> predictions<br />
in logging slasli should have an expanded heat-per-unit-<br />
area axis and a truncated rate-of-spread axis. Such a<br />
chart is shown in appendix B, along with other full-size<br />
charts suitable <strong>for</strong> reproduction. Appendix A offers the<br />
equations used in creating the <strong>fire</strong> <strong>characteristics</strong><br />
charts.<br />
An NFDRS chart can illustrate NFDR manning<br />
classes <strong>for</strong> a specific area. USDA Forest Service <strong>fire</strong><br />
specialists generally determine manning classes from<br />
the 90th and 97th percentile burning index values <strong>for</strong> a<br />
specific station and fuel model. The percentile values<br />
are determined from historical <strong>fire</strong> weather obser-<br />
vations and provide criteria <strong>for</strong> ranking the relative<br />
severity of the burning conditions on a given day.<br />
Appendix A includes an example showing how to<br />
design an NFDRS chart where BI lines designate<br />
manning class levels.<br />
FIRE BEHAVIOR<br />
Fire Ctiaracteristics Chart<br />
(Lcqarithmic Scale)<br />
HEAT PER UNIT AREA, BTUl FTZ 148
SUMMARY<br />
Fire <strong>characteristics</strong> charts can be used to plot either<br />
site-specific <strong>fire</strong> <strong>behavior</strong> predictions or National Fire-<br />
Danger Rating System indexes. Because several aspects<br />
of <strong>fire</strong> <strong>behavior</strong> are plotted as a single point, the chart<br />
aids a user in assessing overall <strong>fire</strong> cliaracteristics. The<br />
chart lends itself to a wide range of potential uses, the<br />
most significant being communication of quantitative<br />
values in a <strong>for</strong>m that is easily understood.<br />
PUBLICATIONS CITED<br />
Albini, Frank A. Estimating wild<strong>fire</strong> <strong>behavior</strong> and<br />
effects. Gen. Tech. Rep. INT-30. Ogden, UT: U.S.<br />
Department of Agriculture, Forest Service, Inter-<br />
mountain Forest and Range Experiment Station;<br />
1976a. 92 p.<br />
Albini, Frank A. Computer-based models of <strong>wildland</strong><br />
<strong>fire</strong> <strong>behavior</strong>: a user's manual. Ogden, UT: U.S.<br />
Department of Agriculture, Forest Service, Inter-<br />
mountain Fprest and Range Experiment Station;<br />
1976b. 68 p.<br />
Anderson, Hal E. Heat transfer and <strong>fire</strong> spread. Res.<br />
Pap. INT-69. Ogden, UT: U.S. Department of Agricul-<br />
ture, Forest Service, Intermountain Forest and Range<br />
Experiment Station; 1969. 20 p.<br />
Anderson, Hal E. Aids to determining fuel models <strong>for</strong><br />
estimating <strong>fire</strong> <strong>behavior</strong>. Gen. Tech. Rep. INT-122.<br />
Ogden, UT: U.S. Department of Agriculture, Forest<br />
Service, Intermountain Forest and Range Experiment<br />
Station; 1982. 22 p.<br />
Bradshaw, Larry S.; Fischer, William C. A computer<br />
system <strong>for</strong> scheduling <strong>fire</strong> use. Part I: the system.<br />
Gen. Tech. Rep. INT-9 1. Ogden, UT: U.S. Department<br />
of Agriculture, Forest Service, Intermountain Forest<br />
and Range Experiment Station; 1981a. 63 p.<br />
Bradshaw, Larry S.; Fischer, William C. A computer<br />
system <strong>for</strong> scheduling <strong>fire</strong> use. Part II,: computer<br />
terminal operator's manual. Gen. Tech. Rep.<br />
INT-100. Ogden, UT: U.S. Department of Agriculture,<br />
Forest Service, Intermountain Forest and Range<br />
Experiment Station; 1981b. 33 p.<br />
Burgan, Robert E.; Cohen, Jack D.; Deeming, John E.<br />
Mannually calculating <strong>fire</strong>-danger ratings- 1978<br />
National Fire-Danger Rating System. Gen. Tech. Rep<br />
INT-40. Ogden, UT: U.S. Department of Agriculture,<br />
Forest Service, Intermountain Forest and Range<br />
Experiment Station; 1977. 49 p.<br />
Burgan, Robert E. A handheld calculator-<strong>fire</strong> danger<br />
and <strong>fire</strong> <strong>behavior</strong>. In: Sixth conference on <strong>fire</strong> and<br />
<strong>for</strong>est meteorology: proceedings; 1980 April 22-24;<br />
Seattle, WA. Washington, DC: Society of American<br />
Foresters; 1980: 65-69.<br />
Burgan, Robert E. Fire dangerl<strong>fire</strong> <strong>behavior</strong> computa-<br />
tions with the Texas Instruments TI-59 calculator:<br />
user's manual. Gen. Tech. Rep. INT-61. Ogden, UT:<br />
U.S. Department of Agriculture, Forest Service, In-<br />
termountain Forest and Range Experiment Station;<br />
1979. 25 p.<br />
Byram, G. M. Combustion of <strong>for</strong>est fuels. In: Forest'<br />
<strong>fire</strong>: control and use. Edited by K. P. Davis.<br />
McGraw-Hill, New York, 1959. pp. 61-89.<br />
Deeming, John E.; Burgan, Robert E.; Cohen, Jack D.<br />
The national <strong>fire</strong>-danger rating system-1978. Gen.<br />
Tech. Rep. INT-39. Ogden, UT: U.S. Department of<br />
Agriculture, Forest Service, Intermountain Forest<br />
and Range Experiment Station; 1977. 63 p.<br />
Fischer, William C. Planning and evaluating prescrib-<br />
ed <strong>fire</strong>s-a standard procedure. Gen. Tech. Rep.<br />
INT-43. Ogden, UT: U.S. Department of Agri-<br />
culture, Forest Service, Intermountain Forest and<br />
Range Experiment Station; 1978. 19 p.<br />
Helfman, Robert S.; Straub, Robert J.: Deeming,<br />
John E. User's guide to AFFIRMS: time share<br />
computerized processing of <strong>fire</strong> danger rating. Gen.<br />
Tech. Rep. INT-82. Ogden, UT: U.S. Department of<br />
Agriculture, Forest Service, Intermountain Forest and<br />
Range Experiment Station; 1980. 150 p.<br />
Main, William A.; Straub, Robert J.; Paananen,<br />
Donna M. FIREFAMILY: <strong>fire</strong> planning with historic<br />
weather data. Gen. Tech. Rep. St. Paul, MN: U.S.<br />
Department of Agriculture, Forest Service, North<br />
Central Forest and Range Experiment Station; in<br />
press.<br />
Rothermel, Richard C. How to predict the spread and<br />
intensity of <strong>for</strong>est and range <strong>fire</strong>s. Gen. Tech. Rep.<br />
INT- . Ogden, UT: U.S. Department of Agri-<br />
culture, Intermountain Forest and Range Experi-<br />
ment Station. In preparation.<br />
Rothermel, Richard C. A mathematical model <strong>for</strong> pre-<br />
dicting <strong>fire</strong> spread in <strong>wildland</strong> fuels. Res. Pap.<br />
INT-115, Ogden, UT: U.S. Department of Agriculture,<br />
Forest Service, Intermountain Forest and Range<br />
Experiment Station; 1972. 40 p.<br />
Rothermel, Richard C. Fire <strong>behavior</strong> systems <strong>for</strong> <strong>fire</strong><br />
management. In: Sixth conference on <strong>fire</strong> and <strong>for</strong>est<br />
meteorology: proceedings; 1980 April 22-24; Seattle,<br />
WA. Washington, DC: Society of American Foresters;<br />
1980: 58-64.<br />
Rothermel, Richard C.; Deeming, John E. Measuring<br />
and <strong>interpreting</strong> <strong>fire</strong> <strong>behavior</strong> <strong>for</strong> <strong>fire</strong> effects. Gen.<br />
Tech. Rep. INT-93. Ogden, UT: U.S. Department of<br />
Agriculture, Forest Service, Intermountain Forest and<br />
Range Experiment Station; 1980. 3 p.
APPENDIX A<br />
Equations <strong>for</strong> Compiling the Fire<br />
Characteristics <strong>Charts</strong><br />
The equation used to plot the curves on the NFDRS<br />
chart is<br />
SC =<br />
0.091 x BI~."<br />
ERC<br />
where<br />
SC = spread component<br />
ERC = energy release component<br />
BI = burning index.<br />
The equation used to plot the curves on the <strong>fire</strong><br />
<strong>behavior</strong> chart<br />
where<br />
R = rate of spread, chainslh<br />
IB = <strong>fire</strong>line intensity, Btulftls<br />
HA = heat pkr unit area, ~tulft~.<br />
The relationship between <strong>fire</strong>line intensity and flame<br />
length is given by the following equation:<br />
F, = 0.45 1~0.4" (3)<br />
where<br />
FL = flame length, ft<br />
IB = <strong>fire</strong>line intensity, Btulftls.<br />
Determination of Heat Per Unit Area<br />
Heat per unit area is a direct output of the TI-59 <strong>fire</strong><br />
<strong>behavior</strong> program. However, it cannot be read directly<br />
from the nomograms, nor is it an output value from<br />
most available computer programs. Although a point<br />
can be plotted on the <strong>fire</strong> <strong>behavior</strong> chart given rate of<br />
spread and <strong>fire</strong>line intensity or flame length, it is easier<br />
if a heat per unit area value is available.<br />
To modify an existing computer program, use a<br />
re<strong>for</strong>mulation of equation (2)<br />
where<br />
HA = heat per unit area, ~ tulft~<br />
IB = <strong>fire</strong>line intensity, Btu/ft/s<br />
R = rate of spread, chainslh.<br />
The X axis of the upper right-hand graph of the<br />
nomograms as originally published by Albini (1976a) is<br />
reaction intensity (Btulft21min). The label was<br />
eliminated on subsequent revisions <strong>for</strong> <strong>fire</strong> <strong>behavior</strong><br />
officer (FBO) training. The nomograms to be published<br />
by Rothermel (in preparation) will have heat per unit<br />
area on that axis,<br />
The relationship between reaction intensity and heat<br />
per unit area is<br />
where<br />
HA = heat per unit area, Btulft2<br />
IR = reaction intensity, Btu/ft2/min<br />
= characteristic surface-area-to-volume ratio of<br />
the fuel array, ft2/ft3<br />
384 = residence time, min (Anderson 1969).<br />
m<br />
0<br />
The labels <strong>for</strong> heat per unit area can be added to the<br />
horizontal axis on the upper right-hand quadrant of the<br />
nomograms, using the scales given in figure 15. The<br />
scale is the same <strong>for</strong> both the low and high windspeed<br />
options on all versions of the nomograms. Use of the<br />
nomograms does not change, as illustrated in the<br />
example in figure 16. Heat per unit area is read where<br />
the first constructed vertical line intersects the newly<br />
labeled axis.
FUEL<br />
MODEL<br />
1<br />
HEAT PER UNIT AREA, BTU IFT2<br />
r I 1 1 I 1 I<br />
Frgure 15.-Heat-per-unrt-area scales can be transferred to the high or low w~ndspeed<br />
optrons of the frre behav~or nomograms (FBO or Albrnr 1976a). The scale <strong>for</strong> the<br />
approprrate fuel model IS transferred to the horrzontal axis of the upper r~ght-hand graph<br />
FUEL<br />
MODEL HEAT PER UNIT AREA, BTU IFT~<br />
I I 8 1 I<br />
1 I<br />
0 50 150 250
Input: Output:<br />
Fuel Model 8 Rate of spread = 1.75 chainslh<br />
Dead fuel moisture = 8% Flame length = I ft.<br />
Effective windspeed = 5 milh Fireline intensity = 5 Btulltls<br />
Heat per unit area = 175 ~fulft~<br />
8. CLOSED TIMBER LITTER -LOW WINDSPEEDS<br />
2 FLAME LENGTH. FT<br />
Figure 16.-Example of the use of a nomogram after the heat-per-unit-area label<br />
has been transferred from figure 15.
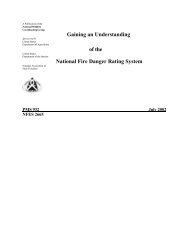
Creation of a Custom NDFRS Chart<br />
An example of a custom NFDRS chart is shown in<br />
figure 17. This chart is <strong>for</strong> the Ninemile District (Lolo<br />
National Forest), fuel model G. Manning classes are<br />
based on burning index.<br />
The steps to creation of such a chart are as follows:<br />
1. Run the FIRDAT program as described in the<br />
User's Guide to FIREFAMILY (Main and others in<br />
press) lo determine the 90th and 97th percentile<br />
values of BI and the maximum SC and ERC<br />
values.<br />
For this example, based on the 1970-79 weather<br />
data, the 90th percentile of BI is 56.38 and the<br />
97th percentile is 69.74. The maximum SC <strong>for</strong> this<br />
period was 49 and the maximum ERC was 60.<br />
2. Calculate the manning class boundary values as<br />
described in the User's Guide to AFFIRMS<br />
(Helfman and others 1980).<br />
For six manning classes in this example, the<br />
results are:<br />
Displayed Upper value<br />
manning <strong>for</strong> class<br />
class (burning index)<br />
1 l(M190)/4 = 14<br />
2 (MI90)12 = 28<br />
3- (MI90) (3/4) = 42<br />
3+ (MI90) = 56<br />
4 MI97 = 70<br />
5 More than MI97<br />
ni his notation corresponds to that used in the AFFIRMS manual<br />
MI90 = 90th percentile mann~ng index and MI97 = 97th percentile<br />
manning index.<br />
3. Draw the axes <strong>for</strong> the chart based on the<br />
maximum values <strong>for</strong> SC and ERC.<br />
In this case, the axes are extended beyond the<br />
10-year maximums to SC = 60 and ERC = 70.<br />
4. Locate the curves <strong>for</strong> each of the BI values<br />
determined in step 2 above using equation (1).<br />
Find SC <strong>for</strong> several values of ERC. The upper e ~d-<br />
points of the BI curves can most easily be located<br />
by using an alternate farm of equation (1):<br />
0.091 x ~12.l~<br />
ERC =<br />
SC<br />
To locate the BI = 56 curve in figure 17, find ERC<br />
when SC = 60 (the maximum SC <strong>for</strong> this chart):<br />
0.091 x 562.17<br />
ERC = = 9.4<br />
60<br />
Find the other endpoint of the curve by calculating<br />
SC when ERC = 70 (the maximum ERC <strong>for</strong> this<br />
chart):<br />
Sirnilarly when ERC = 40 and 20, the calculated<br />
values <strong>for</strong> SC are 14 and 28, respectively. A<br />
smooth curve is drawn through the following four<br />
points:<br />
ERC SC<br />
9 60<br />
20 28<br />
40 14<br />
70 8<br />
The curves <strong>for</strong> the other manning class divisions<br />
(BI = 14, 28, 42, and 70) are located in a similar<br />
manner.
I\ \<br />
NATIONAL FIRE DANGER<br />
RATING SYSTEM<br />
L Fire Characteristics Chart<br />
NINEMILE DISTRICT<br />
FUEL MODEL G<br />
\ Manning Class<br />
5<br />
\ 4 \ Burnina<br />
ENERGY RELEASE COMPONENT, ERC<br />
F~gure 17 -Example of a custom NFDRS chart, where the BI l~nes correspond to<br />
manning class cutoff values. Mann~ng classes are based on 1970-79 weather <strong>for</strong> Ninem~le<br />
Ranger Statlon (241507)
APPENDIX B<br />
Fire Characteristics <strong>Charts</strong><br />
Suitable <strong>for</strong> Copying
0 500 1000 1500 2000<br />
HEAT PER UNIT AREA, BTUl FT*<br />
GTR.INT-131 <strong>Charts</strong> <strong>for</strong> Interpreting Wildland Fire Behavior Characteristics<br />
18
0 500 1000 1500 2000 2500 3000 3500 4000<br />
HEAT PER UNIT AREA, BTUl F T ~
FIRE BEHAVIOR<br />
Fire Characteristics Chart<br />
(Loqarithmic Scale)<br />
HEAT PER UNIT AREA, BTUI FT2<br />
GTR-INT-131 <strong>Charts</strong> <strong>for</strong> Interpreting Wildland Fire Behavior Characteristics<br />
20
ENERGY RELEASE COMPONENT, ERC<br />
GTR-INT-131 <strong>Charts</strong> <strong>for</strong> Interpreting Wildland Fire Behavior Charactersitics<br />
21 %' US. GOVERNMENT PRINTING OFFICE: 1982-576.026119 REGION No. 8
1 KEYWORDS:<br />
Andrews, Patricia L.; Rothermel, Richard C. <strong>Charts</strong> <strong>for</strong> <strong>interpreting</strong> w~ldland <strong>fire</strong><br />
<strong>behavior</strong> <strong>characteristics</strong>. Gen. Tech. Rep. INT-131. Ogden, UT: U.S.<br />
Department of Agriculture, Forest Service, Intermountain Forest and Range<br />
Experiment Station; 1981. 21 p.<br />
The <strong>fire</strong> <strong>characteristics</strong> chart is proposed as a graphical method of<br />
presenting two primary <strong>characteristics</strong> of <strong>fire</strong> <strong>behavior</strong>-spread rate and intensity.<br />
Its primary use is communicat~ng and <strong>interpreting</strong> either site-specific predictions<br />
of <strong>fire</strong> <strong>behavior</strong> or National Fire-Danger Rating System (NFDRS) indexes and<br />
components. Rate of spread, heat per unit area, flame length, and <strong>fire</strong>line<br />
intensity, are plotted on a <strong>fire</strong> <strong>behavior</strong> chart. Spread component, energy release<br />
component, and burning index are plotted on an NFDRS chart. Specific examples<br />
illustrate potential application.<br />
<strong>fire</strong> <strong>behavior</strong>, <strong>fire</strong> spread, <strong>fire</strong> intensity, <strong>fire</strong>-danger rating, National<br />
Fire-Danger Rating System !<br />
The Intermountain Station, headquarted in Ogden,<br />
Utah, is one of eight regional experiment stations charged<br />
with prov'i,ding scientific knowledge to help resource<br />
managers meet human needs and protect <strong>for</strong>est and range<br />
ecosystems.<br />
The Intermountain Station includes the States of<br />
Montana, Idaho, Utah, Nevada, and western Wyoming.<br />
About 231 million acres, or 85 percent, of the land area in<br />
the Station territory are classified as <strong>for</strong>est and rangeland.<br />
These lands include grasslands, deserts, shrublands, alpine<br />
areas, and well-stocked <strong>for</strong>ests. They supply fiber <strong>for</strong><br />
<strong>for</strong>est industries; minerals <strong>for</strong> energy and industrial<br />
development; and water <strong>for</strong> domestic and industrial con-<br />
sumption. They also provide recreation opportunities <strong>for</strong><br />
millions of visitors each year.<br />
Fi$lcj,programs and research work units of the Station<br />
are maintained-in<br />
Boise, Idaho<br />
Bbzeman, Montana (in cooperation with<br />
Montana State University)<br />
Logan, Utah (in cooperation with Utah State<br />
University)<br />
Missoula, Montana (in cooperation with the<br />
University of Montana)<br />
Moscow, Idaho (in cooperation with the<br />
University of Idaho)<br />
Provo, Utah (in cooperation with Brigham<br />
Young University)<br />
Reno, Nevada (in cooperation with the Univer-<br />
sity of Nevada)