Charts for interpreting wildland fire behavior characteristics - NWCC
Charts for interpreting wildland fire behavior characteristics - NWCC
Charts for interpreting wildland fire behavior characteristics - NWCC

You also want an ePaper? Increase the reach of your titles
YUMPU automatically turns print PDFs into web optimized ePapers that Google loves.
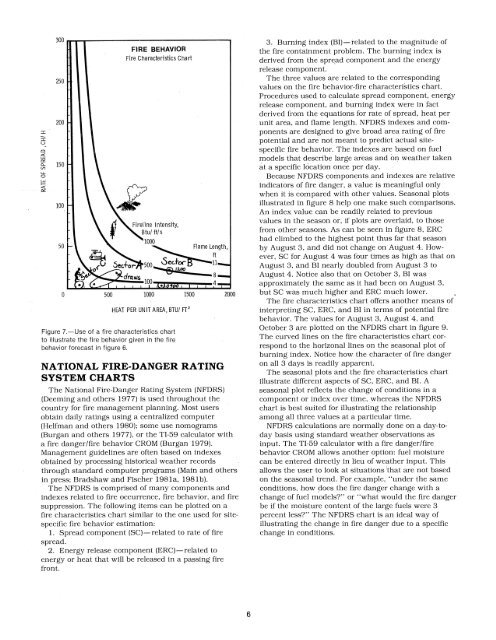
HEAT PER UNIT AREA, BTUI FT2<br />
Figure 7.-Use of a <strong>fire</strong> <strong>characteristics</strong> chart<br />
to illustrate the <strong>fire</strong> <strong>behavior</strong> glven in the f~re<br />
<strong>behavior</strong> <strong>for</strong>ecast in figure 6.<br />
NATIONAL FIRE-DANGER RATING<br />
SYSTEM CHARTS<br />
The National Fire-Danger Rating System [NFDRS)<br />
(Deeming and others 1977) is used throughout the<br />
country <strong>for</strong> <strong>fire</strong> management planning. Most users<br />
obtain daily ratings using a centralized computer<br />
(Helfman and others 1980): some use nomograms<br />
(Burgan and others 1977), or the TI-59 calculator with<br />
a <strong>fire</strong> dangeri<strong>fire</strong> <strong>behavior</strong> CROM (Burgan 1979).<br />
Management guidelines are often based on indexes<br />
obtained by processing historical weather records<br />
through standard computer programs (Main and others<br />
in press: Bradshaw and Fischer 1981a, 1981b).<br />
The NFDRS is comprised of many components and<br />
indexes related to <strong>fire</strong> occurrence, <strong>fire</strong> <strong>behavior</strong>, and <strong>fire</strong><br />
suppression. The following items can be plotted on a<br />
<strong>fire</strong> <strong>characteristics</strong> chart similar to the one used <strong>for</strong> site-<br />
specific <strong>fire</strong> <strong>behavior</strong> estimation:<br />
1. Spread component (SC)-related to rate of <strong>fire</strong><br />
spread.<br />
2. Energy release component (ERC)-related to<br />
energy or heat that will be released in a passing <strong>fire</strong><br />
front.<br />
3. Burning index (B1)-related to the magnitude of<br />
the <strong>fire</strong> containment problem. The burning index is<br />
derived from the spread component and the energy<br />
release component.<br />
The three values are related to the corresponding<br />
values on the <strong>fire</strong> <strong>behavior</strong>-<strong>fire</strong> characterisiics chart.<br />
Procedures used to calculate spread component, energy<br />
release component, and burning index were in fact<br />
derived from the equations <strong>for</strong> rate of spread, heat per<br />
unit area, and flame length. NFDRS indexes and com-<br />
ponents are designed to give broad area rating of <strong>fire</strong><br />
potential and are not meant to predict actual site-<br />
specific <strong>fire</strong> <strong>behavior</strong>. The indexes are based on fuel<br />
models that describe large areas and on weather taken<br />
at a specific location once per day.<br />
Because NFDRS components and indexes are relative<br />
indicators of <strong>fire</strong> danger, a value is meaningful only<br />
when it is compared with other values. Seasonal plots<br />
illustrated in figure 8 help one make such comparisons.<br />
An index value can be readily related to previous<br />
values in the season or, if plots are overlaid, to those<br />
from other seasons. As can be seen in figure 8, ERC<br />
had climbed to the highest point thus far that season<br />
by August 3, and did not change on August 4. How-<br />
ever, SC <strong>for</strong> August 4 was four times as high as that on<br />
August 3, and BI nearly doubled from August 3 to<br />
August 4. Notice also that on October 3, BI was<br />
approximately the same as it had been on August 3,<br />
but SC was much higher and ERC much lower.<br />
The <strong>fire</strong> <strong>characteristics</strong> chart offers another means of<br />
<strong>interpreting</strong> SC, ERC, and BI in terms of potential <strong>fire</strong><br />
<strong>behavior</strong>. The values <strong>for</strong> August 3, August 4, and<br />
October 3 are plotted on the NFDRS chart in figure 9.<br />
The curved lines on the <strong>fire</strong> <strong>characteristics</strong> chart cor-<br />
respond to the horizonal lines on the seasonal plot of<br />
burning index. Notice how the character of <strong>fire</strong> danger<br />
on all 3 days is readily apparent.<br />
The seasonal plots and the <strong>fire</strong> <strong>characteristics</strong> chart<br />
illustrate different aspects of SC, ERC, and BI. A<br />
seasonal plot reflects the change of conditions in a<br />
component or index over time, whereas the NFDRS<br />
chart is best suited <strong>for</strong> illustrating the relationship<br />
among all three values at a particular time.<br />
NFDRS calculations are normally done on a day-to-<br />
day basis using standard weather observations as<br />
input. The TI-59 calculator with a <strong>fire</strong> dangerl<strong>fire</strong><br />
b;havior CROM allows another option: fuel moisture<br />
can be entered directly in lieu of weather input. This<br />
allows the user to look at situations that are not based<br />
on the seasonal trend. For example, "under the same<br />
conditions, how does the <strong>fire</strong> danger change with a<br />
change of fuel models?" or "what would the <strong>fire</strong> danger<br />
be if the moisture content of the large fuels were 3<br />
percent less?" The NFDRS chart is an ideal way of<br />
illustrating the change in <strong>fire</strong> danger due to a specific<br />
change in conditions.