Thermal conductivity of porous copper manufactured by the lost ...
Thermal conductivity of porous copper manufactured by the lost ...
Thermal conductivity of porous copper manufactured by the lost ...

You also want an ePaper? Increase the reach of your titles
YUMPU automatically turns print PDFs into web optimized ePapers that Google loves.
Original<br />
Paper<br />
phys. stat. sol. (a) 205, No. 5 (2008) 1129<br />
Table 1 Structural characteristics and <strong>the</strong>rmal <strong>conductivity</strong> <strong>of</strong> <strong>porous</strong> <strong>copper</strong> samples.<br />
sample number 1 2 3 4 5 6 7 8 9 10<br />
relative density 0.21 0.26 0.27 0.28 0.36 0.15 0.2 0.25 0.3 0.78<br />
porosity (%) 79 74 73 72 64 85 80 75 70 22<br />
pore size (µm) 710–1000 1000–1500 710–1000 425–710 710–1000 425–710 425–710 425–710 425–710 –<br />
<strong>the</strong>rmal <strong>conductivity</strong> (W m –1 K –1 )<br />
Corsan’s method 24.8 46.9 46.3 45.9 68.7 – – – – 178<br />
Sigmatest method – – – – – 6.2 15.6 28.1 42.5 172<br />
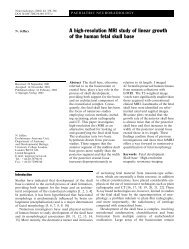
Figure 4 shows <strong>the</strong> temperature gradients in samples<br />
1–5 and 10, and <strong>the</strong>ir corresponding comparators at<br />
steady-state temperatures in <strong>the</strong> range <strong>of</strong> 100 ± 6 °C at<br />
<strong>the</strong>rmocouple 1. The first three data points (up to 100 mm<br />
Temperature ( o C)<br />
Temperature ( o C)<br />
Temperature ( o C)<br />
110<br />
100<br />
90<br />
80<br />
70<br />
60<br />
50<br />
T = -0.04x + 104<br />
40<br />
0 25 50 75 100 125 150 175 200<br />
Distance from Thermocouple 1 (mm)<br />
110<br />
100<br />
90<br />
80<br />
70<br />
60<br />
50<br />
from <strong>the</strong>rmocouple 1) represent <strong>the</strong> temperature readings<br />
<strong>of</strong> <strong>the</strong> three <strong>the</strong>rmocouples in <strong>the</strong> comparator. The remaining<br />
four data points represent <strong>the</strong> <strong>the</strong>rmocouple temperature<br />
readings in <strong>the</strong> <strong>porous</strong> <strong>copper</strong> specimen. The change<br />
T=-0.06x+94<br />
T = -0.59x + 158<br />
(a) ρ =0.21 50 (b) .26<br />
T = -0.06x + 102<br />
T = -0.51x + 146<br />
50<br />
(c) .27 (d) .28<br />
40<br />
0 25 50 75 100 125 150 175 200<br />
Distance from Thermocouple 1 (mm)<br />
110<br />
100<br />
90<br />
80<br />
70<br />
60<br />
50<br />
T = -0.07x + 99<br />
40<br />
0 25 50 75 100 125 150 175 200<br />
Distance from Thermocouple 1 (mm)<br />
Temperature ( o C)<br />
Temperature ( o C)<br />
100<br />
90<br />
80<br />
70<br />
60<br />
T = -0.48x + 134<br />
40<br />
0 25 50 75 100 125 150 175 200<br />
Distance from Thermocouple 1 (mm)<br />
100<br />
90<br />
80<br />
70<br />
60<br />
T = -0.06x + 94<br />
T = -0.46x + 134<br />
40<br />
0 25 50 75 100 125 150 175 200<br />
Distance from Thermocouple 1 (mm)<br />
T = -0.095x + 101.18<br />
(e) .36<br />
T = -0.38x + 127<br />
60<br />
50 (f) .78<br />
Temperature ( o C)<br />
110<br />
100<br />
90<br />
80<br />
70<br />
ρ =0<br />
ρ =0 ρ =0<br />
ρ =0 ρ =0<br />
T = -0.21x + 109.72<br />
40<br />
0 25 50 75 100 125 150 175 200<br />
Distance from Thermocouple 1 (mm)<br />
Figure 4 Temperature gradients in <strong>the</strong> solid <strong>copper</strong> comparators and <strong>the</strong> <strong>porous</strong> <strong>copper</strong> samples 1 (a), 2 (b), 3 (c), 4 (d), 5 (e) and 10 (f).<br />
www.pss-a.com © 2008 WILEY-VCH Verlag GmbH & Co. KGaA, Weinheim