Thermal conductivity of porous copper manufactured by the lost ...
Thermal conductivity of porous copper manufactured by the lost ...
Thermal conductivity of porous copper manufactured by the lost ...

Create successful ePaper yourself
Turn your PDF publications into a flip-book with our unique Google optimized e-Paper software.
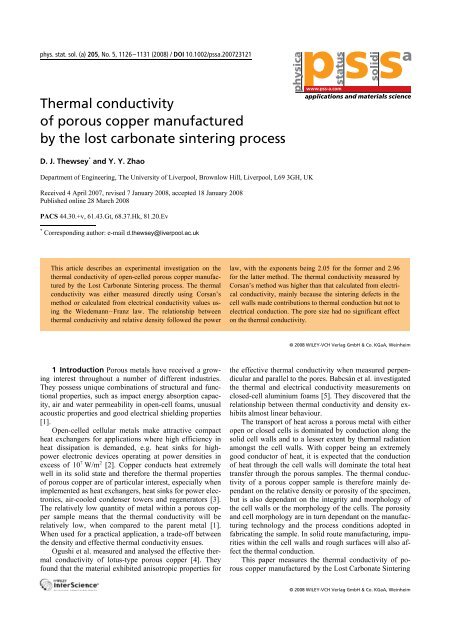
phys. stat. sol. (a) 205, No. 5, 1126–1131 (2008) / DOI 10.1002/pssa.200723121<br />
<strong>Thermal</strong> <strong>conductivity</strong><br />
<strong>of</strong> <strong>porous</strong> <strong>copper</strong> <strong>manufactured</strong><br />
<strong>by</strong> <strong>the</strong> <strong>lost</strong> carbonate sintering process<br />
D. J. Thewsey *<br />
and Y. Y. Zhao<br />
physica<br />
Department <strong>of</strong> Engineering, The University <strong>of</strong> Liverpool, Brownlow Hill, Liverpool, L69 3GH, UK<br />
Received 4 April 2007, revised 7 January 2008, accepted 18 January 2008<br />
Published online 28 March 2008<br />
PACS 44.30.+v, 61.43.Gt, 68.37.Hk, 81.20.Ev<br />
* Corresponding author: e-mail d.<strong>the</strong>wsey@liverpool.ac.uk<br />
This article describes an experimental investigation on <strong>the</strong><br />
<strong>the</strong>rmal <strong>conductivity</strong> <strong>of</strong> open-celled <strong>porous</strong> <strong>copper</strong> <strong>manufactured</strong><br />
<strong>by</strong> <strong>the</strong> Lost Carbonate Sintering process. The <strong>the</strong>rmal<br />
<strong>conductivity</strong> was ei<strong>the</strong>r measured directly using Corsan’s<br />
method or calculated from electrical <strong>conductivity</strong> values using<br />
<strong>the</strong> Wiedemann–Franz law. The relationship between<br />
<strong>the</strong>rmal <strong>conductivity</strong> and relative density followed <strong>the</strong> power<br />
1 Introduction Porous metals have received a growing<br />
interest throughout a number <strong>of</strong> different industries.<br />
They possess unique combinations <strong>of</strong> structural and functional<br />
properties, such as impact energy absorption capacity,<br />
air and water permeability in open-cell foams, unusual<br />
acoustic properties and good electrical shielding properties<br />
[1].<br />
Open-celled cellular metals make attractive compact<br />
heat exchangers for applications where high efficiency in<br />
heat dissipation is demanded, e.g. heat sinks for highpower<br />
electronic devices operating at power densities in<br />
excess <strong>of</strong> 10 7 W/m 2 [2]. Copper conducts heat extremely<br />
well in its solid state and <strong>the</strong>refore <strong>the</strong> <strong>the</strong>rmal properties<br />
<strong>of</strong> <strong>porous</strong> <strong>copper</strong> are <strong>of</strong> particular interest, especially when<br />
implemented as heat exchangers, heat sinks for power electronics,<br />
air-cooled condenser towers and regenerators [3].<br />
The relatively low quantity <strong>of</strong> metal within a <strong>porous</strong> <strong>copper</strong><br />
sample means that <strong>the</strong> <strong>the</strong>rmal <strong>conductivity</strong> will be<br />
relatively low, when compared to <strong>the</strong> parent metal [1].<br />
When used for a practical application, a trade-<strong>of</strong>f between<br />
<strong>the</strong> density and effective <strong>the</strong>rmal <strong>conductivity</strong> ensues.<br />
Ogushi et al. measured and analysed <strong>the</strong> effective <strong>the</strong>rmal<br />
<strong>conductivity</strong> <strong>of</strong> lotus-type <strong>porous</strong> <strong>copper</strong> [4]. They<br />
found that <strong>the</strong> material exhibited anisotropic properties for<br />
pss<br />
www.pss-a.com<br />
status<br />
solidi<br />
a<br />
applications and materials science<br />
law, with <strong>the</strong> exponents being 2.05 for <strong>the</strong> former and 2.96<br />
for <strong>the</strong> latter method. The <strong>the</strong>rmal <strong>conductivity</strong> measured <strong>by</strong><br />
Corsan’s method was higher than that calculated from electrical<br />
<strong>conductivity</strong>, mainly because <strong>the</strong> sintering defects in <strong>the</strong><br />
cell walls made contributions to <strong>the</strong>rmal conduction but not to<br />
electrical conduction. The pore size had no significant effect<br />
on <strong>the</strong> <strong>the</strong>rmal <strong>conductivity</strong>.<br />
© 2008 WILEY-VCH Verlag GmbH & Co. KGaA, Weinheim<br />
<strong>the</strong> effective <strong>the</strong>rmal <strong>conductivity</strong> when measured perpendicular<br />
and parallel to <strong>the</strong> pores. Babcsán et al. investigated<br />
<strong>the</strong> <strong>the</strong>rmal and electrical <strong>conductivity</strong> measurements on<br />
closed-cell aluminium foams [5]. They discovered that <strong>the</strong><br />
relationship between <strong>the</strong>rmal <strong>conductivity</strong> and density exhibits<br />
almost linear behaviour.<br />
The transport <strong>of</strong> heat across a <strong>porous</strong> metal with ei<strong>the</strong>r<br />
open or closed cells is dominated <strong>by</strong> conduction along <strong>the</strong><br />
solid cell walls and to a lesser extent <strong>by</strong> <strong>the</strong>rmal radiation<br />
amongst <strong>the</strong> cell walls. With <strong>copper</strong> being an extremely<br />
good conductor <strong>of</strong> heat, it is expected that <strong>the</strong> conduction<br />
<strong>of</strong> heat through <strong>the</strong> cell walls will dominate <strong>the</strong> total heat<br />
transfer through <strong>the</strong> <strong>porous</strong> samples. The <strong>the</strong>rmal <strong>conductivity</strong><br />
<strong>of</strong> a <strong>porous</strong> <strong>copper</strong> sample is <strong>the</strong>refore mainly dependant<br />
on <strong>the</strong> relative density or porosity <strong>of</strong> <strong>the</strong> specimen,<br />
but is also dependant on <strong>the</strong> integrity and morphology <strong>of</strong><br />
<strong>the</strong> cell walls or <strong>the</strong> morphology <strong>of</strong> <strong>the</strong> cells. The porosity<br />
and cell morphology are in turn dependant on <strong>the</strong> manufacturing<br />
technology and <strong>the</strong> process conditions adopted in<br />
fabricating <strong>the</strong> sample. In solid route manufacturing, impurities<br />
within <strong>the</strong> cell walls and rough surfaces will also affect<br />
<strong>the</strong> <strong>the</strong>rmal conduction.<br />
This paper measures <strong>the</strong> <strong>the</strong>rmal <strong>conductivity</strong> <strong>of</strong> <strong>porous</strong><br />
<strong>copper</strong> <strong>manufactured</strong> <strong>by</strong> <strong>the</strong> Lost Carbonate Sintering<br />
© 2008 WILEY-VCH Verlag GmbH & Co. KGaA, Weinheim
phys. stat. sol. (a) 205, No. 5 (2008) 1127<br />
2mm 20µm<br />
a) b)<br />
Original<br />
Paper<br />
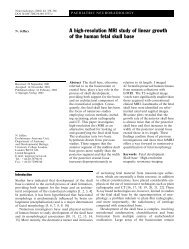
Figure 1 SEM photographs <strong>of</strong> a <strong>porous</strong> <strong>copper</strong> sample showing (a) spherically shaped pores and <strong>the</strong> irregular cell walls, and (b) bonding<br />
between two sintered <strong>copper</strong> particles.<br />
(LCS) process and studies <strong>the</strong> effect <strong>of</strong> porosity and pore<br />
size.<br />
2 Experimental A set <strong>of</strong> ten <strong>porous</strong> <strong>copper</strong> samples<br />
were <strong>manufactured</strong> using <strong>the</strong> LCS method, developed <strong>by</strong><br />
Zhao et al. for manufacturing open-celled <strong>porous</strong> metals<br />
[6]. A commercially pure <strong>copper</strong> powder, consisting <strong>of</strong><br />
spherical granules with diameters less than 75 µm was<br />
mixed with a potassium carbonate (K 2CO 3) powder at a<br />
pre-specified volume ratio. The K 2CO 3 particles were<br />
spherical in shape and had diameters ranging between<br />
425 µm and 1500 µm. The K 2CO 3 powder was sieved<br />
and categorised into three particle sizes: 425–710 µm,<br />
710–1000 µm and 1000–1500 µm. The mixture was <strong>the</strong>n<br />
compacted into a preform under a pressure <strong>of</strong> 250 MPa<br />
within a steel tube, using a hydraulic press. The steel tube<br />
had an inside diameter <strong>of</strong> 21 mm. The preform was sintered<br />
in a furnace at a temperature <strong>of</strong> 850 °C for four hours.<br />
The preform was <strong>the</strong>n allowed to cool back to room temperature<br />
and <strong>the</strong> K 2CO 3 was dissolved in running water for<br />
three hours, leaving behind <strong>the</strong> <strong>porous</strong> <strong>copper</strong> network,<br />
whose pores are direct negatives <strong>of</strong> <strong>the</strong> K 2CO 3 particles.<br />
The pores within <strong>the</strong> sample are spherical and <strong>of</strong> a prespecified<br />
size, determined <strong>by</strong> <strong>the</strong> K 2CO 3 powder used. The<br />
pores are interlinked <strong>by</strong> small tunnels and have rough, irregular<br />
walls as a result <strong>of</strong> <strong>the</strong> sintered <strong>copper</strong> granules.<br />
Figure 1 shows <strong>the</strong> pore morphology and bonding between<br />
two sintered <strong>copper</strong> particles in one <strong>of</strong> <strong>the</strong> <strong>porous</strong> <strong>copper</strong><br />
specimens.<br />
A number <strong>of</strong> different test methods are available for<br />
measuring <strong>the</strong> <strong>the</strong>rmal <strong>conductivity</strong> <strong>of</strong> different materials<br />
[7]. The <strong>the</strong>rmal <strong>conductivity</strong> tests on <strong>the</strong> <strong>porous</strong> <strong>copper</strong><br />
samples were carried out at atmospheric pressure using a<br />
method developed <strong>by</strong> Corsan [8]. Figure 2 shows a schematic<br />
diagram <strong>of</strong> <strong>the</strong> test apparatus. The <strong>porous</strong> <strong>copper</strong><br />
specimen is cylindrical in shape and has a length 110 mm<br />
and diameter 19 mm. A solid <strong>copper</strong> comparator <strong>of</strong> length<br />
150 mm and diameter 19 mm was clamped down onto <strong>the</strong><br />
test specimen using an aluminium clamping jig. <strong>Thermal</strong>ly<br />
conductive grease was applied to <strong>the</strong> end <strong>of</strong> <strong>the</strong> test specimen<br />
and <strong>the</strong> end <strong>of</strong> <strong>the</strong> comparator, so that <strong>the</strong> heat was<br />
conducted effectively through <strong>the</strong> interface. The clamp<br />
held <strong>the</strong> solid <strong>copper</strong> comparator and <strong>the</strong> <strong>porous</strong> <strong>copper</strong><br />
sample toge<strong>the</strong>r firmly and ensured a good contact at <strong>the</strong><br />
interface.<br />
Holes with a diameter <strong>of</strong> 2 mm were drilled at specific,<br />
measured locations along <strong>the</strong> length <strong>of</strong> <strong>the</strong> comparator and<br />
<strong>the</strong> <strong>porous</strong> <strong>copper</strong> test specimen. Each hole had a K-type<br />
Figure 2 Schematic diagram <strong>of</strong> <strong>the</strong> test apparatus<br />
showing <strong>the</strong> clamping jig, test specimen and comparator<br />
set-up.<br />
www.pss-a.com © 2008 WILEY-VCH Verlag GmbH & Co. KGaA, Weinheim
physica<br />
pss<br />
status<br />
solidi<br />
a<br />
1128 D. J. Thewsey and Y. Y. Zhao: <strong>Thermal</strong> <strong>conductivity</strong> <strong>of</strong> <strong>porous</strong> <strong>copper</strong><br />
<strong>the</strong>rmocouple located in it. The end <strong>of</strong> each <strong>the</strong>rmocouple<br />
had a heat-shrunk plastic shroud around it to warrant a<br />
tight fit in <strong>the</strong> drilled hole and to ensure that <strong>the</strong> temperature<br />
reading was from <strong>the</strong> precise axial centre <strong>of</strong> <strong>the</strong><br />
specimen. All <strong>the</strong> <strong>the</strong>rmocouples were linked up directly to<br />
a data acquisition unit, with a resolution <strong>of</strong> 0.01 °C. The<br />
solid <strong>copper</strong> comparator had a 6 mm bore at <strong>the</strong> top end for<br />
an 80 W cartridge heater to be located. The heater was<br />
controlled using a variac so that a steady-state temperature<br />
could be achieved accurately at <strong>the</strong>rmocouple 1, in <strong>the</strong><br />
comparator. The test specimen and comparator were insulated<br />
circumferentially, using a combination <strong>of</strong> calciummagnesium-silicate<br />
wool and polyethylene to minimise radial<br />
heat losses. <strong>Thermal</strong> insulation was also added between<br />
<strong>the</strong> comparator and <strong>the</strong> clamping jig to prevent heat<br />
conduction and subsequent dissipation through <strong>the</strong> aluminium<br />
apparatus. The lower plate <strong>of</strong> <strong>the</strong> clamping apparatus<br />
acts as a heat-sink for <strong>the</strong> test specimen, to ensure a steady<br />
temperature gradient. Figure 3 shows typical temperature<br />
plots <strong>of</strong> <strong>the</strong> 8 <strong>the</strong>rmocouples as a function <strong>of</strong> time.<br />
Once <strong>the</strong> temperature within <strong>the</strong> samples reached its<br />
steady-state (after approximately one hour, depending on<br />
<strong>the</strong> relative density <strong>of</strong> <strong>the</strong> sample), <strong>the</strong> temperature reading<br />
was taken at each <strong>of</strong> <strong>the</strong> <strong>the</strong>rmocouple locations <strong>by</strong> <strong>the</strong><br />
data acquisition unit. The steady-state temperatures at<br />
<strong>the</strong>rmocouple 1 varied slightly among <strong>the</strong> samples, but all<br />
were in <strong>the</strong> range <strong>of</strong> 100 ± 6 °C.<br />
The <strong>the</strong>rmal <strong>conductivity</strong> <strong>of</strong> <strong>the</strong> <strong>porous</strong> <strong>copper</strong> sample<br />
was determined from <strong>the</strong> temperature gradients in <strong>the</strong> test<br />
specimen and comparator.<br />
The heat flow rate <strong>of</strong> a one-dimensional steady state<br />
problem in any one conductor can be expressed as:<br />
δT<br />
Q = κ A<br />
Ê ˆ<br />
,<br />
Ë δx<br />
¯ (1)<br />
where Q is <strong>the</strong> heat flow rate, κ is <strong>the</strong> <strong>the</strong>rmal <strong>conductivity</strong>,<br />
A is <strong>the</strong> cross-sectional area <strong>of</strong> <strong>the</strong> conductor and δT/δx is<br />
<strong>the</strong> temperature gradient. Assuming that <strong>the</strong> <strong>porous</strong> <strong>copper</strong><br />
specimen and <strong>the</strong> comparator were perfectly insulated<br />
circumferentially, <strong>the</strong> heat flow rate is a constant through-<br />
Figure 3 Typical temperature plots <strong>of</strong> <strong>the</strong> cartridge heater and<br />
<strong>the</strong>rmocouples 1–7 for one <strong>of</strong> <strong>the</strong> samples.<br />
out <strong>the</strong> <strong>porous</strong> specimen and <strong>the</strong> solid comparator. As <strong>the</strong><br />
cross sectional area, A, is also <strong>the</strong> same in both <strong>the</strong> comparator<br />
and <strong>the</strong> <strong>porous</strong> specimen, <strong>the</strong> <strong>the</strong>rmal <strong>conductivity</strong><br />
<strong>of</strong> <strong>the</strong> <strong>porous</strong> <strong>copper</strong>, κ 2, is given <strong>by</strong>:<br />
ÊδTˆ Ë δx<br />
¯1<br />
κ2 = κ1<br />
,<br />
ÊδTˆ Ë δx<br />
¯<br />
© 2008 WILEY-VCH Verlag GmbH & Co. KGaA, Weinheim www.pss-a.com<br />
2<br />
where κ 1 is <strong>the</strong> <strong>the</strong>rmal <strong>conductivity</strong> <strong>of</strong> <strong>the</strong> solid <strong>copper</strong><br />
comparator, given <strong>by</strong> <strong>the</strong> manufacturer as 390 W m –1 K –1 ,<br />
(δT/δx) 1 is <strong>the</strong> temperature gradient in <strong>the</strong> solid <strong>copper</strong><br />
comparator and (δT/δx) 2 is <strong>the</strong> temperature gradient in <strong>the</strong><br />
<strong>porous</strong> <strong>copper</strong> test specimen. The temperature gradients in<br />
<strong>the</strong> comparator and <strong>the</strong> <strong>porous</strong> <strong>copper</strong> can be obtained<br />
from <strong>the</strong> temperature plots along <strong>the</strong> lengths <strong>of</strong> <strong>the</strong> comparator<br />
and <strong>the</strong> <strong>porous</strong> <strong>copper</strong> sample.<br />
In order to verify <strong>the</strong> results obtained using <strong>the</strong> Corsan<br />
method for measuring <strong>the</strong>rmal <strong>conductivity</strong>, <strong>the</strong> electrical<br />
<strong>conductivity</strong> <strong>of</strong> five test specimens was measured using a<br />
Sigmatest 2.068 <strong>conductivity</strong> meter. The instrument uses<br />
eddy currents to establish <strong>the</strong> resistance to <strong>the</strong> flow <strong>of</strong> current<br />
in <strong>the</strong> material and hence <strong>the</strong> <strong>conductivity</strong>. Since free<br />
electrons are responsible for both electrical and <strong>the</strong>rmal<br />
conduction in pure metals, <strong>the</strong>oretical treatments suggest<br />
that <strong>the</strong> two conductivities should be related according to<br />
<strong>the</strong> Wiedemann–Franz law [9]. Assuming that <strong>the</strong> dominant<br />
mechanism for both electrical and <strong>the</strong>rmal conduction<br />
in <strong>the</strong> <strong>porous</strong> <strong>copper</strong> specimen is conduction <strong>by</strong> free electrons,<br />
<strong>the</strong>n <strong>the</strong> <strong>the</strong>rmal <strong>conductivity</strong> <strong>of</strong> <strong>the</strong> specimen can be<br />
estimated from its electrical <strong>conductivity</strong> <strong>by</strong> <strong>the</strong> Wiedemann–Franz<br />
law as:<br />
(2)<br />
k = LTσ , (3)<br />
where k is <strong>the</strong> <strong>the</strong>rmal <strong>conductivity</strong>, L is a constant with a<br />
<strong>the</strong>oretical value <strong>of</strong> 2.44 × 10 –8 Ω W/(K) 2 , T is <strong>the</strong> absolute<br />
temperature, and σ is <strong>the</strong> electrical <strong>conductivity</strong>. It should<br />
be noted that L should be independent <strong>of</strong> temperature and<br />
equal for all metals provided that heat energy is transported<br />
entirely <strong>by</strong> free electrons. All measurements were taken at<br />
a room temperature <strong>of</strong> 23 ± 0.5 °C.<br />
3 Results and discussion The <strong>the</strong>rmal <strong>conductivity</strong><br />
<strong>of</strong> ten different specimens was measured and compared.<br />
Each sample has different properties, in terms <strong>of</strong> <strong>the</strong> relative<br />
density and pore size. The relative density is <strong>the</strong> ratio<br />
<strong>of</strong> <strong>the</strong> density <strong>of</strong> <strong>porous</strong> <strong>copper</strong> with <strong>the</strong> density <strong>of</strong> pure<br />
<strong>copper</strong>. It was measured using Archimedes method and is<br />
accurate to within ±0.005. The variation in density along<br />
<strong>the</strong> length <strong>of</strong> <strong>the</strong> sample is less than 6% based on quantitative<br />
metallographic measurements. The properties <strong>of</strong> <strong>the</strong><br />
ten <strong>porous</strong> <strong>copper</strong> test samples are summarised in Table 1.<br />
Sample 10 was <strong>manufactured</strong> <strong>by</strong> sintering a bulk <strong>of</strong> <strong>copper</strong><br />
powder with no space holder, that was compacted and sintered<br />
under <strong>the</strong> same process parameters as <strong>the</strong> o<strong>the</strong>r nine<br />
samples.
Original<br />
Paper<br />
phys. stat. sol. (a) 205, No. 5 (2008) 1129<br />
Table 1 Structural characteristics and <strong>the</strong>rmal <strong>conductivity</strong> <strong>of</strong> <strong>porous</strong> <strong>copper</strong> samples.<br />
sample number 1 2 3 4 5 6 7 8 9 10<br />
relative density 0.21 0.26 0.27 0.28 0.36 0.15 0.2 0.25 0.3 0.78<br />
porosity (%) 79 74 73 72 64 85 80 75 70 22<br />
pore size (µm) 710–1000 1000–1500 710–1000 425–710 710–1000 425–710 425–710 425–710 425–710 –<br />
<strong>the</strong>rmal <strong>conductivity</strong> (W m –1 K –1 )<br />
Corsan’s method 24.8 46.9 46.3 45.9 68.7 – – – – 178<br />
Sigmatest method – – – – – 6.2 15.6 28.1 42.5 172<br />
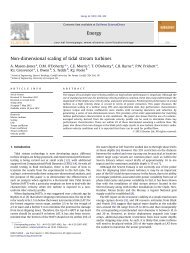
Figure 4 shows <strong>the</strong> temperature gradients in samples<br />
1–5 and 10, and <strong>the</strong>ir corresponding comparators at<br />
steady-state temperatures in <strong>the</strong> range <strong>of</strong> 100 ± 6 °C at<br />
<strong>the</strong>rmocouple 1. The first three data points (up to 100 mm<br />
Temperature ( o C)<br />
Temperature ( o C)<br />
Temperature ( o C)<br />
110<br />
100<br />
90<br />
80<br />
70<br />
60<br />
50<br />
T = -0.04x + 104<br />
40<br />
0 25 50 75 100 125 150 175 200<br />
Distance from Thermocouple 1 (mm)<br />
110<br />
100<br />
90<br />
80<br />
70<br />
60<br />
50<br />
from <strong>the</strong>rmocouple 1) represent <strong>the</strong> temperature readings<br />
<strong>of</strong> <strong>the</strong> three <strong>the</strong>rmocouples in <strong>the</strong> comparator. The remaining<br />
four data points represent <strong>the</strong> <strong>the</strong>rmocouple temperature<br />
readings in <strong>the</strong> <strong>porous</strong> <strong>copper</strong> specimen. The change<br />
T=-0.06x+94<br />
T = -0.59x + 158<br />
(a) ρ =0.21 50 (b) .26<br />
T = -0.06x + 102<br />
T = -0.51x + 146<br />
50<br />
(c) .27 (d) .28<br />
40<br />
0 25 50 75 100 125 150 175 200<br />
Distance from Thermocouple 1 (mm)<br />
110<br />
100<br />
90<br />
80<br />
70<br />
60<br />
50<br />
T = -0.07x + 99<br />
40<br />
0 25 50 75 100 125 150 175 200<br />
Distance from Thermocouple 1 (mm)<br />
Temperature ( o C)<br />
Temperature ( o C)<br />
100<br />
90<br />
80<br />
70<br />
60<br />
T = -0.48x + 134<br />
40<br />
0 25 50 75 100 125 150 175 200<br />
Distance from Thermocouple 1 (mm)<br />
100<br />
90<br />
80<br />
70<br />
60<br />
T = -0.06x + 94<br />
T = -0.46x + 134<br />
40<br />
0 25 50 75 100 125 150 175 200<br />
Distance from Thermocouple 1 (mm)<br />
T = -0.095x + 101.18<br />
(e) .36<br />
T = -0.38x + 127<br />
60<br />
50 (f) .78<br />
Temperature ( o C)<br />
110<br />
100<br />
90<br />
80<br />
70<br />
ρ =0<br />
ρ =0 ρ =0<br />
ρ =0 ρ =0<br />
T = -0.21x + 109.72<br />
40<br />
0 25 50 75 100 125 150 175 200<br />
Distance from Thermocouple 1 (mm)<br />
Figure 4 Temperature gradients in <strong>the</strong> solid <strong>copper</strong> comparators and <strong>the</strong> <strong>porous</strong> <strong>copper</strong> samples 1 (a), 2 (b), 3 (c), 4 (d), 5 (e) and 10 (f).<br />
www.pss-a.com © 2008 WILEY-VCH Verlag GmbH & Co. KGaA, Weinheim
physica<br />
pss<br />
status<br />
solidi<br />
a<br />
1130 D. J. Thewsey and Y. Y. Zhao: <strong>Thermal</strong> <strong>conductivity</strong> <strong>of</strong> <strong>porous</strong> <strong>copper</strong><br />
in temperature gradient is clearly visible between <strong>the</strong>rmocouples<br />
3 and 4, where <strong>the</strong> interface between <strong>the</strong> comparator<br />
and <strong>the</strong> test sample is.<br />
The plots in Fig. 4 show linear temperature gradients in<br />
both <strong>the</strong> solid <strong>copper</strong> parts and <strong>the</strong> <strong>porous</strong> <strong>copper</strong> parts,<br />
with <strong>the</strong> interface clearly visible in each case. This demonstrates<br />
negligible radial heat losses at steady-state temperatures<br />
within <strong>the</strong> range <strong>of</strong> 100 ± 6 °C. The temperature gradients<br />
in samples 1–5 and 10 and <strong>the</strong>ir corresponding<br />
comparators are: –0.59, –0.04; –0.48, –0.06; –0.51,<br />
–0.06; –0.46, –0.06; –0.38, –0.07; and –0.21, –0.095 Km –1 ;<br />
respectively. Using Eq. (2), <strong>the</strong> corresponding values<br />
for <strong>the</strong> <strong>the</strong>rmal <strong>conductivity</strong> for samples 1–5 and 10<br />
were calculated to be 24.8, 46.9, 46.3, 45.9, 68.7 and<br />
178.0 W m –1 K –1 , respectively. Samples 2–4 all have relative<br />
densities between 0.26 and 0.28 and different pore<br />
sizes <strong>of</strong> 1000–1500 µm, 710–1000 µm and 425–710 µm<br />
respectively. The deviation in relative density between <strong>the</strong><br />
samples is due to slight discrepancies during <strong>the</strong> manufacturing<br />
process. The results show that for a given relative<br />
density, <strong>the</strong> pore size only has a very slight effect on <strong>the</strong><br />
<strong>the</strong>rmal <strong>conductivity</strong>, with measured values varying between<br />
45.9 W m –1 K –1 and 46.9 W m –1 K –1 for samples 2–4.<br />
The <strong>the</strong>rmal <strong>conductivity</strong> <strong>of</strong> a <strong>porous</strong> <strong>copper</strong> sample is<br />
mainly determined <strong>by</strong> its relative density, or porosity.<br />
The electrical conductivities <strong>of</strong> samples 6–9 and 10<br />
were measured to be 1.0, 2.5, 4.5, 6.9 and 28.2 MS m –1 respectively.<br />
The corresponding values <strong>of</strong> <strong>the</strong> <strong>the</strong>rmal conductivities<br />
calculated from Eq. (3) were 6.2, 15.6, 28.1<br />
42.5 and 172.0 W m –1 K –1 , respectively. The room-temperature<br />
electrical <strong>conductivity</strong> <strong>of</strong> pure <strong>copper</strong> is 60 MS m –1<br />
[9]. The experimental data <strong>of</strong> <strong>the</strong>rmal conductivities for all<br />
ten samples are plotted as a function <strong>of</strong> relative density in<br />
Fig. 5. This shows that <strong>the</strong> <strong>the</strong>rmal <strong>conductivity</strong> is dominated<br />
<strong>by</strong> <strong>the</strong> relative density or porosity <strong>of</strong> <strong>the</strong> <strong>porous</strong> <strong>copper</strong><br />
sample.<br />
Empirical correlation and modelling have shown that<br />
<strong>the</strong> relationship between <strong>the</strong> <strong>the</strong>rmal <strong>conductivity</strong> and <strong>the</strong><br />
relative density <strong>of</strong> <strong>the</strong> <strong>porous</strong> metal can be expressed <strong>by</strong><br />
�����������������������������<br />
1<br />
0.3<br />
0.1<br />
0.03<br />
0.01<br />
0.1<br />
����������������<br />
���������������<br />
0.2 0.6 0.8<br />
����������������<br />
Figure 5 Double-log plot showing <strong>the</strong> variation <strong>of</strong> <strong>the</strong>rmal <strong>conductivity</strong><br />
with relative density, measured <strong>by</strong> Corsan’s method and<br />
<strong>the</strong> Sigmatest method.<br />
1<br />
power law [10–13]:<br />
κ Ê ρ ˆ<br />
=<br />
κ<br />
Á<br />
Ë ρ<br />
˜<br />
¯<br />
0 0<br />
© 2008 WILEY-VCH Verlag GmbH & Co. KGaA, Weinheim www.pss-a.com<br />
n<br />
,<br />
where κ is <strong>the</strong> <strong>the</strong>rmal <strong>conductivity</strong> <strong>of</strong> <strong>the</strong> <strong>porous</strong> metal, κ 0<br />
is <strong>the</strong> <strong>the</strong>rmal <strong>conductivity</strong> <strong>of</strong> <strong>the</strong> bulk material in <strong>the</strong> cell<br />
wall, ρ is <strong>the</strong> density <strong>of</strong> <strong>the</strong> <strong>porous</strong> metal, ρ 0 is <strong>the</strong> density<br />
<strong>of</strong> <strong>the</strong> bulk metal and n is <strong>the</strong> exponent for <strong>the</strong>rmal <strong>conductivity</strong>.<br />
The <strong>the</strong>oretical value predicted <strong>by</strong> <strong>the</strong> percolation<br />
<strong>the</strong>ory for <strong>the</strong> exponent for <strong>the</strong>rmal <strong>conductivity</strong> is n = 2.0<br />
[14]. The relative <strong>the</strong>rmal <strong>conductivity</strong> vs. relative density<br />
curves fitted to Eq. (4) are also shown in Fig. 5. The power<br />
law with exponents <strong>of</strong> 2.05 and 2.96 describes <strong>the</strong> experimental<br />
data well for Corsan’s method and <strong>the</strong> Sigmatest<br />
method, respectively. It clearly shows that for any relative<br />
density, <strong>the</strong> <strong>the</strong>rmal <strong>conductivity</strong> value obtained <strong>by</strong> <strong>the</strong><br />
Sigmatest method was lower than that obtained <strong>by</strong> Corsan’s<br />
method.<br />
There are four mechanisms contributing to <strong>the</strong> heat<br />
transfer and thus <strong>the</strong> <strong>the</strong>rmal <strong>conductivity</strong> <strong>of</strong> <strong>the</strong> <strong>porous</strong><br />
<strong>copper</strong> samples. These mechanisms are <strong>the</strong>rmal conduction<br />
through <strong>the</strong> cell walls, <strong>the</strong>rmal conduction through <strong>the</strong> gas<br />
within <strong>the</strong> pores and interconnecting channels, convective<br />
effects within <strong>the</strong> pores and radiation through <strong>the</strong> cell walls.<br />
By far <strong>the</strong> most dominant <strong>of</strong> <strong>the</strong>se mechanisms is solid<br />
conduction through <strong>the</strong> cell walls, however <strong>the</strong> o<strong>the</strong>r three<br />
will firstly be considered.<br />
If <strong>the</strong> relative density <strong>of</strong> <strong>the</strong> <strong>porous</strong> metal is increased,<br />
<strong>the</strong> connectivity between pores will decrease, resulting in a<br />
reduction in radiative heat transfer between pores through<br />
interconnecting channels. Radiation through <strong>the</strong> cell walls<br />
is not possible in a case <strong>of</strong> optically non-transparent metals.<br />
Radiation within <strong>the</strong> cells can be ignored, when <strong>the</strong> <strong>the</strong>rmal<br />
conduction <strong>of</strong> <strong>the</strong> cell wall material is greater than<br />
20 W m –1 K –1 [3].<br />
Gaseous conduction in an open cell <strong>porous</strong> metal depends<br />
greatly on <strong>the</strong> relative density <strong>of</strong> <strong>the</strong> <strong>porous</strong> metal.<br />
The gas in <strong>the</strong> pores is air and <strong>the</strong> value <strong>of</strong> <strong>the</strong>rmal <strong>conductivity</strong><br />
for air at atmospheric pressure is 0.025 W m –1 Κ –1 [3],<br />
which is well below <strong>the</strong> <strong>the</strong>rmal <strong>conductivity</strong> <strong>of</strong> solid <strong>copper</strong>.<br />
The heat transfer via gaseous conduction is not significant,<br />
for samples with relative density above 0.2.<br />
Convection within <strong>the</strong> cells is important only when <strong>the</strong><br />
Grash<strong>of</strong> number (<strong>the</strong> ratio between force driving convection<br />
and opposing viscous force) is greater than about 1000<br />
[3]. In order for convection to take place, <strong>the</strong>re needs to be<br />
sufficient space within a pore where a temperature difference<br />
can be present so that <strong>the</strong> convection current can be<br />
present. For this reason, <strong>the</strong> effect <strong>of</strong> heat transfer <strong>by</strong> convection<br />
will be greater in sample 3, due to <strong>the</strong> larger pore<br />
size. However, convection in <strong>porous</strong> metals with a pore<br />
size less than about 10 mm is negligible [15].<br />
The overwhelming majority <strong>of</strong> <strong>the</strong> heat transfer<br />
through each <strong>of</strong> <strong>the</strong> <strong>porous</strong> <strong>copper</strong> samples is via solid<br />
conduction through <strong>the</strong> cell walls. Increasing relative density<br />
<strong>of</strong> <strong>the</strong> <strong>porous</strong> <strong>copper</strong> sample increases <strong>the</strong> volume <strong>of</strong><br />
(4)
phys. stat. sol. (a) 205, No. 5 (2008) 1131<br />
<strong>the</strong> cell walls, which in turn increases <strong>the</strong> <strong>the</strong>rmal <strong>conductivity</strong>.<br />
This can clearly be seen in Fig. 5.<br />
If <strong>the</strong> cell walls were defect free solid <strong>copper</strong> and electron<br />
movement were <strong>the</strong> only mechanism for both electrical<br />
and <strong>the</strong>rmal <strong>conductivity</strong>, <strong>the</strong>n electrical <strong>conductivity</strong><br />
and <strong>the</strong>rmal <strong>conductivity</strong> <strong>of</strong> <strong>the</strong> <strong>porous</strong> <strong>copper</strong> samples<br />
would be expected to conform to <strong>the</strong> same power law in<br />
Eq. (4) with an exponent n close to 2. Figure 5 shows that<br />
both <strong>the</strong> variations <strong>of</strong> electrical <strong>conductivity</strong> and <strong>the</strong>rmal<br />
<strong>conductivity</strong> with relative density follow a power law, confirming<br />
that electron movement is <strong>the</strong> main mechanism for<br />
electrical and <strong>the</strong>rmal conduction in <strong>the</strong> cell walls. However,<br />
<strong>the</strong> exponent <strong>of</strong> <strong>the</strong> <strong>the</strong>rmal <strong>conductivity</strong> curve determined<br />
<strong>by</strong> Corsan’s method is lower than that <strong>of</strong> <strong>the</strong><br />
curve determined <strong>by</strong> <strong>the</strong> Sigmatest method. At any relative<br />
density, <strong>the</strong> <strong>the</strong>rmal <strong>conductivity</strong> measured <strong>by</strong> Corsan’s<br />
method is higher than that calculated from electrical <strong>conductivity</strong><br />
<strong>by</strong> Eq. (3). To explain this phenomenon, <strong>the</strong> integrity<br />
<strong>of</strong> <strong>the</strong> cell walls and <strong>the</strong> o<strong>the</strong>r mechanisms contributing<br />
to <strong>the</strong>rmal conduction must also be considered.<br />
In fact, <strong>the</strong> cell walls are not perfect solid <strong>copper</strong> but<br />
contain numerous defects formed during <strong>the</strong> manufacturing<br />
process. There exist low conductive metal oxides, impurities,<br />
cracks and various o<strong>the</strong>r defects within <strong>the</strong> cell walls,<br />
characteristic <strong>of</strong> sintered components. These defects can<br />
largely impede <strong>the</strong> flow <strong>of</strong> electrons and thus significantly<br />
reduce <strong>the</strong> electrical <strong>conductivity</strong>. The measured electrical<br />
<strong>conductivity</strong> is expected to be lower than that predicted for<br />
perfect cell walls and <strong>the</strong> fitted power law has a higher exponent<br />
<strong>of</strong> 2.96.<br />
The <strong>the</strong>rmal <strong>conductivity</strong> in solid walls has ano<strong>the</strong>r<br />
contributing mechanism. In addition to electron conduction,<br />
lattice vibration waves, or phonons, can also transport heat.<br />
While most <strong>of</strong> <strong>the</strong> sintering defects in <strong>the</strong> cell walls are<br />
electrical insulators, <strong>the</strong>y can still contribute to <strong>the</strong>rmal<br />
conduction. In o<strong>the</strong>r words, while radiative heat transfer,<br />
gaseous conduction and convection are all negligible, <strong>the</strong><br />
conduction <strong>by</strong> phonons is not. For <strong>the</strong>se reasons, <strong>the</strong> <strong>the</strong>rmal<br />
<strong>conductivity</strong> values obtained using Corsan’s method<br />
were significantly higher than those converted from <strong>the</strong><br />
electrical <strong>conductivity</strong> values obtained using <strong>the</strong> Sigmatest<br />
method.<br />
4 Conclusions The <strong>the</strong>rmal <strong>conductivity</strong> <strong>of</strong> six opencelled<br />
<strong>porous</strong> <strong>copper</strong> specimens <strong>manufactured</strong> using <strong>the</strong><br />
Lost Carbonate Sintering method was measured and calculated<br />
experimentally, using a novel method developed <strong>by</strong><br />
Corsan. Heat transfer through <strong>the</strong> <strong>porous</strong> <strong>copper</strong> was<br />
dominated <strong>by</strong> conduction in <strong>the</strong> solid phase, with heat<br />
transfer via convection, radiation and gaseous conduction<br />
being negligible. The <strong>the</strong>rmal <strong>conductivity</strong> increases with<br />
relative density and fits <strong>the</strong> power law, with a value for <strong>the</strong><br />
Original<br />
Paper<br />
exponent for <strong>the</strong>rmal <strong>conductivity</strong> <strong>of</strong> 2.05. Electrical <strong>conductivity</strong><br />
<strong>of</strong> five samples, <strong>manufactured</strong> using <strong>the</strong> same<br />
process, was also measured. The electrical <strong>conductivity</strong><br />
values were converted to <strong>the</strong>rmal <strong>conductivity</strong> values using<br />
<strong>the</strong> Wiedemann–Franz law. The as-obtained <strong>the</strong>rmal <strong>conductivity</strong><br />
also increases with relative density and fits <strong>the</strong><br />
power law, with a higher exponent <strong>of</strong> 2.96. The disparity in<br />
<strong>the</strong> <strong>the</strong>rmal <strong>conductivity</strong> values between <strong>the</strong>se two methods<br />
is mainly because <strong>the</strong> sintering defects in <strong>the</strong> cell walls,<br />
such as oxides and impurities make contributions to <strong>the</strong>rmal<br />
conduction but not to electrical conduction. The pore<br />
size <strong>of</strong> <strong>the</strong> <strong>porous</strong> metal does not have any significant affect<br />
on <strong>the</strong> <strong>the</strong>rmal <strong>conductivity</strong>.<br />
Acknowledgements The authors would like to thank<br />
Dr. Liping Zhang for her assistance with sample preparations,<br />
Dr. Chris Sutcliffe and Mr Sozos Stopanos for <strong>the</strong>ir help with <strong>the</strong><br />
<strong>the</strong>rmal <strong>conductivity</strong> measurements and Ecka Granules (UK) for<br />
supply <strong>of</strong> <strong>the</strong> <strong>copper</strong> powder. Mr David Thewsey would also like<br />
to thank <strong>the</strong> EPSRC for a DTA award.<br />
References<br />
[1] G. J. Davies and S. Zhen, J. Mater. Sci. 18, 1899 (1983).<br />
[2] A. F. Bastawros and A. G. Evans, Proc. Symp. on <strong>the</strong> Application<br />
<strong>of</strong> Heat Transfer in Microelectronics Packaging<br />
(IMECE), Dallas, TX, 1997.<br />
[3] H. Degischer and B. Kriszt (eds.), Handbook <strong>of</strong> Cellular<br />
Metals (Wiley-VCH, Berlin, 2002), pp. 222–224.<br />
[4] T. Ogushi, H. Chiba, H. Nakajima, and T. Ikeda, J. Appl.<br />
Phys. 19, 5843–5847 (2004).<br />
[5] N. Babcsán, I. Mészáros, and N. Hegman, Mater.-wiss.<br />
Werkst.tech. 34, 391–394 (2003).<br />
[6] Y. Y. Zhao, T. Fung, L. P. Zhang, and F. L. Zhang, Scr.<br />
Mater. 52, 295–298 (2005).<br />
[7] British Standard: Methods for determining <strong>the</strong>rmal insulating<br />
properties with definitions <strong>of</strong> <strong>the</strong>rmal insulating terms,<br />
BS 874:1973.<br />
[8] J. M. Corsan, Physica E, Sci. Instrum. 17, 800–807 (1984).<br />
[9] W. D. Callister, Materials Science and Engineering – An Introduction,<br />
5th ed. (John Wiley and Sons, Inc., USA, 2000),<br />
pp. 662–665.<br />
[10] J. Kovacik et al., in Proc. Int. Conf. Effect <strong>of</strong> Non-Standard<br />
External Factors on Physical Properties <strong>of</strong> Solids (Military<br />
Academy Liptovsky Mikulas, 1996), p. 57.<br />
[11] J. Kovacik and F. Simancik, Scr. Mater. 39, 239 (1998).<br />
[12] J. Kovacik, Acta Mater. 46, 5413 (1998).<br />
[13] J. Kovacik and F. Simancik, in: Metal Foams and Porous<br />
Metal Structures, edited <strong>by</strong> J. Banhart, M. F. Ash<strong>by</strong>, and<br />
N. A. Fleck (MIT Verlag, Bremen, 1999), p. 303.<br />
[14] D. Stauffer and A. Aharony, Introduction to Percolation<br />
Theory, 2nd ed. (Taylor and Francis, London, 1992).<br />
[15] G. V. Jackson and A. G. Leach, J. Phys. D, Appl. Phys. 26,<br />
740–745 (1993).<br />
www.pss-a.com © 2008 WILEY-VCH Verlag GmbH & Co. KGaA, Weinheim