A Guide to Productivity Measurement - Spring
A Guide to Productivity Measurement - Spring
A Guide to Productivity Measurement - Spring

You also want an ePaper? Increase the reach of your titles
YUMPU automatically turns print PDFs into web optimized ePapers that Google loves.
A <strong>Guide</strong> <strong>to</strong><br />
<strong>Productivity</strong> <strong>Measurement</strong>
Published by SPRING Singapore<br />
Solaris, 1 Fusionopolis Walk,<br />
#01-02 South Tower, Singapore 138628<br />
Tel : +65 6278 6666<br />
Fax : +65 6278 6667<br />
www.spring.gov.sg<br />
© SPRING Singapore 2011<br />
All rights reserved.<br />
No part of this publication should<br />
be reproduced, s<strong>to</strong>red in a retrieval<br />
system, or transmitted, in any form or<br />
by any means, electronic, mechanical,<br />
pho<strong>to</strong>copying or otherwise, without prior<br />
permission of the copyright holders.<br />
Whilst every effort has been made <strong>to</strong><br />
ensure that the information contained<br />
herein is comprehensive and accurate,<br />
SPRING Singapore will not accept any<br />
liability for omissions or errors.<br />
ISBN 978-981-4150-27-9
CONTENTS<br />
1. INTRODUCTION<br />
2. WHY MEASURE?<br />
3. HOW TO MEASURE<br />
4. WHAT IS VALUE ADDED?<br />
5. AN INTEGRATED APPROACH<br />
TO PRODUCTIVITY MEASUREMENT<br />
6. WHAT DO YOU DO WITH<br />
PRODUCTIVITY MEASURES?<br />
7. CONCLUSION<br />
ANNEX: Common <strong>Productivity</strong><br />
Indica<strong>to</strong>rs<br />
3<br />
4<br />
5<br />
7<br />
13<br />
19<br />
22<br />
23
2 SPRING Singapore
1<br />
INTRODUCTION<br />
Integrated Management of <strong>Productivity</strong> Activities<br />
<strong>Productivity</strong> is critical for the long-term competitiveness and profitability of organisations.<br />
It can be effectively raised if it is managed holistically and systematically. The Integrated<br />
Management of <strong>Productivity</strong> Activities (IMPACT) framework provides a guide <strong>to</strong> how this<br />
can be done.<br />
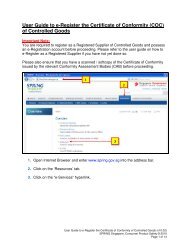
Figure 1.1 shows an overview of the IMPACT framework. Details of the framework can be<br />
found in A <strong>Guide</strong> <strong>to</strong> Integrated Management of <strong>Productivity</strong> Activities (IMPACT), published<br />
by SPRING Singapore. The guide is available on the <strong>Productivity</strong>@Work website at<br />
www.enterpriseone.gov.sg.<br />
Figure 1.1 : IMPACT Framework<br />
PHASE I<br />
Establish<br />
<strong>Productivity</strong><br />
Management<br />
Function<br />
PHASE V<br />
Implement<br />
Performance<br />
Management<br />
System<br />
PHASE II<br />
Diagnose<br />
PHASE IV<br />
Implement<br />
<strong>Measurement</strong><br />
System<br />
<strong>Measurement</strong> System: A Critical Component of IMPACT<br />
PHASE III<br />
Develop Road<br />
Map<br />
This guide focuses on Phase IV — Implement <strong>Measurement</strong> System — of the IMPACT<br />
framework.<br />
The guide introduces you <strong>to</strong> productivity measurement concepts and provides steps on how<br />
<strong>to</strong> set up a measurement system and the practical applications of productivity measurement.<br />
A <strong>Guide</strong> <strong>to</strong> <strong>Productivity</strong> <strong>Measurement</strong><br />
3
2<br />
WHY MEASURE?<br />
<strong>Productivity</strong> measurement is a prerequisite for improving productivity. As Peter Drucker,<br />
who is widely regarded as the pioneer of modern management theory, said:<br />
4 SPRING Singapore<br />
“Without productivity objectives, a business does not have direction.<br />
Without productivity measurement, a business does not have control.”<br />
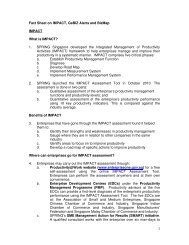
<strong>Measurement</strong> plays an important role in your management of productivity. It helps <strong>to</strong><br />
determine if your organisation is progressing well. It also provides information on how<br />
effectively and efficiently your organisation manages its resources.<br />
IMPACT FRAMEWORK USES OF MEASURES IN PRODUCTIVITY MANAGEMENT<br />
PHASE I<br />
Establish<br />
<strong>Productivity</strong><br />
Management<br />
Function<br />
PHASE II<br />
Diagnose<br />
PHASE III<br />
Develop Road<br />
Map<br />
PHASE IV<br />
Implement<br />
<strong>Measurement</strong><br />
System<br />
PHASE V<br />
Implement<br />
Performance<br />
Management<br />
System<br />
Set goals and create awareness<br />
Set overall productivity goals for your organisation<br />
Raise awareness and garner commitment from employees<br />
Know where you are now<br />
Assess your organisation’s current performance<br />
Identify gaps and areas for improvement<br />
Plan the journey <strong>to</strong> your destination<br />
Set targets and formulate strategies<br />
Implement specific actions<br />
Moni<strong>to</strong>r and reinforce performance<br />
Moni<strong>to</strong>r and review plans<br />
Account <strong>to</strong> various stakeholders<br />
Link effort and reward <strong>to</strong> motivate employees
3<br />
HOW TO MEASURE<br />
<strong>Productivity</strong> is the relationship between the quantity of output and the quantity of input<br />
used <strong>to</strong> generate that output. It is basically a measure of the effectiveness and efficiency<br />
of your organisation in generating output with the resources available.<br />
<strong>Productivity</strong> is defined as a ratio of output <strong>to</strong> input:<br />
PRODUCTIVITY =<br />
Essentially, productivity measurement is the identification and estimation of the appropriate<br />
output and input measures.<br />
Measures of Output<br />
Output could be in the form of goods produced or services rendered. Output may be<br />
expressed in:<br />
Physical quantity<br />
Financial value<br />
Physical Quantity<br />
At the operational level, where products or services are homogeneous, output can be<br />
measured in physical units (e.g. number of cus<strong>to</strong>mers served, number of books printed).<br />
Such measures reflect the physical effectiveness and efficiency of a process, and are not<br />
affected by price fluctuations.<br />
Financial Value<br />
At the organisation level, output is seldom uniform. It is usually measured in financial value,<br />
such as the following:<br />
Sales<br />
Production value (i.e. sales minus change in inven<strong>to</strong>ry level)<br />
Value added<br />
Measures of Input<br />
OUTPUT<br />
INPUT<br />
Input comprises the resources used <strong>to</strong> produce output. The most common forms of input<br />
are labour and capital.<br />
A <strong>Guide</strong> <strong>to</strong> <strong>Productivity</strong> <strong>Measurement</strong><br />
5
Labour<br />
Labour refers <strong>to</strong> all categories of employees in an organisation. It includes working direc<strong>to</strong>rs,<br />
proprie<strong>to</strong>rs, partners, unpaid family workers and part-time workers.<br />
Labour can be measured in three ways:<br />
Number of hours worked<br />
This measure reflects the actual amount of input used. It excludes hours paid but not worked<br />
(e.g. holidays, paid leave).<br />
Number of workers engaged<br />
This measure is more commonly used, as data on hours worked may not be readily<br />
available. Part-timers are converted in<strong>to</strong> their full-time equivalent. An average figure for a<br />
period is used, as the number of workers may fluctuate over time.<br />
Cost of labour<br />
Labour costs include salaries, bonuses, allowances and benefits paid <strong>to</strong> employees.<br />
Capital<br />
Capital refers <strong>to</strong> physical assets such as machinery and equipment, land and buildings, and<br />
inven<strong>to</strong>ries that are used by the organisation in the production of goods or provision of<br />
services. Capital can be measured in physical quantity (e.g. number of machine hours) or<br />
in financial value, net of depreciation <strong>to</strong> account for the reduced efficiency of older assets.<br />
Intermediate Input<br />
Major categories of intermediate input include materials, energy and business services.<br />
Such input can be measured in physical units (e.g. kilogrammes, kilowatt per hour) or<br />
financial units (e.g. cost of energy and materials purchased).<br />
<strong>Productivity</strong> Indica<strong>to</strong>rs<br />
<strong>Productivity</strong> indica<strong>to</strong>rs measure the effectiveness and efficiency of a given input in the<br />
generation of output. Labour productivity and capital productivity are examples of productivity<br />
indica<strong>to</strong>rs.<br />
Labour <strong>Productivity</strong><br />
Labour productivity, defined as value added per worker, is the most common measure<br />
of productivity. It reflects the effectiveness and efficiency of labour in the production and<br />
sale of the output.<br />
Capital <strong>Productivity</strong><br />
Capital productivity measures the effectiveness and efficiency of capital in the generation<br />
of output. It is defined as value added per dollar of capital. Capital productivity results from<br />
improvements in the machinery and equipment used, as well as the skills of the labour<br />
using the capital, processes, etc.<br />
6 SPRING Singapore
4<br />
WHAT IS VALUE ADDED?<br />
Value added is commonly used as a measure of output. It represents the wealth created<br />
through the organisation’s production process or provision of services. Value added<br />
measures the difference between sales and the cost of materials and services incurred<br />
<strong>to</strong> generate the sales.<br />
The resulting wealth is generated by the combined efforts of those who work in the<br />
organisation (employees) and those who provide the capital (employers and inves<strong>to</strong>rs).<br />
Value added is thus distributed as wages <strong>to</strong> employees, depreciation for reinvestment in<br />
machinery and equipment, interest <strong>to</strong> lenders of money, dividends <strong>to</strong> inves<strong>to</strong>rs and profits<br />
<strong>to</strong> the organisation.<br />
Goods and services from<br />
external suppliers<br />
Wages <strong>to</strong><br />
employees<br />
Interest <strong>to</strong><br />
lenders of money<br />
Value added creation<br />
process<br />
Depreciation for<br />
reinvestment in<br />
machinery and<br />
equipment<br />
Sales <strong>to</strong> cus<strong>to</strong>mer<br />
Dividends <strong>to</strong><br />
inves<strong>to</strong>rs<br />
Profits retained<br />
by organisation<br />
A <strong>Guide</strong> <strong>to</strong> <strong>Productivity</strong> <strong>Measurement</strong><br />
7
Why Use Value Added?<br />
Value added is a better measure of output for the following reasons:<br />
It measures the real output of an organisation<br />
Sales measures the dollar value of the output generated by the organisation. Value added,<br />
on the other hand, shows the net wealth created by the organisation. It is the difference<br />
between sales (what the cus<strong>to</strong>mer pays <strong>to</strong> the organisation for the products or services)<br />
and purchases (what the organisation pays <strong>to</strong> suppliers for materials and services <strong>to</strong><br />
generate the sales). Value added excludes supplies that are not a result of the organisation’s<br />
efforts. It provides a cus<strong>to</strong>mer-centric perspective and focuses on the real value created<br />
by the organisation.<br />
It is practical<br />
Value added is measured in financial units, which allows the aggregation of different<br />
output.<br />
It is easy <strong>to</strong> calculate<br />
Value added can be easily derived from an organisation’s profit and loss statement.<br />
There is no need <strong>to</strong> set up a separate data collection system.<br />
It is an effective communication and motivation <strong>to</strong>ol<br />
Value added provides a common bond between employers and employees <strong>to</strong> achieve<br />
the goal of increasing the economic pie shared by both parties. The higher the value<br />
created by the collective effort, the greater is the wealth distributed <strong>to</strong> those who have<br />
contributed <strong>to</strong> it.<br />
It is applicable <strong>to</strong> both manufacturing and service industries<br />
Value added is calculated in the same way for both the manufacturing and service<br />
industries. Unlike physical indica<strong>to</strong>rs, value added can measure the output of service<br />
industries which is often intangible.<br />
How <strong>to</strong> Calculate Value Added<br />
Value added can be calculated using either the Subtraction Method or the Addition Method.<br />
Subtraction Method<br />
The Subtraction Method emphasises the creation of value added. It measures the difference<br />
between sales and the cost of goods and services purchased <strong>to</strong> generate the sales.<br />
8 SPRING Singapore
Value added = Sales – Cost of purchased goods and services<br />
Component Significance<br />
Sales Refers <strong>to</strong> revenue earned from products sold or services<br />
rendered by the organisation. It excludes miscellaneous and<br />
other non-operating income.<br />
Purchased goods<br />
and services<br />
Addition Method<br />
The Addition Method emphasises the distribution of value added <strong>to</strong> those who have<br />
contributed <strong>to</strong> the creation of value added.<br />
Value added = Labour cost <strong>to</strong> employees + Interest <strong>to</strong> lenders of money +<br />
Depreciation for reinvestment in machinery and equipment +<br />
Profits retained by the organisation + Other distributed costs (e.g. tax)<br />
Component Significance<br />
In manufacturing, not all goods sold are produced in the<br />
same period. The change in inven<strong>to</strong>ry level should be<br />
subtracted from sales for a better reflection of the value of<br />
output produced during that period.<br />
Purchases include raw materials, supplies, utilities and services<br />
(e.g. insurance, security, professional services) bought from<br />
external suppliers.<br />
Labour cost Wages and salaries, commissions, bonuses, allowances,<br />
benefits and employers’ contribution <strong>to</strong> CPF and pension<br />
funds.<br />
Interest Interest expense incurred for borrowing.<br />
Depreciation Value of fixed assets attributed across its useful life.<br />
Includes amortisation of intangible assets.<br />
Profit Refers <strong>to</strong> operating profit before tax. Non-operating<br />
income and expenses are excluded.<br />
Tax Refers <strong>to</strong> indirect taxes, excise duties and levies.<br />
4 What Is Value Added?<br />
A <strong>Guide</strong> <strong>to</strong> <strong>Productivity</strong> <strong>Measurement</strong><br />
9
Value added does not arise as a result of paying out wages, interest charges, taxes, accounting<br />
for depreciation and generating profits. On the contrary, it is the creation of value added<br />
that allows such amounts <strong>to</strong> be paid or set aside. An increase in salaries alone will not<br />
increase value added as there will be a corresponding decrease in profits.<br />
Figure 4.1 underlines the point that the creation and distribution of value added are two<br />
sides of the same equation. Hence, both the Addition and Subtraction methods should<br />
generate the same result. They are often used <strong>to</strong>gether <strong>to</strong> validate that value added has<br />
been calculated accurately.<br />
Figure 4.1 : Creation and Distribution of Value Added<br />
SALES<br />
10 SPRING Singapore<br />
Creation of<br />
Value Added<br />
VALUE<br />
ADDED<br />
PURCHASES<br />
E.g.<br />
- Raw materials<br />
- Utilities<br />
- Rental<br />
Distribution of Value Added<br />
Profit<br />
Labour cost<br />
Depreciation<br />
Interest<br />
Tax<br />
Dividends<br />
Retained Earnings
Value Added Statement<br />
Figure 4.2 shows an example of a value added statement, and underlines how the information<br />
can be easily obtained from a profit and loss statement.<br />
Figure 4.2 : Profit and Loss Statement and Value Added Statement<br />
Profit and loss statement Value added statement<br />
Sales<br />
Less: Cost of sales<br />
Opening s<strong>to</strong>ck<br />
Purchases<br />
Less: Closing s<strong>to</strong>ck<br />
Gross profit<br />
Non-operating income<br />
Less: Operating expenses<br />
Advertising and marketing<br />
Audit fees<br />
Depreciation<br />
Direc<strong>to</strong>rs’ fees<br />
Rental<br />
Repairs and maintenance<br />
Staff costs<br />
Staff welfare and development<br />
Foreign worker levy<br />
Interest<br />
Office and other supplies<br />
Utilities<br />
Transport, postage &<br />
communications<br />
Other operating expenses<br />
Total operating expenses<br />
Non-operating expenses<br />
Profit before tax<br />
Income tax expense<br />
Profit after tax<br />
$<br />
450,000<br />
200,000<br />
300,000<br />
(120,000)<br />
380,000<br />
70,000<br />
10,000<br />
5,000<br />
8,000<br />
2,000<br />
5,000<br />
8,000<br />
500<br />
36,000<br />
4,000<br />
300<br />
2,000<br />
800<br />
3,200<br />
2,000<br />
200<br />
77,000<br />
1,000<br />
2,000<br />
(130)<br />
1,870<br />
Sales<br />
Less: Change in inven<strong>to</strong>ry level<br />
Opening s<strong>to</strong>ck<br />
Closing s<strong>to</strong>ck<br />
Gross output<br />
Less: Purchase of goods and<br />
services<br />
Purchases of s<strong>to</strong>ck<br />
Services and administrative<br />
expenses<br />
Value added<br />
Distribution of value added:<br />
Staff costs and other benefits<br />
Depreciation<br />
Interest<br />
Tax<br />
Profit before tax<br />
Less: Non-operating income<br />
Add: Non-operating expenses<br />
Value added<br />
4 What Is Value Added?<br />
A <strong>Guide</strong> <strong>to</strong> <strong>Productivity</strong> <strong>Measurement</strong><br />
$<br />
450,000<br />
(200,000)<br />
120,000<br />
370,000<br />
(300,000)<br />
(27,700)<br />
42,300<br />
45,000<br />
2,000<br />
2,000<br />
300<br />
2,000<br />
(10,000)<br />
1,000<br />
42,300<br />
11
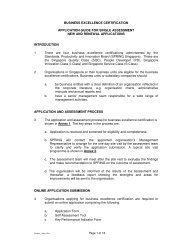
Profitability and <strong>Productivity</strong><br />
Organisations commonly regard profits as a<br />
key measure of their success. Using profits<br />
as a measure may seem <strong>to</strong> imply that the<br />
organisation will benefit more if costs such as<br />
salaries and depreciation for capital reinvestment<br />
are reduced. However, lowering salaries <strong>to</strong><br />
increase profits tends <strong>to</strong> lead <strong>to</strong> conflicts in<br />
the relationship between employees and<br />
management. Minimising capital investment<br />
often has a negative impact on the efficiency<br />
of operations, and eventually affects profits.<br />
Therefore, increasing profits by reducing such<br />
expenses is only a short-term measure.<br />
The only viable way <strong>to</strong> increasing profits in a<br />
sustainable manner is <strong>to</strong> increase the economic<br />
pie or value added through higher productivity.<br />
This can be done with better cooperation from<br />
employees, higher investment in capital, and<br />
optimal use of capital.<br />
12 SPRING Singapore<br />
In return for your employees’ efforts, your<br />
organisation should share the additional<br />
wealth generated in the form of higher wages<br />
and improved benefits. This will reinforce<br />
and encourage them <strong>to</strong> further improve their<br />
performance.<br />
To sum up, productivity is key <strong>to</strong> sustaining<br />
profits in the long run.
5<br />
AN INTEGRATED APPROACH TO<br />
PRODUCTIVITY MEASUREMENT<br />
3 The IMPACT Framework<br />
As manpower is the key resource in many organisations, labour productivity (or value<br />
added per worker) is often used as the overall measurement for productivity. However,<br />
a single indica<strong>to</strong>r does not provide a complete picture of your organisation’s productivity<br />
performance. Rather, an integrated approach <strong>to</strong> productivity measurement should be adopted.<br />
What is an Integrated Approach <strong>to</strong> <strong>Productivity</strong> <strong>Measurement</strong>?<br />
In an integrated approach <strong>to</strong> productivity measurement, the various dimensions of an<br />
organisation’s operations are linked <strong>to</strong> show how each of them affects overall performance.<br />
Figure 5.1 shows an example of a family of interlinked measures used by a retailer.<br />
Figure 5.1 : Example of an Integrated Approach <strong>to</strong> <strong>Productivity</strong> <strong>Measurement</strong><br />
The key management indica<strong>to</strong>rs at the <strong>to</strong>p are broad indica<strong>to</strong>rs that relate <strong>to</strong> the organisation’s<br />
goals. Such indica<strong>to</strong>rs are usually financial, value added-based ratios that provide management<br />
with information on productivity and profitability. They are then broken down in<strong>to</strong> activity<br />
and operational indica<strong>to</strong>rs.<br />
A <strong>Guide</strong> <strong>to</strong> <strong>Productivity</strong> <strong>Measurement</strong><br />
13
Activity indica<strong>to</strong>rs provide a snapshot of costs, activity levels and resource utilisation rates,<br />
which are particularly useful for middle and higher management.<br />
Operational indica<strong>to</strong>rs are usually physical ratios that address the operational aspects that<br />
need <strong>to</strong> be moni<strong>to</strong>red and controlled.<br />
Why Adopt an Integrated Approach?<br />
An integrated approach <strong>to</strong> productivity measurement:<br />
• Provides a comprehensive picture of the organisation’s performance<br />
• Highlights the relationships among different ratios and units, and allows the organisation<br />
<strong>to</strong> analyse the fac<strong>to</strong>rs contributing <strong>to</strong> its productivity performance<br />
• Helps diagnose problem areas and suggests appropriate corrective actions<br />
• Enables the organisation <strong>to</strong> moni<strong>to</strong>r its performance over time and against the performance<br />
of other organisations<br />
Using the example shown in Figure 5.2, labour productivity (value added per worker) may<br />
be broken down in<strong>to</strong> two ratios — sales per employee and value added-<strong>to</strong>-sales ratio — for<br />
a better understanding of the fac<strong>to</strong>rs that affect it.<br />
Figure 5.2 : Analysis of Labour <strong>Productivity</strong><br />
A decline in labour productivity could be due <strong>to</strong> a lower sales per employee ratio as a<br />
result of a new competi<strong>to</strong>r, or a lower value added-<strong>to</strong>-sales ratio as a result of an increase<br />
in product costs. The analysis helps management <strong>to</strong> better decide on the appropriate action<br />
<strong>to</strong> take in order <strong>to</strong> improve productivity.<br />
14 SPRING Singapore
5 An Integrated Approach To <strong>Productivity</strong> <strong>Measurement</strong><br />
How <strong>to</strong> Develop an Integrated <strong>Productivity</strong> <strong>Measurement</strong> System<br />
Figure 5.3 illustrates the steps for developing an integrated productivity measurement<br />
system. The structure of the measurement system varies, depending on the needs and<br />
operations of the organisation.<br />
Figure 5.3 : Steps <strong>to</strong> Develop a <strong>Productivity</strong> <strong>Measurement</strong> System<br />
Step 1: Form a <strong>Measurement</strong> Task Force<br />
<strong>Productivity</strong> measurement is an integral part of productivity management. A dedicated<br />
task force should be formed <strong>to</strong> develop a productivity measurement system. The task<br />
force could be led by a member of senior management or a productivity manager, with<br />
representatives from different departments and levels who have good knowledge of the<br />
organisation’s operations and processes.<br />
Various stakeholders, such as cus<strong>to</strong>mers and suppliers, should be engaged or consulted<br />
<strong>to</strong> obtain buy-in and <strong>to</strong> ensure that their needs are taken in<strong>to</strong> consideration. Employees<br />
should also be involved in the design and implementation of productivity measures <strong>to</strong> give<br />
them a sense of ownership in the process.<br />
Step 2: Determine What <strong>to</strong> Measure<br />
“ Not everything that counts can be counted, and not everything<br />
that can be counted counts.<br />
“ - Albert Einstein<br />
The productivity measurement task force should first define the objectives of measurement.<br />
A <strong>Guide</strong> <strong>to</strong> <strong>Productivity</strong> <strong>Measurement</strong><br />
15
At the management level, the objectives are based on the organisation’s overall productivity<br />
goals and key productivity levers. <strong>Productivity</strong> levers are areas or actions that an organisation<br />
can focus on <strong>to</strong> improve productivity significantly. Examples include obtaining higher value<br />
from products through service excellence and optimisation of labour through effective<br />
deployment of manpower.<br />
Objectives at the organisational and management levels are cascaded down <strong>to</strong> the objectives<br />
of specific functions and individuals. Figure 5.4 shows examples of objectives of the various<br />
functions and their relationship with the organisation’s productivity goals.<br />
Figure 5.4 : Examples of <strong>Productivity</strong> Goals and Objectives<br />
Step 3: Develop Indica<strong>to</strong>rs<br />
The following should be considered in developing productivity measures:<br />
Indica<strong>to</strong>rs should measure something significant<br />
Only elements that have a significant impact on the organisation’s performance and its key<br />
productivity levers should be measured.<br />
Indica<strong>to</strong>rs should be meaningful and action-oriented<br />
Indica<strong>to</strong>rs must be relevant <strong>to</strong> the organisation’s objectives and operations. They should<br />
explain the pattern of performance and signal a course of action.<br />
Component parts of the indica<strong>to</strong>rs should be reasonably related<br />
The output (numera<strong>to</strong>r) and the input (denomina<strong>to</strong>r) should correspond with each other.<br />
Indica<strong>to</strong>rs used by the industry or benchmarked organisations<br />
Tracking indica<strong>to</strong>rs used by other organisations in the same industry or organisations that<br />
you have benchmarked against helps <strong>to</strong> facilitate future comparisons of your organisation’s<br />
performance against others.<br />
16 SPRING Singapore
Reliability of data<br />
Data should be reliable and consistent. The indica<strong>to</strong>rs should provide an accurate reflection<br />
of what they are supposed <strong>to</strong> measure.<br />
Practicality<br />
Indica<strong>to</strong>rs should be easily unders<strong>to</strong>od by employees and practical <strong>to</strong> obtain.<br />
There are 10 key management indica<strong>to</strong>rs commonly used <strong>to</strong> gauge an organisation’s<br />
overall productivity performance. They measure the performance of key productivity levers<br />
as shown in Figure 5.5.<br />
Figure 5.5 : Key Management Indica<strong>to</strong>rs<br />
Details of the 10 indica<strong>to</strong>rs and other common productivity indica<strong>to</strong>rs used by the<br />
manufacturing and service sec<strong>to</strong>rs are given in the Annex. The productivity indica<strong>to</strong>rs<br />
listed are not restricted <strong>to</strong> the usual output per unit of input ratios. They include other<br />
performance indica<strong>to</strong>rs that measure the efficiency and effectiveness of the operations.<br />
Step 4: Design and Implement<br />
5 An Integrated Approach To <strong>Productivity</strong> <strong>Measurement</strong><br />
After selecting the appropriate indica<strong>to</strong>rs, the productivity measurement task force should:<br />
• Establish accountabilities and responsibilities for the provision and use of data<br />
• Link the indica<strong>to</strong>rs and determine how the performance of various departments affects<br />
the organisation’s overall performance<br />
• Decide how the indica<strong>to</strong>rs may be used in productivity improvement plans.<br />
A <strong>Guide</strong> <strong>to</strong> <strong>Productivity</strong> <strong>Measurement</strong><br />
17
The next step is <strong>to</strong> establish a system, using appropriate technology, <strong>to</strong> collect, analyse and<br />
report the performance of the indica<strong>to</strong>rs, taking in<strong>to</strong> account the needs of the employees<br />
providing and using the data.<br />
An effective productivity measurement system should be an integral part of your organisation’s<br />
daily operations and management information system. It should be flexible and adaptable<br />
<strong>to</strong> changing requirements.<br />
Adequate training should be provided <strong>to</strong> staff <strong>to</strong> ensure a common understanding of the<br />
objectives and measures used, how the system works and how the measures relate <strong>to</strong><br />
their work.<br />
Step 5: Moni<strong>to</strong>r and Review<br />
<strong>Productivity</strong> measurement is not a one-off project. The productivity measurement task<br />
force should review the effectiveness of the measurement system periodically and solicit<br />
feedback from users <strong>to</strong> further enhance the system and ensure its relevance.<br />
18 SPRING Singapore<br />
“ The only man I know who behaves sensibly is my tailor:<br />
he takes my measurements anew each time he sees me.<br />
The rest go on with their old measurements and expect me<br />
<strong>to</strong> fit them. “<br />
- George Bernard Shaw
6WHAT DO YOU DO WITH<br />
Conclusion<br />
PRODUCTIVITY MEASURES?<br />
<strong>Productivity</strong> measures allow you <strong>to</strong> moni<strong>to</strong>r the performance of your organisation and<br />
compare it against some standard <strong>to</strong> identify areas for improvement and actions <strong>to</strong> be<br />
taken. They also serve as a useful communication <strong>to</strong>ol <strong>to</strong> motivate employees and reinforce<br />
performance.<br />
<strong>Productivity</strong> Level and Growth<br />
Organisations should moni<strong>to</strong>r and analyse their productivity performance in terms of<br />
the productivity level measured by the various productivity indica<strong>to</strong>rs. <strong>Productivity</strong> levels<br />
reflect how efficiently and effectively an organisation’s resources are used. Comparisons of<br />
productivity levels must be made between similar entities, such as two companies within<br />
the same industry.<br />
In addition, organisations must track their productivity growth, which is an indica<strong>to</strong>r of the<br />
change in productivity level over time. <strong>Productivity</strong> growth indicates dynamism and the<br />
potential for achieving higher productivity levels in the future. It is expressed as a percentage.<br />
Comparison of Performance<br />
“ Without a standard there is no logical basis for making a<br />
decision or taking action.“<br />
- Joseph M. Juran<br />
To know how well your organisation is faring, you may compare and evaluate its productivity<br />
performance against targets or past performance.<br />
A comparison can also be made against your competi<strong>to</strong>rs using the Inter-Firm Comparison<br />
(IFC) <strong>to</strong>ol, as well as against benchmarks and best-in-class performers for further improvement.<br />
Inter-Firm Comparison<br />
Inter-Firm Comparison (IFC) studies involve comparisons of a common set of key productivity<br />
indica<strong>to</strong>rs identified for organisations in the same line of business. The identities of the<br />
A <strong>Guide</strong> <strong>to</strong> <strong>Productivity</strong> <strong>Measurement</strong><br />
19
organisations are not revealed <strong>to</strong> maintain confidentiality. Data provided by the organisations<br />
are aggregated and presented in terms of percentage changes, indices and ratios.<br />
Organisations may also compare their productivity performance against the industry<br />
average. Industry data for the manufacturing sec<strong>to</strong>r are available from statistics published<br />
by the Economic Development Board in its annual Report on the Census of Manufacturing<br />
Activities. Services sec<strong>to</strong>r data are available from the Economic Surveys Series published by<br />
the Singapore Department of Statistics. Industries are classified by the Singapore Standard<br />
Industrial Classification (SSIC), which is based on the basic principles used in international<br />
statistical standards <strong>to</strong> facilitate comparison with other countries.<br />
Benchmarking<br />
Benchmarking is a systematic process of comparing processes and performance against<br />
others, <strong>to</strong> improve business practices.<br />
Benchmarking may be performed internally by comparing similar operations or functions<br />
within an organisation, or externally against other organisations. These could include<br />
competi<strong>to</strong>rs or organisations with exemplary practices in other industries. Table 6.1 shows<br />
the common types of benchmarking used by organisations.<br />
Table 6.1 : Types of Benchmarking<br />
Type Definition<br />
Internal Compare similar activities within an organisation.<br />
Competitive Compare against direct competi<strong>to</strong>rs within the same industry.<br />
Functional / Process Compare against other organisations identified <strong>to</strong> be leaders<br />
of that particular function or process. Such organisations<br />
need not be from the same industry.<br />
Generic Compare against organisations recognised as having worldclass<br />
products, services or processes.<br />
Unlike IFC, which focuses on comparing indica<strong>to</strong>rs, benchmarking compares indica<strong>to</strong>rs<br />
and processes or functions that are critical <strong>to</strong> an organisation’s competitive advantage.<br />
Based on the benchmarking findings, organisations can put in place specific action plans<br />
<strong>to</strong> adapt and implement the best practices <strong>to</strong> improve their performance.<br />
20 SPRING Singapore
Use of <strong>Productivity</strong> Measures <strong>to</strong> <strong>Guide</strong> and Change Behaviour<br />
<strong>Productivity</strong> Measures as a Communication Tool<br />
<strong>Productivity</strong> measures may be used by management as a communication <strong>to</strong>ol <strong>to</strong> direct<br />
employees’ efforts <strong>to</strong>wards the common goal of improving productivity. The measures<br />
provide information on current performance, goals, and what it takes for the employees<br />
<strong>to</strong> reach them.<br />
<strong>Productivity</strong> Measures <strong>to</strong> Motivate and Reinforce Performance<br />
6 What Do You Do With <strong>Productivity</strong> Measures?<br />
<strong>Productivity</strong> measures quantify and facilitate an objective assessment of employees’<br />
performance. They provide information on performance gaps and help <strong>to</strong> identify the<br />
training needs of employees.<br />
To motivate and reinforce productivity performance, productivity measures may be used <strong>to</strong><br />
recognise and reward performance. This can be done by giving out awards <strong>to</strong> individuals<br />
or teams based on their contributions <strong>to</strong> productivity efforts.<br />
In addition, productivity measures play a key role in productivity gainsharing schemes.<br />
Based on a formula agreed upon by both management and the employees, a proportion<br />
of the value added or wealth created by the organisation is distributed <strong>to</strong> employees in<br />
the form of a bonus or incentive payout. <strong>Productivity</strong> gainsharing promotes teamwork and<br />
fosters a culture of continuous productivity improvement.<br />
Employees should have a clear understanding of how they are being appraised and the<br />
type of behaviour and performance that is recognised by the organisation.<br />
A <strong>Guide</strong> <strong>to</strong> <strong>Productivity</strong> <strong>Measurement</strong><br />
21
7<br />
CONCLUSION<br />
<strong>Productivity</strong> measurement is an important means <strong>to</strong> an end. It provides valuable information<br />
on how an organisation is performing, where it would like <strong>to</strong> be, and how it can achieve<br />
its goals.<br />
<strong>Productivity</strong> measures are only useful if they reflect the goals and objectives of the organisation,<br />
and used <strong>to</strong> bring about action and productivity improvements. This requires commitment<br />
from senior management, teamwork and participation from all employees.<br />
22 SPRING Singapore<br />
“ Data becomes information only when it is viewed in an idea<br />
or context. “<br />
- Edward de Bono
ANNEX<br />
Common <strong>Productivity</strong> Indica<strong>to</strong>rs<br />
Some indica<strong>to</strong>rs are commonly used by management <strong>to</strong> measure the overall productivity<br />
performance of an organisation. The indica<strong>to</strong>rs are shown in Table 1 in relation <strong>to</strong> the key<br />
productivity levers and objectives of measurement.<br />
The indica<strong>to</strong>rs should be analysed by taking in<strong>to</strong> account the organisation’s operation, and<br />
the performance of other indica<strong>to</strong>rs.<br />
Table 1 : 10 Key Management Indica<strong>to</strong>rs<br />
Indica<strong>to</strong>r Unit Formula What It<br />
Measures<br />
<strong>Productivity</strong><br />
1 Labour<br />
productivity<br />
Increase Sales<br />
2 Sales per<br />
employee<br />
$ Value<br />
added<br />
Number of<br />
employees1 $ Sales<br />
Number of<br />
employees 1<br />
Efficiency and<br />
effectiveness of<br />
employees in<br />
the generation of<br />
value added<br />
Efficiency and<br />
effectiveness<br />
of marketing<br />
strategy<br />
Significance of a<br />
Lower Indica<strong>to</strong>r<br />
Poor<br />
management<br />
of labour and/<br />
or other fac<strong>to</strong>rs<br />
which affect the<br />
efficiency and<br />
effectiveness of<br />
labour<br />
Inefficient or<br />
poor marketing<br />
Significance of a<br />
Higher Indica<strong>to</strong>r<br />
Efficient and<br />
effective<br />
utilisation and<br />
management<br />
of labour and<br />
other fac<strong>to</strong>rs <strong>to</strong><br />
generate value<br />
added<br />
Efficient or<br />
good marketing<br />
strategy<br />
Note<br />
1 Employees refer <strong>to</strong> all categories of employees, including working direc<strong>to</strong>rs / proprie<strong>to</strong>rs/ partners, unpaid family<br />
workers and part-time workers. Part-time workers should be converted <strong>to</strong> their full-time equivalent.<br />
A <strong>Guide</strong> <strong>to</strong> <strong>Productivity</strong> <strong>Measurement</strong><br />
23
Table 1 : 10 Key Management Indica<strong>to</strong>rs (Cont’d)<br />
24 SPRING Singapore<br />
Indica<strong>to</strong>r Unit Formula What It<br />
Measures<br />
Increase Output Per Unit Cost of Production<br />
3 Value added<strong>to</strong>-sales<br />
ratio<br />
% Value<br />
added<br />
Sales<br />
4 Profit margin % Operating<br />
profit<br />
5 Profit-<strong>to</strong>-value<br />
added ratio<br />
Optimise Use of Labour<br />
6 Labour cost<br />
competitiveness<br />
7 Labour cost<br />
per employee<br />
Sales<br />
% Operating<br />
profit<br />
Value<br />
added<br />
Times Value<br />
added<br />
Labour<br />
cost<br />
$ Labour<br />
costs<br />
Number of<br />
employees 1<br />
Proportion of<br />
sales created by<br />
the organisation<br />
over and above<br />
purchased<br />
materials and<br />
services<br />
Proportion of<br />
sales left <strong>to</strong> the<br />
organisation after<br />
deducting all<br />
costs<br />
Operating profit<br />
allocated <strong>to</strong><br />
the providers<br />
of capital as a<br />
proportion of<br />
value added<br />
Efficiency and<br />
effectiveness of<br />
the organisation<br />
in terms of its<br />
labour cost<br />
Average<br />
remuneration per<br />
employee<br />
Significance of a<br />
Lower Indica<strong>to</strong>r<br />
Inefficiency in the<br />
use of purchases,<br />
unfavourable<br />
prices for products<br />
and purchases,<br />
or poor control of<br />
s<strong>to</strong>cks<br />
Costs are <strong>to</strong>o high<br />
and are eroding<br />
profits<br />
Low sales and/<br />
or high costs,<br />
which need <strong>to</strong><br />
be rectified.<br />
However, it may<br />
just reflect labourintensiveness.<br />
Low levels of<br />
efficiency and<br />
effectiveness, or<br />
high wage rates<br />
not matched by<br />
efficiency and<br />
effectiveness<br />
Low remuneration<br />
<strong>to</strong> individual<br />
employees<br />
Significance of a<br />
Higher Indica<strong>to</strong>r<br />
Efficiency in use<br />
of purchases,<br />
favourable price<br />
differentials<br />
between products<br />
and purchases, or<br />
good control of<br />
s<strong>to</strong>cks<br />
Ability <strong>to</strong><br />
generate high<br />
returns from a<br />
given amount of<br />
sales<br />
Ability <strong>to</strong><br />
generate high<br />
sales and/<br />
or low costs.<br />
A favourable<br />
situation<br />
provided that<br />
employees are<br />
remunerated<br />
adequately<br />
High efficiency<br />
and effectiveness<br />
accompanied by<br />
reasonable wage<br />
rates<br />
High<br />
remuneration<br />
<strong>to</strong> individual<br />
employees<br />
Note<br />
1 Employees refer <strong>to</strong> all categories of employees, including working direc<strong>to</strong>rs / proprie<strong>to</strong>rs/ partners, unpaid family<br />
workers and part-time workers. Part-time workers should be converted <strong>to</strong> their full-time equivalent.
Table 1 : 10 Key Management Indica<strong>to</strong>rs (Cont’d)<br />
Indica<strong>to</strong>r Unit Formula What It<br />
Measures<br />
Optimise Use of Capital<br />
8 Sales per<br />
dollar of capital<br />
9 Capital<br />
intensity<br />
10 Capital<br />
productivity<br />
Times Sales<br />
Fixed<br />
assets 2<br />
$ Fixed<br />
assets 2<br />
Number of<br />
employees 1<br />
Times Value<br />
added<br />
Fixed<br />
assets 2<br />
Efficiency and<br />
effectiveness of<br />
fixed assets in<br />
the generation of<br />
sales<br />
Extent <strong>to</strong> which<br />
an organisation is<br />
capital-intensive<br />
Efficiency and<br />
effectiveness of<br />
fixed assets in<br />
the generation of<br />
value added<br />
ANNEX Common <strong>Productivity</strong> Indica<strong>to</strong>rs<br />
Significance of a<br />
Lower Indica<strong>to</strong>r<br />
Inefficient use of<br />
capital or poor<br />
marketing<br />
Significance of a<br />
Higher Indica<strong>to</strong>r<br />
Efficient capital<br />
utilisation or good<br />
marketing<br />
Labour-intensive Capital-intensive<br />
Inefficient asset<br />
utilisation or overinvestment<br />
in fixed<br />
assets<br />
Efficient utilisation<br />
of fixed assets<br />
Notes<br />
1 Employees refer <strong>to</strong> all categories of employees, including working direc<strong>to</strong>rs / proprie<strong>to</strong>rs/ partners, unpaid family<br />
workers and part-time workers. Part-time workers should be converted <strong>to</strong> their full-time equivalent.<br />
2 Fixed assets should be stated at net book value, and exclude work-in-progress.<br />
A <strong>Guide</strong> <strong>to</strong> <strong>Productivity</strong> <strong>Measurement</strong><br />
25
Tables 2 and 3 show other productivity indica<strong>to</strong>rs commonly used by the manufacturing<br />
and services sec<strong>to</strong>r (e.g. retail, food services and hospitality) <strong>to</strong> supplement the 10 key<br />
management indica<strong>to</strong>rs. The indica<strong>to</strong>rs listed are not restricted <strong>to</strong> the usual output per unit<br />
of input ratios. They include other performance indica<strong>to</strong>rs that measure the efficiency and<br />
effectiveness of the operations.<br />
Table 2: Common Indica<strong>to</strong>rs for the Manufacturing Sec<strong>to</strong>r<br />
Key <strong>Productivity</strong> Lever Indica<strong>to</strong>r Formula What It Measures<br />
Increase sales 1 Delivery-on-time No. of orders<br />
delivered on time<br />
Increase output per unit<br />
cost of production<br />
26 SPRING Singapore<br />
2 Return Material<br />
Authorisation (RMA)<br />
Turn Around Time<br />
(TAT)<br />
3 Innovation or idea<br />
conversion rate<br />
Total no. of orders<br />
delivered<br />
Time taken <strong>to</strong> handle<br />
RMA request (time<br />
taken from when<br />
RMA request is<br />
received <strong>to</strong> the<br />
time when RMA is<br />
resolved)<br />
No. of suggestions<br />
implemented<br />
Total no. of<br />
suggestions<br />
4 Cost-<strong>to</strong>-sales ratio Cost of goods sold<br />
Sales<br />
5 Defect rate No. of defects<br />
Optimise use of labour 6 Capability or flexibility<br />
of workforce<br />
Total no. of goods<br />
produced<br />
No. of roles or jobs<br />
per worker<br />
Total no. of roles or<br />
jobs<br />
Efficiency in<br />
delivering orders<br />
Efficiency in handling<br />
and resolving<br />
cus<strong>to</strong>mer requests,<br />
and level of cus<strong>to</strong>mer<br />
service<br />
Rate at which new<br />
ideas are assessed<br />
and implemented<br />
successfully through<br />
improvement<br />
initiatives<br />
Cost efficiency of<br />
producing goods<br />
relative <strong>to</strong> sales<br />
Effectiveness of<br />
quality control and<br />
system<br />
Ability of workforce<br />
<strong>to</strong> multi-task, and<br />
flexibility of the<br />
organisation <strong>to</strong><br />
deploy its manpower
Table 2: Common Indica<strong>to</strong>rs for the Manufacturing Sec<strong>to</strong>r (Cont’d)<br />
ANNEX Common <strong>Productivity</strong> Indica<strong>to</strong>rs<br />
Key <strong>Productivity</strong> Lever Indica<strong>to</strong>r Formula What It Measures<br />
Optimise use of labour 7 Employee variable<br />
pay-provision<br />
8 Product yield per<br />
employee<br />
Optimise use of capital 9 Manufacturing cycle<br />
time or throughput<br />
time<br />
10 Overall equipment<br />
effectiveness<br />
Table 3: Common Indica<strong>to</strong>rs for the Services Sec<strong>to</strong>r<br />
Amount of<br />
performance-related<br />
rewards<br />
Sales<br />
No. of good output<br />
No. of employees<br />
Time taken <strong>to</strong><br />
produce a product<br />
Availability x<br />
Performance x<br />
Quality<br />
Facilitates strategic<br />
decision-making<br />
related <strong>to</strong> variable<br />
pay levels<br />
Effectiveness of<br />
manufacturing<br />
process and<br />
productivity of<br />
employee<br />
Efficiency and<br />
effectiveness of<br />
manufacturing<br />
process<br />
Effectiveness of<br />
equipment in<br />
manufacturing a<br />
product<br />
Key <strong>Productivity</strong> Lever Indica<strong>to</strong>r Formula What It Measures<br />
Increase sales 1 Sales per cus<strong>to</strong>mer Sales<br />
2 Waiting time per meal<br />
or cus<strong>to</strong>mer served<br />
3 Compliment <strong>to</strong><br />
complaint ratio<br />
No. of cus<strong>to</strong>mers<br />
served<br />
Time taken from the<br />
point that cus<strong>to</strong>mer<br />
enters <strong>to</strong> the point an<br />
order is filled<br />
No. of compliments<br />
No. of complaints<br />
Efficiency and<br />
effectiveness of<br />
marketing strategy<br />
Efficiency in service<br />
delivery and level of<br />
cus<strong>to</strong>mer service<br />
Level of cus<strong>to</strong>mer<br />
service<br />
A <strong>Guide</strong> <strong>to</strong> <strong>Productivity</strong> <strong>Measurement</strong><br />
27
Table 3: Common Indica<strong>to</strong>rs for the Services Sec<strong>to</strong>r (Cont’d)<br />
Key <strong>Productivity</strong> Lever Indica<strong>to</strong>r Formula What It Measures<br />
Increase output per unit<br />
cost of production<br />
28 SPRING Singapore<br />
4 Cost per cus<strong>to</strong>mer Operating expenses<br />
5 Inven<strong>to</strong>ry turnover<br />
ratio<br />
Optimise use of labour 6 Employee <strong>to</strong> cus<strong>to</strong>mer<br />
ratio<br />
7 Investment in training<br />
per employee<br />
No. of cus<strong>to</strong>mers<br />
served<br />
Cost of sales<br />
Average inven<strong>to</strong>ry<br />
held during period<br />
No. of employees or<br />
servers<br />
No. of cus<strong>to</strong>mers<br />
Amount of training<br />
expenses<br />
No. of employees<br />
Optimise use of capital 8 Equipment efficiency No. of jobs done<br />
9 Income or expenses<br />
per square metre<br />
Total working hours<br />
Income or expenses<br />
Total floor area<br />
10 Cus<strong>to</strong>mer-<strong>to</strong>-seat ratio No. of cus<strong>to</strong>mers<br />
Total no. of seats<br />
Cost effectiveness in<br />
service delivery<br />
Effectiveness<br />
of inven<strong>to</strong>ry<br />
management<br />
Service quality and<br />
employee efficiency<br />
in service delivery<br />
Level of investment<br />
in training. This can<br />
also be measured in<br />
terms of the number<br />
of training hours per<br />
employee.<br />
Efficiency and<br />
effectiveness of<br />
equipment such<br />
as dishwasher and<br />
baking equipment for<br />
restaurants, and bedframe<br />
lifting system<br />
for hotels.<br />
Efficiency of space<br />
utilisation<br />
Efficiency of space<br />
utilisation<br />
For more information on productivity and self-help <strong>to</strong>ols, visit the<br />
<strong>Productivity</strong>@Work website at www.enterpriseone.gov.sg
SPRING Singapore<br />
Solaris, 1 Fusionopolis Walk, #01-02 South Tower, Singapore 138628<br />
Tel: +65 6278 6666 • Fax: +65 6278 6667<br />
www.spring.gov.sg