CO - Summer School Alpbach 2012
CO - Summer School Alpbach 2012
CO - Summer School Alpbach 2012
Create successful ePaper yourself
Turn your PDF publications into a flip-book with our unique Google optimized e-Paper software.
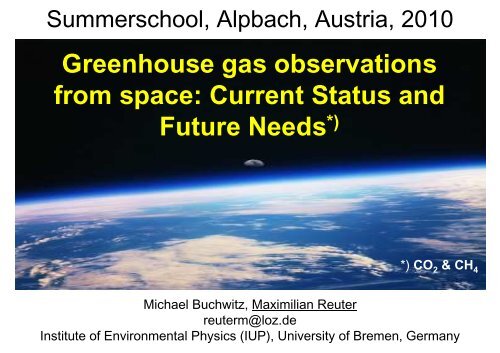
<strong>Summer</strong>school, <strong>Alpbach</strong>, Austria, 2010<br />
Greenhouse gas observations<br />
from space: Current Status and<br />
Future Needs *)<br />
*) <strong>CO</strong> 2 & CH 4<br />
Michael Buchwitz, Maximilian Reuter<br />
reuterm@loz.de<br />
Institute of Environmental Physics (IUP), University of Bremen, Germany
Outline<br />
• Why greenhouse gas observations from space ?<br />
• Measurement techniques<br />
• Existing and planned satellites<br />
= Current status and future needs<br />
2
Fundamentals<br />
3
The Greenhouse Treibhauseffekt Effect<br />
-18°C
The Greenhouse Treibhauseffekt Effect<br />
+15°C
30%<br />
Trenberth et al., 2009<br />
23%<br />
7%<br />
47%<br />
Treibhauseffekt<br />
100%<br />
23%<br />
70%
The natural Treibhauseffekt: Greenhouse TreibhausgaseEffect<br />
Treibhausgas<br />
Wasserdampf (H2O)<br />
Kohlendioxid (<strong>CO</strong>2)<br />
Ozon (O3)<br />
Lachgas (N2O)<br />
Methan (CH4)<br />
Beitrag am natürlichen<br />
Treibhauseffekt<br />
62%<br />
22%<br />
7%<br />
4%<br />
2.5%<br />
Atmosphärischer Anteil<br />
(Säulenmittel)<br />
4000ppm<br />
380ppm<br />
0.3ppm<br />
0.3ppm<br />
1.7ppm
The anthropogenic Treibhauseffekt: Greenhouse Treibhausgase Effect<br />
Treibhausgas<br />
Wasserdampf (H2O)<br />
Kohlendioxid (<strong>CO</strong>2)<br />
Ozon (O3)<br />
Lachgas (N2O)<br />
Methan (CH4)<br />
Beitrag am anthropogenen<br />
Treibhauseffekt<br />
nur indirekt<br />
55%<br />
10% (indirekt)<br />
5%<br />
18%<br />
Atmosphärischer Anteil<br />
(Säulenmittel)<br />
4000ppm<br />
380ppm<br />
0.3ppm<br />
0.3ppm<br />
1.7ppm
www.globalwarmingart.com<br />
Treibhauseffekt
0.6µm, 0.8µm, 1.6µm<br />
Solare Einstrahlung<br />
Treibhauseffekt<br />
Thermische Ausstrahlung<br />
10.8µm<br />
6.2µm
1896 Svante Arrhenius:<br />
Verdopplung <strong>CO</strong> 2<br />
→ 2.1°C<br />
2007 IPCC:<br />
Verdopplung <strong>CO</strong> 2<br />
→ 2.0-4.5°C<br />
C<br />
∆T~∆F~ ln<br />
C0<br />
Treibhauseffekt: Anthropogen<br />
„Der Anstieg des <strong>CO</strong> 2 wird zukünftigen Menschen erlauben,<br />
unter einem wärmeren Himmel zu leben“<br />
Svante Arrhenius, (de.wikipedia.org)<br />
www.globalwarmingart.com
Radiative forcing<br />
(~0.8 o C)<br />
<strong>CO</strong> 2 and CH 4 main contributers to global warming !<br />
IPCC 2007<br />
12
-10000 Year<br />
Past & present observations<br />
2005<br />
Some consequences:<br />
~ +0.8 K<br />
~ +20 cm<br />
IPCC 2007<br />
13
Why greenhouse gas observations<br />
from space?<br />
14
Our Future ?<br />
Global observations of atmospheric <strong>CO</strong> 2 and CH 4 combined with (inverse) modeling<br />
needed to deliver important missing information on GHG sources & sinks !<br />
Cost effective solution: Satellites ! 15
Quelle: Physics Today<br />
<strong>CO</strong> 2 sources and sinks<br />
http://www.carboscope.eu/img/carbon_cycle_fig2.png<br />
16
Missing sink:<br />
-1 GtC/yr<br />
Tropics:<br />
- 2 GtC/yr<br />
(net 0 instead of<br />
source)?<br />
NH land:<br />
+1 GtC/yr<br />
(weaker sink)?<br />
Where is the <strong>CO</strong> 2 disappearing ?<br />
Stephens et al., Science , 2007<br />
17
Mauna Loa<br />
Charles Keeling,<br />
1958<br />
<strong>CO</strong> 2 surface observations<br />
Oil crisis, 1973<br />
El Nino, 1997<br />
Status: Nov 2009<br />
18
<strong>CO</strong> 2 fluxes from surface observations<br />
Surface <strong>CO</strong> 2 network<br />
http://www.cmdl.noaa.gov/ccgg/globalview/<br />
TransCom 3 regions<br />
TransCom 3 regional<br />
<strong>CO</strong> 2 flux inversions<br />
Gurney et al., Nature, 2002<br />
Very accurate but<br />
sparse<br />
Information<br />
content sources &<br />
sinks (fluxes):<br />
Large regions<br />
only (continents,<br />
ocean basins)<br />
Large<br />
uncertainties<br />
(often +/- 100%)<br />
19
Global by source category<br />
Methane sources<br />
Regionally, the uncertainties are even much larger !<br />
Wetlands<br />
Rice<br />
Ruminants<br />
Coal mining 20
Methane: Recent surface observations<br />
Unexpected and<br />
poorly understood<br />
increase<br />
?<br />
21
What about anthopogenic <strong>CO</strong> 2 emissions ?<br />
How accurate are reported power plant emissions ?<br />
22
What about anthopogenic <strong>CO</strong> 2 emissions ?<br />
How accurate are reported power plant emissions ?<br />
Conclusion:<br />
• Need for multiple redundant<br />
independent & transparent<br />
emission estimation procedures<br />
23
Need for monitoring anthropogenic <strong>CO</strong> 2 emissions<br />
Large local sources: emissions highly uncertain – satellites can improve this<br />
24
Need for monitoring anthropogenic CH 4 emissions<br />
(…)<br />
25
Important open questions<br />
… w.r.t. the sources and sinks of <strong>CO</strong> 2 and methane are for example:<br />
Who / what emits how much ?<br />
(Sources)<br />
Are the reported emissions correct ?<br />
How much <strong>CO</strong> 2 will be taken up by<br />
forests and the oceans ? (Sinks)<br />
How will the sinks behave in the<br />
future when the climate is different ?<br />
Will sinks turn into sources ?<br />
How much methane will be released<br />
by melting permafrost areas ?<br />
26
Merit of satellite observations of <strong>CO</strong> 2 (similar for CH 4)<br />
Rayner & O‘Brien, GRL, 2001<br />
Global <strong>CO</strong> 2 flux uncertainty<br />
~ 6 GtC/yr<br />
Reduced to ~ 3 GtC/yr<br />
using surface stations<br />
Satellites can improve this if<br />
sensitive to PBL and if<br />
uncertainty < 2 ppm (0.5%)<br />
for monthly 8 o x10 o columnaveraged<br />
<strong>CO</strong> 2 („X<strong>CO</strong> 2 “)<br />
27
Measurement techniques<br />
28
Viewing Geometries<br />
Satellite Observation Geometries<br />
Nadir Limb Occultation<br />
SCIAMACHY,<br />
AIRS, IASI, TES,<br />
GOSAT, O<strong>CO</strong>-2,<br />
CarbonSat,<br />
A-S<strong>CO</strong>PE,<br />
MERLIN,<br />
ASCENDS, …<br />
Most relevant for GHG<br />
source / sink<br />
application<br />
SCIAMACHY,<br />
MIPAS, …<br />
SCIAMACHY,<br />
ACE-FTS, …<br />
29
SCIAMACHY,<br />
GOSAT, O<strong>CO</strong>,<br />
CarbonSat, …<br />
Measurement Techniques<br />
Measurement Techniques<br />
Passive<br />
TOVS, IMG,<br />
AIRS, IASI,<br />
TES, MIPAS, …<br />
Active<br />
Solar Thermal Laser<br />
Most relevant for GHG<br />
source / sink application<br />
A-S<strong>CO</strong>PE,<br />
MERLIN,<br />
ASCENDS, …<br />
Most relevant for GHG<br />
source / sink application 30
Reflected solar (NIR/SWIR) vs thermal (TIR)<br />
Thermal emission NIR absorption<br />
Sensitive to<br />
mid/upper<br />
troposphere<br />
Active<br />
Passive<br />
Sensitive to<br />
near-surface<br />
GHG<br />
concentrations<br />
31
Estimated uncertainty reduction of (weekly) <strong>CO</strong> 2 surface fluxes<br />
Surface network<br />
AIRS<br />
GOSAT O<strong>CO</strong><br />
High<br />
error<br />
reduction<br />
= Low<br />
error<br />
Low<br />
error<br />
reduction<br />
32<br />
Breon and Ciais, C. R. Geoscience, 2010
Measurement principle „Solar backscatter“<br />
R o<br />
R = R o33
R o<br />
Measurement principle (cont.)<br />
c = gas concentration [molecules/cm 3 ]<br />
l = length of light path [cm]<br />
x = gas absorption cross-section [cm 2 /molecule]<br />
R = R o exp(-clx)<br />
34
Measurement principle (cont.)<br />
35
Issue: Light path - clouds & aerosols<br />
Bril et al., Applied Optics, 2007<br />
SCIAMACHY PMD1<br />
36
Overview ESA CCI Project „GHG-cci“<br />
SCIAMACHY/ENVISAT<br />
CH 4<br />
Global satellite observations<br />
Global information on near-surface <strong>CO</strong> 2 & CH 4<br />
?<br />
<strong>CO</strong> 2<br />
Global observations<br />
<strong>CO</strong> 2<br />
?<br />
TANSO/GOSAT<br />
CH 4<br />
Reference<br />
observations<br />
Upper layer<br />
<strong>CO</strong> 2 & CH 4<br />
AIRS,<br />
IASI,<br />
TES,<br />
MIPAS,<br />
SCIA/occ,<br />
ACE-FTS,<br />
…<br />
Validation<br />
Improved information on<br />
GHG sources & sinks<br />
Calibration (L 0-1)<br />
Calibrated radiances<br />
Retrieval<br />
(L 1-2)<br />
Atmospheric GHG<br />
distributions<br />
Inverse<br />
modelling,<br />
CCDAS<br />
37
Current Satellite Missions<br />
38
SCIAMACHY Scanning Imaging<br />
Absorption Spectrometer for<br />
Atmospheric CHartographY<br />
SCIAMACHY on ENVISAT<br />
39
Tropospheric data products from SCIAMACHY/nadir<br />
... and<br />
more.<br />
40
SCIAMACHY nadir spectrum<br />
Buchwitz, 2000; Schneising et al., 2008, 2009<br />
41
<strong>CO</strong> 2 vertical columns<br />
42
Column-averaged mole fraction: X<strong>CO</strong> 2 (ppm)<br />
+/- 10% +/- 1.5%<br />
Buchwitz et al., ACP, 2005<br />
X<strong>CO</strong> 2 (ppm) = <strong>CO</strong> 2 -column / AIR-column * 10 6<br />
AIR-column = O 2 -column / 0.2095<br />
Schneising et al., ACP, 2008<br />
43
SCIAMACHY Carbon Dioxide & Methane<br />
Buchwitz et al., ACP, 2007; Schneising et al., ACP, 2008, 2009<br />
ENVISAT<br />
44
SCIAMACHY methane & methane emissions<br />
Bergamaschi et al., JGR, 2009<br />
… the SCIAMACHY data put strong<br />
constraints on the smaller-scale spatial<br />
distribution of emissions, while remote<br />
surface measurements mainly constrain the<br />
emissions of larger regions.<br />
Bloom et al., Science, 2010<br />
SCIAMACHY CH 4 , groundwater depth, skin T<br />
Two main application areas:<br />
• Improved emission inventories (for different categories, e.g., wetlands, rice, …)<br />
• Improved process understanding (e.g., land biosphere & related emissions)<br />
Better climate prediction, …<br />
45
Challenging !<br />
Inverse modelling:<br />
Observation – Model<br />
differences interpreted as<br />
model surface flux errors.<br />
Model transport errors !?<br />
Biases satellite data !?<br />
Key requirement:<br />
Avoid systematic biases !<br />
Required relative accuracy *) :<br />
User Requirements<br />
SCIAMACHY<br />
+/- 7 ppm<br />
• X<strong>CO</strong> 2 : < 0.3% (1 ppm) (e.g., Chevallier et al., JGR, 2007)<br />
• XCH 4 : < 0.6% (10 ppb) (e.g., Meirink et al., ACP, 2006)<br />
*) for spatio-temporal averages, e.g., monthly, few deg x few deg<br />
G<strong>CO</strong>S (accuracy RMS): <strong>CO</strong> 2 column: < 1%, CH 4 column: < 2%<br />
CarbonTracke<br />
r<br />
46
High resolution nadir spectra & derivatives<br />
Info on <strong>CO</strong> 2<br />
column<br />
(issue: clouds<br />
& aerosols)<br />
Info on clouds<br />
& aerosols<br />
Info on clouds<br />
& aerosols<br />
47
TANSO-FTS Spectra<br />
GOSAT<br />
23 Jan 2009<br />
X<strong>CO</strong> 2<br />
TANSO-CAI Images<br />
XCH 4<br />
TANSO-FTS Scan Pattern<br />
Kuze et al., 2009<br />
JAXA & NIES GOSAT<br />
48<br />
web sites
Future Satellite Missions<br />
49
Orbiting Carbon Observatory (O<strong>CO</strong>)<br />
O 2 A-band <strong>CO</strong> 2 1.61μm <strong>CO</strong> 2 2.06 μm<br />
Clouds/Aerosols,<br />
Surface Pressure<br />
Glint Spot<br />
Ground Track<br />
Local Nadir<br />
Column <strong>CO</strong> 2<br />
Clouds/Aerosols,<br />
H 2 O,<br />
Temperature<br />
Space-based X <strong>CO</strong>2 measurements<br />
with precisions of 1–2 ppm (0.3–<br />
0.5%) on regional scales will:<br />
• Resolve pole to pole X <strong>CO</strong>2<br />
gradients on regional scales<br />
• Resolve the X <strong>CO</strong>2 seasonal cycle<br />
in the Northern Hemisphere<br />
• Improve constraints on <strong>CO</strong> 2 fluxes<br />
(sources and sinks) compared to<br />
the current knowledge<br />
– Reduce regional scale flux<br />
uncertainties from >2000 gC m -2<br />
yr -1 to < 200 gC m -2 yr -1<br />
– Reduce continental scale flux<br />
uncertainties below 30 gC m -2 yr -<br />
1<br />
Launch in Feb 2009 failed<br />
Reflight Feb 2013 („O<strong>CO</strong>-2“, carbon copy of O<strong>CO</strong>) 50
Laser: A-S<strong>CO</strong>PE, ASCENDS, MERLIN, …<br />
A-S<strong>CO</strong>PE<br />
• <strong>CO</strong> 2:<br />
• A-S<strong>CO</strong>PE: Proposed to ESA for EE7; not selected because of technical issues<br />
• ASCENDS: Several concepts under study in the US. Launch 2020 ?<br />
• CH 4:<br />
• German-French mission („MERLIN“): In Phase 0. Launch 2014 ? 3 year mission.<br />
51
GHG satellite missions with PBL sensitivity<br />
52
Carbon Monitoring Satellite – Proposed for EE8<br />
CarbonSat<br />
Global <strong>CO</strong> 2 and CH 4 from space<br />
NOAA<br />
CarbonTracker<br />
53
CarbonSat Daily Orbital Coverage<br />
• X<strong>CO</strong> 2 & XCH 4<br />
• 500 km swath<br />
• 2 km x 2 km pixel<br />
• 250 meas. per 0.3 s<br />
6 million cloud free<br />
observations / day !<br />
Bovensmann et al., 2010<br />
Clear Sky Fraction<br />
GOSA<br />
T<br />
O<strong>CO</strong><br />
CarbonSat<br />
Miller et al., 2007<br />
54
CarbonSat enables new important application areas:<br />
<strong>CO</strong> 2 and CH 4 emission „hot spot“ detection and monitoring (power plants, …)<br />
55
CarbonSat: <strong>CO</strong> 2 emission hot spot targets<br />
Coal-fired power plants<br />
Belchatov, Poland<br />
(~35 Mt<strong>CO</strong> 2 /year)<br />
Jänschwalde, Germany<br />
(~27 Mt<strong>CO</strong> 2 /year)<br />
Kendal, South Africa<br />
(~27 Mt<strong>CO</strong> 2 /year)<br />
Volcanoes<br />
Spinetti et al., 2008<br />
Aircraft obs. AVIRIS<br />
Pu`u`O`o @ Kilauea56
Oda and Maksyutov<br />
High-resolution <strong>CO</strong> 2 emission maps<br />
Mt<strong>CO</strong> 2/year<br />
50<br />
40<br />
30<br />
20<br />
10<br />
0<br />
57
CarbonSat: Bovensmann et al., 2010<br />
58
CarbonSat: Simulation of power plant <strong>CO</strong> 2 plume<br />
Emission: 13 Mt<strong>CO</strong>2/year<br />
(„moderate“; many power plants<br />
emit 20-35 Mt<strong>CO</strong> 2 /year)<br />
Bovensmann et al., AMT, 2010<br />
Max.:<br />
+13%<br />
Max.:<br />
+3%<br />
Emission uncertainty single overpass<br />
(+/- 2 ppm X<strong>CO</strong> 2 error, u = 1 m/s):<br />
+/- 0.8 Mt<strong>CO</strong> 2 /year (1-sigma)<br />
Approx. proportional to wind speed u &<br />
statistical measurement error<br />
59
CarbonSat: Methane @ high latitudes<br />
? ?<br />
CarbonSat sun-glint mode allows observation of methane in<br />
vulnerable high latitude regions including Arctic sea and shelf<br />
areas. Very difficult with SCIAMACHY & GOSAT. Not possible with O<strong>CO</strong>.<br />
60
CarbonSat: CH 4 emission hot spot targets<br />
Oil and gas fields<br />
Seeps<br />
Leifer et al., 2006<br />
Pipelines incl. compressor stations<br />
Landfills / Waste<br />
Mud volcanoes<br />
Mazzini et al., 2007<br />
61
Comparison of PBL sensitive GHG satellite missions<br />
Application area<br />
& other criteria<br />
Regional <strong>CO</strong> 2<br />
fluxes<br />
Regional CH 4<br />
fluxes<br />
<strong>CO</strong> 2 „hot spots“<br />
(eg power plants)<br />
CH 4 „hot spots“<br />
(eg oil fields)<br />
Technical<br />
maturity<br />
Daytime<br />
Day & night<br />
SCIAMACHY GOSAT O<strong>CO</strong> Sentinel 5<br />
Precursor<br />
CH 4 Laser<br />
(MERLIN)<br />
CarbonSat<br />
62
CarbonSat Web Site<br />
http://www.iup.uni-bremen.de/carbonsat/ 63
Good luck with your projects !<br />
Animations showing 7 years of SCIAMACHY <strong>CO</strong> 2 and CH 4<br />
64


