TimeMachines: The Future of Debuggers - Green Hills Software
TimeMachines: The Future of Debuggers - Green Hills Software
TimeMachines: The Future of Debuggers - Green Hills Software

Create successful ePaper yourself
Turn your PDF publications into a flip-book with our unique Google optimized e-Paper software.
oration<br />
ur goal<br />
directly<br />
ge, the<br />
ource.<br />
logy,<br />
products<br />
October 2006 www.rtcmagazine.com<br />
<strong>The</strong> magazine <strong>of</strong> record for the embedded computing industry<br />
<strong>TimeMachines</strong>:<br />
S<strong>of</strong>twareTools&Techniques<br />
<strong>The</strong> <strong>Future</strong> <strong>of</strong> <strong>Debuggers</strong><br />
<strong>The</strong>re are a wide variety <strong>of</strong> problems in s<strong>of</strong>tware development that<br />
most debuggers don’t allow you to easily fix. Real-time trace and<br />
debuggers that run backward as well as forward can help ease this<br />
pain and lead to a much more efficient debugging environment.<br />
by Michael Lindahl<br />
<strong>Green</strong> <strong>Hills</strong> S<strong>of</strong>tware<br />
Getting a product to market earlier<br />
can mean the difference between<br />
wild success and complete failure<br />
majority <strong>of</strong> this time are difficult to reproduce<br />
or only occur under certain circumstances.<br />
Sometimes the bugs only occur<br />
for a device s<strong>of</strong>tware project. Yet many on the tester’s machine; sometimes the<br />
projects are delayed for s<strong>of</strong>tware quality bugs can’t be reproduced in the lab—but<br />
reasons, and even if they are not delayed, these bugs must be fixed before a reliable<br />
the schedules are <strong>of</strong>ten padded to allow product can be shipped.<br />
for unexpected bumps and bugs in the Whereas simple bugs can be fixed by<br />
ies providing road solutions to shipping now the s<strong>of</strong>tware.<br />
running them in the debugger, stepping<br />
n into products, technologies What is the and number companies. one Whether factor your that goal de- is to research through the latest the code and understanding the<br />
ion Engineer, lays or jump s<strong>of</strong>tware to a company's projects technical and page, prevents the goal them <strong>of</strong> Get Connected flow, these is to hard put you to reproduce bugs take the<br />
ou require for whatever type <strong>of</strong> technology,<br />
from shipping earlier? Once the s<strong>of</strong>tware majority <strong>of</strong> debugging time and are very<br />
nd products you are searching for.<br />
is written and integration and testing have difficult to fix because the bug cannot be<br />
begun, only one thing prevents the prod- easily reproduced with the debugger atuct<br />
from shipping—bugs. At this point, the tached. This leads to a very inefficient, trial-<br />
vast majority <strong>of</strong> a s<strong>of</strong>tware development and-error process where engineers specu-<br />
team’s time is spent debugging s<strong>of</strong>tware late about the cause <strong>of</strong> bugs, study the code<br />
problems, and shipping delays are almost and generally guess at where the problem<br />
always due to unfixed bugs or glitches. may lie. <strong>The</strong>y may add print statements or<br />
Sometimes these problems are bugs that<br />
reproduce End <strong>of</strong> easily Article<br />
and can be fixed quickly.<br />
other manual instrumentation in an attempt<br />
to corner the bug, but this process is <strong>of</strong>ten<br />
However, the bugs that usually take up the a matter <strong>of</strong> guesswork more than anything<br />
else. And as device s<strong>of</strong>tware continues to<br />
grow in complexity, the amount <strong>of</strong> time<br />
Get Connected<br />
with companies mentioned in this article.<br />
www.rtcmagazine.com/getconnected<br />
that developers have to spend debugging<br />
their s<strong>of</strong>tware will only continue to grow.<br />
Get Connected with companies mentioned in this article.<br />
Today, innovations in debugging<br />
technology are working in the s<strong>of</strong>tware<br />
engineer’s favor to help bring this problem<br />
<strong>of</strong> shipping reliable s<strong>of</strong>tware in a<br />
reasonable amount <strong>of</strong> time under control<br />
by making these bugs easier to trap<br />
and eliminate. <strong>Debuggers</strong> that allow<br />
you to stop when a bug occurs and then<br />
step and run backward to the source <strong>of</strong><br />
the bug, are becoming a reality and can<br />
help eliminate these nasty bugs. This<br />
allows you to capture a bug, and once<br />
it is captured, to replay the sequence <strong>of</strong><br />
events that led up to the bug, essentially<br />
allowing you to turn a very difficult-toreproduce<br />
bug into a simple, easy-toreproduce<br />
bug. <strong>The</strong> technology that is<br />
enabling these debuggers is real-time<br />
trace, and it is enabling debugging that<br />
can make s<strong>of</strong>tware projects more predictable<br />
and manageable.<br />
Real-Time Trace<br />
Real-time trace refers to special debug<br />
ports built into many embedded microprocessors,<br />
which provide detailed in-<br />
Reprinted from October 2006
S<strong>of</strong>twareTools&Techniques<br />
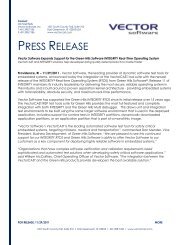
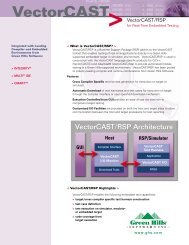
Figure 1 A trace probe connected to an ARM 9 target.<br />
formation about what instructions the processor executes as well<br />
as the sequence <strong>of</strong> memory loads and stores caused by these instructions.<br />
Processors equipped with this special debug port output<br />
this information as the processor runs at full speed, enabling<br />
an external device—called a trace probe—to collect this information<br />
non-intrusively as the system runs (Figure 1). Some examples<br />
<strong>of</strong> microprocessors that are equipped with a real-time trace port<br />
include many ARM7, ARM9 and ARM11 processors, which include<br />
the Embedded Trace Macrocell (ETM) from ARM, as well<br />
as the AMCC PowerPC 4xx family, the PowerPC 54xx family<br />
and the ColdFire family <strong>of</strong> processors from Freescale.<br />
<strong>The</strong> trace probe collects this information using a circular<br />
buffer that enables you to collect detailed information about the<br />
execution <strong>of</strong> your s<strong>of</strong>tware over relatively long periods <strong>of</strong> time.<br />
<strong>The</strong> circular buffer means that the trace probe is always storing<br />
the most recently executed instructions, so when your s<strong>of</strong>tware<br />
encounters a bug, you can stop the trace collection and store the<br />
sequence <strong>of</strong> instructions and memory accesses that led up to that<br />
bug (Figure 2). <strong>The</strong> trace probe’s collection <strong>of</strong> trace data can either<br />
be stopped manually, when the user presses a button—either<br />
on the probe or on a host machine—or by using flexible triggers<br />
that allow you to configure the location <strong>of</strong> a bug, so that trace can<br />
be retrieved without altering the system behavior in any way. For<br />
instance, you can trigger when a specific line <strong>of</strong> code is hit or<br />
when a variable is written to with a specific value.<br />
Once you have captured the sequence <strong>of</strong> instructions that<br />
precede a s<strong>of</strong>tware glitch, you have essentially captured the bug<br />
and you can analyze the data to find the root cause <strong>of</strong> the problem.<br />
Trace analysis s<strong>of</strong>tware can be used to reconstruct the state<br />
<strong>of</strong> the microprocessor for every point in time that you have cap-<br />
Reprinted from October 2006<br />
tured trace data using a standard instruction-set<br />
simulator. Thus you can now know<br />
the sequence <strong>of</strong> instructions and the value<br />
<strong>of</strong> most register and memory values that led<br />
up to the bug.<br />
Debugging Forward and<br />
Backward<br />
Once the trace analysis tools know the<br />
sequence <strong>of</strong> instructions and the memory<br />
values, this information can be used as the<br />
back-end <strong>of</strong> a standard s<strong>of</strong>tware debugging<br />
session. Essentially, the debugger simply<br />
replays the instructions from the trace data<br />
rather than talking to a live target. <strong>The</strong> debugger<br />
translates the raw instructions into<br />
source code lines and the raw memory values<br />
into variable values. This enables you<br />
to easily browse the state <strong>of</strong> the system at<br />
any point back in time using a familiar interface.<br />
However, you can also use the debugger<br />
to fully replay the system along the<br />
same path that led to the bug you have captured.<br />
<strong>The</strong> debugger lets you step forward<br />
from one instruction to the next, and all <strong>of</strong><br />
the state variables will update to display the<br />
new values. In addition, the debugger allows you to run forward<br />
to a breakpoint by searching forward through the instructions for<br />
any address where you have set a breakpoint. You can even set<br />
watchpoints and data breakpoints, and again, the debugger will<br />
search forward for the next access to a memory location when<br />
you run the program.<br />
<strong>The</strong> real power <strong>of</strong> such a tool, however, rests in its ability<br />
to run backward as well as forward. This is accomplished using<br />
the same techniques described above, except instead <strong>of</strong> stepping<br />
forward, the tool simply searches backward for instances in the<br />
trace data where breakpoints or watch points are hit.<br />
Stepping and running backward enables you to quickly step<br />
or run backward to the source <strong>of</strong> the bug after encountering an<br />
error condition. You can investigate various possible solutions<br />
and find exactly what conditions led up to the error. Because you<br />
have stored the trace data, you can easily replay your s<strong>of</strong>tware<br />
both forward and backward in time to understand its behavior<br />
and track down any type <strong>of</strong> bug (Figure 3).<br />
This enables you to quickly track down the types <strong>of</strong> bugs that<br />
are otherwise extraordinarily difficult to reproduce using traditional<br />
debugging techniques, because traditional techniques require<br />
you to reproduce the error under the debugger. Some bugs<br />
may take several minutes to reproduce, simply because you have<br />
to restart the system and go through a complicated procedure to<br />
reach the buggy code. Other bugs don’t even reproduce reliably<br />
and you have to try a certain sequence many times before the bug<br />
reproduces. And then, if you step past the bug in the debugger,<br />
you have to start all over again. But with stored trace data, you<br />
can eliminate all <strong>of</strong> these problems, because you know exactly<br />
what code paths were executed and what caused the glitch.
If you can capture a bug in the trace data once, then you can<br />
spend as much time as necessary tracking down the problem and<br />
fixing it. You can even attach a trace probe to testing and verification<br />
units in the quality department or to the first units shipped to<br />
help capture detailed information about glitches that occur rather<br />
than having to rely on bug reports and reproducing the problem<br />
in the lab. Capturing difficult-to-reproduce bugs during testing<br />
can eliminate weeks or months from the schedule <strong>of</strong> device s<strong>of</strong>tware<br />
projects because so much time is <strong>of</strong>ten spent tracking down<br />
these types <strong>of</strong> bugs, especially as the s<strong>of</strong>tware gets closer and<br />
closer to being released.<br />
Aiming at Multicore<br />
As embedded systems continue to grow in complexity, more<br />
and more systems will employ multicore designs. This may involve<br />
many identical cores running at the same clock frequency<br />
or different processor architectures running at vastly different<br />
speeds. Regardless <strong>of</strong> the specific multicore design, the problem<br />
<strong>of</strong> synchronization and communication between various processing<br />
elements remains daunting for s<strong>of</strong>tware designers. A small<br />
timing delay at any point can potentially cause drastically different<br />
results if the s<strong>of</strong>tware has a minor glitch. Tracking down<br />
these types <strong>of</strong> problems with traditional tools is very difficult, because<br />
reliably reproducing these bugs may be nearly impossible.<br />
However, if you could collect synchronized real-time trace<br />
information from each <strong>of</strong> these processing elements, you would<br />
be able to replay the sequence <strong>of</strong> instructions on each processor<br />
to determine the exact interactions between the various cores<br />
and their s<strong>of</strong>tware. Thus, if a timing error causes a failure in<br />
the system, you could find the bug in the s<strong>of</strong>tware that did not<br />
properly handle the specific timing condition. Alternatively, if<br />
a shared resource, such as shared memory or a shared device, is<br />
not properly locked, you could find the <strong>of</strong>fending code quickly<br />
and easily rather than having to rely on trial-and-error debugging<br />
techniques to find the problem.<br />
In addition, system peripheral and coprocessor registers <strong>of</strong>ten<br />
heavily influence device s<strong>of</strong>tware implementations, so adding<br />
trace support for these devices to enable s<strong>of</strong>tware-level access<br />
and understanding <strong>of</strong> these devices over time would greatly simplify<br />
the process <strong>of</strong> tracking down various device-level problems<br />
caused by errors in the s<strong>of</strong>tware.<br />
Technology for solving both <strong>of</strong> the above sets <strong>of</strong> problems<br />
is beginning to emerge. ARM is moving toward multicore and<br />
multi-device trace with their new CoreSight technology. This<br />
technology includes modules to multiplex data from various onchip<br />
sources into a single, synchronized trace stream that can be<br />
captured and replayed. In addition, other processor companies<br />
are embracing real-time trace technology to make the difficult<br />
job <strong>of</strong> releasing high-quality s<strong>of</strong>tware in a predictable amount <strong>of</strong><br />
time easier.<br />
While today’s s<strong>of</strong>tware is much larger and more complicated<br />
than five or ten years ago, most engineers still rely primarily on<br />
debugging technology that does not solve some <strong>of</strong> the hardest<br />
problems facing s<strong>of</strong>tware engineers today. Traditional debuggers<br />
do not provide enough visibility into the inner workings <strong>of</strong> your<br />
s<strong>of</strong>tware to maximize your productivity when tracking down<br />
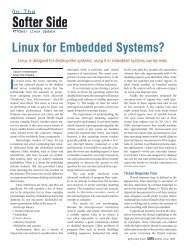
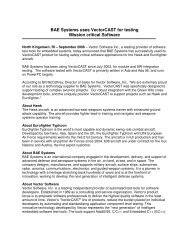
Trace-Enabled<br />
Microprocessor<br />
Trace Port<br />
S<strong>of</strong>twareTools&Techniques<br />
USB, Ethernet, etc.<br />
Trace Probe Host PC<br />
Figure 2 A block diagram <strong>of</strong> a trace probe collecting<br />
trace data from an ARM 9 system. <strong>The</strong> trace<br />
data is transferred from the trace port on the<br />
microprocessor and stored in the circular buffer<br />
in the trace probe. It is then transferred to the<br />
PC where the debugger can examine it in both<br />
backward and forward execution.<br />
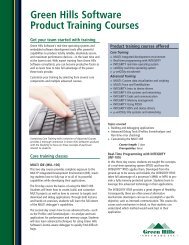
Figure 3 A screen shot <strong>of</strong> the TimeMachine debugger with<br />
both forward and backward run-control buttons<br />
enabled. You can also see the state <strong>of</strong> variables,<br />
registers and other processor information at any<br />
point in time through the TimeMachine debugger.<br />
and debugging s<strong>of</strong>tware errors. However, leveraging real-time<br />
trace technology and the most advanced s<strong>of</strong>tware debuggers<br />
can greatly increase programmer productivity, helping eliminate<br />
some <strong>of</strong> the biggest schedule delays in s<strong>of</strong>tware development.<br />
<strong>Green</strong> <strong>Hills</strong> S<strong>of</strong>tware<br />
Santa Barbara, CA.<br />
(805) 965-6044.<br />
[www.ghs.com].<br />
Reprinted from October 2006
S<strong>of</strong>twareTools&Techniques<br />
Reprinted from October 2006