Report of the Technical Inspectorate SENS, SWICO Recycling, SLRS
Report of the Technical Inspectorate SENS, SWICO Recycling, SLRS
Report of the Technical Inspectorate SENS, SWICO Recycling, SLRS

You also want an ePaper? Increase the reach of your titles
YUMPU automatically turns print PDFs into web optimized ePapers that Google loves.
Quantities – <strong>SWICO</strong> <strong>Recycling</strong> / <strong>SENS</strong><br />
Increasing quantity <strong>of</strong><br />
raw materials extracted<br />
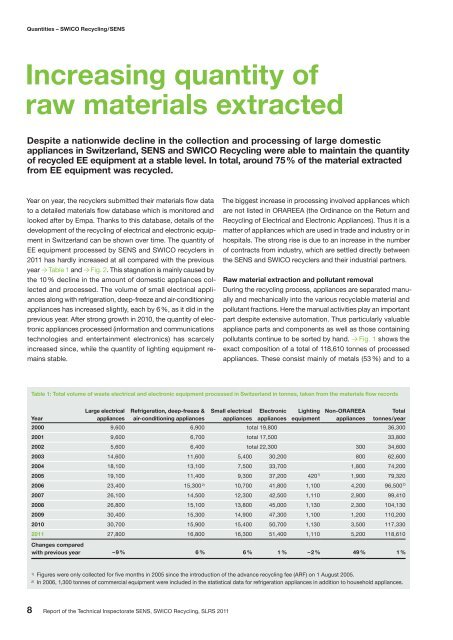
Despite a nationwide decline in <strong>the</strong> collection and processing <strong>of</strong> large domestic<br />
appliances in Switzerland, <strong>SENS</strong> and <strong>SWICO</strong> <strong>Recycling</strong> were able to maintain <strong>the</strong> quantity<br />
<strong>of</strong> recycled EE equipment at a stable level. In total, around 75 % <strong>of</strong> <strong>the</strong> material extracted<br />
from EE equipment was recycled.<br />
Year on year, <strong>the</strong> recyclers submitted <strong>the</strong>ir materials flow data<br />
to a detailed materials flow database which is monitored and<br />
looked after by Empa. Thanks to this database, details <strong>of</strong> <strong>the</strong><br />
development <strong>of</strong> <strong>the</strong> recycling <strong>of</strong> electrical and electronic equipment<br />
in Switzerland can be shown over time. The quantity <strong>of</strong><br />
EE equipment processed by <strong>SENS</strong> and <strong>SWICO</strong> recyclers in<br />
2011 has hardly increased at all compared with <strong>the</strong> previous<br />
year � Table 1 and � Fig. 2. This stagnation is mainly caused by<br />
<strong>the</strong> 10 % decline in <strong>the</strong> amount <strong>of</strong> domestic appliances collected<br />
and processed. The volume <strong>of</strong> small electrical appliances<br />
along with refrigeration, deep-freeze and air-conditioning<br />
appliances has increased slightly, each by 6 %, as it did in <strong>the</strong><br />
previous year. After strong growth in 2010, <strong>the</strong> quantity <strong>of</strong> electronic<br />
appliances processed (information and communications<br />
technologies and entertainment electronics) has scarcely<br />
increased since, while <strong>the</strong> quantity <strong>of</strong> lighting equipment remains<br />
stable.<br />
8 <strong>Report</strong> <strong>of</strong> <strong>the</strong> <strong>Technical</strong> <strong>Inspectorate</strong> <strong>SENS</strong>, <strong>SWICO</strong> <strong>Recycling</strong>, <strong>SLRS</strong> 2011<br />
The biggest increase in processing involved appliances which<br />
are not listed in ORAREEA (<strong>the</strong> Ordinance on <strong>the</strong> Return and<br />
<strong>Recycling</strong> <strong>of</strong> Electrical and Electronic Appliances). Thus it is a<br />
matter <strong>of</strong> appliances which are used in trade and industry or in<br />
hospitals. The strong rise is due to an increase in <strong>the</strong> number<br />
<strong>of</strong> contracts from industry, which are settled directly between<br />
<strong>the</strong> <strong>SENS</strong> and <strong>SWICO</strong> recyclers and <strong>the</strong>ir industrial partners.<br />
Raw material extraction and pollutant removal<br />
During <strong>the</strong> recycling process, appliances are separated manually<br />
and mechanically into <strong>the</strong> various recyclable material and<br />
pollutant fractions. Here <strong>the</strong> manual activities play an important<br />
part despite extensive automation. Thus particularly valuable<br />
appliance parts and components as well as those containing<br />
pollutants continue to be sorted by hand. � Fig. 1 shows <strong>the</strong><br />
exact composition <strong>of</strong> a total <strong>of</strong> 118,610 tonnes <strong>of</strong> processed<br />
appliances. These consist mainly <strong>of</strong> metals (53 %) and to a<br />
Table 1: Total volume <strong>of</strong> waste electrical and electronic equipment processed in Switzerland in tonnes, taken from <strong>the</strong> materials flow records<br />
Large electrical Refrigeration, deep-freeze & Small electrical Electronic Lighting Non-ORAREEA Total<br />
Year<br />
appliances air-conditioning appliances appliances appliances equipment appliances tonnes / year<br />
2000 9,600 6,900 total 19,800 36,300<br />
2001 9,600 6,700 total 17,500 33,800<br />
2002 5,600 6,400 total 22,300 300 34,600<br />
2003 14,600 11,600 5,400 30,200 800 62,600<br />
2004 18,100 13,100 7,500 33,700 1,800 74,200<br />
2005 19,100 11,400 9,300 37,200 4201) 1,900 79,320<br />
2006 23,400 15,300 2) 10,700 41,800 1,100 4,200 96,500 2)<br />
2007 26,100 14,500 12,300 42,500 1,110 2,900 99,410<br />
2008 26,800 15,100 13,800 45,000 1,130 2,300 104,130<br />
2009 30,400 15,300 14,900 47,300 1,100 1,200 110,200<br />
2010 30,700 15,900 15,400 50,700 1,130 3,500 117,330<br />
2011 27,800 16,800 16,300 51,400 1,110 5,200 118,610<br />
Changes compared<br />
with previous year – 9 % 6 % 6 % 1 % – 2 % 49 % 1 %<br />
1) Figures were only collected for five months in 2005 since <strong>the</strong> introduction <strong>of</strong> <strong>the</strong> advance recycling fee (ARF) on 1 August 2005.<br />
2) In 2006, 1,300 tonnes <strong>of</strong> commercial equipment were included in <strong>the</strong> statistical data for refrigeration appliances in addition to household appliances.