Vorlesung Microarray Datenanalyse Kapitel 1: Einführung ... - Lectures
Vorlesung Microarray Datenanalyse Kapitel 1: Einführung ... - Lectures
Vorlesung Microarray Datenanalyse Kapitel 1: Einführung ... - Lectures
SHOW LESS

Create successful ePaper yourself
Turn your PDF publications into a flip-book with our unique Google optimized e-Paper software.
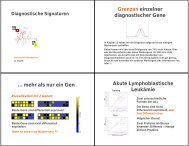
Berechne TScores für ein<br />
zufälliges Experiment<br />
Erstelle ein Histogramm der Tscores<br />
und markiere die 5% höchsten und<br />
niedrigsten (rot)<br />
Berechne TScore für Gen x und<br />
zeichne diesen ein (grün)<br />
T Score – T test – P value<br />
Wie groß ist die Wahrscheinlichkeit, mindestens so extrem wie der grüne<br />
Pfeil zu sein?