Locating Potential Cougar (Puma concolor) Corridors in New ...
Locating Potential Cougar (Puma concolor) Corridors in New ...
Locating Potential Cougar (Puma concolor) Corridors in New ...
You also want an ePaper? Increase the reach of your titles
YUMPU automatically turns print PDFs into web optimized ePapers that Google loves.
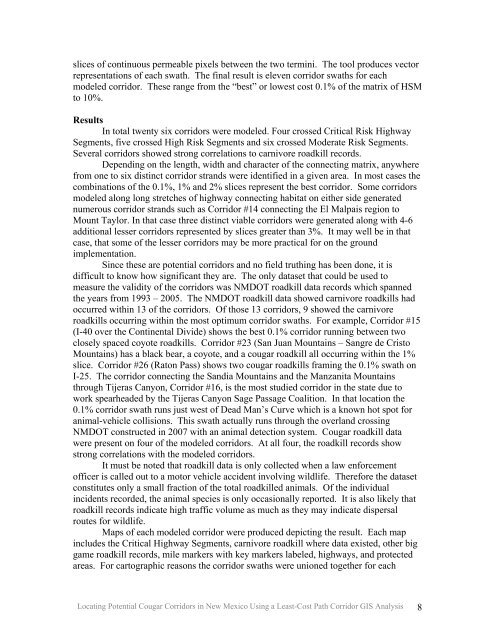
slices of cont<strong>in</strong>uous permeable pixels between the two term<strong>in</strong>i. The tool produces vector<br />
representations of each swath. The f<strong>in</strong>al result is eleven corridor swaths for each<br />
modeled corridor. These range from the “best” or lowest cost 0.1% of the matrix of HSM<br />
to 10%.<br />
Results<br />
In total twenty six corridors were modeled. Four crossed Critical Risk Highway<br />
Segments, five crossed High Risk Segments and six crossed Moderate Risk Segments.<br />
Several corridors showed strong correlations to carnivore roadkill records.<br />
Depend<strong>in</strong>g on the length, width and character of the connect<strong>in</strong>g matrix, anywhere<br />
from one to six dist<strong>in</strong>ct corridor strands were identified <strong>in</strong> a given area. In most cases the<br />
comb<strong>in</strong>ations of the 0.1%, 1% and 2% slices represent the best corridor. Some corridors<br />
modeled along long stretches of highway connect<strong>in</strong>g habitat on either side generated<br />
numerous corridor strands such as Corridor #14 connect<strong>in</strong>g the El Malpais region to<br />
Mount Taylor. In that case three dist<strong>in</strong>ct viable corridors were generated along with 4-6<br />
additional lesser corridors represented by slices greater than 3%. It may well be <strong>in</strong> that<br />
case, that some of the lesser corridors may be more practical for on the ground<br />
implementation.<br />
S<strong>in</strong>ce these are potential corridors and no field truth<strong>in</strong>g has been done, it is<br />
difficult to know how significant they are. The only dataset that could be used to<br />
measure the validity of the corridors was NMDOT roadkill data records which spanned<br />
the years from 1993 – 2005. The NMDOT roadkill data showed carnivore roadkills had<br />
occurred with<strong>in</strong> 13 of the corridors. Of those 13 corridors, 9 showed the carnivore<br />
roadkills occurr<strong>in</strong>g with<strong>in</strong> the most optimum corridor swaths. For example, Corridor #15<br />
(I-40 over the Cont<strong>in</strong>ental Divide) shows the best 0.1% corridor runn<strong>in</strong>g between two<br />
closely spaced coyote roadkills. Corridor #23 (San Juan Mounta<strong>in</strong>s – Sangre de Cristo<br />
Mounta<strong>in</strong>s) has a black bear, a coyote, and a cougar roadkill all occurr<strong>in</strong>g with<strong>in</strong> the 1%<br />
slice. Corridor #26 (Raton Pass) shows two cougar roadkills fram<strong>in</strong>g the 0.1% swath on<br />
I-25. The corridor connect<strong>in</strong>g the Sandia Mounta<strong>in</strong>s and the Manzanita Mounta<strong>in</strong>s<br />
through Tijeras Canyon, Corridor #16, is the most studied corridor <strong>in</strong> the state due to<br />
work spearheaded by the Tijeras Canyon Sage Passage Coalition. In that location the<br />
0.1% corridor swath runs just west of Dead Man’s Curve which is a known hot spot for<br />
animal-vehicle collisions. This swath actually runs through the overland cross<strong>in</strong>g<br />
NMDOT constructed <strong>in</strong> 2007 with an animal detection system. <strong>Cougar</strong> roadkill data<br />
were present on four of the modeled corridors. At all four, the roadkill records show<br />
strong correlations with the modeled corridors.<br />
It must be noted that roadkill data is only collected when a law enforcement<br />
officer is called out to a motor vehicle accident <strong>in</strong>volv<strong>in</strong>g wildlife. Therefore the dataset<br />
constitutes only a small fraction of the total roadkilled animals. Of the <strong>in</strong>dividual<br />
<strong>in</strong>cidents recorded, the animal species is only occasionally reported. It is also likely that<br />
roadkill records <strong>in</strong>dicate high traffic volume as much as they may <strong>in</strong>dicate dispersal<br />
routes for wildlife.<br />
Maps of each modeled corridor were produced depict<strong>in</strong>g the result. Each map<br />
<strong>in</strong>cludes the Critical Highway Segments, carnivore roadkill where data existed, other big<br />
game roadkill records, mile markers with key markers labeled, highways, and protected<br />
areas. For cartographic reasons the corridor swaths were unioned together for each<br />
<strong>Locat<strong>in</strong>g</strong> <strong>Potential</strong> <strong>Cougar</strong> <strong>Corridors</strong> <strong>in</strong> <strong>New</strong> Mexico Us<strong>in</strong>g a Least-Cost Path Corridor GIS Analysis 8


