Locating Potential Cougar (Puma concolor) Corridors in New ...
Locating Potential Cougar (Puma concolor) Corridors in New ...
Locating Potential Cougar (Puma concolor) Corridors in New ...

You also want an ePaper? Increase the reach of your titles
YUMPU automatically turns print PDFs into web optimized ePapers that Google loves.
Share With Wildlife F<strong>in</strong>al Project Report<br />
Professional Services Contract# 08-516-0000-00005<br />
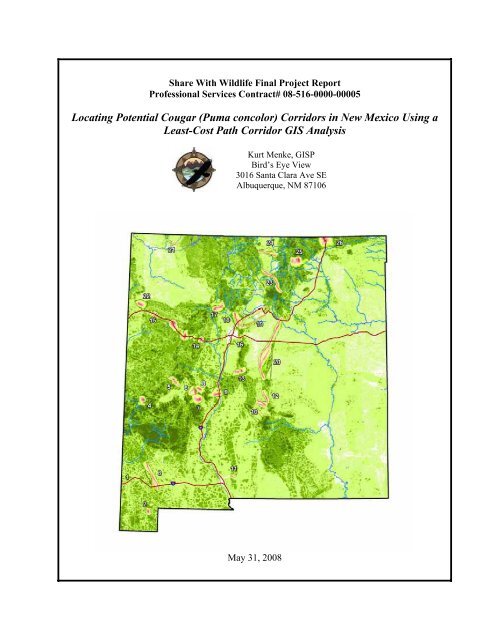
<strong>Locat<strong>in</strong>g</strong> <strong>Potential</strong> <strong>Cougar</strong> (<strong>Puma</strong> <strong>concolor</strong>) <strong>Corridors</strong> <strong>in</strong> <strong>New</strong> Mexico Us<strong>in</strong>g a<br />
Least-Cost Path Corridor GIS Analysis<br />
Kurt Menke, GISP<br />
Bird’s Eye View<br />
3016 Santa Clara Ave SE<br />
Albuquerque, NM 87106<br />
May 31, 2008
Introduction & Background ............................................................................................ 3<br />
House Jo<strong>in</strong>t Memorial 3.............................................................................................. 3<br />
<strong>New</strong> Mexico Highlands Wildlands Network Design.................................................. 3<br />
NMDOT and NMDGF Plans...................................................................................... 4<br />
Species Selection ........................................................................................................ 4<br />
Habitat Fragmentation ................................................................................................ 4<br />
Methodology................................................................................................................... 5<br />
Habitat Suitability Model............................................................................................ 5<br />
Identify<strong>in</strong>g <strong>Potential</strong> Corridor Locations.................................................................... 7<br />
Corridor Term<strong>in</strong>i......................................................................................................... 7<br />
Least Cost Path Analysis ............................................................................................ 7<br />
Results............................................................................................................................. 8<br />
Corridor #1 – I-10 Through the Peloncillo Mounta<strong>in</strong>s ............................................. 10<br />
Corridor #2 – NM 81 Through the Big and Little Hatchets ..................................... 11<br />
Corridor #3 – Big Burro Mounta<strong>in</strong>s – Cedar Mounta<strong>in</strong>s.......................................... 12<br />
Corridor #4 – Tularosa Mounta<strong>in</strong>s – San Francisco Mounta<strong>in</strong>s............................... 13<br />
Corridor #5 – Crosby Mounta<strong>in</strong>s – Datil Mounta<strong>in</strong>s................................................ 14<br />
Corridor #6 – San Mateo Mounta<strong>in</strong>s – Gall<strong>in</strong>as Mounta<strong>in</strong>s..................................... 15<br />
Corridor #7 – San Mateo Mounta<strong>in</strong>s – Magdalena Mounta<strong>in</strong>s................................. 16<br />
Corridor #8 – Gall<strong>in</strong>as Mounta<strong>in</strong>s – Magdalena Mounta<strong>in</strong>s .................................... 17<br />
Corridor #9 - Quebradas – Magdalena Mounta<strong>in</strong>s .................................................. 18<br />
Corridor #10 – Oscura Mounta<strong>in</strong>s – Sierra Blanca................................................... 19<br />
Corridor #11 – San. August<strong>in</strong> Pass........................................................................... 20<br />
Corridor #12 – Jicarilla Mounta<strong>in</strong>s – Gall<strong>in</strong>as Peak................................................. 21<br />
Corridor #13 – Abo Canyon ..................................................................................... 22<br />
Corridor #14 – Mt. Taylor – El Malpais................................................................... 23<br />
Corridor #15 – I-40 over the Cont<strong>in</strong>ental Divide...................................................... 24<br />
Corridor #16 – I-40 through Tijeras Canyon ............................................................ 25<br />
Corridor #17 – Jemez Mounta<strong>in</strong>s – Cabezon Country.............................................. 26<br />
Corridor #18 – Jemez Mounta<strong>in</strong>s - Sandia Mounta<strong>in</strong>s ............................................. 27<br />
Corridor #19 – Sangre de Cristo Mts – Sandia Mounta<strong>in</strong>s....................................... 28<br />
Corridor #20 – Sangre de Cristo Mts – Gall<strong>in</strong>as Mounta<strong>in</strong>s .................................... 29<br />
Corridor #21 – Mesa Verde Lowlands – Knickerbocker Peaks ............................... 30<br />
Corridor #22 – Chuska Mounta<strong>in</strong>s – Fallen Timber Ridge ...................................... 31<br />
Corridor #23 – San Juan Mts – Sangre de Cristo Mts .............................................. 32<br />
Corridor #24 – San Juan Mts – Taos Mts ................................................................. 33<br />
Corridor #25 – Cimarron River................................................................................. 34<br />
Corridor #26 – Raton Pass ........................................................................................ 35<br />
Relationship to Meso Carnivores.................................................................................. 36<br />
Jaguar ........................................................................................................................ 36<br />
Wolf .......................................................................................................................... 37<br />
Marten....................................................................................................................... 38<br />
Swift and Kit Fox...................................................................................................... 39<br />
Recommendations......................................................................................................... 40<br />
F<strong>in</strong>al Products ............................................................................................................... 40<br />
<strong>Locat<strong>in</strong>g</strong> <strong>Potential</strong> <strong>Cougar</strong> <strong>Corridors</strong> <strong>in</strong> <strong>New</strong> Mexico Us<strong>in</strong>g a Least-Cost Path Corridor GIS Analysis 2
Introduction & Background<br />
While a wildlife movement barrier assessment and several regional wildlands network<br />
designs have been completed <strong>in</strong> <strong>New</strong> Mexico, scientifically rigorous, spatially explicit<br />
least-cost corridor analyses had not yet been performed to identify potential dispersal<br />
corridors for any species.<br />
House Jo<strong>in</strong>t Memorial 3<br />
In January of 2003, the <strong>New</strong> Mexico 44 th State Legislature passed House Jo<strong>in</strong>t<br />
Memorial 3 (HJM 3), which was developed by Wild Friends, sponsored by<br />
Representative Mimi Stewart and signed by Governor Bill Richardson. HJM 3 directs<br />
the <strong>New</strong> Mexico Department of Game and Fish (NMDGF) and the <strong>New</strong> Mexico<br />
Department of Transportation (NMDOT) to work together to reduce the potential for<br />
wildlife/vehicle collisions on highways <strong>in</strong> <strong>New</strong> Mexico.<br />
In part, HJM 3 states:<br />
“NOW, THEREFORE, BE IT RESOLVED BY THE LEGISLATURE OF THE STATE OF<br />
NEW MEXICO that the <strong>New</strong> Mexico congressional delegation be requested to help<br />
secure federal fund<strong>in</strong>g for enlarg<strong>in</strong>g or build<strong>in</strong>g underpasses and overpasses and for<br />
implement<strong>in</strong>g other technologies to make our roads safer for wildlife and people”<br />
“BE IT FURTHER RESOLVED that the department of game and fish and the state<br />
highway and transportation department be encouraged to…cooperate on long-term<br />
plann<strong>in</strong>g of road projects and to share <strong>in</strong>formation to help reduce road kill result<strong>in</strong>g from<br />
vehicle-wildlife collisions on the roads of <strong>New</strong> Mexico”<br />
As a result of HJM 3, the June 2003 Critical Mass Workshop was sponsored by<br />
the <strong>New</strong> Mexico Carnivore Work<strong>in</strong>g Group, with assistance from the U.S. Fish and<br />
Wildlife Service, U.S. Forest Service and NMGF. The Workshop was attended by<br />
approximately one hundred people represent<strong>in</strong>g NMDOT, NMDGF, USFS, BLM,<br />
USFWS, UNM and many NGO’s. Over the course of two days, the group generated a<br />
consensus prioritized list and map of <strong>New</strong> Mexico highway segments for further analysis<br />
to determ<strong>in</strong>e the need for mitigation strategies to reduce the potential for wildlife vehicle<br />
collisions. The prioritization of highway segments was based on three criteria: 1) large<br />
game animal/vehicle accident report data (one year’s data only); 2) proximity to major<br />
tracts of public land that are important wildlife habitats; and 3) the perceived potential for<br />
adverse effects of highways and traffic to threatened, endangered and sensitive species.<br />
Because of the limited time and availability of accident report data, the Critical Mass<br />
Workshop was <strong>in</strong>tended as a first prelim<strong>in</strong>ary attempt to identify important<br />
wildlife/vehicle conflict areas, and not <strong>in</strong>tended to be def<strong>in</strong>itive.<br />
<strong>New</strong> Mexico Highlands Wildlands Network Design<br />
In 2003 The Wildlands Project published the <strong>New</strong> Mexico Highlands Wildlands<br />
Network Vision 1 . This was the first attempt to look at the landscape <strong>in</strong> terms of core<br />
wildlife habitat, compatible use areas and dispersal corridors. To map the landscape <strong>in</strong><br />
1 <strong>New</strong> Mexico Highlands Wildlands Network Vision by Dave Foreman et al. (The Wildlands Project 2003). CD available from Kim<br />
Vacariu, The Wildlands Project, 520-884-0875 or kim@wildlandsproject.org.<br />
<strong>Locat<strong>in</strong>g</strong> <strong>Potential</strong> <strong>Cougar</strong> <strong>Corridors</strong> <strong>in</strong> <strong>New</strong> Mexico Us<strong>in</strong>g a Least-Cost Path Corridor GIS Analysis 3
this manner a series of spatial analyses were conducted to identify the portions of the<br />
landscape that need to be protected to support healthy ecosystems <strong>in</strong> <strong>New</strong> Mexico.<br />
However, the corridors were only vaguely identified.<br />
NMDOT and NMDGF Plans<br />
Subsequently, the <strong>New</strong> Mexico 2025 Statewide Multimodal Transportation Plan<br />
and the 2006 <strong>New</strong> Mexico Comprehensive Wildlife Conservation Strategy (NM-CWCS)<br />
have both explicitly stated the need for cooperation between the two agencies to address<br />
the <strong>in</strong>tent of HJM 3 by reduc<strong>in</strong>g the potential for wildlife-vehicle collisions and<br />
<strong>in</strong>creas<strong>in</strong>g wildlife habitat connectivity with regard to <strong>New</strong> Mexico’s highway system.<br />
Additionally, the NM-CWCS identifies habitat fragmentation due to transportation<br />
<strong>in</strong>frastructure as one of the major threats to native wildlife populations. One of the<br />
research priorities highlighted <strong>in</strong> the NM-CWCS is to "Identify wildlife travel corridors<br />
and determ<strong>in</strong>e habitat connectivity" 2 .<br />
These <strong>in</strong>itiatives, plans and strategies implicitly identify the need for more<br />
spatially explicit corridor data for <strong>New</strong> Mexico. This project was designed to beg<strong>in</strong> to<br />
address this data void <strong>in</strong> <strong>New</strong> Mexico. Established tools and GIS techniques were<br />
employed to identify potential travel corridors for cougars.<br />
Species Selection<br />
The analysis focused on cougars for several reasons: 1) <strong>Cougar</strong>s have been<br />
identified as a species of conservation concern <strong>in</strong> both regional conservation plans and the<br />
NM-CWCS, 2) This is the only wide rang<strong>in</strong>g species for which adequate habitat data<br />
existed to conduct such an analysis, 3) It was assumed that cougar could serve as a<br />
surrogate for other wide rang<strong>in</strong>g carnivorous species such as marten (Martes americana),<br />
gray wolf (Canis lupus), jaguar (Panthera onca), swift fox (Vulpes velox) and kit fox<br />
(Vulpes macrotis) where habitat overlaps. With these data NMDGF will be able to beg<strong>in</strong><br />
to plan for the needs of other species with large home ranges, seasonal migration<br />
requirements, and sensitivities to human disturbance.<br />
Habitat Fragmentation<br />
Habitat fragmentation is now widely recognized as one of the lead<strong>in</strong>g causes of<br />
species ext<strong>in</strong>ction. The four million-mile network of roads we have constructed <strong>in</strong><br />
America has enabled unprecedented mobility for human travel and commerce. However,<br />
these same roads, and the developments associated with them, have negatively affected<br />
the mobility and survival of wildlife by creat<strong>in</strong>g “fracture zones” between suitable<br />
habitats. Animals follow<strong>in</strong>g their <strong>in</strong>st<strong>in</strong>ctual movement patterns often encounter human<br />
<strong>in</strong>frastructure as they seek food, water, mates and territory. The environmental impact of<br />
roadways extends far beyond the edge of the pavement. This “road-effect zone” is<br />
estimated to be 15 to 20 times as large as the actual paved right of way itself 3 . One of the<br />
un<strong>in</strong>tended adverse consequences of habitat fragmentation is that this process effectively<br />
creates smaller, more isolated habitat patches and wildlife populations. Isolated<br />
2<br />
Mark Watson, NMDGF, Personal communication, November 2007.<br />
3<br />
Forman, R.T.T. 2000. Estimate of the Area Affected Ecologically by the Road System <strong>in</strong> the United States. Conservation<br />
Biology 14(1): 31-35<br />
<strong>Locat<strong>in</strong>g</strong> <strong>Potential</strong> <strong>Cougar</strong> <strong>Corridors</strong> <strong>in</strong> <strong>New</strong> Mexico Us<strong>in</strong>g a Least-Cost Path Corridor GIS Analysis 4
populations are demographically vulnerable, less resilient to natural disturbances, and<br />
thus have a higher probability of local ext<strong>in</strong>ction. As grow<strong>in</strong>g human <strong>in</strong>frastructure<br />
fragments the landscape, it becomes less permeable to wildlife movement. Permeability<br />
is a measure of how easily traversed a landscape is for a particular species. This<br />
measurement is related to a particular species’ agility, habitat preferences, and response<br />
to biophysical factors, <strong>in</strong>clud<strong>in</strong>g human-created barriers. Permeability has been estimated<br />
and mapped for various focal species us<strong>in</strong>g “least cost path/corridor” GIS analysis 4 , snow<br />
track counts 5 , radio/GPS collars, and genetic analysis 6 . Species with large home ranges,<br />
seasonal migration requirements, sensitivities to human disturbance, or those with small<br />
population sizes and limited distribution are particularly vulnerable to habitat conversion<br />
and fragmentation. Therefore, quantify<strong>in</strong>g and accommodat<strong>in</strong>g habitat connectivity<br />
requirements for these species should be a high priority.<br />
Methodology<br />
This study utilized ArcGIS 9.2 and the Corridor Designer tools developed by the<br />
School of Forestry at Northern Arizona University. It was developed for the sole purpose of<br />
identify<strong>in</strong>g wildlife corridors and was used for the 2006 Arizona Miss<strong>in</strong>g L<strong>in</strong>kages<br />
Assessment. This suite of tools is freely available at corridordesign.org. I followed their<br />
concepts and methodologies outl<strong>in</strong>ed <strong>in</strong> their guid<strong>in</strong>g documents. By us<strong>in</strong>g this suite of tools<br />
and procedures, the analysis is repeatable and the results comparable to other efforts that have<br />
been undertaken <strong>in</strong> neighbor<strong>in</strong>g states.<br />
Habitat Suitability Model<br />
The toolbox is organized <strong>in</strong>to three tool sets: 1) Layer Preparation, 2) Habitat<br />
Model<strong>in</strong>g, and 3) Corridor Model<strong>in</strong>g. The latter requires a Habitat Suitability Model<br />
(HSM). In such a model each pixel has a numeric value represent<strong>in</strong>g the suitability of that<br />
piece of ground as habitat for a particular species. When model<strong>in</strong>g a corridor the tools create<br />
an <strong>in</strong>versely proportional relationship between habitat suitability and resistance to movement.<br />
This assumes that animals use the same criteria to disperse between two areas as they do<br />
when select<strong>in</strong>g habitat.<br />
A cougar habitat suitability model (HSM) had already been completed by Bird’s Eye<br />
View and Animal Protection of <strong>New</strong> Mexico <strong>in</strong> 2006. This HSM was rescaled to meet<br />
CorridorDesigner’s requirement that HSM values range from 0 – 100. The model was<br />
rescaled with the follow<strong>in</strong>g assumptions:<br />
- 100 represent<strong>in</strong>g the best habitat<br />
- 80 represent<strong>in</strong>g the lowest score typically associated with successful breed<strong>in</strong>g<br />
- 60 represent<strong>in</strong>g the lowest score associated with consistent use and breed<strong>in</strong>g<br />
4<br />
S<strong>in</strong>gleton, P.H., W.L. Ga<strong>in</strong>es and J.F. Lehmkuhl. 2002. Landscape Permeability for Large Carnivores <strong>in</strong> Wash<strong>in</strong>gton: A Geographic<br />
Information System Weighted-Distance and Least-Cost Corridor Assessment.<br />
5<br />
Alexander, S.M, N.M. Waters, and P.C. Paquet. 2004. A probability-based GIS model for identify<strong>in</strong>g focal species l<strong>in</strong>kage zones<br />
across highways <strong>in</strong> the Canadian Rocky Mounta<strong>in</strong>s' <strong>in</strong> Applied GIS and Spatial Analysis, eds J. Stillwell and G. Clarke (West Sussex,<br />
UK: Wiley) 233–256<br />
6<br />
Proctor M., B.N. McLellan, and C. Strobeck. 2002. Population fragmentation of grizzly bears <strong>in</strong> southeastern British Columbia,<br />
Canada. Ursus 13:153–160<br />
<strong>Locat<strong>in</strong>g</strong> <strong>Potential</strong> <strong>Cougar</strong> <strong>Corridors</strong> <strong>in</strong> <strong>New</strong> Mexico Us<strong>in</strong>g a Least-Cost Path Corridor GIS Analysis 5
- 30 represent<strong>in</strong>g the lowest value associated with occasional use for nonbreed<strong>in</strong>g<br />
activities<br />
- 0 represent<strong>in</strong>g non-habitat.<br />
The cougar HSM was derived with the follow<strong>in</strong>g <strong>in</strong>puts:<br />
- Prey availability (40%) (<strong>in</strong>corporated 25 prey animal ranges)<br />
- Distance to Roads (25%)<br />
- Human Population Density by Census Block (15%)<br />
- Terra<strong>in</strong> Ruggedness (15%)<br />
- Distance to Interstates (3%)(areas with<strong>in</strong> a mile of an <strong>in</strong>terstate<br />
were given a value of 0 and the rema<strong>in</strong>der of the state 100 for this<br />
<strong>in</strong>put)<br />
- Urban Areas (2%) (urban areas were given a value of 0 and the<br />
rema<strong>in</strong>der of the state 100 for this <strong>in</strong>put)<br />
The f<strong>in</strong>al HSM has a 30 meter resolution.<br />
<strong>Locat<strong>in</strong>g</strong> <strong>Potential</strong> <strong>Cougar</strong> <strong>Corridors</strong> <strong>in</strong> <strong>New</strong> Mexico Us<strong>in</strong>g a Least-Cost Path Corridor GIS Analysis 6
Identify<strong>in</strong>g <strong>Potential</strong> Corridor Locations<br />
To model a corridor one must first identify the areas to connect. For this study I<br />
used a comb<strong>in</strong>ation of the results of the 2003 Critical Mass Workshop, carnivore roadkill<br />
data, and the habitat suitability model to identify patches of habitat to connect. The 2003<br />
Critical Mass Workshop resulted <strong>in</strong> the identification of 4 Critical Risk Highway<br />
Segments, 13 High Risk Segments and 14 Moderate Risk Segments. These were based<br />
on knowledge of the attendees and represented locations that needed to be mitigated for<br />
animal-vehicle collisions. It was decided that corridors should be modeled across each of<br />
the four Critical Highway Segments and many of the High and Moderate Highway<br />
Segments where they served to generate a connected landscape for cougars <strong>in</strong> the state.<br />
<strong>Cougar</strong> and other carnivore roadkill records were also used to <strong>in</strong>form the decision on<br />
where to model corridors. In total 26 corridors were modeled.<br />
Corridor Term<strong>in</strong>i<br />
The term<strong>in</strong>i that def<strong>in</strong>e the beg<strong>in</strong>n<strong>in</strong>g and end<strong>in</strong>g po<strong>in</strong>ts of the least cost path<br />
corridor, ideally meet as many cougar habitat criteria as possible. The identification of<br />
the start<strong>in</strong>g and end<strong>in</strong>g po<strong>in</strong>ts has a great deal to do with the position and extent of the<br />
modeled corridor. In every case core habitat blocks were used as the “to” and “from”<br />
locales for the corridor to span. The “Create Habitat Patch” tool <strong>in</strong> the CorridorDesigner<br />
Toolbox del<strong>in</strong>eates the habitat blocks. The output was a cougar habitat patch map for<br />
<strong>New</strong> Mexico based on the HSM. S<strong>in</strong>ce most of the corridors were del<strong>in</strong>eated to cross<br />
roadways, if a core habitat block was co<strong>in</strong>cident with a protected roadless area, then I<br />
chose the roadless area as the term<strong>in</strong>us. Where core habitat block term<strong>in</strong>i nearly touched<br />
on either side of a road over which the corridor was to be modeled, a one mile buffer of<br />
the road was used to erase the term<strong>in</strong>i 7 . This forced the model to identify a corridor that<br />
spans a m<strong>in</strong>imum of two miles between core habitat patches and f<strong>in</strong>ds the best route - not<br />
just the shortest route. For all the corridors, a piece of the statewide HSM was extracted<br />
around the two term<strong>in</strong>i, large enough to give the model room to roam and f<strong>in</strong>d the best<br />
path but small enough to limit process<strong>in</strong>g time.<br />
Least Cost Path Analysis<br />
A simple least cost path analysis produces a one pixel wide result from<br />
dest<strong>in</strong>ation to source. That result is guaranteed to be the lowest cost or “path of least<br />
resistance” between the two locales. In this case, a typical least cost path analysis would<br />
produce a corridor 30 meters wide. No documentation was found with precise functional<br />
width requirements specific to cougar corridors. However, it is suspected that 30 meters<br />
is far too narrow to be practical. To produce a more practical corridor, The<br />
CorridorDesigner tools use an additional GIS function called “Least Cost Corridor”<br />
which identifies for each cell location, the accumulative costs for movement <strong>in</strong> each<br />
direction: one from po<strong>in</strong>t A to po<strong>in</strong>t B and one from po<strong>in</strong>t B to po<strong>in</strong>t A. These two<br />
surfaces are mathematically added together to produce the f<strong>in</strong>al “Cost Distance” surface.<br />
Each pixel with the Cost Distance surface represents the lowest possible cumulative<br />
resistance from that pixel to term<strong>in</strong>uses <strong>in</strong> each core habitat area. Therefore, the output<br />
raster identifies not a s<strong>in</strong>gle least-cost path between the two sources, but a range of<br />
accumulative costs between the sources. From there the CorridorDesign tool extracts<br />
7 P. Beier, Majka D., and Jenness J. 2007 Conceptual steps for design<strong>in</strong>g wildife corridors. http://www.corridordesign.org/downloads/<br />
<strong>Locat<strong>in</strong>g</strong> <strong>Potential</strong> <strong>Cougar</strong> <strong>Corridors</strong> <strong>in</strong> <strong>New</strong> Mexico Us<strong>in</strong>g a Least-Cost Path Corridor GIS Analysis 7
slices of cont<strong>in</strong>uous permeable pixels between the two term<strong>in</strong>i. The tool produces vector<br />
representations of each swath. The f<strong>in</strong>al result is eleven corridor swaths for each<br />
modeled corridor. These range from the “best” or lowest cost 0.1% of the matrix of HSM<br />
to 10%.<br />
Results<br />
In total twenty six corridors were modeled. Four crossed Critical Risk Highway<br />
Segments, five crossed High Risk Segments and six crossed Moderate Risk Segments.<br />
Several corridors showed strong correlations to carnivore roadkill records.<br />
Depend<strong>in</strong>g on the length, width and character of the connect<strong>in</strong>g matrix, anywhere<br />
from one to six dist<strong>in</strong>ct corridor strands were identified <strong>in</strong> a given area. In most cases the<br />
comb<strong>in</strong>ations of the 0.1%, 1% and 2% slices represent the best corridor. Some corridors<br />
modeled along long stretches of highway connect<strong>in</strong>g habitat on either side generated<br />
numerous corridor strands such as Corridor #14 connect<strong>in</strong>g the El Malpais region to<br />
Mount Taylor. In that case three dist<strong>in</strong>ct viable corridors were generated along with 4-6<br />
additional lesser corridors represented by slices greater than 3%. It may well be <strong>in</strong> that<br />
case, that some of the lesser corridors may be more practical for on the ground<br />
implementation.<br />
S<strong>in</strong>ce these are potential corridors and no field truth<strong>in</strong>g has been done, it is<br />
difficult to know how significant they are. The only dataset that could be used to<br />
measure the validity of the corridors was NMDOT roadkill data records which spanned<br />
the years from 1993 – 2005. The NMDOT roadkill data showed carnivore roadkills had<br />
occurred with<strong>in</strong> 13 of the corridors. Of those 13 corridors, 9 showed the carnivore<br />
roadkills occurr<strong>in</strong>g with<strong>in</strong> the most optimum corridor swaths. For example, Corridor #15<br />
(I-40 over the Cont<strong>in</strong>ental Divide) shows the best 0.1% corridor runn<strong>in</strong>g between two<br />
closely spaced coyote roadkills. Corridor #23 (San Juan Mounta<strong>in</strong>s – Sangre de Cristo<br />
Mounta<strong>in</strong>s) has a black bear, a coyote, and a cougar roadkill all occurr<strong>in</strong>g with<strong>in</strong> the 1%<br />
slice. Corridor #26 (Raton Pass) shows two cougar roadkills fram<strong>in</strong>g the 0.1% swath on<br />
I-25. The corridor connect<strong>in</strong>g the Sandia Mounta<strong>in</strong>s and the Manzanita Mounta<strong>in</strong>s<br />
through Tijeras Canyon, Corridor #16, is the most studied corridor <strong>in</strong> the state due to<br />
work spearheaded by the Tijeras Canyon Sage Passage Coalition. In that location the<br />
0.1% corridor swath runs just west of Dead Man’s Curve which is a known hot spot for<br />
animal-vehicle collisions. This swath actually runs through the overland cross<strong>in</strong>g<br />
NMDOT constructed <strong>in</strong> 2007 with an animal detection system. <strong>Cougar</strong> roadkill data<br />
were present on four of the modeled corridors. At all four, the roadkill records show<br />
strong correlations with the modeled corridors.<br />
It must be noted that roadkill data is only collected when a law enforcement<br />
officer is called out to a motor vehicle accident <strong>in</strong>volv<strong>in</strong>g wildlife. Therefore the dataset<br />
constitutes only a small fraction of the total roadkilled animals. Of the <strong>in</strong>dividual<br />
<strong>in</strong>cidents recorded, the animal species is only occasionally reported. It is also likely that<br />
roadkill records <strong>in</strong>dicate high traffic volume as much as they may <strong>in</strong>dicate dispersal<br />
routes for wildlife.<br />
Maps of each modeled corridor were produced depict<strong>in</strong>g the result. Each map<br />
<strong>in</strong>cludes the Critical Highway Segments, carnivore roadkill where data existed, other big<br />
game roadkill records, mile markers with key markers labeled, highways, and protected<br />
areas. For cartographic reasons the corridor swaths were unioned together for each<br />
<strong>Locat<strong>in</strong>g</strong> <strong>Potential</strong> <strong>Cougar</strong> <strong>Corridors</strong> <strong>in</strong> <strong>New</strong> Mexico Us<strong>in</strong>g a Least-Cost Path Corridor GIS Analysis 8
corridor. In actuality each consecutive higher cost corridor swath <strong>in</strong>cludes all the lower<br />
costs swaths as well. For example, the 10% swath <strong>in</strong>cludes all swaths from 0.1% - 9%<br />
even though only the outer r<strong>in</strong>g is visible on a particular map.<br />
<strong>Locat<strong>in</strong>g</strong> <strong>Potential</strong> <strong>Cougar</strong> <strong>Corridors</strong> <strong>in</strong> <strong>New</strong> Mexico Us<strong>in</strong>g a Least-Cost Path Corridor GIS Analysis 9
Corridor #1 – I-10 Through the Peloncillo Mounta<strong>in</strong>s<br />
<strong>Locat<strong>in</strong>g</strong> <strong>Potential</strong> <strong>Cougar</strong> <strong>Corridors</strong> <strong>in</strong> <strong>New</strong> Mexico Us<strong>in</strong>g a Least-Cost Path Corridor GIS Analysis 10
Corridor #2 – NM 81 Through the Big and Little Hatchets<br />
<strong>Locat<strong>in</strong>g</strong> <strong>Potential</strong> <strong>Cougar</strong> <strong>Corridors</strong> <strong>in</strong> <strong>New</strong> Mexico Us<strong>in</strong>g a Least-Cost Path Corridor GIS Analysis 11
Corridor #3 – Big Burro Mounta<strong>in</strong>s – Cedar Mounta<strong>in</strong>s<br />
<strong>Locat<strong>in</strong>g</strong> <strong>Potential</strong> <strong>Cougar</strong> <strong>Corridors</strong> <strong>in</strong> <strong>New</strong> Mexico Us<strong>in</strong>g a Least-Cost Path Corridor GIS Analysis 12
Corridor #4 – Tularosa Mounta<strong>in</strong>s – San Francisco Mounta<strong>in</strong>s<br />
<strong>Locat<strong>in</strong>g</strong> <strong>Potential</strong> <strong>Cougar</strong> <strong>Corridors</strong> <strong>in</strong> <strong>New</strong> Mexico Us<strong>in</strong>g a Least-Cost Path Corridor GIS Analysis 13
Corridor #5 – Crosby Mounta<strong>in</strong>s – Datil Mounta<strong>in</strong>s<br />
<strong>Locat<strong>in</strong>g</strong> <strong>Potential</strong> <strong>Cougar</strong> <strong>Corridors</strong> <strong>in</strong> <strong>New</strong> Mexico Us<strong>in</strong>g a Least-Cost Path Corridor GIS Analysis 14
Corridor #6 – San Mateo Mounta<strong>in</strong>s – Gall<strong>in</strong>as Mounta<strong>in</strong>s<br />
<strong>Locat<strong>in</strong>g</strong> <strong>Potential</strong> <strong>Cougar</strong> <strong>Corridors</strong> <strong>in</strong> <strong>New</strong> Mexico Us<strong>in</strong>g a Least-Cost Path Corridor GIS Analysis 15
Corridor #7 – San Mateo Mounta<strong>in</strong>s – Magdalena Mounta<strong>in</strong>s<br />
<strong>Locat<strong>in</strong>g</strong> <strong>Potential</strong> <strong>Cougar</strong> <strong>Corridors</strong> <strong>in</strong> <strong>New</strong> Mexico Us<strong>in</strong>g a Least-Cost Path Corridor GIS Analysis 16
Corridor #8 – Gall<strong>in</strong>as Mounta<strong>in</strong>s – Magdalena Mounta<strong>in</strong>s<br />
<strong>Locat<strong>in</strong>g</strong> <strong>Potential</strong> <strong>Cougar</strong> <strong>Corridors</strong> <strong>in</strong> <strong>New</strong> Mexico Us<strong>in</strong>g a Least-Cost Path Corridor GIS Analysis 17
Corridor #9 - Quebradas – Magdalena Mounta<strong>in</strong>s<br />
<strong>Locat<strong>in</strong>g</strong> <strong>Potential</strong> <strong>Cougar</strong> <strong>Corridors</strong> <strong>in</strong> <strong>New</strong> Mexico Us<strong>in</strong>g a Least-Cost Path Corridor GIS Analysis 18
Corridor #10 – Oscura Mounta<strong>in</strong>s – Sierra Blanca<br />
<strong>Locat<strong>in</strong>g</strong> <strong>Potential</strong> <strong>Cougar</strong> <strong>Corridors</strong> <strong>in</strong> <strong>New</strong> Mexico Us<strong>in</strong>g a Least-Cost Path Corridor GIS Analysis 19
Corridor #11 – San. August<strong>in</strong> Pass<br />
<strong>Locat<strong>in</strong>g</strong> <strong>Potential</strong> <strong>Cougar</strong> <strong>Corridors</strong> <strong>in</strong> <strong>New</strong> Mexico Us<strong>in</strong>g a Least-Cost Path Corridor GIS Analysis 20
Corridor #12 – Jicarilla Mounta<strong>in</strong>s – Gall<strong>in</strong>as Peak<br />
<strong>Locat<strong>in</strong>g</strong> <strong>Potential</strong> <strong>Cougar</strong> <strong>Corridors</strong> <strong>in</strong> <strong>New</strong> Mexico Us<strong>in</strong>g a Least-Cost Path Corridor GIS Analysis 21
Corridor #13 – Abo Canyon<br />
<strong>Locat<strong>in</strong>g</strong> <strong>Potential</strong> <strong>Cougar</strong> <strong>Corridors</strong> <strong>in</strong> <strong>New</strong> Mexico Us<strong>in</strong>g a Least-Cost Path Corridor GIS Analysis 22
Corridor #14 – Mt. Taylor – El Malpais<br />
<strong>Locat<strong>in</strong>g</strong> <strong>Potential</strong> <strong>Cougar</strong> <strong>Corridors</strong> <strong>in</strong> <strong>New</strong> Mexico Us<strong>in</strong>g a Least-Cost Path Corridor GIS Analysis 23
Corridor #16 – I-40 through Tijeras Canyon<br />
<strong>Locat<strong>in</strong>g</strong> <strong>Potential</strong> <strong>Cougar</strong> <strong>Corridors</strong> <strong>in</strong> <strong>New</strong> Mexico Us<strong>in</strong>g a Least-Cost Path Corridor GIS Analysis 25
Corridor #17 – Jemez Mounta<strong>in</strong>s – Cabezon Country<br />
<strong>Locat<strong>in</strong>g</strong> <strong>Potential</strong> <strong>Cougar</strong> <strong>Corridors</strong> <strong>in</strong> <strong>New</strong> Mexico Us<strong>in</strong>g a Least-Cost Path Corridor GIS Analysis 26
Corridor #18 – Jemez Mounta<strong>in</strong>s - Sandia Mounta<strong>in</strong>s<br />
<strong>Locat<strong>in</strong>g</strong> <strong>Potential</strong> <strong>Cougar</strong> <strong>Corridors</strong> <strong>in</strong> <strong>New</strong> Mexico Us<strong>in</strong>g a Least-Cost Path Corridor GIS Analysis 27
Corridor #19 – Sangre de Cristo Mts – Sandia Mounta<strong>in</strong>s<br />
<strong>Locat<strong>in</strong>g</strong> <strong>Potential</strong> <strong>Cougar</strong> <strong>Corridors</strong> <strong>in</strong> <strong>New</strong> Mexico Us<strong>in</strong>g a Least-Cost Path Corridor GIS Analysis 28
Corridor #20 – Sangre de Cristo Mts – Gall<strong>in</strong>as Mounta<strong>in</strong>s<br />
<strong>Locat<strong>in</strong>g</strong> <strong>Potential</strong> <strong>Cougar</strong> <strong>Corridors</strong> <strong>in</strong> <strong>New</strong> Mexico Us<strong>in</strong>g a Least-Cost Path Corridor GIS Analysis 29
Corridor #21 – Mesa Verde Lowlands – Knickerbocker Peaks<br />
<strong>Locat<strong>in</strong>g</strong> <strong>Potential</strong> <strong>Cougar</strong> <strong>Corridors</strong> <strong>in</strong> <strong>New</strong> Mexico Us<strong>in</strong>g a Least-Cost Path Corridor GIS Analysis 30
Corridor #22 – Chuska Mounta<strong>in</strong>s – Fallen Timber Ridge<br />
<strong>Locat<strong>in</strong>g</strong> <strong>Potential</strong> <strong>Cougar</strong> <strong>Corridors</strong> <strong>in</strong> <strong>New</strong> Mexico Us<strong>in</strong>g a Least-Cost Path Corridor GIS Analysis 31
Corridor #23 – San Juan Mts – Sangre de Cristo Mts<br />
<strong>Locat<strong>in</strong>g</strong> <strong>Potential</strong> <strong>Cougar</strong> <strong>Corridors</strong> <strong>in</strong> <strong>New</strong> Mexico Us<strong>in</strong>g a Least-Cost Path Corridor GIS Analysis 32
Corridor #24 – San Juan Mts – Taos Mts<br />
<strong>Locat<strong>in</strong>g</strong> <strong>Potential</strong> <strong>Cougar</strong> <strong>Corridors</strong> <strong>in</strong> <strong>New</strong> Mexico Us<strong>in</strong>g a Least-Cost Path Corridor GIS Analysis 33
Corridor #25 – Cimarron River<br />
<strong>Locat<strong>in</strong>g</strong> <strong>Potential</strong> <strong>Cougar</strong> <strong>Corridors</strong> <strong>in</strong> <strong>New</strong> Mexico Us<strong>in</strong>g a Least-Cost Path Corridor GIS Analysis 34
Corridor #26 – Raton Pass<br />
<strong>Locat<strong>in</strong>g</strong> <strong>Potential</strong> <strong>Cougar</strong> <strong>Corridors</strong> <strong>in</strong> <strong>New</strong> Mexico Us<strong>in</strong>g a Least-Cost Path Corridor GIS Analysis 35
Relationship to Meso Carnivores<br />
The cougar corridors were compared visually to marten (Martes americana), gray<br />
wolf (Canis lupus), jaguar (Panthera onca), swift fox (Vulpes velox) and kit fox (Vulpes<br />
macrotis). The habitat data for these species was obta<strong>in</strong>ed from the Southwest Regional<br />
GAP Program with one exception. The jaguar potential habitat suitability data was<br />
developed <strong>in</strong> 2002 by Hayes and Menke 8 . These are all listed as species of greatest<br />
conservation need <strong>in</strong> the NM-CWCS. The results show that many of the corridors for<br />
cougar dispersal may also serve these other species.<br />
Jaguar<br />
<strong>Corridors</strong> #1 – 4 all connect patches of potential jaguar habitat. <strong>Corridors</strong> 1# and #3 may<br />
<strong>in</strong>dicate useful locations to study for Jaguar dispersal across Interstate 10.<br />
8<br />
Hayes C. and K. Menke. 2002 Evaluation of the Relative Suitability of <strong>Potential</strong> Jaguar Habitat <strong>in</strong> <strong>New</strong> Mexico. Unpublished<br />
Manuscript<br />
<strong>Locat<strong>in</strong>g</strong> <strong>Potential</strong> <strong>Cougar</strong> <strong>Corridors</strong> <strong>in</strong> <strong>New</strong> Mexico Us<strong>in</strong>g a Least-Cost Path Corridor GIS Analysis 36
Wolf<br />
<strong>Corridors</strong> #4 – 8 all heavily overlap potential wolf habitat. <strong>Corridors</strong> #1 and #3 may<br />
<strong>in</strong>dicate useful locations to study for wolf dispersal across Interstate 10 and Corridor #14<br />
shows potential wolf dispersal routes north over Interstate 40. One l<strong>in</strong>kage that may be<br />
crucial for wolf dispersal but was not modeled <strong>in</strong> this exercise is a l<strong>in</strong>kage from the San<br />
Mateo Mounta<strong>in</strong>s to the Black Range to the southwest. It is known that some wolves<br />
successfully cross between those ranges based on telemetry data 9 . The ma<strong>in</strong> barrier to<br />
movement there by wolves is probably State Highway 52. This route is currently dirt and<br />
lightly traveled. However, if that route is someday paved or future development <strong>in</strong> that<br />
area occurs, a likely permeability po<strong>in</strong>t for Mexican wolves might become more difficult,<br />
which could be critical for their long-term persistence.<br />
9 Chuck Hayes (NMDFG), Personal communication, May 15, 2008<br />
<strong>Locat<strong>in</strong>g</strong> <strong>Potential</strong> <strong>Cougar</strong> <strong>Corridors</strong> <strong>in</strong> <strong>New</strong> Mexico Us<strong>in</strong>g a Least-Cost Path Corridor GIS Analysis 37
Marten<br />
<strong>Corridors</strong> #23 and #24 show potential dispersal routes for marten between the Sangre de<br />
Cristo and San Juan Mounta<strong>in</strong> ranges. Due to the elevation requirements of marten it is<br />
unclear whether they would be likely to attempt such migrations.<br />
<strong>Locat<strong>in</strong>g</strong> <strong>Potential</strong> <strong>Cougar</strong> <strong>Corridors</strong> <strong>in</strong> <strong>New</strong> Mexico Us<strong>in</strong>g a Least-Cost Path Corridor GIS Analysis 38
Swift and Kit Fox<br />
Due to their extensive habitat well over half the cougar corridors look to provide<br />
dispersal routes for fox. <strong>Corridors</strong> #1, #2, #3, #9, #10, #11, #12, and #13 appear to be the<br />
most relevant.<br />
<strong>Locat<strong>in</strong>g</strong> <strong>Potential</strong> <strong>Cougar</strong> <strong>Corridors</strong> <strong>in</strong> <strong>New</strong> Mexico Us<strong>in</strong>g a Least-Cost Path Corridor GIS Analysis 39
Recommendations<br />
It should be noted that these are potential corridors. While many show strong<br />
relationships to exist<strong>in</strong>g roadkill data they should only be used as an <strong>in</strong>dication of where<br />
on the ground studies should be undertaken and as an <strong>in</strong>itial focus for such studies. They<br />
should not be used to locate <strong>in</strong>dividual animal-vehicle collision mitigation structures such<br />
as underpasses, overpasses or fenc<strong>in</strong>g. Before such mitigation measures are undertaken it<br />
is strongly recommended to take multiple species <strong>in</strong>to account such as mule deer, elk,<br />
pronghorn, and other large wide rang<strong>in</strong>g mammals. Thorough field work should be<br />
undertaken <strong>in</strong> any area be<strong>in</strong>g considered for wildlife mortality mitigation measures. Such<br />
field work should <strong>in</strong>clude surveys for locations where wildlife are be<strong>in</strong>g killed, as well as,<br />
where they are safely cross<strong>in</strong>g, where exist<strong>in</strong>g <strong>in</strong>frastructure exists that could be<br />
retrofitted for use by wildlife, and the protection status of key parcels of lands on either<br />
side of the roadway.<br />
While all the corridor slices are shown on the maps it is recommended to consider<br />
the optimum width for a given corridor. An optimum corridor should be wide enough to<br />
allow for cougar dispersal, but not so wide that management of the corridor becomes<br />
impractical. In general, it is felt that swaths up to 2-3% are the most useful. Depend<strong>in</strong>g<br />
on the situation however, the model found additional strands as with <strong>Corridors</strong> #10, #14,<br />
#15, #19 and #23. In these cases some of these other strands composed of higher<br />
percentage slices may be more practical on the ground.<br />
There are two components to protect<strong>in</strong>g wildlife corridors. One is the mitigation<br />
strategies used by departments of transportation <strong>in</strong> reduc<strong>in</strong>g animal-vehicle collisions.<br />
These data are designed to expand that focus to simultaneously <strong>in</strong>creas<strong>in</strong>g landscape<br />
permeability for wildlife. The second component is land use and plann<strong>in</strong>g. No corridor<br />
will rema<strong>in</strong> viable if land on either side of the roadway is developed. Several of the<br />
corridors identified <strong>in</strong> this study run very close to or through areas of exurban<br />
development. Examples of these are <strong>Corridors</strong> #11, #16, #18 and #21. If urban sprawl<br />
cont<strong>in</strong>ues <strong>in</strong> these areas around the cities of Las Cruces, Albuquerque, Placitas and Aztec<br />
the suitability of these corridors could be severely compromised. Therefore these data<br />
should also be used to focus land use plann<strong>in</strong>g efforts around wildlife corridors.<br />
This was the first statewide attempt to model dispersal corridors for a wide<br />
rang<strong>in</strong>g mammal. It is recommended that this effort be undertaken for several other<br />
important wide rang<strong>in</strong>g mammals commonly killed by motor vehicles on NM highways<br />
<strong>in</strong>clud<strong>in</strong>g: mule deer, elk, black bear and pronghorn. At that po<strong>in</strong>t one could beg<strong>in</strong> to<br />
determ<strong>in</strong>e where multi-species corridors are located. That <strong>in</strong>formation would then<br />
provide a logical priority for mitigat<strong>in</strong>g wildlife corridors <strong>in</strong> <strong>New</strong> Mexico with the NM<br />
Department of Transportation. It is also recommended that the NMDOT Statewide<br />
Transportation Improvement Program (STIP) be taken <strong>in</strong>to account when prioritiz<strong>in</strong>g<br />
mitigation efforts.<br />
F<strong>in</strong>al Products<br />
In addition to this report a CD will be provided with all the GIS data for the<br />
corridors <strong>in</strong>clud<strong>in</strong>g the corridor swaths, habitat suitability model and roadkill records. All<br />
these spatial data will be provided <strong>in</strong> the Universal Transverse Mercator (UTM)<br />
projection, zone 13.<br />
<strong>Locat<strong>in</strong>g</strong> <strong>Potential</strong> <strong>Cougar</strong> <strong>Corridors</strong> <strong>in</strong> <strong>New</strong> Mexico Us<strong>in</strong>g a Least-Cost Path Corridor GIS Analysis 40