Toril Bosoni (IEA) - Clingendael
Toril Bosoni (IEA) - Clingendael
Toril Bosoni (IEA) - Clingendael

You also want an ePaper? Increase the reach of your titles
YUMPU automatically turns print PDFs into web optimized ePapers that Google loves.
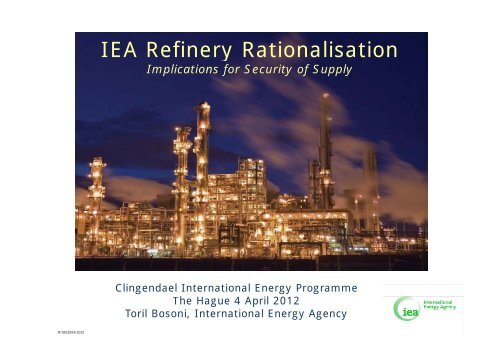
© OECD/<strong>IEA</strong> 2012<br />
<strong>IEA</strong> Refinery Rationalisation<br />
Implications for Security of Supply<br />
<strong>Clingendael</strong> International Energy Programme<br />
The h Hague 4 April l 20 20122<br />
<strong>Toril</strong> <strong>Bosoni</strong>, International Energy Agency
© OECD/<strong>IEA</strong> 2012<br />
Background g<br />
• Since the economic recession of 2008/2009, more<br />
than 3.0 mb/d of crude distillation capacity has<br />
closed or is scheduled to close in the OECD OECD, with<br />
more at risk<br />
• OECD demand is contracting contracting, while growth is still<br />
strong in non-OECD countries<br />
• Significant refinery expansions are taking place in<br />
the non-OECD, outpacing expected demand growth<br />
• Pressure on OECD refiners refiners, particularly European<br />
operators, will therefore continue, with margins<br />
remaining weak and further closures likely<br />
• As a result, trade flows of crude and products will<br />
shift in favour of product imports, with implications<br />
for stocks holdings g and securityy of supply pp y
© OECD/<strong>IEA</strong> 2012<br />
The Refinery Business is Still a Challenging One<br />
$/bbl<br />
15<br />
Refinery Cracking Margins<br />
$/bbl<br />
6<br />
4<br />
European H'skimming Margins<br />
10<br />
2<br />
0<br />
5<br />
-2<br />
-4<br />
0<br />
-6<br />
-8 Source: Purvin & Gertz Inc.<br />
Source: Purvin & Gertz Inc.<br />
-5<br />
2002 2005<br />
Med Urals<br />
NWE Brent<br />
Singapore Dubai<br />
2008 2011<br />
NWE Urals<br />
USGC Mars<br />
-10<br />
2002 2005<br />
Urals H'sk NWE<br />
Es Sider H'sk MED<br />
2008 2011<br />
Brent H'sk NWE<br />
Urals H'sk MED<br />
• Refinery margins have deteriorated sharply since 2008<br />
• Simple margins in Europe remain firmly negative negative, forcing<br />
several plants to close or reduce runs due to weak<br />
economics<br />
• I In 2011/2012, 2011/2012 product d t prices i failed f il d to t k keep up with ith rising i i<br />
crude prices<br />
• Surplus p global g refinery y capacity p y persists, p as refinery y<br />
shutdowns not enough to offset new-built capacity and<br />
weak demand
© OECD/<strong>IEA</strong> 2012<br />
Demand Growth and Refinery Rebound Slows<br />
But two distinct trends emerge g in the OECD and the non-OECD<br />
mb/d<br />
35 3.5<br />
2.5<br />
1.5<br />
0.5<br />
-0 -0.5 5<br />
Global Throughputs vs. Demand<br />
Annual growth<br />
mb/d<br />
42 42.0 0<br />
40.0<br />
38.0<br />
36.0<br />
OECD vs. Non-OECD Crude Runs<br />
-1.5<br />
34.0<br />
-2.5<br />
-3.5<br />
32.0<br />
1Q08 1Q09 1Q10 1Q11 1Q12 30.0<br />
Crude Runs Oil Product Demand<br />
1Q2004 1Q2006 1Q2008 1Q2010<br />
OECD Non-OECD<br />
1Q2012<br />
• Two distinct trends emerging however however, with non-OECD posting<br />
robust growth and mature OECD markets continue to contract<br />
• Non-OECD overtakes OECD in terms of refinery throughputs in<br />
4Q09 4Q09, and d there th to t stay t
© OECD/<strong>IEA</strong> 2012<br />
kb/d<br />
1,500<br />
1,250<br />
1,000<br />
750<br />
500<br />
250<br />
0<br />
OECD Consolidation is Picking up Speed<br />
OECD Refinery Closures<br />
2008 2009 2010 2011 2012 2013 2014 2015 2016<br />
North America Europe Pacific Petroplus Hovensa<br />
Petroplus and Hovensa not included in Dec 2011 Update<br />
kb/d Cumulative OECD Refinery Closures<br />
3,500<br />
3,000<br />
2500 2,500<br />
2,000<br />
1,500<br />
1,000<br />
500<br />
0<br />
2008 2010 2012 2014 2016<br />
North America Europe<br />
Pacific OECD<br />
• Total refinery capacity reductions in the OECD now amount to<br />
more than 3.0 mb/d since 2008<br />
• North America and Europe shut 11.3 3 mb/d and 1.1 1 1 mb/d, mb/d<br />
respectively. Pacific 0.6 mb/d scheduled so far<br />
• This does not include recently bankrupt Petroplus’ 5 European<br />
refineries, as future is still uncertain, nor Valero’s Aruba plant<br />
which is being idled due to poor economics, but currently idle<br />
and for sale US East Coast plants (Trainer and Marcus Hook)<br />
• Europe is the focus, since refiners here have missed out on<br />
favorable feedstock economics (N. America) and stronger<br />
demand (Asia) evident elsewhere in the OECD
© OECD/<strong>IEA</strong> 2012<br />
European Downstream Changes Gain Pace<br />
• 1.1 mb/d of capacity already shed<br />
• Including all five Petroplus plants (665 kb/d), closures could<br />
amount to 1.7 mb/d since 2008<br />
• In addition, lot of ownership changes, with Russian, Chinese,<br />
Indian players entering the market
© OECD/<strong>IEA</strong> 2012<br />
European Refinery Runs Decline Primarily on<br />
Falling Demand<br />
mb/d<br />
16<br />
14<br />
12<br />
10<br />
8<br />
6<br />
4<br />
2<br />
0<br />
European Oil Demand<br />
1984 1989 1994 1999 2004 2009 2014<br />
LPG and Ethane Naphtha<br />
Motor Gasoline Jet and Kerosene<br />
Gas/Diesel Oil Residual Fuels<br />
kb/d<br />
100<br />
50<br />
-<br />
(50) ( )<br />
(100)<br />
(150)<br />
OECD Europe: Oil Demand Growth by<br />
Product<br />
Gasoline Other Distillates<br />
LPG & Naphtha Fuel Oil<br />
Other Diesel<br />
2011 2012 2013 2014 2015 2016<br />
• European p oil demand declined from 15.7 mb/d / in 2006 to 14.3<br />
mb/d in 2011 (1.4 mb/d, or 280 kb/d per annum)<br />
• Forecast to shed another 0.7 mb/d by 2016 to reach 13.6<br />
mb/d<br />
• In contrast, diesel continues to grow. 0.2 mb/d diesel growth<br />
expected from 2011-2016 (c.f. 0.5 mb/d 2006-2016)
© OECD/<strong>IEA</strong> 2012<br />
In Contrast, Non-OECD Refinery Expansions Boom<br />
mb/d<br />
2.0<br />
1.0<br />
0.0<br />
-1.0<br />
Crude Distillation Additions<br />
2011 2012 2013 2014 2015 2016<br />
OECD<br />
Other Asia<br />
Latin America<br />
China<br />
Middle East<br />
Other Non Non-OECD OECD<br />
mb/d Cumulative CDU Expansions<br />
8.0<br />
60 6.0<br />
4.0<br />
2.0<br />
0.0<br />
-2.0<br />
2011 2012 2013 2014 2015 2016<br />
OECD China<br />
Other Asia Middle East<br />
LLatin ti America A i Oth Other Non N OECD<br />
• More than 8.3 mb/d of crude distillation capacity is scheduled<br />
to be added globally by 2016<br />
• All of the additions comes from the non-OECD, with OECD<br />
contracting by a net 0.7 mb/d<br />
• Non-OECD Asia accounts for more than half of expansions,<br />
(China 3.0 mb/d Other Asia 1.4 mb/d), while the Middle East<br />
and Latin America also see large g expansions p ( (2.1 mb/d and<br />
1.1 mb/d respectively)
© OECD/<strong>IEA</strong> 2012<br />
Capacity Additions Outpace Demand Growth<br />
And Increasing Share Met by Other Supplies<br />
mb/d<br />
3.0<br />
2.5<br />
2.0<br />
1.5<br />
1.0<br />
0.5<br />
0.0<br />
-0.5<br />
-1.0<br />
-1.5<br />
CDU Additions vs. Oil Product<br />
Demand Growth<br />
2009 2010 2011 2012 2013 2014 2015 2016<br />
World Demand Capacity Additions<br />
7.0<br />
6.0<br />
5.0<br />
4.0<br />
3.0<br />
2.0<br />
1.0<br />
0.0<br />
mb/d<br />
Cumulative Demand Growth and<br />
Sources of Supply<br />
2011 2012 2013 2014 2015 2016<br />
GTL/CTL Biofuels<br />
NGL transfers Refinery Intake<br />
Direct crude burn Processing Gains<br />
• After a tightening of spare refining capacity over 2010-2011,<br />
global capacity expansions are again expected to outpace oil<br />
product demand growth from 2012<br />
• Furthermore, an increasing share of demand met by NGLs<br />
bypassing refinery system, biofuels, crude direct burn,<br />
processing p g ggains and ggas and coal-to-liquids q
© OECD/<strong>IEA</strong> 2012<br />
Utilisation Rates and Margins Remain Under Pressure<br />
More Closures to Come –Mostly y in OECD<br />
90%<br />
85%<br />
80%<br />
75%<br />
Refinery Utilisation Rates<br />
mb/d Global Spare Capacity at 83%<br />
Utilsation<br />
7<br />
70%<br />
1Q06 1Q08 1Q10 1Q12 1Q14 1Q16<br />
1<br />
0<br />
-1<br />
OECD NNon-OECD OECD WWorld ld 2006 2008 2010 2012 2014 2016<br />
• OECD utilisation rates fall sharply during the recession and only<br />
pick p up p marginally g y as demand recovers<br />
• Non-OECD rates fall less markedly as refiners in strong demand<br />
growth areas are able to sustain higher runs<br />
• If a global utilisation rate of 83% were to be attained, the<br />
average rate during 2006-2008 when we last saw synchronous<br />
healthy margins, an additional 5.9 mb/d of crude distillation<br />
capacity would ld hhave to bbe closed l d or not bbuilt l as planned l d bby<br />
6<br />
5<br />
4<br />
3<br />
2<br />
2016. The bulk of the capacity reductions would likely come from<br />
mature OECD markets.
© OECD/<strong>IEA</strong> 2012<br />
As a Result of Refinery Restructuring in Europe<br />
Crude Imports p Fall on Lower Runs, , Despite p Declining g Production<br />
mb/d OECD Europe Oil Production<br />
7.0<br />
6.0<br />
5.0<br />
4.0<br />
3.0<br />
2.0<br />
1.0<br />
10.0<br />
mb/d Europrean Crude Oil Imports<br />
00 0.0<br />
0.0<br />
1994 1998 2002 2006 2010 2014 1Q20061Q20081Q20101Q20121Q20141Q2016<br />
• European net crude imports already fell from more than 10 mb/d<br />
in 2006, 2006 to 9.6 9 6 mb/d in 2010, 2010 despite a 1.1 1 1 mb/d decline in<br />
regional production<br />
• Towards 2016, net crude oil imports could fall towards 8.0 mb/d,<br />
on continued demand declines and increased competition from<br />
non-OECD refiners<br />
• If that was to happen without further closures, utilisation rates<br />
would fall below 70% in 2016, 2016 from 80% in 2010/2011<br />
• For utilisation to be brought back to 83%, 2.3 mb/d additional<br />
capacity would have to be shut<br />
8.0<br />
6.0<br />
4.0<br />
2.0
© OECD/<strong>IEA</strong> 2012<br />
European Product Imbalances Worsen<br />
• European distillate imports could<br />
reach 1.5 mb/d in 2016, from 1.1<br />
mb/d in 2010<br />
• Additional high quality volumes to<br />
come from Russia, Saudi Arabia,<br />
BBrazil il (after ( ft 2016). 2016) US retain t i<br />
export potential, Asian supplies to<br />
meet regional demand<br />
mb/d European Oil Product Imbalances<br />
1.6<br />
1.4<br />
1.2<br />
1.0<br />
08 0.8<br />
0.6<br />
0.4<br />
0.2<br />
0.0<br />
2008 2010 2012 2014 2016<br />
Gasoline Exports Jet/Gasoil Imports
© OECD/<strong>IEA</strong> 2012<br />
European Gasoline Surplus Persist<br />
Export p Markets Diminish<br />
• K Key European E gasoline li outlets tl t<br />
diminish, with increased self<br />
sufficiency in the US and increased<br />
light product output in Middle East East,<br />
with NGL surge<br />
k b/d US 50: Motor Gasoline Demand<br />
9,500<br />
9,000<br />
8,500<br />
8,000<br />
7,500<br />
2000 2004 2008 2012 2016<br />
Gasoline<br />
Ethanol - energy content adjusted
© OECD/<strong>IEA</strong> 2012<br />
Consequences of Refinery Rationalisation on<br />
Stock Holding<br />
Industry Stock Levels<br />
• Refinery shutdowns reduce level of commercially held<br />
stocks<br />
– Crude oil and unfinished product stocks will be reduced in<br />
proportion to refinery closures<br />
– Reduction of finished product stocks is minimal<br />
• However, location of refinery plays a very important role<br />
Composition<br />
• Share of commercial crude oil stocks down and share of<br />
commercial product stocks up<br />
– The higher the share of crude before refinery closure, the<br />
larger the shift in composition<br />
– If lowered input fuel stocks are compensated by higher<br />
stocks of finished products, the shift is even larger
© OECD/<strong>IEA</strong> 2012<br />
Impact on Stocks in Different Stockholding<br />
Systems<br />
• Lower commercial inventories of crude oil and unfinished<br />
products result in reduction of f overall stock levels<br />
• Reduction of total stocks is less pronounced p<br />
in countries<br />
with public stocks, and more pronounced in countries<br />
relying solely on an industry obligation
© OECD/<strong>IEA</strong> 2012<br />
Impact on Stocks in Different Stockholding<br />
Systems<br />
Impact of a 20% Reduction in Refining Capacity<br />
Reduction in Reduction in Total Change in Oil Stock<br />
Country<br />
Commercial Stocks Stocks Levels in Days of Net<br />
Imports<br />
Countries with public stocks<br />
Belgium 6.0% 2.2% ‐2.8<br />
Czech Republic 4.1% 1.0% ‐1.5<br />
France 10 10.7% 7% 33.7% 7% ‐4.0 4 0<br />
Germany 3.6% 1.0% ‐1.4<br />
Netherlands 10.8% 9.2% ‐16.2<br />
Poland 11.2% 9.8% ‐13.4<br />
Spain 8.0% 4.9% ‐5.5<br />
Countries reliant on industry stocks only<br />
Greece 6.2% 6.2% ‐6.9<br />
Italy 4.8% 4.8% ‐6.4<br />
Sweden 6.0% 6.0% ‐7.4<br />
Turkey 11.6% 11.6% ‐13.0<br />
United Kingdom 9.4% 9.4% ‐44.5
© OECD/<strong>IEA</strong> 2012<br />
Change of Stockholding Regulations?<br />
Should stockholding regulations change to remain compliant<br />
with <strong>IEA</strong> and EU obligations?<br />
<strong>IEA</strong> obligation<br />
• Countries with 90 days of public stocks remain compliant<br />
• Rules for obligated industry stocks prevent most countries<br />
from becoming non-compliant<br />
– Rebalancing: new or remaining operators have to fulfil a<br />
higher stockholding obligation<br />
• Countries without stockholding regime in danger zone<br />
EU obligation<br />
• New rules on accessibility and availability of emergency<br />
stocks<br />
• Stockholding laws might not suffice to compensate for the<br />
reduction in emergency stocks<br />
• Stockholding laws might have to be changed obliging<br />
companies to hold more stocks
© OECD/<strong>IEA</strong> 2012<br />
Impact of Refinery Restructuring on Security<br />
of Supply<br />
• How to define and measure security of supply?<br />
• <strong>IEA</strong> is in process of developing a comprehensive approach to<br />
energy security of supply, and has constructed a Model of<br />
Short-term Energy Security (MOSES)<br />
• MOSES looks at crude and oil products separately using a set of<br />
quantitative indicators of import and domestic risks as well for<br />
resilience capacities to deal with different disruptions.<br />
• To look at impact of refinery closures, both crude and product<br />
security situation has to be evaluated<br />
• Difficulty is to determine overall security or relative importance<br />
of the diverging trends
© OECD/<strong>IEA</strong> 2012<br />
Impact on Security of Supply (2)<br />
While more work is needed to fully measure vulnerability, a<br />
preliminary conclusion of applying MOSES to the situation of<br />
refinery rationalisation in Europe would be that:<br />
• The reduction of the number of refineries would likely<br />
result in an increase of product deficits, deficits pointing to a<br />
worsening of the security of supply of oil products.<br />
• While crude oil imports will decrease, the import<br />
dependency of crude oil will likely remain high and<br />
product stock levels and other indicators are not likely to<br />
change.<br />
• Th Therefore, f by b becoming b i more and d more dependent d d t on<br />
product imports, the region’s security of supply worsens<br />
and Europe becomes more vulnerable to future supply<br />
crises affecting major product export hubs hubs.
© OECD/<strong>IEA</strong> 2012<br />
Conclusions<br />
• With or without further refinery closures in Europe, runs are likely to<br />
fall in line with regional demand and as new capacity is starting up in<br />
the non-OECD<br />
• Based on this crude allocation scenario, without further closures,<br />
utilisation rates in Europe could fall below 70% in 2016<br />
• T To bring b i rates t back b k t to 83% as we had h d over 2006-2008 2006 2008 (the (th last l t time ti<br />
we saw healthy margins) 2.3 mb/d of additional capacity would have<br />
to be shut in Europe, 5.9 mb/d globally.<br />
• While the additional shutdowns would improve margins, this<br />
scenario already assumes that European refiners will not be able to<br />
compete with new refineries, and thus lower runs.<br />
• Import requirements of crude could fall below 8 mb/d, from 9.8<br />
mb/d in 2011<br />
• At the e same sa e time, e, distillate d s a e shortages s o ages would ou d increase, c ease, potentially po e a y to o<br />
more than 1.5 mb/d, from 1.1 mb/d in 2010<br />
• Stockholding laws might have to change to prevent non-compliance<br />
of <strong>IEA</strong> and EU obligations<br />
• Security of supply situation of Europe will worsen with continued<br />
refinery rationalisation
© OECD/<strong>IEA</strong> 2012<br />
<strong>Toril</strong> <strong>Bosoni</strong>,<br />
Senior Oil Market Analyst, Refining<br />
Oil Industry & Markets Division<br />
International Energy Agency<br />
toril.bosoni@iea.org<br />
Thank you