RERC Real Estate Report - REDI-net.com
RERC Real Estate Report - REDI-net.com
RERC Real Estate Report - REDI-net.com
- TAGS
- rerc
- real
- estate
- redi-net.com

Create successful ePaper yourself
Turn your PDF publications into a flip-book with our unique Google optimized e-Paper software.
<strong>RERC</strong> © REAL ESTATE REPORT - THE NATIONAL REAL ESTATE AUTHORITY<br />
Consumer Confidence<br />
Index<br />
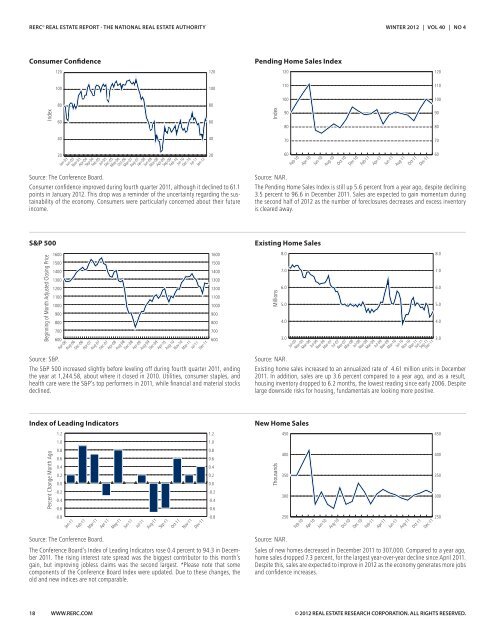
Consumer confidence improved during fourth quarter 2011, although it declined to 61.1<br />
points in January 2012. This drop was a reminder of the uncertainty regarding the sustainability<br />
of the economy. Consumers were particularly concerned about their future<br />
in<strong>com</strong>e.<br />
S&P 500<br />
120<br />
100<br />
80<br />
60<br />
40<br />
20<br />
Jan-03<br />
Jun-03<br />
Nov-03<br />
Source: The Conference Board.<br />
Beginning of Month Adjusted Closing Price<br />
1600<br />
1500<br />
1400<br />
1300<br />
1200<br />
1100<br />
1000<br />
900<br />
800<br />
700<br />
600<br />
Source: S&P.<br />
Index of Leading Indicators<br />
18 WWW.<strong>RERC</strong>.COM<br />
Apr-04<br />
Sep-04<br />
Feb-05<br />
Jul-05<br />
Dec-05<br />
May-06<br />
Oct-06<br />
Mar-07<br />
Aug-07<br />
Jan-08<br />
Jun-08<br />
Nov-08<br />
Apr-09<br />
Sep-09<br />
Feb-10<br />
Jul-10<br />
Dec-10<br />
Jul-11<br />
Jan-12<br />
The S&P 500 increased slightly before leveling off during fourth quarter 2011, ending<br />
the year at 1,244.58, about where it closed in 2010. Utilities, consumer staples, and<br />
health care were the S&P’s top performers in 2011, while financial and material stocks<br />
declined.<br />
Percent Change Month Ago<br />
Apr-06<br />
1.2<br />
1.0<br />
0.8<br />
0.6<br />
0.4<br />
0.2<br />
0.0<br />
-0.2<br />
-0.4<br />
-0.6<br />
-0.8<br />
Aug-06<br />
Dec-06<br />
Source: The Conference Board.<br />
Apr-07<br />
Aug-07<br />
Dec-07<br />
Apr-08<br />
Aug-08<br />
Dec-08<br />
Apr-09<br />
Aug-09<br />
Dec-09<br />
Apr-10<br />
Aug-10<br />
Nov-10<br />
Mar-11<br />
Jul-11<br />
Dec-11<br />
Jan-11<br />
Feb-11<br />
Mar-11<br />
Apr-11<br />
May-11<br />
Jun-11<br />
Jul-11<br />
Aug-11<br />
Sep-11<br />
Oct-11<br />
Nov-11<br />
Dec-11<br />
The Conference Board’s Index of Leading Indicators rose 0.4 percent to 94.3 in December<br />
2011. The rising interest rate spread was the biggest contributor to this month’s<br />
gain, but improving jobless claims was the second largest. *Please note that some<br />
<strong>com</strong>ponents of the Conference Board Index were updated. Due to these changes, the<br />
old and new indices are not <strong>com</strong>parable.<br />
120<br />
100<br />
80<br />
60<br />
40<br />
20<br />
1600<br />
1500<br />
1400<br />
1300<br />
1200<br />
1100<br />
1000<br />
900<br />
800<br />
700<br />
600<br />
1.2<br />
1.0<br />
0.8<br />
0.6<br />
0.4<br />
0.2<br />
0.0<br />
-0.2<br />
-0.4<br />
-0.6<br />
-0.8<br />
Pending Home Sales Index<br />
Index<br />
120<br />
110<br />
100<br />
90<br />
80<br />
70<br />
60<br />
Existing Home Sales<br />
New Home Sales<br />
WINTER 2012 | VOL 40 | NO 4<br />
Feb-10<br />
Apr-10<br />
Jun-10<br />
Aug-10<br />
Oct-10<br />
Dec-10<br />
Feb-11<br />
Apr-11<br />
Jun-11<br />
Aug-11<br />
Oct-11<br />
Dec-11<br />
Source: NAR.<br />
The Pending Home Sales Index is still up 5.6 percent from a year ago, despite declining<br />
3.5 percent to 96.6 in December 2011. Sales are expected to gain momentum during<br />
the second half of 2012 as the number of foreclosures decreases and excess inventory<br />
is cleared away.<br />
Millions<br />
8.0<br />
7.0<br />
6.0<br />
5.0<br />
4.0<br />
3.0<br />
Source: NAR.<br />
Jul-05<br />
Nov-05<br />
Mar-06<br />
Jul-06<br />
Nov-06<br />
Mar-07<br />
Jul-07<br />
Nov-07<br />
Mar-08<br />
Jul-08<br />
Nov-08<br />
Mar-09<br />
Jul-09<br />
Nov-09<br />
Mar-10<br />
Jul-10<br />
Nov-10<br />
Mar-11<br />
Jun-11<br />
Sep-11<br />
Dec-11<br />
Existing home sales increased to an annualized rate of 4.61 million units in December<br />
2011. In addition, sales are up 3.6 percent <strong>com</strong>pared to a year ago, and as a result,<br />
housing inventory dropped to 6.2 months, the lowest reading since early 2006. Despite<br />
large downside risks for housing, fundamentals are looking more positive.<br />
Thousands<br />
450<br />
400<br />
350<br />
300<br />
250<br />
Source: NAR.<br />
Feb-10<br />
Apr-10<br />
Jun-10<br />
Aug-10<br />
Oct-10<br />
Dec-10<br />
Feb-11<br />
Apr-11<br />
Jun-11<br />
Aug-11<br />
Oct-11<br />
Dec-11<br />
Sales of new homes decreased in December 2011 to 307,000. Compared to a year ago,<br />
home sales dropped 7.3 percent, for the largest year-over-year decline since April 2011.<br />
Despite this, sales are expected to improve in 2012 as the economy generates more jobs<br />
and confidence increases.<br />
© 2012 REAL ESTATE RESEARCH CORPORATION. ALL RIGHTS RESERVED.<br />
120<br />
110<br />
100<br />
90<br />
80<br />
70<br />
60<br />
8.0<br />
7.0<br />
6.0<br />
5.0<br />
4.0<br />
3.0<br />
450<br />
400<br />
350<br />
300<br />
250