RERC Real Estate Report - REDI-net.com
RERC Real Estate Report - REDI-net.com
RERC Real Estate Report - REDI-net.com
- TAGS
- rerc
- real
- estate
- redi-net.com

You also want an ePaper? Increase the reach of your titles
YUMPU automatically turns print PDFs into web optimized ePapers that Google loves.
<strong>RERC</strong> © REAL ESTATE REPORT - THE NATIONAL REAL ESTATE AUTHORITY<br />
26 WWW.<strong>RERC</strong>.COM<br />
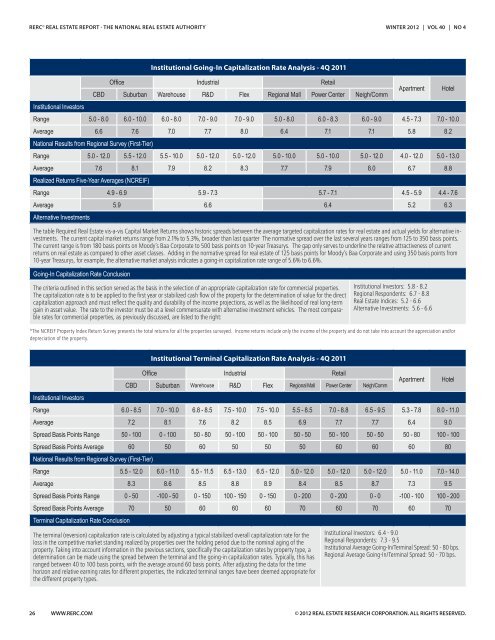
Institutional Going-In Capitalization Rate Analysis - 4Q 2011<br />
Office Industrial Retail<br />
CBD Suburban Warehouse R&D Flex Regional Mall Power Center Neigh/Comm<br />
WINTER 2012 | VOL 40 | NO 4<br />
Apartment Hotel<br />
Institutional Investors<br />
Range 5.0 - 8.0 6.0 - 10.0 6.0 - 8.0 7.0 - 9.0 7.0 - 9.0 5.0 - 8.0 6.0 - 8.3 6.0 - 9.0 4.5 - 7.3 7.0 - 10.0<br />
Average 6.6 7.6 7.0 7.7 8.0 6.4 7.1 7.1 5.8 8.2<br />
National Results from Regional Survey (First-Tier)<br />
Range 5.0 - 12.0 5.5 - 12.0 5.5 - 10.0 5.0 - 12.0 5.0 - 12.0 5.0 - 10.0 5.0 - 10.0 5.0 - 12.0 4.0 - 12.0 5.0 - 13.0<br />
Average 7.6 8.1 7.9 8.2 8.3 7.7 7.9 8.0 6.7 8.8<br />
<strong>Real</strong>ized Returns Five-Year Averages (NCREIF)<br />
Range 4.9 - 6.9 5.9 - 7.3 5.7 - 7.1 4.5 - 5.9 4.4 - 7.6<br />
Average<br />
Alternative Investments<br />
5.9 6.6 6.4 5.2 6.3<br />
The table Required <strong>Real</strong> <strong>Estate</strong> vis-a-vis Capital Market Returns shows historic spreads between the average targeted capitalization rates for real estate and actual yields for alternative investments.<br />
The current capital market returns range from 2.1% to 5.3%, broader than last quarter The normative spread over the last several years ranges from 125 to 350 basis points.<br />
The current range is from 180 basis points on Moody’s Baa Corporate to 500 basis points on 10-year Treasurys. The gap only serves to underline the relative attractiveness of current<br />
returns on real estate as <strong>com</strong>pared to other asset classes. Adding in the normative spread for real estate of 125 basis points for Moody’s Baa Corporate and using 350 basis points from<br />
10-year Treasurys, for example, the alternative market analysis indicates a going-in capitalization rate range of 5.6% to 6.6%.<br />
Going-In Capitalization Rate Conclusion<br />
The criteria outlined in this section served as the basis in the selection of an appropriate capitalization rate for <strong>com</strong>mercial properties.<br />
The capitalization rate is to be applied to the first year or stabilized cash flow of the property for the determination of value for the direct<br />
capitalization approach and must reflect the quality and durability of the in<strong>com</strong>e projections, as well as the likelihood of real long-term<br />
gain in asset value. The rate to the investor must be at a level <strong>com</strong>mensurate with alternative investment vehicles. The most <strong>com</strong>parable<br />
rates for <strong>com</strong>mercial properties, as previously discussed, are listed to the right:<br />
Institutional Investors: 5.8 - 8.2<br />
Regional Respondents: 6.7 - 8.8<br />
<strong>Real</strong> <strong>Estate</strong> Indices: 5.2 - 6.6<br />
Alternative Investments: 5.6 - 6.6<br />
*The NCREIF Property Index Return Survey presents the total returns for all the properties surveyed. In<strong>com</strong>e returns include only the in<strong>com</strong>e of the property and do not take into account the appreciation and/or<br />
depreciation of the property.<br />
Institutional Terminal Capitalization Rate Analysis - 4Q 2011<br />
Office Industrial Retail<br />
CBD Suburban Warehouse R&D Flex Regional Mall Power Center Neigh/Comm<br />
Apartment Hotel<br />
Institutional Investors<br />
Range 6.0 - 8.5 7.0 - 10.0 6.8 - 8.5 7.5 - 10.0 7.5 - 10.0 5.5 - 8.5 7.0 - 8.8 6.5 - 9.5 5.3 - 7.8 8.0 - 11.0<br />
Average 7.2 8.1 7.6 8.2 8.5 6.9 7.7 7.7 6.4 9.0<br />
Spread Basis Points Range 50 - 100 0 - 100 50 - 80 50 - 100 50 - 100 50 - 50 50 - 100 50 - 50 50 - 80 100 - 100<br />
Spread Basis Points Average 60 50 60 50 50 50 60 60 60 80<br />
National Results from Regional Survey (First-Tier)<br />
Range 5.5 - 12.0 6.0 - 11.0 5.5 - 11.5 6.5 - 13.0 6.5 - 12.0 5.0 - 12.0 5.0 - 12.0 5.0 - 12.0 5.0 - 11.0 7.0 - 14.0<br />
Average 8.3 8.6 8.5 8.8 8.9 8.4 8.5 8.7 7.3 9.5<br />
Spread Basis Points Range 0 - 50 -100 - 50 0 - 150 100 - 150 0 - 150 0 - 200 0 - 200 0 - 0 -100 - 100 100 - 200<br />
Spread Basis Points Average 70 50 60 60 60 70 60 70 60 70<br />
Terminal Capitalization Rate Conclusion<br />
The terminal (reversion) capitalization rate is calculated by adjusting a typical stabilized overall capitalization rate for the<br />
loss in the <strong>com</strong>petitive market standing realized by properties over the holding period due to the nominal aging of the<br />
property. Taking into account information in the previous sections, specifically the capitalization rates by property type, a<br />
determination can be made using the spread between the terminal and the going-in capitalization rates. Typically, this has<br />
ranged between 40 to 100 basis points, with the average around 60 basis points. After adjusting the data for the time<br />
horizon and relative earning rates for different properties, the indicated terminal ranges have been deemed appropriate for<br />
the different property types.<br />
Institutional Investors: 6.4 - 9.0<br />
Regional Respondents: 7.3 - 9.5<br />
Institutional Average Going-In/Terminal Spread: 50 - 80 bps.<br />
Regional Average Going-In/Terminal Spread: 50 - 70 bps.<br />
© 2012 REAL ESTATE RESEARCH CORPORATION. ALL RIGHTS RESERVED.