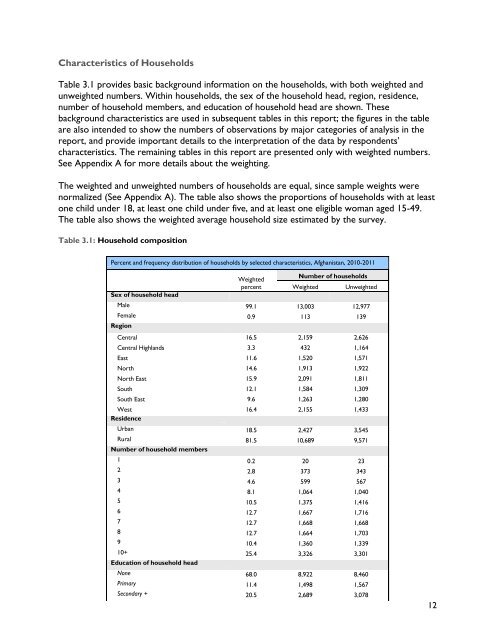
Characteristics of Households Table 3.1 provides basic background information on the households, with both weighted and unweighted numbers. Within households, the sex of the household head, region, residence, number of household members, and education of household head are shown. These background characteristics are used in subsequent tables in this report; the figures in the table are also intended to show the numbers of observations by major categories of analysis in the report, and provide important details to the interpretation of the data by respondents’ characteristics. The remaining tables in this report are presented only with weighted numbers. See Appendix A for more details about the weighting. The weighted and unweighted numbers of households are equal, since sample weights were normalized (See Appendix A). The table also shows the proportions of households with at least one child under 18, at least one child under five, and at least one eligible woman aged 15-49. The table also shows the weighted average household size estimated by the survey. Table 3.1: Household composition Percent and frequency distribution of households by selected characteristics, <strong>Afghanistan</strong>, 2010-2011 Sex of household head Weighted percent Number of households Weighted Unweighted Male 99.1 13,003 12,977 Female 0.9 113 139 Region Central 16.5 2,159 2,626 Central Highlands 3.3 432 1,164 East 11.6 1,520 1,571 North 14.6 1,913 1,922 North East 15.9 2,091 1,811 South 12.1 1,584 1,309 South East 9.6 1,263 1,280 West 16.4 2,155 1,433 Residence Urban 18.5 2,427 3,545 Rural 81.5 10,689 9,571 Number of household members 1 0.2 20 23 2 2.8 373 343 3 4.6 599 567 4 8.1 1,064 1,040 5 10.5 1,375 1,416 6 12.7 1,667 1,716 7 12.7 1,668 1,668 8 12.7 1,664 1,703 9 10.4 1,360 1,339 10+ 25.4 3,326 3,301 Education of household head None 68.0 8,922 8,460 Primary 11.4 1,498 1,567 Secondary + 20.5 2,689 3,078 12
Percent and frequency distribution of households by selected characteristics, <strong>Afghanistan</strong>, 2010-2011 Weighted Number of households percent Weighted Unweighted Total 100.0 13,116 13,116 Households with at least One child age 0-4 years 69.0 13,116 13,116 One child age 0-17 years 94.2 13,116 13,116 One woman age 15-49 years 96.3 13,116 13,116 Mean household size 7.8 13,116 13,116 Characteristics of the Population The weighted age and sex distribution of the survey population is provided in Table 3.2. The distribution is also used to produce the population pyramid in Figure 3.1. Table 3.2: Population distribution by age and sex Percent and frequency distribution of the household population by five-year age groups, dependency age groups, and by child (age 0-17 years) and adult populations (age 18 or more), by sex, <strong>Afghanistan</strong>, 2010-2011 Age Males Females Total Number Percent Number Percent Number Percent 0-4 7,972 15.0 7,503 15.4 15,475 15.2 5-9 8,928 16.8 8,267 17.0 17,195 16.9 10-14 7,500 14.1 6,899 14.2 14,399 14.2 15-19 6,578 12.4 5,748 11.8 12,326 12.1 20-24 4,750 8.9 4,271 8.8 9,021 8.9 25-29 3,589 6.8 3,673 7.6 7,262 7.1 30-34 2,747 5.2 2,494 5.1 5,241 5.2 35-39 2,238 4.2 2,427 5.0 4,664 4.6 40-44 1,965 3.7 1,846 3.8 3,811 3.7 45-49 1,562 2.9 1,474 3.0 3,036 3.0 50-54 1,385 2.6 1,648 3.4 3,033 3.0 55-59 956 1.8 788 1.6 1,743 1.7 60-64 1,211 2.3 688 1.4 1,899 1.9 65-69 554 1.0 327 0.7 881 0.9 70-74 662 1.2 290 0.6 952 0.9 75-79 215 0.4 92 0.2 307 0.3 80-84 200 0.4 90 0.2 290 0.3 85+ 128 0.2 47 0.1 175 0.2 Dependency age groups 0-14 24,400 45.9 22,668 46.7 47,069 46.3 15-64 26,981 50.8 25,056 51.6 52,037 51.2 65+ 1,759 3.3 846 1.7 2,605 2.6 Child and adult populations Children age 0-17 years 28,304 53.3 25,988 53.5 54,292 53.4 Adults age 18+ years 24,835 46.7 22,583 46.5 47,418 46.6 Total 100.0 100.0 100.0 In the 13,116 households successfully interviewed in the survey, 101,713 household members were listed. Of these, 53,140 were males, and 48,573 were females. 13
- Page 2 and 3: Afghanistan Multiple Indicator Clus
- Page 4 and 5: Further, the Government and the don
- Page 6 and 7: Care of illness 3.8 Oral rehydratio
- Page 8 and 9: Table of Contents Foreword ........
- Page 10 and 11: 12. HIV and AIDS ..................
- Page 12 and 13: Table 7.9: Water and soap at place
- Page 14 and 15: List of Figures Figure 2.1: Map Sho
- Page 16 and 17: U5MR Under-five Mortality Rate UNAI
- Page 18 and 19: Executive Summary The Afghanistan M
- Page 20 and 21: the prevalence of anaemia among pre
- Page 22 and 23: In 2010/2011, 29% of school eligibl
- Page 24 and 25: Background This report is based on
- Page 26 and 27: The AMICS was carried out by Afghan
- Page 28 and 29: Sample Design The sample for the AM
- Page 30 and 31: Of the 13,468 households selected f
- Page 32 and 33: to mock interviews between trainees
- Page 36 and 37: 85+ 80-84 75-79 70-74 65-69 60-64 5
- Page 38 and 39: Percent and frequency distribution
- Page 40 and 41: 4 Child Mortality
- Page 42 and 43: thousand live births. These estimat
- Page 44 and 45: The child mortality findings from A
- Page 46 and 47: 5 Nutrition
- Page 48 and 49: Nutritional Status Table 5.1 shows
- Page 50 and 51: Breastfeeding, Infant and Young Chi
- Page 52 and 53: Table 5.2 provides the proportion o
- Page 54 and 55: Percentage of living children accor
- Page 56 and 57: Median duration of any breastfeedin
- Page 58 and 59: 1 MICS indicator 2.12 Overall, 20%
- Page 60 and 61: 1 MICS indicator 2.11 Table 5.8 sho
- Page 62 and 63: Percent 60 50 40 30 20 10 0 Childre
- Page 64 and 65: Percent distribution of children ag
- Page 66 and 67: Table 5.12: Anaemia Status of Women
- Page 68 and 69: 6 Child Health
- Page 70 and 71: Table 6.2: Vaccinations in first ye
- Page 72 and 73: Percentage of children age 12-23 mo
- Page 74 and 75: Percentage of women age 15-49 years
- Page 76 and 77: � ORT with continued feeding amon
- Page 78 and 79: Table 6.6: Feeding practices during
- Page 80 and 81: Table 6.7: Oral rehydration therapy
- Page 82 and 83: Figure 6.4 Percentage of children u
- Page 84 and 85:
Percentage of children age 0-59 mon
- Page 86 and 87:
Solid Fuel Use More than three bill
- Page 88 and 89:
Percent distribution of household m
- Page 90 and 91:
7 Water & Sanitation
- Page 92 and 93:
Table 7.1: Use of Improved Water So
- Page 94 and 95:
Use of Adequate Water Treatment Met
- Page 96 and 97:
In Afghanistan, only 20% of househo
- Page 98 and 99:
Percentage of households without dr
- Page 100 and 101:
In Afghanistan, 31% of the populati
- Page 102 and 103:
As shown in Table 7.6, 29% of the h
- Page 104 and 105:
Drinking Water and Sanitation Ladde
- Page 106 and 107:
Overall, 21% of households reported
- Page 108 and 109:
Nationally, it was observed that 60
- Page 110 and 111:
8 Reproductive Health
- Page 112 and 113:
As shown in Table 8.1, 10% of women
- Page 114 and 115:
Table 8.3: Use of contraception Per
- Page 116 and 117:
Antenatal Care The antenatal period
- Page 118 and 119:
Table 8.5: Number of antenatal care
- Page 120 and 121:
midwifery skills is present at ever
- Page 122 and 123:
Percent distribution of women age 1
- Page 124 and 125:
Total 28.0 4.9 64.7 0.2 2.1 100.0 3
- Page 126 and 127:
Early Childhood Education and Learn
- Page 128 and 129:
Percentage of children age 36-59 mo
- Page 130 and 131:
The presence of children’s books
- Page 132 and 133:
low throughout the country. Childre
- Page 134 and 135:
Literacy Among Young Women One of t
- Page 136 and 137:
Primary and Secondary School Partic
- Page 138 and 139:
Percentage of children of primary s
- Page 140 and 141:
Richest 64.9 9.2 1,772 46.3 6.4 1,6
- Page 142 and 143:
Some differences among regions are
- Page 144 and 145:
The ratio of girls to boys attendin
- Page 146 and 147:
Birth Registration The Internationa
- Page 148 and 149:
The estimate provided below is a mi
- Page 150 and 151:
than their counterparts living in t
- Page 152 and 153:
Percentage of children age 2-14 yea
- Page 154 and 155:
Table 11.6: Children's living arran
- Page 156 and 157:
Early Marriage and Polygamy Accordi
- Page 158 and 159:
Primary 9.9 1,595 16.3 44.5 766 15.
- Page 160 and 161:
Table 11.10: Spousal age difference
- Page 162 and 163:
Percentage of women age 15-49 years
- Page 164 and 165:
12 HIV & AIDS
- Page 166 and 167:
Percentage of women age 15-49 years
- Page 168 and 169:
Percentage of young women age 15-24
- Page 170 and 171:
Percentage of women age 15-49 years
- Page 172 and 173:
Percentage of women age 15-49 years
- Page 174 and 175:
The initial estimated required the
- Page 176 and 177:
Since the estimated number of house
- Page 178 and 179:
Appendix B. List of Personnel Invol
- Page 180 and 181:
18 Abdul Baser Assistant Balkh 19 R
- Page 182 and 183:
Hameed, Editor Jalil Bakhshi, Edito
- Page 184 and 185:
Nangarhar (Team #46) Nangarhar (Tea
- Page 186 and 187:
Fahima Haidari Zarmina Mahbob Hashi
- Page 188 and 189:
Age-appropriate breastfeeding 5.5 0
- Page 190 and 191:
Use of improved drinking water sour
- Page 192 and 193:
Exclusive breastfeeding under 6 mon
- Page 194 and 195:
HOUSEHOLD MEMBERS Use of improved d
- Page 196 and 197:
Predominant breastfeeding under 6 m
- Page 198 and 199:
HOUSEHOLD MEMBERS Use of improved d
- Page 200 and 201:
Continued breastfeeding at 1 year 5
- Page 202 and 203:
Appendix D. Data Quality Tables Tab
- Page 204 and 205:
78 25 0.0 9 0.0 79 4 0.0 4 0.0 80+
- Page 206 and 207:
South 1,866 12.1 1,815 12.1 98.8 So
- Page 208 and 209:
Table D.7: Completeness of informat
- Page 210 and 211:
Table D.8: Heaping in anthropometri
- Page 212 and 213:
Table D.10: Observation of under-5s
- Page 214 and 215:
Table D.12: Observation of vaccinat
- Page 216 and 217:
Table D.14: Selection of children a
- Page 218 and 219:
Table D.16: Sex ratio at birth amon
- Page 220 and 221:
2.8 Continued breastfeeding at 2 ye
- Page 222 and 223:
6. CHILD DEVELOPMENT 6.1 Support fo
- Page 224 and 225:
[5] Breastfeeding children: Solid,
- Page 226 and 227:
HH18. Record the time: Hour .......
- Page 228 and 229:
EDUCATION ED ED ED1. Line number Fo
- Page 230 and 231:
WS5. WHO USUALLY GOES TO THIS SOURC
- Page 232 and 233:
HC5. Main material of the exterior
- Page 234 and 235:
CHILD LABOUR CL To be administered
- Page 236 and 237:
CD9. Write name and line number of
- Page 238 and 239:
HH19. Record the time. Hour and min
- Page 240 and 241:
QUESTIONNAIRE FOR CHILDREN UNDER FI
- Page 242 and 243:
BIRTH REGISTRATION BR BR1. DOES (na
- Page 244 and 245:
EC5. DOES (name) ATTEND ANY ORGANIZ
- Page 246 and 247:
BF12. DID (name) DRINK ANY OTHER LI
- Page 248 and 249:
CA6. WHAT (ELSE) WAS GIVEN TO TREAT
- Page 250 and 251:
IMMUNIZATION IM If an immunization
- Page 252 and 253:
IM18. HAS (name) RECEIVED A VITAMIN
- Page 254 and 255:
� No. � End the interview with
- Page 256 and 257:
QUESTIONNAIRE FOR INDIVIDUAL WOMEN
- Page 258 and 259:
CHILD MORTALITY CM All questions re
- Page 260 and 261:
DESIRE FOR LAST BIRTH DB This modul
- Page 262 and 263:
MN9. DID YOU RECEIVE ANY TETANUS IN
- Page 264 and 265:
ILLNESS SYMPTOMS IS IS1. Check Hous
- Page 266 and 267:
ATTITUDES TOWARD DOMESTIC VIOLENCE
- Page 268 and 269:
HIV/AIDS HA HA1. NOW I WOULD LIKE T
- Page 270 and 271:
ANTHROPOMETRY ANW After questionnai
- Page 272:
WOMEN AGED 15-49 SELECTED FOR BLOOD