

Afghanistan Multiple Indicator Cluster Survey - Childinfo.org
Afghanistan Multiple Indicator Cluster Survey - Childinfo.org
Afghanistan Multiple Indicator Cluster Survey - Childinfo.org

You also want an ePaper? Increase the reach of your titles
YUMPU automatically turns print PDFs into web optimized ePapers that Google loves.
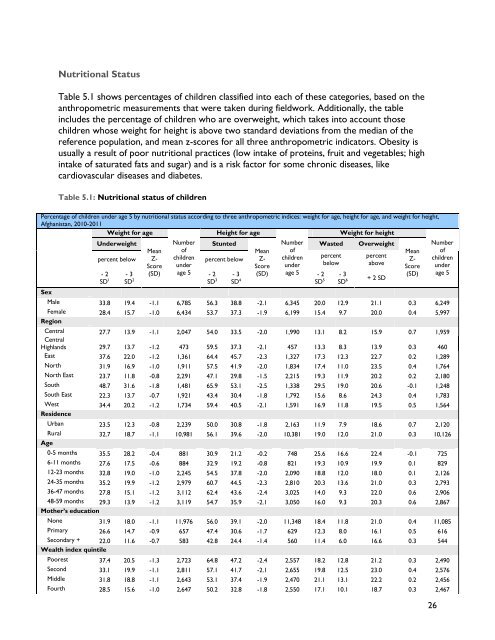
Nutritional Status<br />
Table 5.1 shows percentages of children classified into each of these categories, based on the<br />
anthropometric measurements that were taken during fieldwork. Additionally, the table<br />
includes the percentage of children who are overweight, which takes into account those<br />
children whose weight for height is above two standard deviations from the median of the<br />
reference population, and mean z-scores for all three anthropometric indicators. Obesity is<br />
usually a result of poor nutritional practices (low intake of proteins, fruit and vegetables; high<br />
intake of saturated fats and sugar) and is a risk factor for some chronic diseases, like<br />
cardiovascular diseases and diabetes.<br />
Table 5.1: Nutritional status of children<br />
Percentage of children under age 5 by nutritional status according to three anthropometric indices: weight for age, height for age, and weight for height,<br />
<strong>Afghanistan</strong>, 2010-2011<br />
Weight for age<br />
Height for age<br />
Weight for height<br />
Sex<br />
Underweight<br />
Mean<br />
Number<br />
of<br />
Stunted<br />
percent below Z-<br />
Score<br />
children<br />
under<br />
percent below<br />
- 2<br />
(SD) age 5<br />
SD1 - 3<br />
SD2 - 2<br />
SD3 - 3<br />
SD4 Mean<br />
Z-<br />
Score<br />
(SD)<br />
Number<br />
of<br />
children<br />
under<br />
age 5<br />
Wasted Overweight<br />
percent<br />
below<br />
percent<br />
above<br />
Male 33.8 19.4 -1.1 6,785 56.3 38.8 -2.1 6,345 20.0 12.9 21.1 0.3 6,249<br />
Female 28.4 15.7 -1.0 6,434 53.7 37.3 -1.9 6,199 15.4 9.7 20.0 0.4 5,997<br />
Region<br />
- 2<br />
SD 5<br />
- 3<br />
SD 6<br />
+ 2 SD<br />
Mean<br />
Z-<br />
Score<br />
(SD)<br />
Number<br />
of<br />
children<br />
under<br />
age 5<br />
Central 27.7 13.9 -1.1 2,047 54.0 33.5 -2.0 1,990 13.1 8.2 15.9 0.7 1,959<br />
Central<br />
Highlands 29.7 13.7 -1.2 473 59.5 37.3 -2.1 457 13.3 8.3 13.9 0.3 460<br />
East 37.6 22.0 -1.2 1,361 64.4 45.7 -2.3 1,327 17.3 12.3 22.7 0.2 1,289<br />
North 31.9 16.9 -1.0 1,911 57.5 41.9 -2.0 1,834 17.4 11.0 23.5 0.4 1,764<br />
North East 23.7 11.8 -0.8 2,291 47.1 29.8 -1.5 2,215 19.3 11.9 20.2 0.2 2,180<br />
South 48.7 31.6 -1.8 1,481 65.9 53.1 -2.5 1,338 29.5 19.0 20.6 -0.1 1,248<br />
South East 22.3 13.7 -0.7 1,921 43.4 30.4 -1.8 1,792 15.6 8.6 24.3 0.4 1,783<br />
West 34.4 20.2 -1.2 1,734 59.4 40.5 -2.1 1,591 16.9 11.8 19.5 0.5 1,564<br />
Residence<br />
Age<br />
Urban 23.5 12.3 -0.8 2,239 50.0 30.8 -1.8 2,163 11.9 7.9 18.6 0.7 2,120<br />
Rural 32.7 18.7 -1.1 10,981 56.1 39.6 -2.0 10,381 19.0 12.0 21.0 0.3 10,126<br />
0-5 months 35.5 28.2 -0.4 881 30.9 21.2 -0.2 748 25.6 16.6 22.4 -0.1 725<br />
6-11 months 27.6 17.5 -0.6 884 32.9 19.2 -0.8 821 19.3 10.9 19.9 0.1 829<br />
12-23 months 32.8 19.0 -1.0 2,245 54.5 37.8 -2.0 2,090 18.8 12.0 18.0 0.1 2,126<br />
24-35 months 35.2 19.9 -1.2 2,979 60.7 44.5 -2.3 2,810 20.3 13.6 21.0 0.3 2,793<br />
36-47 months 27.8 15.1 -1.2 3,112 62.4 43.6 -2.4 3,025 14.0 9.3 22.0 0.6 2,906<br />
48-59 months 29.3 13.9 -1.2 3,119 54.7 35.9 -2.1 3,050 16.0 9.3 20.3 0.6 2,867<br />
Mother’s education<br />
None 31.9 18.0 -1.1 11,976 56.0 39.1 -2.0 11,348 18.4 11.8 21.0 0.4 11,085<br />
Primary 26.6 14.7 -0.9 657 47.4 30.6 -1.7 629 12.3 8.0 16.1 0.5 616<br />
Secondary + 22.0 11.6 -0.7 583 42.8 24.4 -1.4 560 11.4 6.0 16.6 0.3 544<br />
Wealth index quintile<br />
Poorest 37.4 20.5 -1.3 2,723 64.8 47.2 -2.4 2,557 18.2 12.8 21.2 0.3 2,490<br />
Second 33.1 19.9 -1.1 2,811 57.1 41.7 -2.1 2,655 19.8 12.5 23.0 0.4 2,576<br />
Middle 31.8 18.8 -1.1 2,643 53.1 37.4 -1.9 2,470 21.1 13.1 22.2 0.2 2,456<br />
Fourth 28.5 15.6 -1.0 2,647 50.2 32.8 -1.8 2,550 17.1 10.1 18.7 0.3 2,467<br />
26


