2009 Annual Report - CRH
2009 Annual Report - CRH
2009 Annual Report - CRH
- TAGS
- annual
- www.crh.com

Create successful ePaper yourself
Turn your PDF publications into a flip-book with our unique Google optimized e-Paper software.
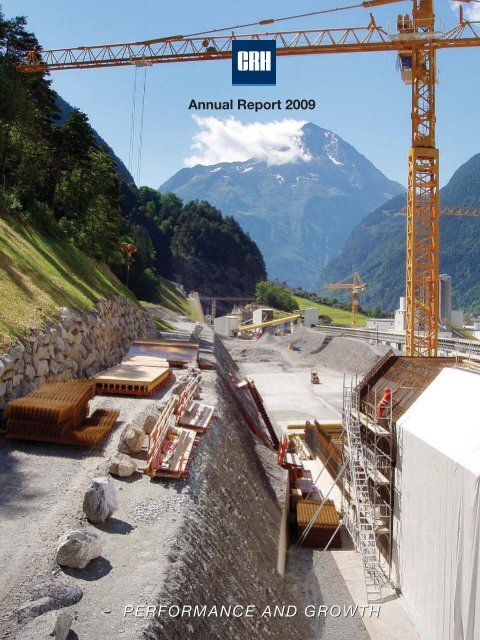
<strong>Annual</strong> <strong>Report</strong> <strong>2009</strong><br />
PERFORMANCE AND GROWTH
<strong>CRH</strong> is a diversified building<br />
materials group which<br />
manufactures and distributes<br />
building material products<br />
from the fundamentals of heavy<br />
materials and elements to<br />
construct the frame, through<br />
value-added exterior products<br />
that complete the building<br />
envelope, to distribution channels<br />
which service construction<br />
fit-out and renewal.
Contents<br />
inside cover <strong>CRH</strong> at a Glance<br />
1 <strong>2009</strong> Key Financial Figures<br />
2 to 3 <strong>CRH</strong> Overview<br />
4 to 9 <strong>CRH</strong> Strategy in Action<br />
10 to 11 Corporate Social Responsibility<br />
12 to 13 Chairman’s Statement<br />
14 to17 Chief Executive’s Review<br />
18 to 35 Group Operations<br />
36 to 39 Finance Review<br />
40 to 41 Board of Directors<br />
42 to 47 Corporate Governance <strong>Report</strong><br />
48 to 50 Directors’ <strong>Report</strong><br />
51 to 59 <strong>Report</strong> on Directors’ Remuneration<br />
60 Statement of Directors’ Responsibilities<br />
61 Independent Auditors’ <strong>Report</strong><br />
62 to 65 Financial Statements<br />
66 to 71 Accounting Policies<br />
72 to 119 Notes on Financial Statements<br />
120 to 121 Shareholder Information<br />
122 to 123 Management<br />
124 to 128 Principal Subsidiary Undertakings<br />
129 Principal Joint Venture and Associated Undertakings<br />
130 to 131 Group Financial Summary<br />
132 to 133 Index<br />
Key Financial Figures <strong>2009</strong><br />
€ million<br />
Sales 17,373 -17%<br />
EBITDA 1,803 -32%<br />
Operating profit (EBIT) 955 -48%<br />
Profit before tax 732 -55%<br />
Operating cashflow 1,160 +103%<br />
Basic earnings per share<br />
cents<br />
88.3 -58%<br />
Cash earnings per share 214.7 -38%<br />
Dividend per share 62.5 –<br />
Net Debt/EBITDA<br />
times<br />
2.1<br />
EBITDA Interest cover 6.1<br />
Dividend cover 1.4
<strong>CRH</strong> at a Glance<br />
Materials Concrete Products Exterior Products Distribution<br />
Cement<br />
Aggregates<br />
Asphalt<br />
Readymixed Concrete<br />
<strong>CRH</strong> operates vertically integrated<br />
primary materials businesses with<br />
strategically-located long-term<br />
reserves in all its major markets.<br />
<strong>CRH</strong> has permitted reserves totalling<br />
approximately 14 billion tonnes<br />
worldwide: circa 11 billion tonnes<br />
in the Americas and circa 3 billion<br />
tonnes in Europe. These materials<br />
businesses service both infrastructure<br />
and new construction demand.<br />
The Materials strategy is to build<br />
and maintain strong vertically<br />
integrated businesses with leading<br />
market positions. This is achieved by<br />
accumulating long-term permitted<br />
reserves, continuously investing<br />
in plant and equipment for quality,<br />
efficiency and customer service,<br />
while seeking out value-creating<br />
expansion opportunities via greenfield<br />
development and acquisitions in<br />
selected markets.<br />
Structural Concrete<br />
Architectural Concrete<br />
Construction Accessories<br />
<strong>CRH</strong> manufactures structural and<br />
architectural concrete products for<br />
use in residential, non-residential<br />
and infrastructure applications.<br />
These include building systems and<br />
engineered concrete solutions for<br />
use in the electrical, transportation,<br />
drainage and communications<br />
industries, architectural products to<br />
enhance the facade and surroundings<br />
of buildings, while construction<br />
accessories produces components to<br />
assist in the construction process.<br />
The strategy of these businesses<br />
is to build and expand leadership<br />
positions in targeted markets in the<br />
manufacture of concrete products<br />
and related accessories. This is<br />
achieved by continuously improving<br />
the businesses with state-of-the-art<br />
IT; exchange of process and product<br />
know-how; leveraging engineering,<br />
project management, logistics and<br />
marketing skills; while also pursuing<br />
new opportunities.<br />
Clay<br />
Glass<br />
Entrance Control<br />
Building Products<br />
<strong>CRH</strong> produces a range of<br />
complementary value-added building<br />
products to complete the building<br />
envelope, each of which serves to<br />
provide a balanced exposure to<br />
demand drivers. Principal products<br />
include architectural glass, clay brick<br />
and block, and entrance control<br />
products. Additional products<br />
include insulation and climate control<br />
products.<br />
The strategy of the Exterior Products<br />
businesses is to develop current<br />
strong positions and to seek new<br />
platforms for growth in these<br />
complementary product segments.<br />
This is achieved by increasing the<br />
penetration of <strong>CRH</strong> products;<br />
edge-expansion into new<br />
architectural products and solutions;<br />
developing positions to benefit from<br />
scale and best practice, and creating<br />
competitive advantage through<br />
product, process and end-use<br />
innovation.<br />
Builders Merchants<br />
DIY<br />
Geography Products End-use New/RMI<br />
Emerging Regions 15%<br />
Western Europe 35%<br />
North America 50%<br />
Basis annualised EBITDA<br />
Distribution 13%<br />
Exterior Products 7%<br />
Concrete Products 20%<br />
Materials 60%<br />
<strong>CRH</strong> distributes building materials to<br />
general building contractors and<br />
Do-It-Yourself (DIY) customers<br />
in Europe and to professional<br />
roofing/siding and interior products<br />
contractors in the United States.<br />
With a network of over 700 locations<br />
in Europe and over 180 locations in<br />
the United States, <strong>CRH</strong> is a leading<br />
international player in building<br />
materials distribution.<br />
The strategy of the Distribution<br />
businesses is to build and grow<br />
a strong network of professional<br />
builders’ merchants and DIY stores,<br />
primarily in major metropolitan areas.<br />
This is achieved by focussing on<br />
organisational initiatives and bestin-class<br />
IT to realise operational<br />
excellence, optimise the supply<br />
chain and provide superior customer<br />
service, while seeking opportunities<br />
to invest in new regions and other<br />
attractive segments of building<br />
materials distribution.<br />
Residential 35% New Build 55%<br />
Non-residential 30%<br />
Infrastructure 35%<br />
Repair<br />
Maintenance<br />
and<br />
Improvement<br />
(RMI)<br />
45%
Key Financial Figures <strong>2009</strong><br />
€m<br />
2,800<br />
2,600<br />
2,400<br />
2,200<br />
2,000<br />
1,800<br />
1,600<br />
1,400<br />
1,200<br />
1,000<br />
800<br />
600<br />
400<br />
200<br />
0<br />
’05 ’06 ’07 ’08 ’09<br />
cent<br />
280<br />
260<br />
240<br />
220<br />
200<br />
180<br />
160<br />
140<br />
120<br />
100<br />
€ million<br />
Sales 17,373 -17%<br />
EBITDA 1,803 -32%<br />
Operating profit (EBIT) 955 -48%<br />
Profit before tax 732 -55%<br />
Operating cashflow * 1,160 +103%<br />
80<br />
60<br />
40<br />
20<br />
0<br />
cents<br />
Basic earnings per share 88.3 -58%<br />
Cash earnings per share 214.7 -38%<br />
Dividend per share 62.5 –<br />
times<br />
Net Debt/EBITDA 2.1<br />
EBITDA Interest cover 6.1<br />
EBIT Interest cover 3.2<br />
Dividend cover 1.4<br />
* see Finance Review table 3<br />
’05 ’06 ’07 ’08 ’09<br />
<strong>CRH</strong>’s strategic vision is clear and consistent –<br />
be a responsible international leader in building<br />
materials delivering superior performance and<br />
growth.<br />
<strong>CRH</strong> shares are listed on the Irish (ISE) and<br />
London (LSE) stock exchanges and on the New<br />
York Stock Exchange in the form of American<br />
Depositary Receipts (ADRs).<br />
The Group has consistently delivered superior<br />
long-term growth in total shareholder return.<br />
A shareholder who invested €100 equivalent<br />
in 1970 and re-invested gross dividends would<br />
hold shares valued at €47,762 based on a share<br />
price of €19.01 at 31st December <strong>2009</strong>. This<br />
represents a 17% compound annual return.<br />
EBITDA Earnings per share Dividend per share Total Shareholder Return<br />
cent<br />
65<br />
60<br />
55<br />
50<br />
45<br />
40<br />
35<br />
30<br />
25<br />
20<br />
15<br />
10<br />
5<br />
0<br />
€000<br />
0<br />
’05 ’06 ’07 ’08 ’09 ’05 ’06 ’07 ’08 ’09<br />
65<br />
60<br />
55<br />
50<br />
45<br />
40<br />
35<br />
30<br />
25<br />
20<br />
15<br />
10<br />
5<br />
<strong>CRH</strong> 1
<strong>CRH</strong> Overview<br />
Europe Materials – 24% of Group<br />
The Europe Materials Division is a major vertically<br />
integrated producer of primary materials and<br />
value-added manufactured products operating in<br />
20 countries. The Division is actively involved in the<br />
Group’s development efforts in Asia. Its principal<br />
products are cement, aggregates, readymixed<br />
concrete, concrete products, asphalt and lime.<br />
The major markets are Poland, Ukraine, Finland,<br />
Switzerland, Ireland, Spain and Portugal, together<br />
with India and China in Asia and Turkey in the<br />
Mediterranean. In total, the Division employs<br />
approximately 12,600 people at over 520 locations.<br />
Cement – 13.2m tonnes*<br />
Aggregates – 51.4m tonnes<br />
Asphalt – 3.5m tonnes<br />
Readymixed Concrete – 9.6m cubic metres*<br />
Concrete Products – 5.0m tonnes<br />
Lime – 1.5m tonnes<br />
* Excludes <strong>CRH</strong> share of cement (circa 5.3m tonnes)<br />
and readymixed concrete (circa 0.6m cubic metres)<br />
attributable to associates, Uniland in Spain (26.34%),<br />
Mashav in Israel (25%) and Yatai Cement in China (26%).<br />
Top 10 Cement – Western Europe<br />
Leading national positions: Aggregates<br />
and Readymixed Concrete<br />
No.1 Building Materials – Poland<br />
No.1 Cement – Northeastern China (26%)**<br />
No.2 Cement – Andhra Pradesh, India (50%)**<br />
**<strong>CRH</strong> share<br />
2 <strong>CRH</strong><br />
Europe Products – 16% of Group<br />
Europe Products is organised as three groups of<br />
related manufacturing businesses involved in<br />
concrete, clay and building products. The Division<br />
operates in 20 European countries with the<br />
Netherlands, Belgium, the UK, Germany, France<br />
and Switzerland being its major markets. Europe<br />
Products seeks leadership positions in the markets<br />
and sectors in which it operates and employs<br />
approximately 18,500 people at over 500 locations.<br />
Architectural Concrete – 6.4m tonnes<br />
Precast Concrete – 6.4m tonnes<br />
Clay – 1.9m tonnes<br />
Insulation – 5.3m cubic metres<br />
Fencing & Security – 3.0m lineal metres<br />
Rooflight & Ventilation – 0.9m square metres<br />
No.1 Concrete Products – Western Europe<br />
No.2 Clay facing bricks, pavers and blocks<br />
– Western Europe<br />
No.1 Construction Accessories<br />
– Western Europe<br />
No.1 Fencing & Security – Western Europe<br />
Europe Distribution – 11% of Group<br />
The Distribution Division in Europe encompasses<br />
professional builders merchants and Do-It-Yourself<br />
(DIY) stores. The Division operates in eight European<br />
countries with the Netherlands, Belgium, Germany,<br />
Austria, France and Switzerland being its major<br />
markets. Europe Distribution seeks leadership<br />
positions in the markets and sectors in which it<br />
operates and employs approximately 11,000 people<br />
at over 700 locations.<br />
Business Activities (EBITDA) Business Activities (EBITDA) Business Activities (EBITDA)<br />
50%<br />
Western Europe<br />
15%<br />
New<br />
Regions<br />
End-use (EBITDA)<br />
Residential 35%<br />
Non-residential 35%<br />
Infrastructure 30%<br />
35%<br />
Central &<br />
Eastern Europe<br />
10%<br />
Clay<br />
End-use (EBITDA) End-use (EBITDA)<br />
New 85% Residential 50% New 75%<br />
RMI 15%<br />
50%<br />
Concrete<br />
Non-residential 35%<br />
Infrastructure 15%<br />
20%<br />
Construction<br />
Accessories<br />
20%<br />
Building<br />
Products<br />
RMI 25%<br />
<strong>Annual</strong>ised Production Volumes <strong>Annual</strong>ised Production Volumes Outlets<br />
60%<br />
Benelux<br />
Residential 80%<br />
Non-residential 20%<br />
Builders Merchants – 479 branches<br />
DIY – 241 stores<br />
Leadership Positions Leadership Positions Leadership Positions<br />
40%<br />
Other<br />
Top 3 Building Materials Distributor<br />
– Western Europe<br />
New 30%<br />
RMI 70%
Americas Materials – 37% of Group<br />
The Americas Materials Division operates in 44<br />
states in the United States. Operations are<br />
geographically organised, segmented into East and<br />
West sectors, each containing four regional<br />
business units. These comprise integrated<br />
aggregates, asphalt and readymixed concrete<br />
operations with strategically located long-term<br />
aggregates reserves. Americas Materials employs<br />
approximately 18,000 people at over 1,400<br />
operating locations.<br />
Aggregates – 110.1m tonnes<br />
Asphalt – 39.8m tonnes<br />
Readymixed Concrete – 5.2m cubic metres<br />
No.1 Asphalt – US<br />
No.3 Aggregates – US<br />
Top 5 Readymixed Concrete – US<br />
Americas Products – 10% of Group<br />
The Americas Products Division operates primarily<br />
in the United States and also has a significant<br />
presence in Canada. Its product groups –<br />
Architectural Products, Precast, Glass and MMI – all<br />
have leading positions in national and regional<br />
markets. The Division is also a leading producer of<br />
clay tile products in Argentina and operates glass<br />
fabrication businesses in Argentina and Chile.<br />
Employees total approximately 16,400 at over 480<br />
locations.<br />
Architectural Concrete – 8.7m tonnes<br />
Precast Concrete – 0.9m tonnes<br />
Pipes & Prestressed Concrete – 0.3m tonnes<br />
Clay – 0.7m tonnes<br />
Glass Fabrication – 8.8m square metres glass<br />
and 19.4k tonnes aluminium<br />
Welded Wire Reinforcement – 77.7k tonnes<br />
Fencing Products – 7.9m lineal metres<br />
No.1 Precast Concrete Products – US<br />
No.1 Architectural Concrete Products<br />
– Canada, US<br />
No.1 Architectural Glass Fabrication – US<br />
No.1 Engineered Aluminium Glazing<br />
Systems – US<br />
No.2 Construction Accessories – US<br />
Americas Distribution – 2% of Group<br />
The Americas Distribution Division operates primarily<br />
in the United States. Its sub divisions – exterior and<br />
interior products – both have leading positions in<br />
national and regional markets. Employees total<br />
approximately 3,400 at over 180 locations.<br />
Business Activities (EBITDA) Business Activities (EBITDA) excluding MMI Business Activities (EBITDA)<br />
60%<br />
East<br />
40%<br />
West<br />
45%<br />
APG<br />
25%<br />
Precast<br />
5% S. America<br />
25%<br />
Glass<br />
85%<br />
Exterior<br />
Products<br />
End-use (EBITDA) End-use (EBITDA) End-use (EBITDA)<br />
Residential 10%<br />
Non-residential 25%<br />
Infrastructure 65%<br />
New 35% Residential 40% New 60%<br />
RMI 65%<br />
Non-residential 55%<br />
Infrastructure 5%<br />
RMI 40%<br />
<strong>Annual</strong>ised Production Volumes <strong>Annual</strong>ised Production Volumes Outlets<br />
Residential 55%<br />
Non-residential 45%<br />
Exterior Products (Roofing/Siding)<br />
– 132 branches<br />
Interior Products – 52 branches<br />
Leadership Positions Leadership Positions Leadership Positions<br />
No.4 Roofing/Siding Distributor – US<br />
No.4 Interior Products Distributor – US<br />
15%<br />
Interior<br />
Products<br />
New 30%<br />
RMI 70%<br />
<strong>CRH</strong> 3
Strategy<br />
<strong>CRH</strong> strategy is to sustain and grow a geographically<br />
diversified business with exposure to all segments of<br />
construction demand, enabling <strong>CRH</strong> to achieve its strategic<br />
vision to “be a responsible international leader in building<br />
materials delivering superior performance and growth”.<br />
In delivering this strategy, <strong>CRH</strong> excels in its business<br />
operations, develops its people, builds regional market<br />
leadership positions, reinvests in its existing assets and<br />
acquires well-run, value-creating businesses while seeking<br />
exposure to new development opportunities and creating<br />
horizons for future growth. This approach has enabled <strong>CRH</strong><br />
to build a sustainable business model that can deliver<br />
superior performance and growth through the business cycle.<br />
In <strong>2009</strong>, <strong>CRH</strong> had operations in 35 countries worldwide; 17<br />
developed-world economies in Western Europe and North<br />
America which together delivered approximately 85% of<br />
Group EBITDA; and 18 developing economies in Central and<br />
Eastern Europe, the Mediterranean Basin, South America and<br />
Asia which together delivered approximately 15% of Group<br />
EBITDA.<br />
In the developed-world economies, <strong>CRH</strong>’s strategic focus is<br />
to continue to reinvest in its established platforms for<br />
operational efficiency, product quality and customer service,<br />
and to develop these businesses further through bolt-on<br />
acquisitions which achieve vertical integration, bolster our<br />
strong long-term permitted reserves positions and fill-out<br />
regional and product level positions. In Western Europe and<br />
North America <strong>CRH</strong> has, over time, built a balanced portfolio<br />
of businesses which can service the breadth of building<br />
materials demand from the fundamentals of heavy materials<br />
and elements to construct the frame, through value-added<br />
exterior products that complete the building envelope, to<br />
distribution channels which service construction fit-out and<br />
renewal. In many of its regions, <strong>CRH</strong>’s diverse business base<br />
is uniquely positioned to provide a broad product offering to<br />
the construction industry.<br />
In the developing economies of emerging regions, <strong>CRH</strong>’s<br />
strategy is clear: to target premium assets as an initial footprint,<br />
usually in cement and often in partnership with strong local<br />
established businesses. We identify entry platforms that have<br />
well-located quality operations and good regional market<br />
positions with the potential to develop into integrated building<br />
materials businesses over time. In the mid-1990s, <strong>CRH</strong> applied<br />
this approach to its entry into the Polish market and today is<br />
the leading integrated building materials company in Poland. In<br />
2008 and <strong>2009</strong>, <strong>CRH</strong> established two new platforms in India<br />
and China and looks forward to developing further in these<br />
high growth regions in the future.<br />
4 <strong>CRH</strong><br />
* Basis annualised EBITDA<br />
Developed Regions 85%*
<strong>CRH</strong> is an international group with strong regional, national and<br />
international leadership positions. With operations in 35 countries,<br />
<strong>CRH</strong> employed approximately 80,000 people at over 3,700 locations<br />
in <strong>2009</strong>. From a strong developed-world base, <strong>CRH</strong> is growing its<br />
presence in emerging economic regions.<br />
Emerging Regions 15%*<br />
<strong>CRH</strong> 5
6 <strong>CRH</strong><br />
Shuangyang Cement plant, part of the 26% <strong>CRH</strong>-owned Yatai Cement is<br />
the largest cement plant in northeastern China. Current clinker capacity<br />
is 5 million tonnes based on five operating kilns. This will rise to 7 million<br />
tonnes following the commissioning of a sixth kiln in the fourth quarter of<br />
2010. Shuangyang is located in Jilin Province, 100km south of the<br />
provincial capital Changchun.
.<br />
.<br />
Emerging Regions – Strategy in Action<br />
In the early 2000s, <strong>CRH</strong> commenced a detailed review of Asian markets to identify<br />
possible opportunities to enter the building materials sector in this region. Market size<br />
and scale, population growth and GDP per capita were identified as key leading<br />
indicators for our industry. China, the largest cement market in the world, and India,<br />
the second largest, were identified as being of particular interest. With strong<br />
population growth in both countries, GDP growth of 7% to 9% p.a. and progressive<br />
urbanisation, the development potential was clear and <strong>CRH</strong> focussed on these two<br />
countries as the primary targets for entry into Asian markets.<br />
China<br />
In February 2007, <strong>CRH</strong> completed its first transaction in China with the purchase of<br />
Harbin Sanling Cement Company (‘Sanling Cement’) in Heilongjiang province,<br />
northeast China. This single operation cement plant, with a capacity of 650,000 tonnes<br />
per annum, is located approximately 45 km southeast of Heilongjiang’s largest city,<br />
Harbin (population: 9 million).<br />
In January <strong>2009</strong>, <strong>CRH</strong> established a more significant position with the acquisition of a<br />
26% associate shareholding in Yatai Building Materials Company (‘Yatai Cement’), the<br />
leading player in China’s northeastern provinces (Heilongjiang, Jilin and Liaoning) and a<br />
top 10 cement supplier in China. Yatai Cement has strong ambitions to grow and is<br />
considered to be a primary consolidator of the cement industry in northeastern China.<br />
In early <strong>2009</strong>, Yatai Cement’s operations comprised four integrated cement plants and<br />
four separate grinding stations in Jilin and Heilongjiang, with a cement capacity of<br />
14 million tonnes per annum. Since then, Yatai Cement has expanded its market<br />
presence by increasing its stake in Tonghua Cement in Liaoning and by acquiring Jinyuan<br />
Cement in Jilin. Following these investments, and the completion in 2010 of an extensive<br />
capital expenditure programme, the combined cement capacity of the enlarged Yatai<br />
Cement group will be approximately 21 million tonnes. With excellent assets in a<br />
high-growth region, <strong>CRH</strong> plans to work with its partner to build Yatai Cement into a<br />
significant vertically integrated building materials group in northeastern China.<br />
India<br />
In May 2008, <strong>CRH</strong> entered the Indian building materials market through the acquisition<br />
of a 50% stake in My Home Industries Limited (MHIL), a cement producer headquartered<br />
in Hyderabad with modern production facilities, strong market positions and<br />
excellent reserves in central and eastern Andhra Pradesh. At the time of acquisition,<br />
MHIL’s operations consisted of three cement production units at Mellacheruvu in central<br />
Andhra Pradesh with an annual production capacity of approximately 3 million tonnes.<br />
MHIL has since constructed a new grinding plant at Vishakapatnam on the coast of<br />
Andhra Pradesh, increasing annual production to 4.2 million tonnes and expanding its<br />
market footprint to include the Orissa and West Bengal markets. <strong>CRH</strong> looks forward to<br />
further developing this business with our partner as the Indian economy and building<br />
materials markets evolve.<br />
Our investment focus in Asia is driven by the creation of both long and short-term<br />
shareholder value. As the Chinese and Indian markets develop, more sophisticated<br />
construction markets will emerge and, as has been our experience in Eastern Europe,<br />
a wide range of value-added construction products will be required, enabling <strong>CRH</strong> to<br />
roll out a broader range of products across the industry.<br />
<strong>CRH</strong> 7
8 <strong>CRH</strong><br />
The Cowboys Stadium in Dallas, Texas completed in May <strong>2009</strong> is<br />
the largest National Football League venue in the United States. Each of<br />
Oldcastle’s six product groups provided materials for this 280,000 square<br />
metre, 100,000 seat stadium. Most impressive is the “bowl” area of the<br />
stadium which showcases a 46 metre sliding glass curtain wall,<br />
the largest in the world, supplied by Oldcastle Glass.
.<br />
.<br />
.<br />
.<br />
.<br />
.<br />
Diverse Portfolio – Strategy in Action<br />
<strong>CRH</strong> is a diversified building materials group which provides the sustainable advantages of<br />
both vertical integration in manufacturing and of horizontal integration in servicing the<br />
breadth of customer demand for building materials products. <strong>CRH</strong>’s broad geographic<br />
and product footprint provides balance and stability of performance through the business<br />
cycle and provides multiple platforms for growth.<br />
This balanced portfolio of business activities allows <strong>CRH</strong> supply building materials across<br />
the construction spectrum from infrastructure to non-residential and residential; from new<br />
build to repair, maintenance and improvement (RMI); serving all aspects of demand from<br />
early to late-in-cycle products. <strong>CRH</strong>’s federal structure, strong local management teams<br />
and culture of entrepreneurship ensures a focussed approach to local markets while still<br />
capturing the benefits of operating within a larger group. This uniquely positions <strong>CRH</strong><br />
within its industry to leverage the capabilities of strong vertically integrated materials<br />
businesses with high value-added, engineered products operations and strongly<br />
franchised products and distribution networks.<br />
A recent example of <strong>CRH</strong>’s diverse portfolio in action is the development of a new stadium<br />
for the Dallas Cowboys American football team in Dallas, Texas. Operating as Oldcastle ® ,<br />
<strong>CRH</strong> is the leading integrated building materials company in the United States with<br />
operations in all 50 US states and in 4 Canadian provinces. By leveraging Oldcastle’s<br />
broad product portfolio, <strong>CRH</strong>’s US operations were able to offer the stadium construction<br />
team a wide variety of materials for this project and all six of <strong>CRH</strong>’s product groups in the<br />
US provided materials to this landmark stadium.<br />
Oldcastle Materials – The parking lot was paved with over 8,000 tonnes of Warm<br />
Mix Asphalt produced with Recycled Asphalt Pavement (RAP) and Recycled Asphalt<br />
Shingles (RAS)<br />
Oldcastle Precast – Underground utility boxes and pads facilitate power distribution<br />
for the stadium<br />
Oldcastle APG – Securing the luxury suites, APG’s proprietary ProSpec ® crack isolation<br />
and waterproofing membrane keeps football fans dry; close to 1,900 litres of acrylic sealer<br />
protect the concrete pavers; thousands of cubic metres of block fill, shotcrete and other<br />
specialty concrete products support the massive structure<br />
Oldcastle Glass – Oldcastle Glass’ Engineered Products division fabricated the<br />
aluminium framing on all exterior entrance doors; all 400 luxury suites are encased by<br />
heavy tempered glass with operable sliding/swinging doors; over 6,500 pieces of clear<br />
tempered glass and aluminium framing elements enhance the many hand/guard rails;<br />
the impressive “bowl” area of the stadium showcases a 46 metre sliding glass curtain<br />
wall, the largest in the world<br />
MMI Products – More than a quarter million dollars of Meadow Burke’s reinforcing bar,<br />
supports and concrete forming accessories were used in the numerous precast elements<br />
Allied Distribution – The interior finishes of the stadium incorporate over 400,000 square<br />
metres of wallboard and over 420 tonnes of metal-stud framing and track<br />
With one supplier to manufacture, manage and deliver product to major construction<br />
projects, the benefits to the customer include improved efficiency and increased on-time<br />
delivery as projects unfold. This is a unique and distinctive value proposition that is difficult<br />
to replicate and is offered only by <strong>CRH</strong>/Oldcastle.<br />
<strong>CRH</strong> 9
Corporate Social Responsibility<br />
<strong>CRH</strong>’s CSR Strategy<br />
CSR embraces four key aspects of <strong>CRH</strong>’s business, namely corporate<br />
governance, environmental management and climate change, health & safety<br />
management and social performance. In each of these areas, <strong>CRH</strong> has<br />
clearly defined Group policies, objectives, implementation programmes,<br />
review procedures and reporting mechanisms.<br />
<strong>CRH</strong>’s positive commitment to CSR, which is underpinned by a set of core<br />
values, is one of its defining characteristics. Despite the major changes in the<br />
financial, economic and business climate worldwide in <strong>2009</strong>, further progress<br />
has been made as <strong>CRH</strong> pursued its ongoing mission of Sustainable<br />
Performance and Growth and strove to meet the ever-increasing<br />
expectations of all stakeholders. <strong>CRH</strong> believes that achieving these<br />
expectations will be positive for the business and will enhance its strong<br />
corporate performance.<br />
Corporate Governance<br />
Corporate governance at <strong>CRH</strong> is very highly rated by leading Socially<br />
Responsible Investment (SRI) agencies. At board level <strong>CRH</strong> complies fully<br />
with the requirements of IFRS reporting as well as those of the Combined<br />
Code on Corporate Governance and also with the provisions of the<br />
Sarbanes-Oxley Act in so far as they apply to <strong>CRH</strong>. <strong>CRH</strong> has implemented a<br />
Code of Business Conduct throughout its operations. A detailed review of<br />
corporate governance is addressed on pages 42 to 47 of this <strong>Report</strong>.<br />
Environment and Climate Change<br />
The Group Environmental Policy is implemented across all Group activities<br />
and environmental performance is reviewed annually by the Board. <strong>CRH</strong><br />
continues, through ongoing systematic plant and system upgrading, to make<br />
progress in increasing energy efficiency, reducing waste, optimising water<br />
usage and recycling secondary materials and fuels. Restoration of workedout<br />
pits and quarries is progressing where relevant and biodiversity is actively<br />
encouraged across the Group with many sites achieving public recognition in<br />
this regard.<br />
As part of its CSR commitments, <strong>CRH</strong> has been actively addressing climate<br />
change through research and through developing pragmatic solutions<br />
including significant investments in modern energy-efficient technologies in its<br />
cement, lime and clay brick plants. The production of lower carbon cements<br />
is now a priority. Furthermore, climate change is a driving force in many<br />
activities, as a substantial proportion of <strong>CRH</strong>’s product portfolio is ideally suited<br />
to assist in the implementation of strategies for adaptation to climate change.<br />
The Group is well on target to meet its commitment to reduce specific<br />
cement plant carbon emissions by 15% on 1990 levels by 2015.<br />
Health & Safety<br />
The health and safety of employees and contractors working for the Group is<br />
a priority for the Board and for management at all levels of the organisation.<br />
The implementation of Best Practice in safety management is actively<br />
promoted and implemented across the Group and accident statistics<br />
continue to improve year on year. <strong>CRH</strong> continues to commit significant<br />
resources to improving health & safety at all its locations.<br />
10 <strong>CRH</strong><br />
There were eight fatalities in <strong>2009</strong> in Group subsidiary companies. Each<br />
fatality is a tragedy, not only for the immediate family, but also for colleagues<br />
and the broader community. <strong>CRH</strong> deeply regrets each death and during<br />
<strong>2009</strong>, introduced a Group-wide Strategic Plan for the Elimination of Fatalities.<br />
The plan highlights the fundamental areas that must be carefully managed so<br />
that fatal accidents are eliminated. It is backed up by specific training and<br />
auditing programmes. It aims to develop a greater sense of vulnerability and<br />
to instil a no-compromise philosophy regarding working safely. This CEO-led<br />
plan is being implemented to complement existing safety initiatives and its<br />
roll-out is being accompanied by a comprehensive communication<br />
programme.<br />
Social<br />
<strong>CRH</strong>’s objective is to remain the employer of choice for all employees. <strong>CRH</strong><br />
actively supports social and community activities local to operations. In<br />
addition, plant open days provide opportunities for neighbours living in the<br />
vicinity of production plants to see at first hand the sustainable nature of <strong>CRH</strong><br />
production processes and for plant management to outline the contribution<br />
to sustainable development that is made by <strong>CRH</strong> products.<br />
Communications<br />
<strong>CRH</strong> maintains an open-door policy on communications with key stakeholder<br />
groups. At Group level, <strong>CRH</strong> discusses its CSR performance with the<br />
investment community, SRI Rating Agencies and other interested parties. At<br />
plant and company level, <strong>CRH</strong> is in regular dialogue with local communities,<br />
authorities and regulatory agencies, underlining its commitment to operate as<br />
a good neighbour.<br />
Full details of <strong>CRH</strong>’s corporate social responsibility performance are published<br />
in separate annual CSR <strong>Report</strong>s, which are available for download from<br />
www.crh.com. <strong>CRH</strong> continues to ensure full independent verification of its<br />
CSR reporting to the Global <strong>Report</strong>ing Initiative (GRI) A+ level. The verified<br />
<strong>2009</strong> <strong>CRH</strong> CSR <strong>Report</strong> will be available by mid-2010.<br />
External Endorsements<br />
<strong>CRH</strong> has maintained its distinguished record of being ranked among sector<br />
leaders by leading SRI rating agencies. <strong>CRH</strong> continues as a constituent<br />
member of the FTSE4Good Index and of the Dow Jones World and STOXX<br />
Sustainability Indexes. <strong>CRH</strong> has again been ranked by Sustainable Asset<br />
Management (SAM) as “Gold Class”.
<strong>CRH</strong> is committed to ethically and responsibly managing all aspects of<br />
its operations in the interests of all its stakeholders – employees,<br />
customers, suppliers, neighbours, local communities and shareholders.<br />
<strong>CRH</strong> is committed to embedding Corporate Social Responsibility (CSR)<br />
as an integral component of its performance and growth strategy and to<br />
reporting annually to stakeholders on its CSR performance.<br />
Students from the local community<br />
learning about Shelly Materials’ role<br />
in local conservation at the<br />
company’s Dresden Wildlife Habitat<br />
Council “Corporate Lands<br />
for Learning” site in Ohio, USA.<br />
A restoration project at the Rudus<br />
Skogsgård gravel pit in Finland<br />
where 48,000 trees and plants were<br />
planted which are contributing<br />
to increased biodiversity in the area.<br />
<strong>CRH</strong> 11
Chairman’s Statement<br />
Profitability and Earnings<br />
<strong>2009</strong> posed exceptionally difficult<br />
operating challenges for <strong>CRH</strong>.<br />
Demand levels were severely<br />
impacted by weakened economic<br />
activity and by the most extreme<br />
winter for many years across our<br />
major markets of Europe and North<br />
America. During the year, the shift in<br />
<strong>CRH</strong>’s short-term focus, initiated as<br />
markets deteriorated during 2008,<br />
continued with the implementation of<br />
further wide-ranging cost reduction<br />
measures across the Group.<br />
Against this background, the Group<br />
produced a profit before tax of<br />
€732 million and earnings per share of<br />
88.3 cent after restructuring and<br />
impairment costs. The profit and<br />
earnings outturns represent declines<br />
of 55% and 58% compared with the<br />
2008 outturn of €1.6 billion and<br />
210.2 cent respectively. Despite the<br />
reduction in profits, net debt at the end<br />
of the year was €3.7 billion compared<br />
with €6.1 billion at the end of 2008.<br />
This was the result of an intensified<br />
focus on cash generation, excellent<br />
working capital management and<br />
restrained capital expenditure across<br />
the Group, together with reduced<br />
Our EHL concrete products business<br />
in Germany manufactured and<br />
supplied approximately 2,750 square<br />
metres of Cityplan slabs, 3,500<br />
pieces of Cityplan facings and 1,800<br />
linear metres of Concord block steps<br />
and angle steps to the Aaseeterraces<br />
development in Münster.<br />
These elements were produced in a<br />
special colour “Aasee-grey-yellow”,<br />
drawn up by the architect in<br />
cooperation with EHL.<br />
12 <strong>CRH</strong><br />
levels of development expenditure and<br />
the proceeds from the €1.2 billion<br />
Rights Issue in March <strong>2009</strong>.<br />
Details of the challenges faced by<br />
the Group during <strong>2009</strong> and of the<br />
performances of the separate<br />
Divisions are given in the Chief<br />
Executive’s Review and in the<br />
Operations and Finance Reviews<br />
which follow.<br />
Dividend<br />
With good first-half operating cash<br />
flow delivery and expected strong<br />
second-half inflows, the Board<br />
decided last August that it was<br />
appropriate to maintain the interim<br />
dividend at 18.5 cent (2008 adjusted<br />
for <strong>2009</strong> Rights Issue: 18.48 cent).<br />
Second-half cash generation has<br />
exceeded our August expectations<br />
and the Group has delivered full year<br />
operating cash flow before dividends<br />
of over €1.5 billion. Accordingly, the<br />
Board has decided that it is<br />
appropriate to pay a final dividend of<br />
44.0 cent per share, a slight advance<br />
on 2008’s Rights-adjusted final<br />
dividend of 43.74 cent.<br />
This gives a total dividend for the<br />
year of 62.5 cent (2008: 62.2 cent),<br />
an increase of 0.5%, representing the<br />
26th consecutive year of dividend<br />
growth. It is proposed to pay the final<br />
dividend on 10th May 2010 to<br />
shareholders registered at the close<br />
of business on 12th March 2010.<br />
The dividend of 62.5 cent represents<br />
a gross cash outlay of approximately<br />
€435 million. Deducting the €57<br />
million scrip take-up on the <strong>2009</strong><br />
interim dividend, and assuming no<br />
scrip take-up on the final dividend,<br />
would result in a net cash outlay<br />
close to €378 million, 4.1 times<br />
covered by <strong>2009</strong> operating cash flow<br />
pre-dividends of over €1.5 billion.<br />
<strong>Report</strong>ed <strong>2009</strong> dividend cover<br />
of 1.4 times increases to 2.0 times<br />
when asset impairment and<br />
implementation costs associated<br />
with the Group’s cost reduction<br />
efforts are excluded.<br />
Cost Reduction Programme<br />
In response to weakening markets<br />
over the past three years, the Group<br />
has implemented a range of<br />
measures, which are projected to<br />
deliver total annualised gross savings<br />
of approximately €1.65 billion over<br />
the period 2007-2010 with total<br />
costs to implement of €312 million. A<br />
total of approximately €205 million of<br />
restructuring charges were taken in<br />
<strong>2009</strong> and it is expected that a further<br />
€45 million of implementation costs<br />
will be incurred in 2010.<br />
Development Activity<br />
Total acquisition spend for <strong>2009</strong> was<br />
approximately €0.46 billion. First-half<br />
expenditure included the purchase of<br />
a 26% stake in Yatai Cement, the<br />
leading cement producer in north-<br />
eastern China, along with six other<br />
bolt-on acquisitions across the<br />
Group’s Materials and Distribution<br />
businesses. During the second half<br />
of the year a further 10 transactions<br />
were completed totalling €0.18<br />
billion, details of which were<br />
announced in the Development<br />
Strategy Update in January 2010.<br />
These will add substantial aggregates<br />
reserves, with clear opportunities for<br />
operating and purchasing synergies,<br />
to our American Materials business,
as well as adding to our presence in<br />
northeastern China and in Poland.<br />
Financing Expansion<br />
As a result of the Group’s intense focus<br />
on cash generation and substantial<br />
equity injection achieved by the Rights<br />
Issue in March <strong>2009</strong>, <strong>CRH</strong> has the<br />
financial strength to take advantage of<br />
acquisition opportunities that enhance<br />
our strategic positioning and represent<br />
exceptional value for money.<br />
<strong>CRH</strong> remains well positioned in terms<br />
of debt facilities with year-end net<br />
debt of under €4 billion, which has an<br />
attractive maturity profile. In May <strong>2009</strong>,<br />
the Group raised €0.75 billion with a<br />
debut issue on the Eurobond market.<br />
Market Indices<br />
During <strong>2009</strong>, the Company joined the<br />
Dow Jones EURO STOXX 50 ® Index,<br />
which comprises 50 of the leading<br />
blue-chip companies in the Eurozone<br />
and is licensed to financial institutions.<br />
Also in <strong>2009</strong>, <strong>CRH</strong> was added to the<br />
Dow Jones EURO STOXX ® Select<br />
Dividend 30 Index. <strong>CRH</strong> is also a com-<br />
ponent of a number of other indices,<br />
including the ISEQ 20, the FTSEurofirst<br />
300 and the S&P Europe 250.<br />
Litigation<br />
In December, we received notification<br />
from the Polish Office for Competition<br />
and Consumer Protection that, arising<br />
from an investigation into the Polish<br />
cement industry, it had concluded that<br />
seven companies, including <strong>CRH</strong><br />
subsidiary Grupa O . z arów S.A., had<br />
been involved in anti-competitive<br />
practices. As a result, fines were<br />
levied, including a fine of PLN 104.97<br />
million (approximately €25.6 million)<br />
on Grupa O . z arów. The conclusions of<br />
the investigation are a matter of<br />
serious concern to <strong>CRH</strong>. The Group’s<br />
Code of Business Conduct sets clear<br />
standards for the conduct of its<br />
operations in the various territories in<br />
which the Group operates and<br />
expressly prohibits any anticompetitive<br />
behaviour. We always<br />
understood that Grupa Oz . arów<br />
conducted an independent<br />
commercial policy, which has been<br />
verified by analysis undertaken, at the<br />
request of <strong>CRH</strong>, by leading Polish<br />
economic experts. We have appealed<br />
the conclusions of the investigation<br />
and the fine.<br />
Corporate Governance<br />
A statement setting out <strong>CRH</strong>’s key<br />
governance principles and practices is<br />
provided on pages 42 to 47. The<br />
Board and Management of <strong>CRH</strong> are<br />
committed to achieving the highest<br />
standards of Corporate Governance<br />
and ethical business conduct and are<br />
satisfied that appropriate systems of<br />
internal control are in place<br />
throughout the Group.<br />
From 2010, the Board has decided to<br />
present the <strong>Report</strong> on Directors’<br />
Remuneration to shareholders for the<br />
purposes of an advisory vote. There is<br />
no legal obligation on the Company to<br />
do this and the outcome of the vote is<br />
not binding on the Company. The<br />
Board believes that such a resolution<br />
is good practice and is an<br />
acknowledgement of shareholders’<br />
entitlement to have a ‘say on pay’.<br />
Board and Senior Management<br />
Terry Neill will retire from the Board at<br />
the conclusion of the <strong>Annual</strong> General<br />
Meeting on 5th May 2010. Terry has<br />
been a non-executive Director since<br />
2004 and Chairman of the<br />
Remuneration Committee since 2008.<br />
He has made a very significant<br />
contribution to the effectiveness of the<br />
Board and I wish to thank him for his<br />
valued advice and commitment to the<br />
interests of shareholders.<br />
John Kennedy was co-opted to the<br />
Board on 24th June <strong>2009</strong> as a<br />
non-executive Director. John is<br />
Chairman of Wellstream Holdings plc,<br />
a UK listed company and during a<br />
30 year career in the international<br />
industrial and energy services related<br />
sectors he has served as Executive<br />
Vice President of Halliburton<br />
Company, President of Dresser<br />
Enterprises and Chief Operations<br />
Officer of Brown and Root Services.<br />
He brings valuable international<br />
experience to the Board and his<br />
appointment continues the process of<br />
Board renewal at a pace which is<br />
consistent with the maintenance of the<br />
Board’s teamwork and core values.<br />
As provided for in the Company’s<br />
Articles of Association, John Kennedy<br />
is proposed for election at the <strong>Annual</strong><br />
General Meeting on 5th May 2010.<br />
Also in accordance with the Articles of<br />
Association and best practice in<br />
relation to the re-election of Directors,<br />
Utz-Hellmuth Felcht, Dan O’Connor<br />
and Liam O’Mahony will retire from<br />
the Board and seek re-election at the<br />
<strong>Annual</strong> General Meeting. I have<br />
conducted a formal evaluation of the<br />
performance of all Directors and can<br />
confirm that each of the Directors<br />
continues to perform effectively and to<br />
demonstrate commitment to the role.<br />
Notwithstanding Liam O’Mahony’s<br />
former service as an executive, the<br />
Board considers him to be<br />
independent. In forming this view, the<br />
Board has reviewed his performance<br />
in his capacity as a non-executive<br />
Director since January <strong>2009</strong>. Based<br />
on this review, the Board is satisfied<br />
that Liam’s ability to exercise<br />
independent judgement, and to act in<br />
the best interests of the Group, is in<br />
no way compromised by his former<br />
service as an executive. I strongly<br />
recommend that John Kennedy,<br />
Utz-Hellmuth Felcht, Dan O’Connor<br />
and Liam O’Mahony be re-elected to<br />
the Board.<br />
Angela Malone retired as Group<br />
Company Secretary during the year<br />
after 14 years in that role and I wish to<br />
thank her for her very significant<br />
contribution to the work of the Board<br />
over that time. She was replaced as<br />
Group Company Secretary by Neil<br />
Colgan and I wish Neil every success<br />
in that position.<br />
The Board notes with regret the<br />
death, in November <strong>2009</strong>, of Paddy<br />
Dempsey, a former executive Director<br />
of the Company. Paddy had a record<br />
Kieran McGowan<br />
Chairman<br />
of long and distinguished service and<br />
made a major contribution to <strong>CRH</strong><br />
over that time.<br />
Management and Staff<br />
The performance of <strong>CRH</strong> during<br />
<strong>2009</strong>, particularly in relation to cost<br />
reduction, cash generation and overall<br />
operational excellence, demonstrated<br />
once again the strength, depth and<br />
resilience of our management and<br />
staff. There is a unique culture of<br />
performance and achievement<br />
throughout the Group and this will<br />
ensure that even in the current<br />
exceptionally difficult economic<br />
environment <strong>CRH</strong> has the capacity to<br />
deliver superior performance. On<br />
behalf of the Board, I thank Myles Lee<br />
and all <strong>CRH</strong> employees for their<br />
commitment to the success of the<br />
Group.<br />
Conclusion<br />
Management’s views on the outlook<br />
for 2010 are set out more<br />
comprehensively in the Chief<br />
Executive’s Review and the various<br />
Operations Reviews. The overall<br />
trading outlook for 2010 remains<br />
challenging given forecasts for a slow<br />
pace of recovery from the global<br />
recession and the lag effect for<br />
recovery in construction markets.<br />
Against the background of this<br />
environment, our attention and efforts<br />
will be focussed strongly on ensuring<br />
that our businesses are well<br />
positioned, through continuing cost<br />
reduction, cash generation and<br />
excellence in operational<br />
management, to deal with whatever<br />
trading circumstances may evolve.<br />
Kieran McGowan<br />
1st March 2010<br />
<strong>CRH</strong> 13
14 <strong>CRH</strong><br />
Idaho Sand & Gravel Company paving<br />
a section of the scenic State Highway 55<br />
which follows the Payette River in Valley<br />
County, Idaho. This project included<br />
removal of 63,500 square metres of<br />
existing pavement, laying of 11,090 tonnes<br />
of asphalt, installation of 20 storm drain pipe<br />
crossings and required that single lane<br />
traffic be safely maintained during weekday<br />
construction on this busy tourist route.<br />
The <strong>CRH</strong> team worldwide responded promptly in <strong>2009</strong> to the extremely<br />
difficult trading conditions and delivered strong cash generation in a<br />
difficult operating and financial environment. For 2010, management<br />
remains focussed on operational delivery while continuing to evaluate<br />
acquisition opportunities that offer compelling value and strategic fit.<br />
Myles Lee
Chief Executive’s Review<br />
Overview<br />
The extreme turbulence experienced<br />
in financial markets in the second half<br />
of 2008 took its toll on world<br />
economic activity in <strong>2009</strong>, most<br />
particularly in Europe and the US.<br />
Construction activity in these regions<br />
was hard hit as residential and<br />
non-residential markets declined, with<br />
government-funded infrastructure<br />
investment only partially<br />
compensating. Against this backdrop,<br />
and despite significant ongoing cost<br />
reduction efforts, <strong>CRH</strong> suffered a<br />
significant profit decline.<br />
Key aspects of our <strong>2009</strong> results<br />
include:<br />
.<br />
.<br />
.<br />
.<br />
EBITDA for <strong>2009</strong> was €1,803<br />
million, in line with the guidance<br />
provided in the Trading Update<br />
Statement of 5th January 2010,<br />
representing a decline of 32%<br />
compared with €2,665 million in<br />
2008. EBITDA is stated after<br />
charging costs associated with the<br />
Group’s restructuring efforts of<br />
€205 million (2008: €62 million).<br />
Depreciation and amortisation<br />
costs amounted to €848 million<br />
(2008: €824 million) and include<br />
impairment charges of €41 million<br />
(2008: €14 million).<br />
Operating profit fell 48% to €955<br />
million (2008: €1,841 million) after<br />
restructuring and impairment<br />
charges of €246 million (2008: €76<br />
million). Excluding these charges,<br />
operating profit fell 37%.<br />
Profit before tax and impairment<br />
charges of €773 million was 53%<br />
below 2008 but ahead of the<br />
guidance of €750 million provided<br />
in the January 2010 Trading<br />
Update. After impairment charges<br />
of €41 million (2008: €14 million),<br />
profit before tax of €732 million<br />
showed a decline of 55% on 2008.<br />
.<br />
.<br />
.<br />
.<br />
.<br />
Earnings per share fell 58% to<br />
88.3c (2008: 210.2c adjusted for<br />
the March <strong>2009</strong> Rights Issue).<br />
Dividend per share of 62.5c<br />
showed a slight increase on the<br />
Rights-adjusted 2008 dividend of<br />
62.2c. <strong>2009</strong> represents <strong>CRH</strong>’s 26th<br />
consecutive year of dividend<br />
growth.<br />
Significant working capital<br />
reduction together with capital<br />
expenditure restraint contributed to<br />
operating cash flow of €1.2 billion,<br />
double the 2008 level of €0.6<br />
billion.<br />
Net debt reduced to €3.7 billion<br />
(2008: €6.1 billion) reflecting strong<br />
operating cash flow and proceeds<br />
from the March <strong>2009</strong> Rights Issue<br />
which raised just over €1.2 billion<br />
net of expenses.<br />
With year-end net debt to EBITDA<br />
of 2.1 times and <strong>2009</strong> EBITDA/net<br />
interest of 6.1 times, <strong>CRH</strong> has one<br />
of the most flexible balance sheets<br />
in its sector.<br />
My thanks to all the <strong>CRH</strong> team<br />
worldwide for responding promptly to<br />
the extremely difficult trading<br />
conditions and for delivering such<br />
strong cash generation in a difficult<br />
operating and financial environment.<br />
<strong>2009</strong> Operations<br />
Trading in the first half of <strong>2009</strong> proved<br />
extremely demanding with most<br />
markets impacted by weakening<br />
economic activity, not helped by the<br />
most severe first-quarter weather for<br />
many years in both Europe and North<br />
America. <strong>Report</strong>ed sales for the first<br />
half of <strong>2009</strong> declined by 15% (21%<br />
excluding acquisition and exchange<br />
translation effects), EBITDA fell 41%<br />
and operating profit and profit before<br />
Myles Lee<br />
Chief Executive<br />
tax were down 66% and 82%<br />
respectively.<br />
While conditions in the second half of<br />
<strong>2009</strong> remained challenging, a robust<br />
performance by the Americas<br />
Materials Division combined with<br />
increasing benefits from cost<br />
reduction measures resulted in<br />
improvements in the rate of profit<br />
decline compared to the first half of<br />
the year despite second-half asset<br />
impairment charges. Second-half<br />
sales fell by 19% (18% excluding<br />
acquisition and translation effects),<br />
while EBITDA declined by 26% with<br />
operating profit down 37% and profit<br />
before tax 39% lower than the second<br />
half of 2008.<br />
Europe Materials experienced sharp<br />
profit reductions in Ireland, Finland<br />
and Ukraine with <strong>2009</strong> cement<br />
volumes showing falls of between<br />
35% and 45% on 2008 levels. These<br />
factors combined with adverse<br />
translation effects due to weakness in<br />
the Polish Zloty and Ukrainian Hryvnia<br />
were the main factors influencing the<br />
reported 26% reduction in sales, 46%<br />
reduction in EBITDA and 59%<br />
reduction in operating profit.<br />
Europe Products & Distribution was<br />
less affected in its core Eurozone<br />
markets with reported sales down<br />
12%, EBITDA down 25% and<br />
operating profit down 39%. RMI<br />
(repair maintenance and improvement)<br />
oriented Distribution operations<br />
proved more resilient than Products<br />
operations, where an improved<br />
performance from Clay activities was<br />
more than offset by lower profits in<br />
Concrete and Building Products<br />
businesses.<br />
<strong>CRH</strong> 15
Chief Executive’s Review continued<br />
Americas Materials saw second-half<br />
benefits from infrastructure projects<br />
funded by the American Recovery and<br />
Reinvestment Act. However, with<br />
weaker residential and rapidly declining<br />
non-residential demand, overall<br />
aggregates volumes for the year fell<br />
23%, with asphalt down 15% and<br />
readymixed concrete lower by 32%.<br />
As a result reported US Dollar<br />
revenues fell by 19%. However, strong<br />
pricing and lower energy costs<br />
delivered an overall improvement in<br />
margins limiting the US Dollar EBITDA<br />
and US Dollar operating profit declines<br />
to 12% and 16% respectively.<br />
Americas Products & Distribution,<br />
which relies heavily on residential and<br />
non-residential activity suffered<br />
severely. High-teen percentage sales<br />
declines in Architectural Products and<br />
Roofing & Siding Distribution were<br />
outweighed by more significant<br />
declines in other segments leaving<br />
overall US Dollar sales revenue 25%<br />
lower than in 2008. US Dollar EBITDA<br />
was 58% lower, while US Dollar<br />
operating profit fell 89% exacerbated<br />
by significant losses in MMI due to<br />
steel price erosion.<br />
On July 14th <strong>2009</strong>, Van Neerbos<br />
Bouwmarkten celebrated the<br />
opening of its flagship DIY-store in<br />
Amsterdam. This new store, the<br />
largest Gamma store in the<br />
Netherlands, added 10,000m 2 of<br />
selling-space, reinforcing <strong>CRH</strong>’s<br />
market-leading position with the<br />
GAMMA brand in the Netherlands.<br />
Over 8,000 people visited the store<br />
on its opening day and<br />
approximately 250,000 customers<br />
have visited the store since then.<br />
16 <strong>CRH</strong><br />
Throughout <strong>2009</strong> we continued the<br />
cost reduction efforts initiated in 2007<br />
and progressively implemented further<br />
cost and efficiency measures across<br />
the Group. Combined savings from<br />
these cost actions over the four<br />
years 2007 to 2010 are estimated<br />
at €1.65 billion. These measures are<br />
outlined in the Chief Operating Officer’s<br />
review on page 19.<br />
<strong>2009</strong> Rights Issue & Development<br />
Maintenance of a strong balance<br />
sheet and a disciplined and rigorous<br />
approach to acquisition activity have<br />
always been core financial principles<br />
for <strong>CRH</strong> and this conservative<br />
approach to balance sheet<br />
management and development has<br />
ensured a solid ongoing financial<br />
position over the long term. In March<br />
<strong>2009</strong>, the Board decided it was<br />
appropriate to strengthen <strong>CRH</strong>’s<br />
financial flexibility to ensure that the<br />
Group could take advantage, in its<br />
traditional long-established disciplined<br />
manner, of an expected increased<br />
flow of development opportunities<br />
driven by deleveraging and portfolio<br />
rationalisation across the sector.<br />
The Rights Issue, on the basis of<br />
2 New Ordinary Shares for every<br />
7 existing Ordinary Shares at €8.40<br />
per New Ordinary Share, raised<br />
€1.238 billion net of expenses and<br />
was strongly supported by <strong>CRH</strong>’s<br />
broadly spread investor base.<br />
To date, the flow of acquisition<br />
opportunities arising has been lower<br />
than anticipated, as the mid-<strong>2009</strong><br />
recovery in bond markets facilitated<br />
significant fundraising across the<br />
sector thereby alleviating short-term<br />
financial pressures for many<br />
participants. In addition, a greater<br />
than expected deterioration in industry<br />
trading conditions as <strong>2009</strong><br />
progressed was not matched by<br />
reductions in vendor expectations.<br />
Against this background the Group<br />
invested a total of €0.46 billion during<br />
<strong>2009</strong> on 17 transactions.<br />
First-half expenditure included the<br />
purchase of a 26% associate stake in<br />
Yatai Cement, the leading cement<br />
manufacturer in northeastern China,<br />
plus six other acquisitions across the<br />
Group’s Materials and Distribution<br />
segments. Second-half spending of<br />
€0.18 billion principally comprised<br />
four important bolt-on transactions<br />
in our Americas Materials Division<br />
completed in November/December<br />
plus six smaller Materials transactions<br />
in Poland, China and the US.<br />
For 2010, management remains<br />
focussed on operational delivery while<br />
continuing to evaluate acquisition<br />
opportunities that offer compelling<br />
value and strategic fit. <strong>CRH</strong> expects to<br />
see more acquisition opportunities as<br />
industry participants, both public and<br />
private, re-evaluate their portfolios and<br />
seek to restore flexibility to their<br />
balance sheets.<br />
<strong>2009</strong> Organisation and People<br />
As outlined in the 2008 <strong>Annual</strong> <strong>Report</strong>,<br />
the second half of 2008 and beginning<br />
of <strong>2009</strong> saw significant position<br />
changes at senior management level in<br />
<strong>CRH</strong>, all of which were filled from within<br />
the organisation. In very difficult circum-<br />
stances the new leaders have stepped<br />
up to their roles with energy and<br />
commitment ensuring the continued<br />
effective functioning of the senior team<br />
and indeed the wider organisation.
Responding to the evolving market<br />
environment during <strong>2009</strong> has<br />
obviously required a substantial<br />
re-thinking of organisation structures<br />
and staffing levels with a consequent<br />
reduction in employment levels in all<br />
business segments. These reductions,<br />
while painful and regrettable, have<br />
been necessary to limit the impact on<br />
the Group of sharply lower levels of<br />
demand for our products.<br />
Corporate Social Responsibility<br />
(CSR)<br />
A positive commitment to CSR is at<br />
the centre of <strong>CRH</strong>’s philosophy and<br />
management approach. Throughout<br />
the Group we strive to operate to best<br />
international practice in the areas of<br />
corporate governance, environment<br />
and climate change, health & safety<br />
and social performance. Our<br />
commitment in this regard is set out on<br />
page 10 of this <strong>Report</strong> and in the<br />
separate annual CSR <strong>Report</strong> which is<br />
available for download from our<br />
website, www.crh.com.<br />
Once again in <strong>2009</strong>, <strong>CRH</strong> was<br />
included in the Dow Jones World<br />
and STOXX Sustainability Indexes<br />
on the basis of a rigorous analysis<br />
of performance carried out by<br />
Sustainability Asset Management<br />
(SAM) of Zurich who have rated <strong>CRH</strong><br />
as “Gold Class”. We are also a<br />
member of the FTSE4Good Index and<br />
have been rated amongst the world’s<br />
most highly ranked companies by<br />
GovernanceMetrics International (GMI)<br />
which focuses on performance in the<br />
area of corporate governance.<br />
Strategy<br />
<strong>CRH</strong>’s strategy continues to be<br />
focussed on the manufacture and<br />
distribution of building materials, with<br />
approximately 80% of our business in<br />
heavyside – cement, aggregates,<br />
asphalt, readymixed concrete and<br />
concrete products – and the<br />
remaining 20% split between lightside<br />
value-added building products and<br />
distribution. This mix provides a<br />
balanced exposure to residential/<br />
non-residential/infrastructure<br />
end-uses and also to new build/RMI,<br />
each of which displays different<br />
cyclical characteristics in terms of<br />
timing, amplitude and duration.<br />
In geographical terms <strong>CRH</strong> is<br />
balanced roughly 35% Western<br />
Europe/50% North America/15%<br />
Emerging Regions, the latter<br />
comprising significant operations in<br />
Eastern Europe built up over the last<br />
decade and more recently-established<br />
positions in Asia.<br />
With a challenging trading backdrop<br />
for many of our businesses over the<br />
past two years, management’s<br />
emphasis has been firmly<br />
concentrated on operational delivery<br />
and establishing a base from which to<br />
deliver a strong rebound in margins<br />
and earnings as markets stabilise and<br />
recover over the coming years. This<br />
was accompanied by a curtailment of<br />
development activity from mid-2008<br />
as the economic environment<br />
deteriorated and financial uncertainty<br />
spiked in the aftermath of the Autumn<br />
2008 financial crisis. However,<br />
value-enhancing acquisitions have<br />
been, and will continue to be, a core<br />
driver of <strong>CRH</strong>’s long-term<br />
development and with the recommencement<br />
of acquisition activity<br />
since mid-<strong>2009</strong> we believe that <strong>CRH</strong><br />
is well positioned to deliver an<br />
improving deal flow as industry<br />
valuations adjust and trading visibility<br />
improves.<br />
In addition to our development efforts<br />
we are continuing to re-evaluate<br />
elements of our existing portfolio<br />
which, given recent significant<br />
changes in the economic<br />
environment, may no longer offer the<br />
opportunities for growth and/or<br />
returns originally envisaged.<br />
2010 Outlook<br />
We expect a difficult demand<br />
backdrop through much of 2010 with<br />
continuing declines in non-residential<br />
activity across our markets not helped<br />
by a poor start to the year as a result<br />
of prolonged severe weather in<br />
Europe and North America during<br />
January and February.<br />
In Europe, concerns remain relating to<br />
fiscal deficits in a number of countries,<br />
although some markets have proved<br />
resilient. In Poland, which has<br />
weathered the economic downturn<br />
better than many other European<br />
countries, our operations are<br />
well-placed to benefit from<br />
infrastructure-driven growth in 2010.<br />
In the United States, recent data<br />
releases on residential construction<br />
activity have been below expectations<br />
and the likely timing of recovery in US<br />
residential activity remains unclear. On<br />
infrastructure, the extension of the<br />
SAFETEA-LU Federal Highway<br />
funding programme is currently the<br />
subject of intense debate in the US<br />
Senate and House of Representatives<br />
with progress anticipated over the<br />
next 10 days. Recent euro-weakness<br />
and the relative strengthening of the<br />
Polish Zloty and US Dollar compared<br />
with <strong>2009</strong> will, if maintained, be<br />
beneficial in 2010.<br />
The significant adjustments to our<br />
cost base achieved over the past<br />
three years and our ongoing<br />
restructuring measures, together with<br />
our substantial balance sheet<br />
capacity, have strengthened the<br />
Group operationally and position <strong>CRH</strong><br />
well to respond to upside demand<br />
developments and to avail of<br />
value-enhancing acquisition<br />
opportunities as these arise across<br />
our markets.<br />
Myles Lee<br />
1st March 2010<br />
<strong>CRH</strong> 17
Ibstock Brick’s Ashdown and<br />
Ellistown plants supplied over<br />
150,000 Bexhill Red and 7,000<br />
Arden Red bricks to this new<br />
retirement home at Halebarns,<br />
Cheshire, UK. These natural clay<br />
bricks were chosen to enhance<br />
the Victorian and Edwardian<br />
references in the design of<br />
the building.<br />
18 <strong>CRH</strong>
Group Operations<br />
The global economic crisis of 2008 and <strong>2009</strong><br />
that destabilised markets, reduced consumer<br />
confidence and tightened credit around the<br />
world, impacted almost every company in<br />
Europe and North America and <strong>CRH</strong> was no<br />
exception. Our results reflect the weakest<br />
economic environment in over half a century.<br />
To mitigate the impact of these conditions,<br />
we acted aggressively to manage our<br />
operations, focussing on action items that<br />
were directly within our control. Albert Manifold<br />
Chief Operating Officer<br />
Cost Reduction<br />
As markets declined we were quick to remove excess capacity from our manufacturing and<br />
distribution networks and we scaled our operations to market demand. We were proactive in cutting<br />
costs and continued with the implementation of cost reduction programmes that are expected to<br />
produce more than €1.65 billion of savings in the four years to 2010, of which approximately<br />
€0.85 billion was realised in <strong>2009</strong>. Some 40% of the gross savings of €1.65 billion is estimated to be<br />
permanent in nature.<br />
Restructuring costs of €205 million to implement these programmes have been expensed in <strong>2009</strong><br />
and we anticipate a further €45 million of implementation costs in 2010. Incremental savings in 2010,<br />
after implementation costs, are estimated at €260 million. These initiatives have regrettably<br />
necessitated a reduction in staffing levels as we structure our operations to the new market demand<br />
environment.<br />
Operational Excellence<br />
Commitment to operational excellence has been a core value of <strong>CRH</strong> for forty years. In these<br />
challenging times, we continue to focus across the Group on initiatives that maximise our operational<br />
effectiveness and eliminate inefficiencies. We will continue to concentrate on setting key performance<br />
indicators for the operational elements within our control that contribute most to our performance. In<br />
this way, we aim to manage our costs and improve <strong>CRH</strong>’s competitive positions.<br />
Safety<br />
Our commitment to safety is unwavering. In <strong>2009</strong>, our operations continued to improve their overall<br />
safety performance with record results achieved on the key safety metrics. However, there were<br />
regrettably eight fatalities in Group subsidiary companies during the year. We have, therefore,<br />
launched a specific CEO-led plan to eliminate fatalities. This plan was rolled-out across all locations in<br />
<strong>2009</strong> and is being implemented and monitored with the highest level of commitment from<br />
management at all levels. Safety remains a key priority for the Group and will continue to receive<br />
strong focus and attention at all operating locations.<br />
Overall<br />
We have, in <strong>2009</strong>, shown our willingness to make difficult decisions and to react rapidly to changing<br />
trading conditions. For 2010, we continue to focus on the essentials of managing through these<br />
difficult times, scaling our operations to the market, managing our capacity and controlling our costs.<br />
We are concentrating on the elements within our control that contribute the most to our performance,<br />
including customer satisfaction and operational excellence. The challenges we face today are<br />
significant – but so too are our strengths. Over the medium term, we look forward to accelerating our<br />
growth and to building our leadership in low-cost efficient operations, employee development and<br />
customer service.<br />
<strong>CRH</strong> 19
Significant energy efficiencies, clinker<br />
factor improvements and emissions<br />
reductions are being achieved following<br />
the commissioning of the new €200 million<br />
Kiln 3 production line at Irish Cement’s<br />
Platin Works in Ireland. Lower carbon<br />
CEM II cements now account for over<br />
80% of the company’s product portfolio.<br />
20 <strong>CRH</strong>
Europe Materials<br />
Europe Materials experienced very<br />
challenging trading conditions in<br />
almost all markets in <strong>2009</strong>. The<br />
financial crisis severely impacted<br />
investment in new housing and private<br />
non-residential building. Governmentfunded<br />
infrastructure and public<br />
building reduced this impact<br />
somewhat.<br />
The financial crisis created very difficult market conditions for Europe<br />
Materials leading to significantly reduced volumes and a drop in margins.<br />
In response, initiatives launched to cut costs and reduce capacity during<br />
2008 were intensified and helped mitigate the impact on profitability.<br />
A curtailment of capital expenditure, together with a reduction in working<br />
capital, resulted in a strong cashflow performance for the year.<br />
Results<br />
Operations Review<br />
Henry Morris<br />
Managing Director<br />
Europe Materials<br />
% of<br />
€ million Group <strong>2009</strong> 2008 Change Organic Acquisitions Restructuring Impairments Exchange<br />
Sales Revenue 16% 2,749 3,696 (947) (783) 53 – – (217)<br />
EBITDA* 24% 434 806 (372) (263) 14 (56) – (67)<br />
Operating Profit* 27% 257 631 (374) (260) 10 (56) (9) (59)<br />
Average Net Assets 3,312 3,173<br />
EBITDA Margin 15.8% 21.8%<br />
Operating Profit Margin 9.3% 17.1%<br />
* EBITDA and Operating Profit exclude profit on disposal<br />
of non-current assets<br />
Analysis of Change<br />
<strong>CRH</strong> 21
Europe Materials continued<br />
Ireland<br />
Construction activity in Ireland fell<br />
steeply during the year and cement<br />
volumes were down 45% on 2008<br />
levels. Following the market<br />
contraction experienced in 2008, the<br />
residential and commercial sectors<br />
reduced further, reflecting the overall<br />
weakness in the wider economy, while<br />
the agriculture and infrastructure<br />
sectors, which remained resilient in<br />
<strong>2009</strong>, weakened as the year<br />
progressed. Additional cost-reduction<br />
programmes were implemented<br />
across all the Irish businesses to<br />
reduce capacity with consequent<br />
one-off rationalisation costs. The<br />
decline in sales volumes and the<br />
impact of the significant rationalisation<br />
costs resulted in lower margins and<br />
an operating loss after €6 million asset<br />
impairment charges and €58 million<br />
restructuring costs.<br />
Benelux<br />
Cementbouw, our cement trading,<br />
readymixed concrete and aggregates<br />
business, faced a difficult second half<br />
of the year in which volumes declined.<br />
22 <strong>CRH</strong><br />
While cost reductions and lower fuel<br />
prices limited the impact of lower<br />
volumes, overall operating profit<br />
declined.<br />
Central and Eastern Europe<br />
The Polish economy continued to<br />
expand with modest 1.5% GDP<br />
growth in <strong>2009</strong>. Interest rates were<br />
reduced to 3.5% as inflation<br />
weakened in the second half of the<br />
year but unemployment increased.<br />
Construction activity in the first half<br />
was impacted by a more severe<br />
winter than in previous years and by<br />
the uncertainty in international<br />
financial markets. Activity in the<br />
second half improved, especially in<br />
infrastructure, and volumes were<br />
broadly in line with 2008 levels.<br />
Overall for the year, cement volumes<br />
were down 10% and volumes of<br />
products such as walling and<br />
readymixed concrete to the weaker<br />
residential and commercial segments<br />
were also down. This reflects weaker<br />
residential, commercial and industrial<br />
construction markets offset by<br />
increased public spend on<br />
infrastructure and civil engineering.<br />
However, with stiff competition in all<br />
product areas, margins were under<br />
pressure. While this was somewhat<br />
offset by significant cost savings<br />
initiatives, overall operating profit<br />
declined.<br />
In Ukraine GDP fell by 14% in <strong>2009</strong><br />
and consequently construction<br />
volumes contracted significantly in the<br />
first half. Our cement sales volumes<br />
stabilised somewhat at a lower level in<br />
the second half to finish the year 35%<br />
below the record 2008 levels. While<br />
operating profit for the year was well<br />
below 2008, stable pricing and<br />
significant cost savings, particularly in<br />
the area of fuel, resulted in a reasonable<br />
performance in a difficult year.<br />
Finland and the Baltics<br />
Economic output in Finland declined<br />
by 7.8% in <strong>2009</strong> as the international<br />
downturn negatively impacted on the<br />
export-led industrial base. Unemployment<br />
reached almost 9% by year-end,<br />
and is expected to increase further<br />
during 2010. Overall construction<br />
output in Finland declined by about<br />
15%. Reductions of almost one third<br />
were seen in the new residential and<br />
new non-residential sectors which are<br />
important drivers for cement demand<br />
and which contributed to our cement<br />
volumes in Finland being 40% lower<br />
than in 2008. Central government<br />
finances are stable however, and a<br />
fiscal stimulus package which<br />
focussed on residential and<br />
infrastructure construction helped to<br />
mitigate somewhat the volume<br />
declines. A wide range of costreduction<br />
initiatives, including<br />
extensive production shutdowns and<br />
layoffs, were implemented across all<br />
businesses and price increases were<br />
applied to recover higher energy<br />
input costs.<br />
Our operations in the Baltic States<br />
of Estonia and Latvia, and in<br />
St. Petersburg in Russia, suffered<br />
an unprecedented contraction in<br />
volumes. In response, significant<br />
Northeast<br />
China<br />
Andhra Pradesh<br />
India
operating adjustments were<br />
implemented including the temporary<br />
suspension of some business lines<br />
until such time as trading conditions<br />
improve.<br />
Overall operating profit declined<br />
compared with 2008.<br />
Switzerland<br />
GDP declined by 3.4% in <strong>2009</strong>,<br />
exports dropped by 12.5% but private<br />
consumption remained stable.<br />
Construction output rose by 3.3%,<br />
the highest growth since 2004.<br />
Civil engineering, supported by the<br />
national stimulus programme, grew<br />
by 8.8% and residential construction<br />
was up by 2.3%. Industrial<br />
construction activity declined.<br />
Lower fuel costs partly due to high<br />
usage of alternative fuels, together<br />
with increased volumes in our cement<br />
business and better margins in our<br />
downstream readymixed concrete<br />
and aggregates business, led to<br />
a profit outcome ahead of 2008.<br />
Market leadership<br />
positions<br />
Cement<br />
Top 10 Western Europe<br />
No.1 Finland, Ireland<br />
No.2 Portugal, Switzerland<br />
No.3 Poland, Ukraine, Tunisia (49%)*<br />
No.1 Aegean region, Turkey (50%)*<br />
No.1 Northeast China (26%)*<br />
No.2 Andhra Pradesh, India (50%)*<br />
Aggregates<br />
No.1 Finland, Ireland<br />
Asphalt<br />
No.1 Ireland<br />
Readymixed Concrete<br />
No.1 Finland, Ireland<br />
No.2 Portugal, Switzerland<br />
Agricultural & Chemical Lime<br />
No.1 Ireland<br />
No.2 Poland<br />
Concrete Products<br />
No.1 blocks and rooftiles, Ireland<br />
* <strong>CRH</strong> share<br />
Iberia<br />
Spanish construction activity<br />
continued its decline in <strong>2009</strong>, falling<br />
by about 20%. Residential and<br />
non-residential building fell steeply,<br />
only partly compensated by<br />
infrastructure spend, resulting in a<br />
lower profit outcome.<br />
The Portuguese economy declined by<br />
2.7% in <strong>2009</strong>; however construction<br />
fell by about 7% with the residential<br />
sector registering the largest decline.<br />
Our Secil joint venture, with three<br />
cement plants in Portugal, suffered<br />
from reduced domestic demand but<br />
increased its export volumes albeit at<br />
lower prices. While Secil enjoyed a<br />
good performance in its activities<br />
outside Portugal due to favourable<br />
demand and pricing coupled with<br />
lower fuel costs, operating profit<br />
overall was down on 2008.<br />
Eastern Mediterranean<br />
As expected, the Turkish economy<br />
and domestic Turkish construction<br />
activity continued to contract in <strong>2009</strong>.<br />
Strong export demand however<br />
helped selling prices in the Aegean<br />
region to stabilise in the second half of<br />
the year and the implementation of<br />
strong cost-control measures and<br />
improved operating efficiencies helped<br />
partly to offset the downturn in<br />
domestic demand. Overall operating<br />
profit was lower than 2008.<br />
China<br />
Our Chinese operations performed<br />
well in <strong>2009</strong> with cement volumes in<br />
northeast China increasing by 12%<br />
due to strong demand from<br />
infrastructure projects which were<br />
funded by the government stimulus<br />
programme. This increased demand<br />
created a favourable pricing<br />
environment that enabled our<br />
wholly-owned Sanling Cement to<br />
improve on prior year’s performance;<br />
our new associate Yatai Cement, in<br />
which <strong>CRH</strong> has a 26% share,<br />
exceeded expectations and reached<br />
record volumes.<br />
India<br />
My Home Industries Limited (MHIL),<br />
our 50% cement joint venture in the<br />
Andhra Pradesh region of southern<br />
India, had a strong performance in the<br />
first half of <strong>2009</strong> which benefited from<br />
strong government investment in<br />
housing and infrastructure. However,<br />
following the national elections,<br />
market conditions weakened in the<br />
second half with newly-commissioned<br />
cement capacity putting pressure on<br />
volumes and prices across our market.<br />
This resulted in operating profit for the<br />
year broadly in line with 2008. The<br />
new grinding plant near Vishakapatnam<br />
in eastern Andhra Pradesh was<br />
commissioned in August <strong>2009</strong>.<br />
Outlook<br />
Further declines in construction<br />
activity in Ireland are anticipated in<br />
2010. Lower consumer confidence,<br />
continuing restricted credit availability,<br />
unsold building stock and supply<br />
overcapacity will continue to put<br />
further pressure on volumes and<br />
margins.<br />
Polish GDP is forecast to grow by<br />
between 1.5% and 2% in 2010,<br />
however unemployment is expected<br />
to continue to increase. Inflation levels<br />
are expected to continue to decline<br />
and interest rates are likely to remain<br />
low. An increase in overall<br />
construction activity is expected,<br />
supported by a significant increase in<br />
infrastructure contracts awarded and<br />
a number of sports and stadium<br />
projects required for the European<br />
Football Championships in 2012.<br />
In Ukraine, construction activity is<br />
forecast to increase modestly in 2010<br />
resulting in improved volumes of<br />
cement. This together with continued<br />
focus on cost efficiencies should<br />
deliver improved margins.<br />
Construction demand in Finland is set<br />
to fall further by a mid single-digit<br />
percentage in 2010, with continued<br />
weak levels of activity in non-residential<br />
construction partially offset by<br />
improving residential construction and<br />
relatively stable infrastructure volumes.<br />
Switzerland is expected to stabilise at<br />
current levels. Both residential<br />
construction and infrastructure will<br />
continue to grow and are expected to<br />
compensate for a decline in<br />
non-residential activity.<br />
In Portugal, the outlook remains<br />
challenging with a further decline in<br />
residential activity likely to be offset by<br />
increased infrastructural activity. Cost<br />
efficiencies and improved use of<br />
alternative fuels should help maintain<br />
margins, but export markets are<br />
expected to be more challenging.<br />
Turkish GDP is forecast to grow by<br />
2.5% in 2010 and domestic<br />
construction activity is expected to<br />
increase at a similar rate. The positive<br />
trends experienced during the second<br />
half of <strong>2009</strong> are forecast to continue<br />
into 2010 although cement exports<br />
are likely to face stiff competition.<br />
Cement demand is expected to grow<br />
strongly in northeast China due to the<br />
continuing Government stimulus<br />
package and an improving residential<br />
market. We anticipate further margin<br />
improvement at our Sanling Cement<br />
business. The ongoing investment<br />
programme with Yatai Cement,<br />
together with a full year’s contribution<br />
from new acquisitions, will bring Yatai<br />
Cement’s total cement capacity to<br />
21 million tonnes.<br />
In India, we expect growth in demand<br />
in the Andhra Pradesh region to<br />
recover during 2010 and this should<br />
ease the pressure resulting from<br />
additional supply capacity. A full year<br />
contribution from MHIL’s new grinding<br />
plant is expected to add to sales<br />
growth and performance.<br />
Overall we anticipate more stable<br />
markets for Europe Materials’<br />
products in 2010 and we expect to<br />
benefit from lower energy prices and<br />
cost reductions in our operations.<br />
Industry capacity reductions and some<br />
increase in demand later in the year<br />
should be supportive to margins.<br />
However, the year has commenced<br />
with severe weather in many markets<br />
and the extent to which this will impact<br />
on demand and pricing levels for the<br />
year as a whole remains uncertain.<br />
<strong>CRH</strong> 23
Our Stradal concrete products business<br />
in France supplied 33 standard Beryl<br />
poles (reversed cylinder-cone shaped),<br />
95 anti-parking bollards and a fountain<br />
bollard, all designed in black quartz,<br />
which were erected in Caveirac, France,<br />
during the creation of a new roundabout.<br />
24 <strong>CRH</strong>
Europe Products & Distribution<br />
Throughout <strong>2009</strong>, tough markets across all<br />
sectors where our businesses operate resulted<br />
in a decline in operating profit. The management<br />
team responded vigorously to the challenge<br />
taking radical and effective action to mitigate<br />
these effects. We continue to focus on<br />
commercial initiatives, cost reduction and<br />
performance improvement plans across all<br />
our businesses.<br />
Operations Review<br />
Máirtín Clarke<br />
Managing Director<br />
Europe Products & Distribution<br />
The squeeze on credit and falling consumer confidence hit the housing sector across<br />
all regions. Non-residential activity also declined. The repair, maintenance and<br />
improvement sectors were more resilient. Overall, the Division saw sales decrease by<br />
12%, EBITDA decline by 25% and operating profit decline 39%.<br />
With few exceptions our businesses experienced volume and price pressure. Towards<br />
year-end some improvement in UK brick deliveries was evident. While some degree of<br />
stability has returned to markets in Europe, we expect trading in 2010 to be<br />
challenging.<br />
The Division carried on from 2008 with the implementation of significant cost<br />
reduction actions. Capital expenditure was again cut back and tighter working capital<br />
management yielded a very positive outcome on cash flow. Our focus continued on<br />
defending margins and conserving cash throughout our businesses.<br />
Results<br />
% of<br />
€ million Group <strong>2009</strong> 2008 Change Organic Acquisitions Restructuring Impairments Exchange<br />
Sales Revenue 38% 6,635 7,498 (863) (1,062) 191 – – 8<br />
EBITDA* 27% 487 650 (163) (137) 16 (29) – (13)<br />
Operating Profit* 26% 253 418 (165) (129) 10 (29) (7) (10)<br />
Average Net Assets 3,877 4,096<br />
EBITDA Margin 7.3% 8.7%<br />
Operating Profit Margin 3.8% 5.6%<br />
* EBITDA and Operating Profit exclude profit on disposal<br />
of non-current assets<br />
Analysis of Change<br />
<strong>CRH</strong> 25
Europe Products & Distribution continued<br />
Concrete Products<br />
This group manufactures concrete<br />
products for two principal end-uses:<br />
pavers, tiles and blocks for<br />
architectural use, and floor and wall<br />
elements, beams and vaults for<br />
structural use. In addition, sand lime<br />
bricks are produced for the<br />
residential market. Our businesses<br />
experienced difficult market<br />
circumstances, mainly in residentialrelated<br />
markets and increasingly, as<br />
the year progressed, in the nonresidential<br />
sector. Good progress in<br />
public sector niche markets in France<br />
and the Netherlands was outweighed<br />
by major weaknesses in Denmark<br />
and Eastern Europe.<br />
Architectural<br />
Architectural operations faced<br />
difficult conditions in most markets<br />
and performed below 2008. Our<br />
Belgian, French and Danish paver<br />
and tile businesses suffered from<br />
weak residential markets and falling<br />
consumer confidence. Results in<br />
our Dutch and German operations<br />
improved driven by targeted<br />
26 <strong>CRH</strong><br />
commercial initiatives. After a strong<br />
performance in 2008 the Slovakian<br />
market weakened considerably. In<br />
response to the continuing difficult<br />
market conditions, further factory<br />
closures in Belgium, France, the UK<br />
and Germany were made and<br />
overhead costs were reduced<br />
significantly.<br />
Structural<br />
Our structural concrete operations<br />
delivered operating profit well below<br />
2008. The businesses were severely<br />
impacted by difficult conditions in<br />
residential markets and declining<br />
non-residential activity. Our Belgian<br />
business supplying the industrial and<br />
farming sector delivered strong<br />
results. Due to major restructuring<br />
initiatives taken at our Dutch and<br />
Swiss businesses in 2008, results in<br />
these operations were ahead in <strong>2009</strong>.<br />
The programme of factory closures<br />
and general cost reduction continued<br />
in <strong>2009</strong> especially in Denmark,<br />
Belgium and Hungary where volumes<br />
and prices remained weak.<br />
Clay Products<br />
The Clay Products group principally<br />
produces clay-facing bricks, pavers,<br />
blocks and roof tiles and operates in<br />
the UK, the Netherlands, Germany,<br />
Poland and Belgium and also<br />
supplies various export markets.<br />
For the year as a whole, volumes in<br />
the UK brick industry declined<br />
considerably although some upturn<br />
was visible in the last quarter.<br />
Following the major reorganisation<br />
plans implemented in 2008,<br />
additional factory closures and<br />
production shutdowns took place.<br />
The benefits from these measures<br />
coupled with strong product<br />
innovation resulted in an operating<br />
profit outcome well ahead of 2008.<br />
In Mainland Europe, lower volumes<br />
and energy price increases led to<br />
lower operating profit despite good<br />
progress and benefits from the<br />
new country-based organisation<br />
serving two operating regions,<br />
Central Europe and Eastern<br />
Europe.<br />
Building Products<br />
The Building Products group is active<br />
in lightside building materials and is<br />
organised in three business areas:<br />
Construction Accessories, Building<br />
Envelope Products and Insulation<br />
Products. Market conditions in <strong>2009</strong><br />
deteriorated with the non-residential<br />
sector slowing significantly. With<br />
volumes declining, the operating profit<br />
outcome was lower than in 2008<br />
despite relatively robust pricing.<br />
Construction Accessories<br />
This business unit is the market leader<br />
in construction accessories in<br />
Western Europe. Falling demand,<br />
especially in the non-residential<br />
sector, offset somewhat by new<br />
innovative products brought to<br />
market, resulted in lower operating<br />
profit. Our UK business acquired in<br />
2008 exceeded our expectations<br />
aided by strong export figures. The<br />
main focus is on realising greater<br />
commercial synergies and back-office<br />
cost reduction through a more<br />
integrated organisational structure.<br />
Market leadership<br />
positions<br />
Architectural Concrete<br />
No.1 paving products: Benelux,<br />
France, Slovakia<br />
No.1 paving/landscape walling:<br />
Germany<br />
No.1 architectural masonry: UK<br />
No.2 paving products: Denmark<br />
Structural Concrete Products<br />
No.1 precast flooring: Benelux<br />
No.1 precast architectural concrete:<br />
Denmark<br />
No.1 utility precast: France<br />
No.1 precast structural elements:<br />
Hungary, Switzerland<br />
No.1 concrete fencing and lintels: UK<br />
Clay Products<br />
No.1 facing bricks: UK<br />
No.2 facing bricks, pavers & blocks:<br />
Europe<br />
Insulation Products<br />
No.1 EPS: Ireland, Netherlands,<br />
Poland, Nordic region<br />
No.1 (joint) XPS: Germany (50%)*<br />
No.1 XPE: Germany<br />
No.1 PUR/PIR: Netherlands
Building Envelope Products<br />
These operations specialise in<br />
systems and products for entrance<br />
and climate control solutions, and are<br />
mainly active in non-residential<br />
construction focussing on the growing<br />
RMI, safety and comfort market<br />
segment. Volumes at our Entrance<br />
Control operations in fencing, security<br />
and access systems were lower than<br />
2008. Our Rooflight & Ventilation<br />
business, which specialises in climate<br />
control, suffered a decline in activity<br />
although pricing remained generally<br />
robust. Sales to the industrial sector<br />
continued in line with 2008. The<br />
Roller Shutters business turned in a<br />
satisfactory performance being only<br />
marginally behind 2008 due to<br />
successful new product launches and<br />
tighter cost control. As part of our<br />
annual strategic review of businesses<br />
we have decided to exit climate<br />
control activities and concentrate on<br />
the more focussed Fencing, Security<br />
and Shutters businesses that, for the<br />
future, offer us greater market<br />
leadership potential in Europe.<br />
Construction Accessories<br />
No.1 Western Europe<br />
Fencing & Security<br />
No.1 security fencing and perimeter<br />
protection: Europe<br />
Rooflight & Ventilation<br />
No.1 (joint) glass structures, plastic<br />
rooflights, natural ventilation and<br />
smoke exhaust systems: Europe<br />
Builders Merchants<br />
No.1 Austria, Netherlands, Switzerland,<br />
France: Burgundy, Rhône-Alps<br />
and Franche-Comté,<br />
Germany: Sachsen-Anwalt,<br />
Niedersachsen, northern Nord<br />
Rhein Westfalen<br />
No.2 Ile-de-France<br />
DIY Stores<br />
No.1 Netherlands, No.2 Belgium<br />
Member of Gamma franchise<br />
No.5 Germany (48%)*<br />
Member of Hagebau franchise<br />
No.2 (joint) Portugal (50%)*<br />
* <strong>CRH</strong> share<br />
Insulation Products<br />
Our Insulation business manufactures<br />
a variety of high quality foam products<br />
for use in the residential, nonresidential<br />
and industrial buildings<br />
sectors. The decline in residential<br />
markets, across Europe, and price<br />
pressure in Eastern Europe were the<br />
main reasons for lower operating<br />
profit, although these effects were<br />
tempered by strong demand for RMI<br />
products driven by ongoing European<br />
legislation for energy efficiency.<br />
Following rigorous strategic analysis<br />
we have decided to exit the Insulation<br />
sector as we no longer see a route to<br />
becoming a pan-European leader in<br />
this sector.<br />
Distribution<br />
Trading conditions for our distribution<br />
businesses continued to be very<br />
difficult in <strong>2009</strong> with the residential<br />
sectors across all our markets<br />
showing various degrees of decline.<br />
Price discipline and tight management<br />
in purchasing resulted in gross<br />
margins in line with 2008. However,<br />
operating profit declined 29%. The<br />
principal focus is on further cost<br />
reduction at overhead level, improved<br />
category management and greater<br />
benefits from operational excellence<br />
by leveraging our economies of scale.<br />
Professional Builders Merchants<br />
With 479 locations in six countries,<br />
Professional Builders Merchants has<br />
strong market positions in all its<br />
regions. Benelux: Markets were weak<br />
in <strong>2009</strong> and this resulted in lower<br />
sales and operating profit compared<br />
with 2008. France: All regions<br />
experienced a slowdown and further<br />
restructuring costs resulted in<br />
operating profit well down on 2008.<br />
Trading results at our associate Trialis<br />
(in which we acquired a 34.8%<br />
shareholding in July 2008) were below<br />
expectations as its markets in the<br />
southwest of France proved to be<br />
very difficult. Switzerland: Compared<br />
with other Western European<br />
construction markets, the Swiss<br />
market was less impacted. However<br />
the combination of lower volumes in<br />
heavyside materials and additional<br />
restructuring costs resulted in a lower<br />
operating profit outcome versus 2008.<br />
Austria: Despite slowing sales from a<br />
weaker residential market, our<br />
initiatives to improve gross margin<br />
and reduce overheads contributed<br />
to an increase in operating profit.<br />
Germany: Bauking, in which we have<br />
a 48% joint-venture stake, operates<br />
primarily in northwest Germany. Sales<br />
in this region suffered and despite a<br />
small increase in gross margin and<br />
relentless cost control, like-for-like<br />
operating profit was down. Our<br />
Sanitary, Heating and Plumbing<br />
(SHAP) business in Germany,<br />
acquired in 2008, is a leading player<br />
in the northwest part of the country.<br />
Benefiting from a robust demand for<br />
heating equipment, performance was<br />
in line with expectations. We see this<br />
business as a platform for further<br />
SHAP growth in Germany.<br />
DIY<br />
The DIY Europe platform has activities<br />
in five countries with 241 stores<br />
under five different brands: Gamma<br />
(the Netherlands and Belgium),<br />
Karwei (the Netherlands), Hagebau<br />
(Germany), Maxmat (Portugal) and<br />
Jelf BricoHouse (Spain).<br />
The Netherlands: Despite a sharp<br />
decrease in consumer confidence,<br />
sales and operating profit in the first<br />
half of <strong>2009</strong> were relatively robust but<br />
thereafter demand declined further<br />
especially in the fourth quarter, with<br />
full-year operating profit lower than<br />
2008. Increased competition and<br />
promotional campaigns had a<br />
negative impact on margins; however,<br />
this was mitigated by efficient store<br />
operations, tight cost control and<br />
sharp franchise formula management.<br />
Belgium: Gamma Belgium with 19<br />
locations had lower sales and<br />
operating profit mainly due to weaker<br />
consumer confidence and demand.<br />
Germany: Bauking operates 51 DIY<br />
stores under the brand name<br />
Hagebau. Although Bauking managed<br />
to keep costs under tight control,<br />
operating profit declined in a very<br />
competitive market. Portugal: The<br />
economic environment continued to<br />
be difficult and operating profit was<br />
down on 2008. Spain: We entered the<br />
Spanish DIY market in May 2007 in<br />
the Alicante/Valencia region. Market<br />
circumstances have been very<br />
challenging and results, while below<br />
expectations, were broadly in line with<br />
2008.<br />
Outlook<br />
The markets for our businesses will<br />
continue to be difficult in 2010.<br />
With the exception of the UK, the<br />
residential sector will be challenging<br />
especially in the Netherlands. The<br />
non-residential sector is expected to<br />
weaken further. Public sector<br />
investments in France and<br />
Government infrastructure initiatives<br />
in the Netherlands should provide<br />
some upturn in related concrete and<br />
distribution businesses. The RMI<br />
sector is expected to decline but at a<br />
slower pace than the new building<br />
sector. With the exception of Poland,<br />
Eastern Europe market conditions will<br />
be very demanding. The effects of our<br />
comprehensive cost-reduction<br />
programme initiated in late 2007 will<br />
be continued through into 2010. More<br />
benign energy prices should provide<br />
some relief on the cost side.<br />
<strong>CRH</strong> 27
Pike Industries, laying 181,000<br />
tonnes of asphalt during the<br />
reconstruction of 23 miles of the<br />
I-295 highway in Maine, a project<br />
financed under the US Federal<br />
stimulus programme.<br />
28 <strong>CRH</strong>
Mark Towe<br />
Chief Executive Officer<br />
The Americas<br />
Americas Materials<br />
Americas Materials faced a very challenging<br />
environment in <strong>2009</strong> with severe volume declines<br />
across all product lines. The benefit of lower<br />
energy costs along with aggressive actions to<br />
reduce fixed cost, improve operating efficiency<br />
and increase prices yielded higher operating<br />
margins. US Dollar sales revenue and operating<br />
profit declined 19% and 16% respectively, and<br />
the operating profit margin for the Division<br />
increased by 0.3 percentage points to 9.5%.<br />
Operations Review<br />
Doug Black<br />
Chief Executive Officer<br />
Americas Materials<br />
The Federal stimulus bill provided some additional public projects for our asphalt and<br />
paving business, yet continued weakness in residential, commercial and state/local<br />
infrastructure construction resulted in volume declines of 23% in aggregates, 15% in<br />
asphalt, 32% in readymixed concrete, and a 14% drop in construction revenue.<br />
Aggregates and readymixed concrete selling prices rose 6% and 3% respectively,<br />
while our asphalt operations saw prices decline 2% reflecting lower input costs.<br />
Efforts that began in early 2008 to systematically execute commercial and operating<br />
best practices delivered excellent results in <strong>2009</strong>. Coupled with aggressive fixed cost<br />
reductions, these fundamental changes are now ingrained in our culture and will yield<br />
more significant benefits as the economy strengthens.<br />
Results<br />
% of<br />
€ million Group <strong>2009</strong> 2008 Change Organic Acquisitions Restructuring Impairments Exchange<br />
Sales Revenue 25% 4,280 5,007 (727) (1,024) 25 – – 272<br />
EBITDA* 37% 670 724 (54) (87) 5 (11) – 39<br />
Operating Profit* 43% 407 462 (55) (72) 3 (11) – 25<br />
Average Net Assets 4,515 4,379<br />
EBITDA Margin 15.7% 14.5%<br />
Operating Profit Margin 9.5% 9.2%<br />
* EBITDA and Operating Profit exclude profit on disposal<br />
of non-current assets<br />
Analysis of Change<br />
<strong>CRH</strong> 29
Americas Materials continued<br />
Overview<br />
Americas Materials faced a very<br />
challenging environment in <strong>2009</strong> with<br />
an overall US Dollar revenue decline of<br />
19%. Residential construction<br />
remained weak at low levels of<br />
demand, while the non-residential<br />
sector experienced a severe decline<br />
from strong 2008 levels, reflecting<br />
continued tight credit and increasing<br />
unemployment. The Federal stimulus<br />
bill (American Recovery and<br />
Reinvestment Act ‘ARRA’) provided<br />
some additional public projects which<br />
had a positive impact primarily on the<br />
Division’s asphalt and paving<br />
business, but this was more than<br />
offset by lower state spending on<br />
infrastructure. Overall product<br />
volumes were down sharply and with<br />
minimal impact from acquisitions,<br />
aggregates volumes declined by 23%,<br />
asphalt was down 15% and<br />
readymixed concrete decreased 32%<br />
on 2008 levels.<br />
In order to offset lost economies of<br />
scale associated with significantly<br />
30 <strong>CRH</strong><br />
lower volumes, the Division focussed<br />
on delivering high quality materials<br />
and service to customers and<br />
capturing maximum value for our<br />
products. As a result, aggregates and<br />
readymixed concrete selling prices<br />
rose 6% and 3% respectively, while<br />
our asphalt operations saw prices<br />
decline 2% reflecting lower input<br />
costs.<br />
The price of energy used at our<br />
asphalt plants, consisting of fuel oil,<br />
recycled oil, electricity and natural<br />
gas, declined by 26%. Diesel and<br />
gasoline prices, which are important<br />
inputs to aggregates, readymixed<br />
concrete and paving operations,<br />
declined by 32% and 21%<br />
respectively versus the prior year.<br />
Liquid asphalt prices overall were<br />
14% lower in <strong>2009</strong>, following a very<br />
volatile year in 2008. Additionally, in<br />
late 2008, we expanded our winter-fill<br />
capacity (which has historically been<br />
concentrated in the east and central<br />
United States) by adding storage in<br />
Utah, Washington and Idaho, thereby<br />
further reducing our exposure to the<br />
fluctuating cost of liquid asphalt.<br />
Across all business segments our<br />
teams focussed internally on<br />
implementing best operating practices<br />
and tracking real-time metrics to drive<br />
efficiency improvements while<br />
adjusting to significantly reduced<br />
levels of production. These efforts<br />
helped maintain and improve our<br />
product margins. Additionally,<br />
significant reductions were achieved<br />
in fixed costs as our local and regional<br />
organisations were restructured to<br />
match the smaller market. Overall<br />
operating profit margin for the Division<br />
was improved by 0.3 percentage<br />
points.<br />
Following a slow start to the year,<br />
acquisition activity picked up in the<br />
second half and we ended <strong>2009</strong> with<br />
a total spend of US$231 million. Major<br />
transactions included Wheeler<br />
Companies in Texas, Hilty Quarries in<br />
Missouri, Burdick Paving in Utah and<br />
selected aggregates and asphalt<br />
assets in Missouri from Lafarge.<br />
Wheeler Companies is a successful<br />
asphalt (six plants), readymixed<br />
concrete (eight plants) and paving<br />
company based in Austin, Texas and<br />
provides entry into the high-growth<br />
Austin market with opportunity for<br />
further vertical integration into<br />
aggregates. This acquisition<br />
represents a significant expansion of<br />
our current business in Texas which<br />
we have identified as an attractive<br />
growth platform.<br />
Hilty is an excellent geographic and<br />
strategic fit with our existing<br />
operations in Missouri. This integrated<br />
aggregates and asphalt business<br />
operates eight quarries and has<br />
approximately 95 million tonnes of<br />
well-located, quality aggregates<br />
reserves.<br />
Burdick Paving is a well-run vertically<br />
integrated company in eastern Utah,<br />
operating five aggregates plants, three
asphalt plants and paving operations.<br />
This represents a geographic<br />
expansion of our profitable Utahbased<br />
operations into a steadily<br />
growing, natural resource rich region<br />
of the state.<br />
The Lafarge assets in central and<br />
eastern Missouri provide 123 million<br />
tonnes of well-located reserves along<br />
the I-70 interstate between Kansas<br />
City and St. Louis.<br />
In addition, the Division completed six<br />
other transactions adding another 162<br />
million tonnes of aggregates reserves.<br />
Our operations are geographically<br />
organised, segmented into East and<br />
West sectors, each containing four<br />
divisions.<br />
East<br />
The Northeast division (ME, NH, VT,<br />
MA, RI, NY, NJ, CT) delivered a mixed<br />
performance. The Pike group<br />
capitalised on early ARRA bid lettings<br />
in Maine and New Hampshire and<br />
Market leadership<br />
positions<br />
Aggregates<br />
No.3 national producer<br />
in United States<br />
Asphalt<br />
No.1 national producer<br />
in United States<br />
Readymixed Concrete<br />
Top 5 in United States<br />
delivered record operating profits with<br />
improved margins and solid asphalt<br />
volumes and construction revenues.<br />
Massachusetts and Upstate New York<br />
also moved operating profits ahead<br />
strongly with good overall infrastructure<br />
demand. The metropolitan<br />
New York operations suffered primarily<br />
from dramatic commercial activity<br />
declines while lower volumes and<br />
intense market competition continued<br />
in New Jersey. In Connecticut,<br />
continued softness in residential and<br />
commercial activity outweighed<br />
improvements in infrastructure<br />
construction activity. Overall the<br />
Northeast division operating profit was<br />
lower than the prior year.<br />
The Mid-Atlantic division (PA, DE, VA,<br />
WV, KY, TN, NC, MA) suffered<br />
operating profit declines in<br />
Pennsylvania and Delaware as these<br />
markets continued to deteriorate.<br />
Operating profits in Virginia, West<br />
Virginia, Kentucky, Tennessee and<br />
North Carolina also fell off from<br />
excellent levels in 2008 due to volume<br />
declines. Aggressive pricing initiatives<br />
and cost reductions resulted in margin<br />
improvement throughout the<br />
Mid-Atlantic division, moderating the<br />
operating profit decline.<br />
A strong stimulus programme in<br />
Michigan along with sound pricing<br />
initiatives, good bitumen purchasing<br />
and excellent cost controls in both<br />
Michigan and Ohio enabled our<br />
Central division to achieve improved<br />
profit margins. While volumes<br />
declined in line with the Materials<br />
Division averages, operating profit<br />
was within 15% of the record 2008<br />
outcome.<br />
The Southeast division (GA, AL, SC,<br />
FL) experienced another difficult year<br />
leading to a sharp fall in operating<br />
profit. Continued declines in the<br />
Florida residential and commercial<br />
markets negatively impacted the<br />
readymixed concrete operations<br />
acquired in late 2007 and our new<br />
cement joint venture (American<br />
Cement Company) which began<br />
production in June. Additionally,<br />
significant state budget deficits in<br />
both Florida and Alabama adversely<br />
affected highway lettings and<br />
consequently the volumes of asphalt<br />
and rail-transported aggregates in<br />
both states.<br />
West<br />
The Southwest division (MS, TX, OK,<br />
AR, MO, KS, TN) was impacted by<br />
volume declines for all products and<br />
lower construction sales. However,<br />
margin increases in all product lines,<br />
coupled with aggressive fixed cost<br />
reductions, more than offset lower<br />
volumes and construction margins,<br />
leading to a good advance in overall<br />
operating profit.<br />
In the Rocky Mountain/Midwest<br />
division (IA, SD, MT, WY, CO, NM, ID,<br />
MN, NE, IL), operating profit declined<br />
in <strong>2009</strong> due to weak demand and<br />
lower construction margins. Our<br />
Midwest businesses experienced<br />
good asphalt demand in Iowa from<br />
significant ARRA projects and<br />
achieved margin improvements from<br />
pricing and cost initiatives. However,<br />
these advances in the Midwest<br />
division were more than offset by<br />
reduced highway activity in<br />
Minnesota, Idaho and Montana, and<br />
overall operating profit was below the<br />
2008 level.<br />
In the Northwest division (ID, WA,<br />
OR), worsening economies in<br />
northern Idaho and Oregon impacted<br />
volumes and operating profits despite<br />
strong pricing and significant benefits<br />
from cost controls and restructuring.<br />
The Staker Parson operations (UT, ID,<br />
AZ, NV) saw a significant decline in<br />
volumes reflecting a weakening<br />
economy in all regions. The continued<br />
slide in residential and commercial<br />
construction led to reduced demand<br />
for readymixed concrete and<br />
aggregates and drew additional<br />
competition to the highway<br />
construction business. Profit margins<br />
were maintained, but operating profit<br />
declined.<br />
Outlook<br />
The ARRA Federal stimulus bill will<br />
provide increased construction activity<br />
in 2010, however there is much<br />
uncertainty concerning the<br />
reauthorisation of a long-term Federal<br />
highway bill and/or the passage of a<br />
second job stimulus bill. This<br />
uncertainty has caused many<br />
fiscally-challenged states to become<br />
even more cautious with their highway<br />
programmes. Overall, we would<br />
anticipate the combined Federal and<br />
state spending on highway<br />
construction in 2010 to be similar to<br />
<strong>2009</strong>. Residential activity should<br />
improve modestly from a low level,<br />
likely showing gains in the second half<br />
of 2010. The important non-residential<br />
sector will decline further in 2010 from<br />
weak <strong>2009</strong> levels due to continued<br />
tight credit, high vacancy rates and<br />
high unemployment.<br />
Overall we expect ongoing product<br />
volumes and construction revenues to<br />
be flat in 2010. Margins in<br />
construction are expected to be lower<br />
due to increased competition and<br />
intense bidding for limited work,<br />
however product margins should<br />
improve with product price increases<br />
and cost-efficiency improvements.<br />
These efforts coupled with continued<br />
reductions in fixed overhead and<br />
contributions from <strong>2009</strong> acquisitions<br />
should result in a good advance in<br />
operating profit for Americas Materials<br />
in 2010.<br />
<strong>CRH</strong> 31
The Omni Hotel in Fort Worth, Texas is a<br />
34-storey, 604-room luxury hotel featuring<br />
a unique structural design and style.<br />
Oldcastle Glass supplied Insulating Glass,<br />
Solar Control Glass, Low-E Glass and<br />
Silk-screened Glass to this landmark<br />
building.<br />
32 <strong>CRH</strong>
Mark Towe<br />
Chief Executive Officer<br />
The Americas<br />
Americas Products & Distribution<br />
Americas Products experienced significant<br />
demand pressures in <strong>2009</strong>, particularly in the<br />
important residential sector, and more<br />
significantly in the non-residential sector as<br />
the year progressed. Against this challenging<br />
backdrop and with particularly acute trading<br />
challenges in MMI, our Products businesses<br />
experienced a 91% decline in full-year US<br />
Dollar operating profit. Our Distribution business<br />
also experienced a sharp downturn in activity<br />
and operating profits were significantly lower.<br />
Operations Review<br />
Bill Sandbrook<br />
Chief Executive Officer<br />
Americas Products & Distribution<br />
Americas Products & Distribution experienced significant demand pressures in <strong>2009</strong><br />
with further declines in all of our markets. While there was some stabilisation of the<br />
residential market at historically low levels, non-residential continued to weaken<br />
throughout the year.<br />
Regionally our operations in the West and Canada performed better relative to our<br />
southeastern and northeastern markets which were noticeably weaker than in 2008.<br />
The continuing focus of management remains on internal cost reductions, delivering<br />
supply chain efficiencies and growing revenues through product innovation and<br />
providing systems solutions to the construction market.<br />
Results<br />
% of<br />
€ million Group <strong>2009</strong> 2008 Change Organic Acquisitions Restructuring Impairments Exchange<br />
Sales Revenue 21% 3,709 4,686 (977) (1,234) 29 – – 228<br />
EBITDA* 12% 212 485 (273) (247) 2 (47) – 19<br />
Operating Profit* 4% 38 330 (292) (247) 1 (47) (11) 12<br />
Average Net Assets 2,477 2,586<br />
EBITDA Margin 5.7% 10.3%<br />
Operating Profit Margin 1.0% 7.0%<br />
* EBITDA and Operating Profit exclude profit on disposal<br />
of non-current assets<br />
Analysis of Change<br />
<strong>CRH</strong> 33
Americas Products & Distribution continued<br />
Overview<br />
Americas Products & Distribution<br />
experienced significant demand<br />
pressures in <strong>2009</strong>, with further<br />
declines in all of our markets,<br />
particularly the important residential<br />
sector, and more significantly in the<br />
non-residential sector as the year<br />
progressed. Against this challenging<br />
backdrop and with particularly acute<br />
trading challenges in MMI, our<br />
Products businesses experienced a<br />
full year US Dollar operating profit<br />
decline of 91%. Similarly, sales<br />
revenues in our Distribution business<br />
were significantly lower and operating<br />
profits declined, despite decisive<br />
action on cost reductions. Regionally,<br />
our Products & Distribution operations<br />
in the West and Canada performed<br />
relatively better, while our<br />
southeastern and northeastern<br />
operations continued to be noticeably<br />
weaker than in 2008. Focussed<br />
cost-reduction measures helped to<br />
mitigate somewhat the impact of<br />
sharp volume declines. Overall, the<br />
Division recorded a 25% decrease in<br />
US Dollar sales and an 89% decline in<br />
34 <strong>CRH</strong><br />
US Dollar operating profit. The<br />
continuing focus of management<br />
remains on delivering internal cost<br />
reductions and supply chain<br />
efficiencies.<br />
Architectural Products (APG)<br />
APG, with 239 locations in 38 states<br />
and two Canadian provinces, is the<br />
leading North American producer of<br />
concrete products for the commercial<br />
masonry, professional landscaping<br />
and consumer DIY markets. The<br />
group is also a regional leader in clay<br />
brick, dry-mixes, and lawn and<br />
garden products.<br />
APG faced continued difficult trading<br />
conditions in <strong>2009</strong> due to further<br />
deterioration in the residential<br />
construction sector and accelerated<br />
declines in non-residential markets.<br />
The construction markets in eastern<br />
Canada were more robust than those<br />
in the US. The Homecenter (DIY/retail)<br />
channel, which accounts for<br />
approximately one-third of APG sales,<br />
remained resilient despite weak<br />
consumer sentiment and spending.<br />
Reflecting these factors, our United<br />
States masonry and brick divisions<br />
experienced considerable operating<br />
profit declines. In contrast, our<br />
Canadian masonry business<br />
performed well and our lawn and<br />
garden and dry-mix divisions delivered<br />
significant operating profit<br />
improvement. Extensive costreduction<br />
actions and regional<br />
consolidations were completed<br />
across APG; however, they were only<br />
able to partially offset the negative<br />
external factors. Overall, APG<br />
recorded a decline in sales and a<br />
sharp decline in operating profit.<br />
Precast<br />
The Precast group is a leading<br />
manufacturer of precast, prestressed<br />
and polymer concrete products, small<br />
plastic box enclosures and concrete<br />
pipe in North America. The group has<br />
76 locations in 25 states and the<br />
province of Québec.<br />
Significantly lower levels of residential<br />
activity in <strong>2009</strong> again negatively<br />
affected demand for drainage<br />
products and plastic box enclosures<br />
nationwide. Activity in the nonresidential<br />
sector also decreased<br />
considerably, further impacting sales.<br />
This trend is expected to continue into<br />
2010, as poor business conditions<br />
and reduced access to credit weigh<br />
on demand. The group’s most steady<br />
work was in the infrastructure<br />
segment, but exposure to this<br />
segment is less significant. Overall<br />
volumes were down approximately<br />
33% from a relatively weak 2008. In<br />
spite of the harsh economic backdrop<br />
and an increasingly competitive<br />
market, margins were similar to 2008<br />
as a result of pricing initiatives,<br />
operational efficiencies, and<br />
second-half input cost declines.<br />
Overall operating profit was below<br />
2008 levels. Backlogs declined<br />
throughout <strong>2009</strong>, but are showing<br />
signs of recovery in 2010.<br />
Management’s focus will be to<br />
continue internal improvement and<br />
cost-reduction measures ahead of the<br />
challenging market conditions that are<br />
expected to extend into 2010.<br />
Chile<br />
Alaska<br />
Hawaii<br />
Argentina
Glass<br />
The Glass group is the market-leading<br />
supplier of Building Envelope Solutions<br />
for commercial, institutional and<br />
multi-storey residential construction,<br />
including custom-engineered curtain<br />
wall, custom-fabricated architectural<br />
glass, high-performance windows,<br />
architectural skylights, and storefronts<br />
and doors. With 79 locations in 23<br />
states and four Canadian provinces,<br />
the Glass group is the largest supplier<br />
of high-performance architectural<br />
glass and engineered aluminium<br />
glazing systems in North America.<br />
In <strong>2009</strong>, the architectural glass<br />
business experienced unprecedented<br />
declines in demand, as sales volumes<br />
decreased 24% compared to 2008.<br />
Pricing was intensely competitive in all<br />
North American markets and the<br />
group’s largest privately-held<br />
competitor filed for bankruptcy<br />
reorganisation in November. Also the<br />
group experienced competition from<br />
non-traditional sources as many<br />
smaller glass fabricators directed<br />
underutilised residential capacity to<br />
serving commercial markets. In this<br />
difficult trading environment, the Glass<br />
group focussed on building market<br />
share, tightening cost control<br />
and closing 11 operating locations<br />
to better balance capacity with<br />
depressed market demand.<br />
Operating profit fell steeply.<br />
While the engineered products<br />
business experienced a 26% decline<br />
in sales compared to 2008, operating<br />
profit was near 2008 record levels due<br />
to a strong performance from our<br />
Canadian locations, favourable<br />
backlog pricing and lower aluminium<br />
costs. 2010 is expected to be a much<br />
more challenging year for the<br />
engineered products business as<br />
project backlog continues to decline.<br />
MMI<br />
Market leadership positions<br />
MMI has 76 locations, 16 of which are<br />
manufacturing, across 29 states and<br />
a plant in Mexico. Although its fencing<br />
products are often used in residential<br />
applications, most of MMI’s products<br />
(construction accessories, welded<br />
Precast Concrete Products<br />
No.1 in United States<br />
Architectural Concrete Products<br />
No.1 masonry, paving and patio in United States<br />
No.1 paving and patio in Canada<br />
No.2 packaged concrete mixes in United States<br />
No.2 packaged lawn & garden products in United States<br />
Clay Products<br />
No.1 brick producer in northeast and midwest United States<br />
No.1 rooftiles in Argentina<br />
No.2 wall and floor tiles in Argentina<br />
No.3 clay block producer in Argentina<br />
Glass Fabrication<br />
No.1 architectural glass fabrication in United States<br />
Glazing Systems<br />
No.1 engineered aluminium glazing systems in United States<br />
Construction Accessories<br />
No.2 in United States<br />
Welded Wire Reinforcement<br />
No.2 in United States<br />
Fencing Products<br />
No.2 manufacturer and distributor in United States<br />
Distribution<br />
No.4 roofing/siding distributor in United States<br />
No.4 interior products distributor in United States<br />
wire reinforcement and fencing<br />
products) are used in non-residentialoriented<br />
projects, particularly in<br />
conjunction with the use of concrete.<br />
The accelerating decline in nonresidential<br />
construction activity led to<br />
a 40% decrease in MMI’s sales from<br />
2008 levels. The combination of<br />
high-priced steel inventory, lower<br />
sales volumes, and dramatically falling<br />
sales prices contributed to a<br />
significant operating loss for the year.<br />
Management modified its steel<br />
purchasing strategy to reduce future<br />
volatility and reacted to declining<br />
volumes by instituting extensive<br />
cost-reduction measures across all<br />
businesses and scaling back the size<br />
of its distribution network.<br />
Distribution<br />
Oldcastle Distribution, trading<br />
primarily as Allied Building Products<br />
(“Allied”), has 184 branches focussed<br />
on major metropolitan areas in 31<br />
states. It comprises two divisions which<br />
supply contractor groups specialising in<br />
Exterior (roofing and siding) and Interior<br />
(wallboard, steel studs and acoustical<br />
ceiling systems) Products.<br />
Exterior Products is the group’s<br />
traditional business and Allied is one<br />
of the top four distributors in this<br />
segment in the United States.<br />
Demand is largely influenced by<br />
residential and commercial<br />
replacement activity with the key<br />
products having an average life span<br />
of roughly 25 years. This repair,<br />
maintenance and improvement<br />
aspect provides a solid underpinning<br />
of baseline roofing demand.<br />
The Interior Products division, being<br />
relatively immune to weather, has low<br />
exposure to replacement activity and<br />
demand is therefore largely<br />
dependent on the new commercial<br />
construction market. Allied is the<br />
fourth largest Interior Products<br />
distributor in the United States.<br />
Both segments of the business<br />
declined greatly in <strong>2009</strong>, roughly in<br />
proportion to the overall market. In the<br />
Exterior Products business, overall US<br />
asphalt roofing shingle shipments<br />
were down 15% in <strong>2009</strong>, a level of<br />
decline that was somewhat offset by<br />
storm activity in a number of regions.<br />
Allied did not specifically benefit from<br />
these storms, but outperformed<br />
competitors in its market areas. For<br />
the Interior Products business,<br />
gypsum wallboard shipments are a<br />
barometer of activity and these<br />
declined by about 7 billion square feet<br />
or 28% in <strong>2009</strong>, comparable with a<br />
decline of 31% in Allied’s Interior<br />
Products sales.<br />
Acquisition activity for Americas<br />
Distribution was limited to the addition<br />
of one small interior products<br />
distributor in Salt Lake City.<br />
South America<br />
The South American group faced<br />
difficult economic conditions in <strong>2009</strong>,<br />
particularly in Argentina, and<br />
management focussed on initiating<br />
significant cost-reduction<br />
programmes. Operating profit from<br />
our Argentine ceramic tile and glass<br />
businesses was at break-even for the<br />
year. The start-up of a greenfield floor<br />
and wall tile manufacturing facility in<br />
Cordoba was completed in October.<br />
Our Chilean glass business<br />
experienced a more moderate decline<br />
in operating profit. The Santiagobased<br />
distribution business acquired<br />
in early 2008 was negatively impacted<br />
by the adverse economic conditions<br />
and operating profit declined.<br />
Outlook<br />
While there are signs that the overall<br />
US economy appears to have<br />
stabilised, the growth outlook remains<br />
weak. Homebuilding appears set to<br />
make a slightly positive contribution in<br />
the second half of the year. Further<br />
declines are however expected in<br />
non-residential construction due to<br />
continuing stresses in financial and<br />
credit markets. While residential repair,<br />
maintenance and improvement<br />
activity is historically less cyclical,<br />
constrained consumer spending<br />
because of high unemployment,<br />
sluggish income growth and declines<br />
in household wealth will translate into<br />
weak private domestic demand.<br />
Against this backdrop, our businesses<br />
will continue to focus on new and<br />
ongoing cost-reduction initiatives and<br />
the generation of strong cash flow, as<br />
we leverage further the benefits of our<br />
extensive location network and the<br />
Divisions’ product diversity and broad<br />
sectoral exposure.<br />
<strong>CRH</strong> 35
Glenn Culpepper<br />
Finance Director<br />
36 <strong>CRH</strong><br />
Finance Review<br />
<strong>CRH</strong> continued to generate strong cash flow in <strong>2009</strong>.<br />
Our excellent working capital management and pragmatic<br />
approach to capital expenditure, together with the proceeds<br />
of €1.24 billion from the March <strong>2009</strong> Rights Issue, resulted<br />
in a reduction of €2.4 billion of debt. Our debt maturity profile<br />
and credit ratios are among the best in the sector, leaving<br />
us with substantial financial flexibility.<br />
General<br />
With continued weakness in the<br />
financial, economic and business<br />
climate worldwide in <strong>2009</strong>, and<br />
significant declines in construction<br />
activity in the Group’s major markets,<br />
management’s focus during the year<br />
remained firmly concentrated on cost<br />
reduction and operational initiatives.<br />
Sales revenues for <strong>2009</strong> amounted<br />
to €17.4 billion, a 17% decline<br />
compared with the €20.9 billion<br />
reported last year. EBITDA for the<br />
year, after once-off charges of<br />
€205 million associated with our<br />
cost reduction programme, declined<br />
by one-third to €1.8 billion, in line<br />
with the guidance provided in the<br />
Interim Management Statement of<br />
10th November <strong>2009</strong> and the Trading<br />
Update Statement of 5th January<br />
Table 1 Key Components of <strong>2009</strong> Performance<br />
€ million Revenue EBITDA<br />
2010. Profit before tax excluding<br />
impairment charges, amounted to<br />
€773 million, a decrease of 53%<br />
compared with 2008, and ahead of<br />
the guidance of €0.75 billion provided<br />
in the January Update.<br />
After impairment costs of €41 million<br />
(2008: €14 million), pre-tax profit<br />
declined by 55% to €732 million.<br />
Reflecting the increase in average<br />
shares in issue as a result of the Rights<br />
Issue in March <strong>2009</strong>, a slightly higher<br />
percentage decline of 58% was reported<br />
in earnings per share for the year.<br />
Overall operating margin fell from<br />
8.8% in 2008 to 5.5% in <strong>2009</strong>.<br />
Profit on disposal of non-current<br />
assets at €26 million was below 2008<br />
(€69 million).<br />
Operating<br />
profit<br />
Profit on<br />
disposals<br />
Trading<br />
profit<br />
Expenditure on acquisitions and<br />
investments in <strong>2009</strong> amounted to<br />
€458 million.<br />
In March <strong>2009</strong> the Group issued<br />
approximately 152 million new<br />
Ordinary Shares by way of a Rights<br />
Issue, generating net proceeds for the<br />
Group of €1.24 billion.<br />
Key Components of <strong>2009</strong><br />
Performance<br />
Table 1 below sets out the key<br />
components of the Group’s<br />
performance in <strong>2009</strong>, analysing the<br />
change in results from 2008 to <strong>2009</strong>.<br />
Exchange Translation Effects<br />
While the US Dollar strengthened<br />
during <strong>2009</strong> with the average US$/€<br />
rate of 1.3948 being 5% stronger than<br />
in 2008 (1.4708), this was more than<br />
Finance<br />
costs<br />
Associate<br />
PAT<br />
Pre-tax<br />
profit<br />
2008 as reported 20,887 2,665 1,841 69 1,910 (343) 61 1,628<br />
Exchange translation effects 291 (22) (32) (3) (35) (8) (1) (44)<br />
2008 at <strong>2009</strong> exchange rates<br />
Incremental impact in <strong>2009</strong> of<br />
21,178 2,643 1,809 66 1,875 (351) 60 1,584<br />
- 2008/<strong>2009</strong> acquisitions 298 37 24 - 24 (21) 9 12<br />
- Restructuring costs (i) - (143) (143) - (143) - - (143)<br />
- Impairment costs (ii) - - (27) - (27) - - (27)<br />
Ongoing operations (4,103) (734) (708) (40) (748) 75 (21) (694)<br />
<strong>2009</strong> as reported 17,373 1,803 955 26 981 (297) 48 732<br />
% change -17% -32% -48% -49% -55%<br />
(i) Restructuring charges amounted to €205 million in <strong>2009</strong> (2008: €62 million), resulting in an incremental cost in <strong>2009</strong> of €143 million.<br />
(ii) Total impairment charges in <strong>2009</strong> were €41 million (2008: €14 million), with an incremental cost of €27 million in <strong>2009</strong>.
offset by the decline in the average<br />
Polish Zloty exchange rate which at<br />
4.3276 was 19% weaker (2008:<br />
3.5121). Currency movements in total<br />
had a net negative impact of €44<br />
million at profit before tax level. The<br />
average and year-end exchange rates<br />
used in the preparation of <strong>CRH</strong>’s<br />
financial statements are included<br />
under Accounting Policies on page 66<br />
of this <strong>Report</strong>.<br />
Incremental Impact of Acquisitions<br />
Acquisitions completed in 2008 and<br />
<strong>2009</strong> contributed incremental<br />
operating profit of €24 million on<br />
additional sales of €298 million, an<br />
effective incremental operating profit<br />
margin of approximately 8%.<br />
The Group’s European segments<br />
accounted for the bulk of the<br />
acquisition impact in <strong>2009</strong>, generating<br />
an incremental €20 million in<br />
operating profit on additional sales of<br />
€244 million. This reflected the<br />
full-year impact of the sanitary ware,<br />
heating and plumbing acquisitions by<br />
the Distribution group in Germany and<br />
Switzerland in mid-2008, and of the<br />
Group’s joint venture cement<br />
investment in India in May 2008.<br />
In the Americas, the incremental<br />
impact from acquisitions was, as<br />
expected, relatively modest, with an<br />
incremental €4 million in operating<br />
profit on sales of €54 million.<br />
<strong>CRH</strong>’s 2010 results are expected to<br />
reflect a modest incremental impact<br />
from <strong>2009</strong> acquisitions, which on a<br />
combined basis, have annualised<br />
sales of approximately €200 million.<br />
Non-recurring items – Restructuring<br />
and Impairment Costs<br />
The ongoing focus on operational<br />
excellence initiatives to deliver cost<br />
savings continued throughout <strong>2009</strong><br />
and the related savings generated<br />
from these initiatives are discussed by<br />
the Chief Operating Officer on page<br />
19 of this <strong>Report</strong>. The costs incurred<br />
to implement this 4-year cost saving<br />
programme amounted to €205 million<br />
in <strong>2009</strong> (2008: €62 million).<br />
Impairment charges of €41 million<br />
were recorded against the carrying<br />
value of property, plant and<br />
equipment and intangible assets – the<br />
corresponding charge in 2008 was<br />
€14 million.<br />
Ongoing Operations<br />
<strong>2009</strong> organic sales declined by<br />
€4,103 million, a reduction of<br />
approximately 19% following a fall of<br />
approximately 6% in 2008. Overall<br />
organic sales declined by 17% in<br />
Europe while the reduction was 22%<br />
in the Americas; this compared with<br />
2008 which saw organic sales decline<br />
by approximately 4% in Europe and<br />
by 8% in the Americas. Underlying<br />
operating profit fell by €708 million,<br />
Table 2 Key Financial Performance Indicators<br />
<strong>2009</strong> 2008<br />
Operating profit margin (%)<br />
Interest cover<br />
5.5 8.8<br />
– EBITDA basis (times) 6.1 7.8<br />
– EBIT basis (times) 3.2 5.4<br />
Effective tax rate (%) 18.3 22.5<br />
Net debt as a percentage of total equity (%) 38.3 74.7<br />
Net debt as a percentage of year-end market<br />
capitalisation (%)<br />
28.1 64.1<br />
Return on average capital employed (%) 6.6 12.9<br />
Return on average equity (%) 6.7 15.6<br />
EBITDA – earnings before finance costs, tax, depreciation, impairment<br />
charges and intangible asset amortisation<br />
EBIT – earnings before finance costs and tax (trading profit)<br />
Both EBITDA and EBIT exclude profit on disposal of non-current assets<br />
more than double the €301 million fall<br />
in organic operating profits in 2008.<br />
Underlying operating profit for our<br />
European operations fell by<br />
€389 million on an underlying sales<br />
reduction of €1,845 million, reflecting<br />
challenging trading conditions in<br />
almost all our markets. Our Materials<br />
businesses suffered from the impact<br />
of significant volume declines in all its<br />
major markets except Switzerland<br />
and organic operating profit fell by<br />
€260 million. Our businesses in the<br />
Products segment experienced<br />
difficult trading conditions throughout<br />
<strong>2009</strong>, with like-for-like sales down<br />
19% compared with 2008; however,<br />
the benefits from the ongoing<br />
restructuring programme began to<br />
come through in the second half<br />
when underlying operating profit<br />
was slightly ahead of 2008, while<br />
the decline for the full year was<br />
€74 million. Declining consumer<br />
confidence and weaker new<br />
residential construction activity<br />
resulted in an overall decline in<br />
underlying profits of €55 million in<br />
Distribution, with the second-half<br />
decline being slightly lower than the<br />
first half.<br />
Our operations in the Americas had a<br />
challenging year reporting a decline of<br />
€2,258 million in underlying sales and<br />
a decline of €319 million in like-for-like<br />
operating profit. While lower private<br />
sector demand in <strong>2009</strong> had a<br />
significant negative impact on<br />
volumes for the Materials Division,<br />
infrastructure activity gained<br />
momentum through the second half.<br />
With lower input costs for energy and<br />
the benefit of targeted cost reduction<br />
measures and price increases, the<br />
Division reported improved margins in<br />
<strong>2009</strong> in spite of a 19% decline in<br />
ongoing sales revenues; ongoing<br />
operating profit was €72 million lower<br />
than 2008. The combination of weak<br />
residential markets and ongoing<br />
reductions in non-residential<br />
construction activity had a major<br />
impact on our Products businesses in<br />
the Americas which reported falls of<br />
€881 million in sales and €170 million<br />
in operating profits from underlying<br />
operations. Our Distribution<br />
operations suffered primarily from the<br />
decline in residential and commercial<br />
construction, with underlying<br />
operating profit falling €77 million<br />
behind 2008.<br />
Finance Costs<br />
Net finance costs for the year of<br />
€297 million were lower than last year<br />
(2008: €343 million) reflecting strong<br />
operating cash flow for the year and<br />
the benefits of the Rights Issue.<br />
Financial Performance Indicators<br />
Some key financial performance<br />
indicators which, taken together, are a<br />
measure of performance and financial<br />
strength are set out in Table 2.<br />
Operating Profit Margin<br />
Overall operating profit margin for the<br />
Group fell by 3.3 percentage points in<br />
<strong>2009</strong> to 5.5%, with all segments<br />
except Americas Materials<br />
experiencing margin declines.<br />
Interest Cover<br />
Management believes that the<br />
EBITDA interest cover based ratio is<br />
useful to investors because it matches<br />
the earnings and cash generated by<br />
the business to the underlying funding<br />
costs. As set out in note 23 on page<br />
95 of the financial statements, the<br />
Group’s major bank facilities and debt<br />
issued pursuant to Note Purchase<br />
Agreements in private placements<br />
require the Group to maintain<br />
EBITDA/net interest (excluding share<br />
of joint ventures) at no lower than<br />
4.5 times for twelve-month periods<br />
ending quarterly on 31st March,<br />
30th June, 30th September and<br />
31st December in each year.<br />
Non-compliance with financial<br />
covenants would give the relevant<br />
lenders the right to demand early<br />
repayment of the related debt thus<br />
impacting the maturity profile of the<br />
Group’s debt and the Group’s liquidity.<br />
While EBITDA/net interest cover for<br />
the year reduced to 6.1 times (2008:<br />
7.8 times), it remained comfortably<br />
above the Group’s covenant levels<br />
and within the Group’s comfort range<br />
of 6 to 6.5 times.<br />
Tax Rate<br />
The tax charge at 18.3% of Group<br />
profit before tax decreased compared<br />
with 2008 (22.5%). The decline in the<br />
tax charge largely reflects lower<br />
taxable profits in a number of<br />
jurisdictions where higher tax rates<br />
apply.<br />
<strong>CRH</strong> 37
Finance Review continued<br />
Net Debt<br />
Year-end net debt of €3.7 billion was<br />
€2.4 billion lower than year-end 2008;<br />
this reduction in debt, combined with<br />
the increase in equity following the<br />
March <strong>2009</strong> Rights Issue, resulted in<br />
a reduction in the percentage of net<br />
debt to total equity from 74.7% at<br />
year-end 2008 to 38.3% at year-end<br />
<strong>2009</strong>.<br />
The Group’s market capitalisation at<br />
year-end <strong>2009</strong> was €13.3 billion,<br />
some 40% higher than at year-end<br />
2008 (€9.5 billion); this combined with<br />
the lower net debt resulted in a fall in<br />
the debt/market capitalisation<br />
percentage from 64% at year-end<br />
2008 to 28% at year-end <strong>2009</strong>.<br />
Returns on Capital Employed<br />
and Equity<br />
Return on average capital employed<br />
and return on average equity both<br />
declined in <strong>2009</strong>.<br />
Liquidity and Cash Resources<br />
Net debt for the Group at 31st<br />
December <strong>2009</strong>, at €3.7 billion, was<br />
€2.4 billion lower than the €6.1 billion<br />
at the end of 2008. This reduction<br />
reflects the strong cash generation<br />
characteristics of the Group, which<br />
combined with the €1.24 billion of<br />
proceeds from the Rights Issue and<br />
a positive translation adjustment of<br />
€0.1 billion, more than offset the<br />
impact of the total €1.0 billion spent<br />
on acquisitions, investments and<br />
capital projects and the €0.4 billion<br />
cash dividends paid during the year.<br />
Table 3 summarises <strong>CRH</strong>’s cashflows<br />
for <strong>2009</strong> and 2008. The changes in<br />
operating profit and interest are<br />
discussed above.<br />
The increased charges for<br />
depreciation and amortisation mainly<br />
reflect the impact of increased<br />
impairment charges of €41 million in<br />
<strong>2009</strong> (2008: €14 million).<br />
The Group has maintained an intense<br />
focus on cash generation throughout<br />
<strong>2009</strong>, and the net working capital<br />
inflow of €661 million represents a<br />
further excellent performance in<br />
managing receivables and payables<br />
in a challenging environment. This<br />
compares with a net outflow of<br />
€62 million in 2008.<br />
38 <strong>CRH</strong><br />
Tax payments were lower than in<br />
2008 as a result of the sharp<br />
reduction in pre-tax profits.<br />
The increase in dividends paid reflects<br />
the 1% increase in the final 2008<br />
dividend which was paid in May <strong>2009</strong>,<br />
together with the impact on the<br />
interim <strong>2009</strong> dividend paid in October<br />
<strong>2009</strong> of the 152 million additional<br />
shares in issue following the March<br />
<strong>2009</strong> Rights Issue. The interim<br />
dividend per share for <strong>2009</strong> of 18.5c<br />
was held in line with the interim<br />
dividend per share for 2008.<br />
Capital expenditure of over €0.5<br />
billion represented 3% of Group<br />
revenue (2008: 5%) and amounted<br />
to 0.67 times depreciation of<br />
€794 million (2008: 1.33 times).<br />
Of the total capital expenditure, 66%<br />
was invested in Europe with 34% in<br />
the Americas. Our capital expenditure<br />
included approximately €0.15 billion<br />
and €0.25 billion of investment in<br />
major cement plants in <strong>2009</strong> and<br />
2008 respectively.<br />
The caption denoted “Other” mainly<br />
reflects the elimination of non-cash<br />
income items, primarily share of<br />
associates’ profits and profit on<br />
disposal of non-current assets, and<br />
non-cash expense items such as<br />
IFRS share-based compensation<br />
expense, which are included in<br />
arriving at profit before tax.<br />
Spend on acquisitions and<br />
investments in <strong>2009</strong> amounted to<br />
€0.458 billion, a significant reduction<br />
compared with the €1.1 billion spent<br />
in 2008. This reflected a deliberate<br />
curtailment of development activity<br />
from mid-2008 as the economic<br />
environment deteriorated.<br />
The share issues caption in <strong>2009</strong><br />
principally reflects the €1.24 billion<br />
net proceeds from the March <strong>2009</strong><br />
Rights Issue, together with the<br />
take-up of shares in lieu of dividends<br />
under the Company’s scrip<br />
dividend scheme of €148 million<br />
(2008: €22 million) and issues under<br />
Group share option and share<br />
participation schemes of €60 million<br />
(2008: €37 million).<br />
In both <strong>2009</strong> and 2008 the Employee<br />
Benefit Trust purchased 0.1 million<br />
shares to satisfy share option<br />
exercises. Share purchases in 2008<br />
also reflected the acquisition of<br />
approximately 18.2 million shares<br />
under the share purchase programme<br />
which was announced in January<br />
2008; the Group announced the<br />
termination of this programme in<br />
November 2008. In <strong>2009</strong>, 3.9 million<br />
(2008: 2.0 million) of these shares<br />
were used to satisfy the exercise of<br />
share options.<br />
Exchange rate movements during<br />
<strong>2009</strong> reduced the euro amount of net<br />
foreign currency debt by €120 million<br />
principally due to the 3% increase in<br />
the euro exchange rate against the<br />
US Dollar from 1.3917 at end-2008<br />
to 1.4406. The unfavourable<br />
translation adjustment of €240 million<br />
in 2008 reflected a 5% decrease in<br />
the euro rate versus the US Dollar<br />
from 1.4721 at end-2007 to 1.3917<br />
at end-2008.<br />
Table 3 Cash Flow<br />
Year-end net debt of €3,723 million<br />
(2008: €6,091 million) includes €114<br />
million (2008: €153 million) in respect<br />
of the Group’s proportionate share of<br />
net debt in joint venture undertakings.<br />
Details of the components of net debt<br />
are set out in note 25 to the financial<br />
statements.<br />
At the end of <strong>2009</strong>, 77% of the<br />
Group’s net debt was at interest rates<br />
which were fixed for an average<br />
period of 5.9 years. The euro<br />
accounted for approximately 31% of<br />
net debt at the end of <strong>2009</strong> and<br />
117% of the euro component of net<br />
debt was at fixed rates. The US Dollar<br />
accounted for approximately 59% of<br />
net debt at the end of <strong>2009</strong> and 69%<br />
of the US Dollar component of net<br />
debt was at fixed rates.<br />
The Group finished the year in a very<br />
strong financial position with 98% of<br />
the Group’s gross debt drawn under<br />
committed term facilities, 95% of<br />
€ million<br />
Inflows<br />
<strong>2009</strong> 2008<br />
Profit before tax 732 1,628<br />
Depreciation (including impairments) 794 781<br />
Amortisation of intangibles (including impairments) 54 43<br />
Working capital movements 661 (62)<br />
Outflows<br />
2,241 2,390<br />
Tax paid (104) (322)<br />
Dividends (386) (369)<br />
Capital expenditure (532) (1,039)<br />
Other (59) (89)<br />
(1,081) (1,819)<br />
Operating cash flow 1,160 571<br />
Acquisitions and investments (458) (1,072)<br />
Disposals 103 168<br />
Share issues 1,445 59<br />
Treasury/own shares purchased (2) (414)<br />
Translation 120 (240)<br />
Decrease/(increase) in net debt 2,368 (928)<br />
Opening net debt (6,091) (5,163)<br />
Closing net debt (3,723) (6,091)
which mature after more than one<br />
year. In addition, at year-end the<br />
Group held €1.6 billion of undrawn<br />
committed facilities, which had an<br />
average maturity of 2 years.<br />
At year-end <strong>2009</strong>, 96% of the<br />
Group’s cash, short-term deposits<br />
and liquid resources had a<br />
maturity of six months or less.<br />
Shareholders’ Equity<br />
The increase of €1.55 billion in total<br />
shareholders’ equity (capital and<br />
reserves attributable to <strong>CRH</strong>’s equity<br />
shareholders) during <strong>2009</strong> reflects the<br />
proceeds of €1.24 billion from the<br />
March <strong>2009</strong> Rights Issue. The total<br />
movements in equity for the year<br />
are analysed in the Consolidated<br />
Statement of Changes in Equity<br />
(a new primary financial statement)<br />
on page 64 of this <strong>Report</strong>.<br />
Employee Benefits<br />
The assets and liabilities (excluding<br />
related deferred tax) of the defined<br />
benefit pension schemes operated by<br />
various Group companies, computed<br />
in accordance with IAS 19, have been<br />
included on the face of the balance<br />
sheet under retirement benefit<br />
obligations. At end-<strong>2009</strong>, the net<br />
deficit on these schemes amounted<br />
to €454 million (2008: €414 million);<br />
after deducting the related deferred<br />
tax asset, the net liability amounted to<br />
€351 million (2008: €320 million). The<br />
net liability expressed as a percentage<br />
of market capitalisation decreased<br />
from 3.4% at year-end 2008 to 2.6%<br />
at year-end <strong>2009</strong>, reflecting primarily<br />
the impact of the March <strong>2009</strong> Rights<br />
Issue.<br />
Share Price<br />
The Company’s Ordinary Shares<br />
traded in the range €12.55 to €20.70<br />
during <strong>2009</strong>. The year-end share price<br />
was €19.01 (2008: €16.10 restated).<br />
Shareholders recorded a gross return<br />
of 22% (dividends and capital<br />
appreciation) during <strong>2009</strong> following<br />
returns of -22% in 2008, -23% in<br />
2007, +29% in 2006, +28% in 2005<br />
and +23% in 2004.<br />
<strong>CRH</strong> is one of six building materials<br />
companies included in the FTSE<br />
Eurotop 300, a market capitalisationweighted<br />
index of Europe’s largest<br />
300 companies. At year-end <strong>2009</strong>,<br />
<strong>CRH</strong>’s market capitalisation of<br />
€13.3 billion (2008: €9.5 billion)<br />
placed it among the top 3 building<br />
materials companies worldwide.<br />
Insurance<br />
Group headquarters advises management<br />
on different aspects of risk and<br />
monitors overall safety and loss<br />
prevention performance; operational<br />
management is responsible for the<br />
day-to-day management of business<br />
risks. Insurance cover is held for all<br />
significant insurable risks and against<br />
major catastrophe. For any such events,<br />
the Group generally bears an initial<br />
cost before external cover begins.<br />
Legal Proceedings<br />
Group companies are parties to<br />
various legal proceedings, including<br />
some in which claims for damages<br />
have been asserted against the<br />
companies. The final outcome of all<br />
the legal proceedings to which Group<br />
companies are party cannot be<br />
accurately forecast. However, having<br />
taken appropriate advice, we believe<br />
that the aggregate outcome of such<br />
proceedings will not have a material<br />
effect on the Group’s financial<br />
condition, results of operations or<br />
liquidity.<br />
Financial Risk Management<br />
The Board of Directors sets the<br />
treasury policies and objectives of the<br />
Group, which include controls over<br />
the procedures used to manage<br />
financial market risks. These are set<br />
out in detail in note 21 to the financial<br />
statements.<br />
Financing Activity<br />
In March <strong>2009</strong>, the Group issued<br />
approximately 152 million new<br />
Ordinary Shares at €8.40 per share<br />
under the terms of a 2 for 7 Rights<br />
Issue. The total proceeds from this<br />
issue, net of expenses, amounted to<br />
€1.24 billion.<br />
In May <strong>2009</strong>, as part of its ongoing<br />
financing strategy, <strong>CRH</strong> completed its<br />
first transaction in the Eurobond<br />
market with the successful issue of<br />
€750 million notes with a coupon of<br />
7.375% and expiring in May 2014.<br />
This issue further enhances the<br />
Group’s debt maturity profile.<br />
These actions, combined with the<br />
Group’s strong focus on cash<br />
generation, excellent working capital<br />
management and restrained capital<br />
expenditure, leave <strong>CRH</strong> wellpositioned<br />
in terms of debt facilities<br />
and maturity profile. <strong>CRH</strong> remains<br />
committed to maintaining an<br />
investment grade credit rating.<br />
Currency Management<br />
The bulk of the Group’s net worth<br />
(capital and reserves attributable to<br />
equity holders) is denominated in the<br />
world’s two largest currencies – the<br />
US Dollar and the euro – which<br />
accounted for 37% and 34%<br />
respectively of the Group’s net worth<br />
at end-<strong>2009</strong>.<br />
<strong>2009</strong> saw a negative €96 million<br />
currency translation effect on foreign<br />
currency net worth which includes a<br />
€120 million favourable translation<br />
impact on net foreign currency debt.<br />
Sarbanes-Oxley Act<br />
As a result of its NYSE Listing, <strong>CRH</strong> is<br />
subject to the provisions of Section 404<br />
of the Sarbanes-Oxley Act of 2002,<br />
which requires management to<br />
perform an annual assessment of the<br />
effectiveness of internal control over<br />
financial reporting and to report its<br />
conclusions in the Company’s <strong>Annual</strong><br />
<strong>Report</strong> on Form 20-F, filed with the<br />
Securities and Exchange Commission.<br />
For the year ended 31st December<br />
2008, management concluded that the<br />
Company’s internal control over<br />
financial reporting was effective. As<br />
required by US law, Ernst & Young<br />
audited the effectiveness of the<br />
Company’s controls over financial<br />
reporting for 2008 and issued an<br />
unqualified opinion thereon.<br />
Management’s assessment and the<br />
auditors’ report on the effectiveness<br />
of internal controls for the year ended<br />
31st December <strong>2009</strong> will be included in<br />
the <strong>2009</strong> <strong>Annual</strong> <strong>Report</strong> on Form 20-F.<br />
<strong>CRH</strong> 39
Board of Directors<br />
Above - left to right<br />
J.M.C. O’Connor*<br />
B.Soc. Sc., M.Soc. Sc., PhD<br />
Joyce O’Connor became a nonexecutive<br />
Director in June 2004. She<br />
is the founder President and President<br />
Emeritus of the National College of<br />
Ireland. She currently chairs the Dublin<br />
Inner City Partnership. She is a Board<br />
member of the Government Task<br />
Force on Active Citizenship and an<br />
Eisenhower Fellow. She is former<br />
chair of the Digital Hub Development<br />
Agency, the Expert Group on Mental<br />
Health Policy, the National Career<br />
Guidance Forum and the Further<br />
Education and Training Awards<br />
Council (FETAC). (Aged 62).<br />
J.M. de Jong*<br />
Jan Maarten de Jong became a<br />
non-executive Director in January<br />
2004. A Dutch national, he is Vice<br />
Chairman of the Supervisory Board of<br />
Heineken N.V. He is a former member<br />
of the Managing Board of ABN Amro<br />
Bank N.V. and continued to be a<br />
Special Advisor to the board of that<br />
company until April 2006. He is also a<br />
director of a number of European<br />
banking, insurance and industrial<br />
holding companies, including AON<br />
Groep Nederland B.V. and KBC Bank<br />
N.V. (Aged 64).<br />
40 <strong>CRH</strong><br />
T.V. Neill*<br />
MA, MSc (Econ.)<br />
Terry Neill became a non-executive<br />
Director in January 2004. He was,<br />
until August 2001, Senior Partner in<br />
Accenture and had been Chairman of<br />
Accenture/Andersen Consulting’s<br />
global board. He is a member of the<br />
Court of Bank of Ireland and a director<br />
of United Business Media Limited.<br />
He is also a member of the Governing<br />
Body of the London Business School,<br />
where he is Chair of the Finance<br />
Committee, and of the Trinity<br />
Foundation Board. (Aged 64).<br />
G.A. Culpepper<br />
CPA, BA, MBA<br />
Finance Director<br />
Glenn Culpepper was appointed<br />
Finance Director and became a <strong>CRH</strong><br />
Board Director in January <strong>2009</strong>. A<br />
United States citizen, he joined <strong>CRH</strong><br />
in 1989. From 1995 to 2008 he<br />
served as Chief Financial Officer of<br />
Oldcastle Materials. Prior to that he<br />
held a variety of operational,<br />
development and financial roles in<br />
the Group’s United States operations.<br />
He started his career with a leading<br />
international accountancy practice.<br />
(Aged 53).<br />
K. McGowan*<br />
Chairman<br />
Kieran McGowan became Chairman<br />
of <strong>CRH</strong> in 2007 having been a<br />
non-executive Director since 1998.<br />
He is a director of Elan Corporation<br />
plc and Charles Schwab Worldwide<br />
Funds plc. He was Chief Executive of<br />
IDA Ireland (Ireland’s inward<br />
investment promotion agency) from<br />
1990 to 1998 and has served as<br />
President of the Irish Management<br />
Institute and as Chairman of the<br />
Governing Authority of University<br />
College Dublin.<br />
(Aged 66).<br />
J.W. Kennedy*<br />
M.Sc, BE, C.Eng, FIEE<br />
John Kennedy became a nonexecutive<br />
Director in June <strong>2009</strong>.<br />
He is Chairman of Wellstream<br />
Holdings plc, a company in the<br />
energy services field. In a 30 year<br />
career, he has served as Executive<br />
Vice President of Halliburton<br />
Company, President of Dresser<br />
Enterprises and Chief Operations<br />
Officer of Brown and Root Services.<br />
He is a director of the UK Atomic<br />
Energy Authority, Integra Group and is<br />
non-executive Chairman of Maxwell<br />
Drummond International Limited,<br />
Hydrasun Holdings Limited, Welltec<br />
A/S and BiFold Fluid Power Limited.<br />
(Aged 59).<br />
M. Lee<br />
BE, FCA<br />
Chief Executive<br />
Myles Lee was appointed a <strong>CRH</strong><br />
Board Director in November 2003.<br />
He joined <strong>CRH</strong> in 1982. Prior to this<br />
he worked in a professional<br />
accountancy practice and in the oil<br />
industry. He was appointed General<br />
Manager Finance in 1988 and to the<br />
position of Finance Director in<br />
November 2003. A civil engineer and<br />
chartered accountant, he has 28<br />
years’ experience of the building<br />
materials industry and of <strong>CRH</strong>’s<br />
international expansion. He was<br />
appointed Group Chief Executive<br />
with effect from 1st January <strong>2009</strong>.<br />
(Aged 56).<br />
N. Hartery*<br />
CEng, FIEI, MBA<br />
Nicky Hartery became a nonexecutive<br />
Director in June 2004. He<br />
was, until October 2008, Vice<br />
President of Manufacturing, Business<br />
Operations and Customer Experience<br />
for Dell Europe, the Middle East and<br />
Africa. Prior to joining Dell, he was<br />
Executive Vice President at Eastman<br />
Kodak and previously held the<br />
position of President and CEO at<br />
Verbatim Corporation, based in the<br />
United States. He is a director of<br />
Musgrave Group plc and the Target<br />
Account Selling Group Limited and a<br />
former director of Eircom Limited.<br />
(Aged 58).
W.I. O’Mahony*<br />
BE, BL, MBA, FIEI<br />
Liam O’Mahony joined <strong>CRH</strong> in 1971<br />
and was appointed a Board Director<br />
in 1992. He held various senior<br />
management positions in the Group,<br />
including Managing Director, Republic<br />
of Ireland and UK Group companies,<br />
Chief Executive of American operations<br />
and Group Chief Executive. He retired<br />
as an executive at the end of 2008<br />
and continued as a Board member in<br />
a non-executive capacity. He is<br />
Chairman of Smurfit Kappa Group plc<br />
and IDA Ireland, a director of Project<br />
Management Limited and a member<br />
of The Irish Management Institute<br />
Council. (Aged 63).<br />
M.S. Towe<br />
Chief Executive Officer,<br />
Oldcastle, Inc.<br />
Mark Towe was appointed a <strong>CRH</strong><br />
Board Director with effect from 31st<br />
July 2008. A United States citizen, he<br />
joined <strong>CRH</strong> in 1997. In 2000, he was<br />
appointed President of Oldcastle<br />
Materials, Inc. and became the Chief<br />
Executive Officer of this Division in<br />
2006. He was appointed to his<br />
current position of Chief Executive<br />
Officer of Oldcastle, Inc. in July 2008.<br />
With 36 years of experience in the<br />
building materials industry, he has<br />
overall responsibility for the Group’s<br />
aggregates, asphalt and readymixed<br />
concrete operations in the United<br />
States and its products and<br />
distribution businesses in the<br />
Americas. (Aged 60).<br />
U-H. Felcht*<br />
Utz-Hellmuth Felcht became a<br />
non-executive Director in July 2007.<br />
A German national, he was, until May<br />
2006, Chief Executive of Degussa AG,<br />
Germany’s third largest chemical<br />
company. He is a partner in the<br />
private equity group One Equity<br />
Partners Europe GmbH and a<br />
member of the Supervisory Boards<br />
of Jungbunzlauer Holding AG and<br />
Süd-Chemie Aktiengesellschaft.<br />
(Aged 62).<br />
A. Manifold<br />
FCPA, MBA, MBS<br />
Chief Operating Officer<br />
Albert Manifold was appointed<br />
Chief Operating Officer of <strong>CRH</strong> and to<br />
the <strong>CRH</strong> Board in January <strong>2009</strong>. He<br />
joined <strong>CRH</strong> in 1998. Prior to joining<br />
<strong>CRH</strong> he was Chief Operating Officer<br />
with a private equity group. He has<br />
held a variety of senior positions,<br />
including Finance Director of the<br />
Europe Materials Division and Group<br />
Development Director of <strong>CRH</strong>. Prior to<br />
his current appointment, he was<br />
Managing Director, Europe Materials.<br />
(Aged 47).<br />
Inset – top and bottom<br />
W.P. Egan*<br />
Bill Egan became a non-executive<br />
Director in January 2007. A United<br />
States citizen, he is founder and<br />
General Partner of Alta<br />
Communications and Marion Equity<br />
Partners LLC, Massachusetts-based<br />
venture capital firms. He is a director<br />
of Cephalon, Inc. and the Irish venture<br />
capital company Delta Partners<br />
Limited. He also serves on the boards<br />
of several communications, cable and<br />
information technology companies.<br />
He is Past President and Chairman of<br />
the National Venture Capital<br />
Association. (Aged 64).<br />
D.N. O’Connor*<br />
BComm, FCA<br />
Dan O’Connor became a nonexecutive<br />
Director in June 2006.<br />
He was, until March 2006, President<br />
and Chief Executive Officer of GE<br />
Consumer Finance - Europe and<br />
a Senior Vice President of GE.<br />
He is Executive Chairman of Allied<br />
Irish Banks plc. (Aged 50).<br />
*Non-executive<br />
Board Committees<br />
Acquisitions<br />
K. McGowan, Chairman<br />
G.A. Culpepper<br />
M. Lee<br />
A. Manifold<br />
T.V. Neill<br />
D.N. O’Connor<br />
W.I. O’Mahony<br />
Audit<br />
J.M. de Jong, Chairman**<br />
U-H. Felcht<br />
D.N. O’Connor**<br />
J.M.C. O’Connor<br />
Finance<br />
K. McGowan, Chairman<br />
G.A. Culpepper<br />
U-H. Felcht<br />
M. Lee<br />
W.I. O’Mahony<br />
Nomination<br />
K. McGowan, Chairman<br />
W.P. Egan<br />
N. Hartery<br />
J.W. Kennedy<br />
M. Lee<br />
T.V. Neill<br />
Remuneration<br />
T.V. Neill, Chairman<br />
W.P. Egan<br />
N. Hartery<br />
J.W. Kennedy<br />
K. McGowan<br />
Senior Independent<br />
Director<br />
N. Hartery<br />
**Audit Committee<br />
Financial Expert<br />
<strong>CRH</strong> 41
42 <strong>CRH</strong><br />
Corporate Governance <strong>Report</strong><br />
<strong>CRH</strong> has primary listings on the Irish and London Stock Exchanges and its<br />
American Depository Receipts are listed on the New York Stock Exchange<br />
(NYSE). The Directors are committed to maintaining the highest standards of<br />
corporate governance and this statement describes how <strong>CRH</strong> applies the main<br />
and supporting principles of section 1 of the Combined Code on Corporate<br />
Governance (June 2008) published by the Financial <strong>Report</strong>ing Council in the UK.<br />
A copy of the Combined Code can be obtained from the Financial <strong>Report</strong>ing<br />
Council’s website, www.frc.org.uk.<br />
Board of Directors<br />
Role<br />
The Board is responsible for the leadership and control of the Company. There is<br />
a formal schedule of matters reserved to the Board for consideration and decision.<br />
This includes Board appointments, approval of strategic plans for the Group,<br />
approval of financial statements, the annual budget, major acquisitions and<br />
significant capital expenditure, and review of the Group’s system of internal<br />
controls.<br />
The Board has delegated responsibility for the management of the Group, through<br />
the Chief Executive, to executive management. The roles of Chairman and Chief<br />
Executive are not combined and there is a clear division of responsibilities<br />
between them, which is set out in writing and has been approved by the Board.<br />
The Chief Executive is accountable to the Board for all authority delegated to<br />
executive management.<br />
The Board has also delegated some of its responsibilities to Committees of the<br />
Board. Individual Directors may seek independent professional advice, at the<br />
expense of the Company, in the furtherance of their duties as a Director.<br />
The Group has a Directors’ and Officers’ liability insurance policy in place, which<br />
indemnifies the Directors in respect of legal action taken against them.<br />
Membership<br />
It is the practice of <strong>CRH</strong> that a majority of the Board comprises non-executive<br />
Directors and that the Chairman be non-executive. At present, there are four<br />
executive and ten non-executive Directors. Biographical details are set out on<br />
pages 40 and 41. The Board considers that, between them, the Directors bring<br />
the range of skills, knowledge and experience, including international experience,<br />
necessary to lead the Company.<br />
Directors are appointed for specified terms and subject to the Memorandum and<br />
Articles of Association of the Company.<br />
Independence<br />
All of the Directors bring independent judgement to bear on issues of strategy,<br />
performance, resources, key appointments and standards, and the Board has<br />
determined that each of the non-executive Directors is independent. In reaching<br />
that conclusion, the Board has considered the principles relating to independence<br />
contained in the Combined Code, the guidance provided by a number of<br />
shareholder voting agencies, and has taken the view that independence is<br />
determined by a Director’s character, objectivity and integrity. Those principles<br />
and guidance address a number of factors that might appear to affect the<br />
independence of Directors, including former service as an executive, extended<br />
service on the Board and cross-directorships. However, they also make clear that<br />
a Director may be considered independent notwithstanding the presence of one<br />
or more of these factors. In the case of Mr. Liam O’Mahony, the Board took<br />
account of his service as a former executive of the Company and was satisfied<br />
that this did not compromise his ability to exercise independent judgement and<br />
to act in the best interests of the Group.<br />
Chairman<br />
Mr. Kieran McGowan has been Chairman of the Group since May 2007. On his<br />
appointment as Chairman, Mr. McGowan met the independence criteria set out<br />
in the Combined Code. The Chairman is responsible for the efficient and effective<br />
working of the Board. He ensures that Board agendas cover the key strategic
issues confronting the Group; that the Board reviews and approves management’s<br />
plans for the Group; and that Directors receive accurate, timely, clear and relevant<br />
information. While Mr. McGowan holds a number of other directorships (see<br />
details on page 40), the Board considers that these do not interfere with the<br />
discharge of his duties to <strong>CRH</strong>.<br />
Senior Independent Director<br />
The Board has appointed Mr. Nicky Hartery as the Senior Independent Director.<br />
Mr. Hartery is available to shareholders who have concerns that cannot be<br />
addressed through the Chairman, Chief Executive or Finance Director.<br />
Company Secretary<br />
The appointment and removal of the Company Secretary is a matter for the<br />
Board. All Directors have access to the advice and services of the Company<br />
Secretary, who is responsible to the Board for ensuring that Board procedures<br />
are complied with.<br />
Terms of appointment<br />
The standard terms of the letter of appointment of non-executive Directors is<br />
available, on request, from the Company Secretary.<br />
Induction and development<br />
New Directors are provided with extensive briefing materials on the Group and its<br />
operations. Directors meet with key executives and, in the course of twice-yearly<br />
visits by the Board to Group locations, see the businesses at first hand and meet<br />
with local management teams.<br />
Remuneration<br />
Details of remuneration paid to the Directors (executive and non-executive) are<br />
set out in the <strong>Report</strong> on Directors’ Remuneration on pages 51 to 59. The <strong>2009</strong><br />
<strong>Report</strong> will be presented to shareholders for the purposes of an advisory nonbinding<br />
vote at the <strong>Annual</strong> General Meeting to be held on 5th May 2010.<br />
Share ownership and dealing<br />
Details of the shares held by Directors are set out on page 59. <strong>CRH</strong> has a policy<br />
on dealings in securities that applies to Directors and senior management. Under<br />
the policy, Directors are required to obtain clearance from the Chairman and Chief<br />
Executive before dealing in <strong>CRH</strong> securities. Directors and senior management are<br />
prohibited from dealing in <strong>CRH</strong> securities during designated prohibited periods<br />
and at any time at which the individual is in possession of inside information (as<br />
defined in the Market Abuse (Directive 2003/6/EC) Regulations 2005). The policy<br />
adopts the terms of the Model Code, as set out in the Listing Rules published by<br />
the Irish Stock Exchange and the UK Listing Authority.<br />
Performance appraisal<br />
The Senior Independent Director conducts an annual review of corporate<br />
governance, the operation and performance of the Board and its Committees<br />
and the performance of the Chairman. This is achieved through discussion with<br />
each Director.<br />
A review of individual Directors’ performance is conducted by the Chairman and<br />
each Director is provided with feedback gathered from other members of the<br />
Board. Performance is assessed against a number of measures, including the<br />
ability of the Director to contribute to the development of strategy, to understand<br />
the major risks affecting the Group, to contribute to the cohesion of the Board, to<br />
commit the time required to fulfil the role and to listen to and respect the views of<br />
other Directors and the management team.<br />
Directors’ retirement and re-election<br />
The Board has determined that a non-executive Director who has served on the<br />
Board for more than nine years, or who has been a former executive of the<br />
Company, will be subject to annual re-election. At least one-third of Directors<br />
retire at each <strong>Annual</strong> General Meeting and Directors must submit themselves to<br />
shareholders for re-election every three years. Re-appointment is not automatic.<br />
Directors who are seeking re-election are subject to a performance appraisal,<br />
which is overseen by the Nomination Committee.<br />
Directors appointed by the Board must submit themselves to shareholders for<br />
election at the <strong>Annual</strong> General Meeting following their appointment.<br />
Board succession planning<br />
The Board plans for its own succession with the assistance of the Nomination<br />
Committee. In so doing, the Board considers the skill, knowledge and experience<br />
necessary to allow it to meet the strategic vision for the Group.<br />
The Board engages the services of independent consultants to undertake a<br />
search for suitable candidates to serve as non-executive Directors.<br />
Meetings<br />
There were eight full meetings of the Board during <strong>2009</strong>. Details of Directors’<br />
attendance at those meetings are set out in the table on page 46. The Chairman<br />
sets the agenda for each meeting, in consultation with the Chief Executive and<br />
Company Secretary. Two visits are made each year by the Board to Group<br />
operations; one in Europe and one in North America. Each visit lasts between<br />
three and five days and incorporates a scheduled Board meeting. In <strong>2009</strong>, these<br />
visits were to Finland and to Tampa, Florida in the United States. Additional<br />
meetings, to consider specific matters, are held when and if required. Board<br />
papers are circulated to Directors in advance of meetings.<br />
The non-executive Directors met twice during <strong>2009</strong> without executives<br />
being present.<br />
Committees<br />
The Board has established five permanent Committees to assist in the execution of<br />
its responsibilities. These are the Acquisitions Committee, the Audit Committee, the<br />
Finance Committee, the Nomination Committee and the Remuneration Committee.<br />
Ad hoc committees are formed from time to time to deal with specific matters.<br />
Each of the permanent Committees has terms of reference, under which authority<br />
is delegated to them by the Board. The terms of reference are available on the<br />
Group’s website, www.crh.com. The Chairman of each Committee reports to the<br />
Board on its deliberations and minutes of all Committee meetings are circulated<br />
to all Directors.<br />
The current membership of each Committee is set out on page 41. Attendance<br />
at meetings held in <strong>2009</strong> is set out in the table on page 46.<br />
Chairmen of the Committees attend the <strong>Annual</strong> General Meeting and are available<br />
to answer questions from shareholders.<br />
During the year each of the relevant Committees reviewed its performance and<br />
terms of reference.<br />
The role of the Acquisitions Committee is to approve acquisitions and capital<br />
expenditure projects within limits agreed by the Board.<br />
The Audit Committee consists of four non-executive Directors, considered by the<br />
Board to be independent. The Board has determined that Mr. Jan Maarten de<br />
Jong and Mr. Dan O’Connor are the Committee’s financial experts. It will be seen<br />
from the Directors’ biographical details, appearing on pages 40 and 41, that the<br />
members of the Committee bring to it a wide range of experience and expertise.<br />
The Committee met 14 times during the year under review. The Finance Director<br />
and the Head of Internal Audit normally attend meetings of the Committee, while<br />
the Chief Executive and other executive Directors attend when necessary. The<br />
external auditors attend as required and have direct access to the Committee<br />
Chairman at all times. During the year, the Committee met with the Head of<br />
Internal Audit and with the external auditors in the absence of management.<br />
The main role and responsibilities are set out in written terms of reference<br />
and include:<br />
# monitoring the integrity of the Group’s financial statements and reviewing<br />
significant financial reporting issues and judgements contained therein;<br />
# reviewing the effectiveness of the Group’s internal financial controls;<br />
<strong>CRH</strong> 43
Corporate Governance <strong>Report</strong> continued<br />
# monitoring and reviewing the effectiveness of the Group’s internal auditors;<br />
# making recommendations to the Board on the appointment and removal of the<br />
external auditors and approving their remuneration and terms of engagement;<br />
# seeking to ensure co-ordination of the work of the external auditors with the<br />
activities of the internal audit function;<br />
# monitoring and reviewing the external auditors’ independence, objectivity and<br />
effectiveness, taking into account professional and regulatory requirements;<br />
and<br />
# reviewing the Company’s procedures for detecting fraud.<br />
These responsibilities are discharged as follows:<br />
# the Committee reviews the trading statements usually issued by the Company<br />
in January and July and the interim management statements issued in May<br />
and November;<br />
# the Committee reviews the Company’s preliminary results announcement/<br />
<strong>Annual</strong> <strong>Report</strong> and accounts. The Committee receives reports at that meeting<br />
from the external auditors identifying any accounting or judgemental issues<br />
requiring its attention;<br />
# the Committee also meets with the external auditors to review the <strong>Annual</strong><br />
<strong>Report</strong> on Form 20-F, which is filed annually with the United States Securities<br />
and Exchange Commission;<br />
# in August, the Committee reviews the interim report;<br />
# the external auditors present their audit plans in advance to the Committee and<br />
the Committee reviews the audit engagement letter;<br />
# the Committee approves the annual internal audit plan;<br />
# regular reports are received from the Head of Internal Audit on reviews<br />
carried out;<br />
# the Head of Internal Audit also reports to the Committee on other issues<br />
including, in the year under review, updates in relation to Section 404 of the<br />
Sarbanes-Oxley Act 2002 and the arrangements in place to enable employees<br />
to raise concerns, in confidence, in relation to possible wrongdoing in financial<br />
reporting or other matters. (A copy of Section 404 of the Sarbanes-Oxley Act<br />
2002 can be obtained from the United States Securities and Exchange<br />
Commission’s website, www.sec.gov); and<br />
# the Committee receives copies of periodic assessments of the Internal Audit<br />
function, which are carried out by management and validated by an independent<br />
third party assessor, and receives updates on the status of the implementation<br />
of any resulting recommendations.<br />
In trading and interim management statements issued during <strong>2009</strong> and to date in<br />
2010, updates on the annualised savings under Group cost-reduction<br />
programmes were announced. The Head of Internal Audit was asked to review<br />
these savings and related costs to implement, and has reported his findings to<br />
the Committee.<br />
As noted above, one of the duties of the Audit Committee is to make<br />
recommendations to the Board in relation to the appointment of the external<br />
auditors. A number of factors are taken into account by the Committee in<br />
assessing whether to recommend the auditors for re-appointment or to seek<br />
other competitive bids for the audit. These include:<br />
# the quality of reports provided to the Audit Committee and the Board, and the<br />
quality of advice given;<br />
# the level of understanding demonstrated of the Group’s business and industry;<br />
# the objectivity of the auditors’ views on the financial controls around the Group<br />
and their ability to co-ordinate a global audit, working to tight deadlines; and<br />
# the results of formal evaluations of the auditors, which the Audit Committee has<br />
decided should be carried out every five years with periodic interim reviews.<br />
44 <strong>CRH</strong><br />
Ernst & Young have been the Group’s auditors since 1988. Following an evaluation<br />
carried out in <strong>2009</strong>, the Committee has recommended to the Board that Ernst &<br />
Young be retained as the Group’s external auditors. There are no contractual<br />
obligations which act to restrict the Audit Committee’s choice of external auditor.<br />
The Committee has put in place safeguards to ensure that the independence of<br />
the audit is not compromised. Such safeguards include:<br />
# seeking confirmation that the auditors are, in their professional judgement,<br />
independent from the Group;<br />
# obtaining from the external auditors an account of all relationships between the<br />
auditors and the Group;<br />
# monitoring the Group’s policy prohibiting the employment of former staff of the<br />
external auditors, who were part of the <strong>CRH</strong> audit team, in senior management<br />
positions until two years have elapsed since the completion of the audit,<br />
monitoring the number of former employees of the external auditors currently<br />
employed in senior positions in the Group and assessing whether those<br />
appointments impair, or appear to impair, the auditors’ judgement or<br />
independence;<br />
# considering whether, taken as a whole, the various relationships between the<br />
Group and the external auditors impair, or appear to impair, the auditors’<br />
judgement or independence; and<br />
# reviewing the economic importance of the Group to the external auditors and<br />
assessing whether that importance impairs, or appears to impair, the external<br />
auditors’ judgement or independence.<br />
The Group has a policy governing the conduct of non-audit work by the auditors.<br />
Under that policy, the auditors are prohibited from performing services where<br />
the auditors:<br />
# may be required to audit their own work;<br />
# participate in activities that would normally be undertaken by management;<br />
# are remunerated through a ‘success fee’ structure, where success is dependent<br />
on the audit; or<br />
# act in an advocacy role for the Group.<br />
Other than the above, the Group does not impose an automatic ban on the<br />
Group auditors undertaking non-audit work. The auditors are permitted to provide<br />
non-audit services that are not, or are not perceived to be, in conflict with auditor<br />
independence, providing they have the skill, competence and integrity to carry<br />
out the work and are considered by the Committee to be the most appropriate to<br />
undertake such work in the best interests of the Group. The engagement of the<br />
external auditors to provide any non-audit services must be pre-approved by the<br />
Audit Committee or entered into pursuant to pre-approval policies and procedures<br />
established by the Committee.<br />
The Group audit engagement partner rotates every five years. Details of the<br />
amounts paid to the external auditors during the year for audit and other services<br />
are set out in note 4 to the financial statements on page 76.<br />
The Terms of Reference of the Audit Committee are reviewed annually. They were<br />
updated in December <strong>2009</strong> in relation to membership of the Committee, fraud<br />
detection, extending the Committee’s responsibilities in overseeing the relationship<br />
with the external auditor and in respect of other minor amendments.<br />
The Finance Committee, which advises the Board on the financial requirements<br />
of the Group and on appropriate funding arrangements:<br />
# considers and makes recommendations to the Board in relation to the issue of<br />
shares/debt instruments, share/bond buy-backs and bank financing;<br />
# considers and makes recommendations to the Board in relation to dividend<br />
levels on the Ordinary Shares;<br />
# keeps the Board advised of the financial implications of Board decisions in<br />
relation to acquisitions; and
# assists management, at their request, in considering any financial (including<br />
taxation) aspect of the Group’s affairs.<br />
The Nomination Committee assists the Board in ensuring that the composition of<br />
the Board and its Committee is appropriate to the needs of the Group by:<br />
# assessing the skills, knowledge, experience and diversity required on the<br />
Board and the extent to which each are represented;<br />
# establishing processes for the identification of suitable candidates for<br />
appointment to the Board; and<br />
# overseeing succession planning for the Board and senior management.<br />
To facilitate the search for suitable candidates to serve as non-executive Directors,<br />
the Committee uses the services of independent consultants.<br />
During <strong>2009</strong>, the Committee identified, and recommended to the Board, a suitable<br />
candidate for appointment as a non-executive Director.<br />
The Terms of Reference of the Nomination Committee, which were updated in<br />
December <strong>2009</strong> in relation to membership of the Committee, are reviewed annually.<br />
The Remuneration Committee, which consists solely of non-executive Directors<br />
considered by the Board to be independent:<br />
# determines the Group’s policy on executive remuneration;<br />
# determines the remuneration of the executive Directors;<br />
# monitors the level and structure of remuneration for senior management; and<br />
# reviews and approves the design of all share incentive plans.<br />
The Committee receives advice from leading independent firms of compensation<br />
and benefit consultants when necessary and the Chief Executive is fully consulted<br />
about remuneration proposals. The Committee oversees the preparation of the<br />
<strong>Report</strong> on Directors’ Remuneration.<br />
In <strong>2009</strong>, the Committee determined the salaries of the executive Directors and<br />
awards under the performance-related incentive plans; approved the terms of a<br />
long-term incentive plan (<strong>2009</strong>-2013) for the Chief Executive; set the remuneration<br />
of the Chairman; and reviewed the remuneration of senior management. It also<br />
approved the award of share options to the executive Directors and key<br />
management and the conditional allocation of shares under the Performance<br />
Share Plan. In addition, the Committee approved the partial release of awards<br />
made under the Performance Share Plan in 2006. Details of the factors taken into<br />
account when assessing the level of vesting under the Performance Share Plan<br />
are set out in the <strong>Report</strong> on Directors’ Remuneration on page 51.<br />
Also in <strong>2009</strong>, the Committee, with the assistance of external advisers, undertook<br />
a review of the Company’s compensation arrangements for executive Directors<br />
and senior managers. Further commentary on this review is contained in the<br />
<strong>Report</strong> on Directors’ Remuneration on page 52.<br />
The Terms of Reference of the Remuneration Committee, which were updated in<br />
February 2010 in relation to membership of the Committee, are reviewed annually.<br />
Corporate Social Responsibility<br />
Corporate Social Responsibility is embedded in all <strong>CRH</strong> operations and activities.<br />
Excellence in environmental, health, safety and social performance is a daily key<br />
priority of line management. Group policies and implementation systems are<br />
summarised on page 10 and are described in detail in the CSR <strong>Report</strong> on the<br />
Group’s website, www.crh.com. During <strong>2009</strong>, <strong>CRH</strong> was again recognised by<br />
several key rating agencies as being among the leaders in its sector in respect of<br />
sustainability performance.<br />
Code of Business Conduct<br />
The <strong>CRH</strong> Code of Business Conduct is applicable to all Group employees. The<br />
Code is available on the Group’s website, www.crh.com. Regional hotline facilities<br />
are in place, to enable employees to report suspected breaches of the Code.<br />
Substantial Holdings<br />
As at 1st March 2010, the Company had received notification of the following<br />
interests in its Ordinary share capital:<br />
Name Holding/Voting Rights %<br />
Capital Research and Management<br />
Company (CRMC)* 84,225,434 12.06%<br />
UBS AG 26,380,604 3.77%<br />
BlackRock, Inc. 24,701,820 3.53%<br />
* On 7th January 2010, The Growth Fund of America, Inc. (GFA) advised the<br />
Company that, with effect from 1st January 2010, it no longer exercised voting<br />
rights in respect of its holding of 30,131,457 shares (4.31%). CRMC has separately<br />
advised that, with effect from 1st January 2010, it has been granted proxy voting<br />
authority by various Capital Group funds, including GFA, that previously voted<br />
independently from CRMC.<br />
On 3rd February 2010, Capital Group International, Inc., which notifies its holding<br />
independently of CRMC, notified the Company that its interest in the Company<br />
had fallen below 3%.<br />
On 22nd July <strong>2009</strong>, Irish Life Investment Managers notified the Company that its<br />
interest in the Company had fallen below 3%.<br />
On 30th April <strong>2009</strong>, Bank of Ireland Asset Management Limited notified the<br />
Company that its interest in the Company had fallen below 3%.<br />
On 14th April <strong>2009</strong>, FMR LLC (Fidelity North America)(FMR) and FIL Limited<br />
Fidelity (Fidelity Asia Pacific, Europe and the Middle East)(FIL), which previously<br />
advised their shareholding in a joint notification, informed the Company that their<br />
holdings had been disaggregated and would be notified separately in future. FMR<br />
notified that its holding on 14th April <strong>2009</strong> was 16,081,428 shares (2.30%), while<br />
FIL notified that its holding was 15,405,831 shares (2.20%).<br />
BlackRock, Inc. has advised that its interests in <strong>CRH</strong> shares arise by reason<br />
of discretionary investment management arrangements entered into by it or its<br />
subsidiaries.<br />
Memorandum and Articles of Association<br />
The Company’s Memorandum of Association sets out the objects and powers of<br />
the Company. The Articles of Association detail the rights attaching to each share<br />
class; the method by which the Company’s shares can be purchased or reissued;<br />
the provisions which apply to the holding of and voting at general<br />
meetings; and the rules relating to the Directors, including their appointment,<br />
retirement, re-election, duties and powers. Further details in relation to the<br />
purchase of the Company’s own shares are included on page 49 of the Directors’<br />
<strong>Report</strong>.<br />
A copy of the Memorandum and Articles of Association can be obtained from the<br />
Group’s website, www.crh.com.<br />
Communications with Shareholders<br />
Communications with shareholders are given high priority and there is regular<br />
dialogue with institutional shareholders, as well as presentations at the time of the<br />
release of the annual and interim results. Conference calls are held following the<br />
issuance of trading statements, interim management statements and major<br />
announcements by the Group, which afford Directors the opportunity to hear<br />
investors’ reactions to the announcements and their views on other issues.<br />
Trading statements are usually issued in January and July and interim management<br />
statements are issued in May and November. Major acquisitions are notified to<br />
the Stock Exchanges in accordance with the requirements of the Listing Rules. In<br />
addition, development updates, giving details of other acquisitions completed<br />
and major capital expenditure projects, are usually issued in January and July<br />
each year.<br />
<strong>CRH</strong> 45
Corporate Governance <strong>Report</strong> continued<br />
Attendance at Board and Board Committee meetings during the year ended 31st December <strong>2009</strong><br />
During <strong>2009</strong>, the Board received reports from management on the issues raised by<br />
investors in the course of presentations following the annual and interim results.<br />
The Group’s website, www.crh.com, provides the full text of the <strong>Annual</strong> and<br />
Interim <strong>Report</strong>s, the <strong>Annual</strong> <strong>Report</strong> on Form 20-F, which is filed annually with the<br />
United States Securities and Exchange Commission, the CSR <strong>Report</strong>, trading<br />
statements, interim management statements and copies of presentations to<br />
analysts and investors. News releases are made available in the News & Media<br />
section of the website immediately after release to the Stock Exchanges.<br />
Webcasts of key investor briefings are broadcast live and are made available as<br />
recordings in the News & Media section.<br />
In addition, the Company responds throughout the year to numerous letters from<br />
shareholders on a wide range of issues.<br />
General Meetings<br />
The Company’s <strong>Annual</strong> General Meeting (AGM), which is held in Ireland, affords<br />
individual shareholders the opportunity to question the Chairman and the Board. All<br />
Directors attended the <strong>2009</strong> AGM. The Notice of the AGM, which specifies the<br />
time, date, place and the business to be transacted, is sent to shareholders at least<br />
twenty working days before the meeting. At the meeting, resolutions are voted on<br />
by means of an electronic voting system. The votes of shareholders present at the<br />
meeting are added to the proxy votes received in advance and the total number of<br />
votes for, against and withheld for each resolution are announced. This information<br />
is made available on the Company’s website following the meeting.<br />
All other general meetings are called Extraordinary General Meetings (EGMs). An<br />
EGM called for the passing of a special resolution must be called by at least twentyone<br />
clear days’ notice. Provided shareholders have passed a special resolution at<br />
the immediately preceding AGM and the Company continues to allow shareholders<br />
to vote by electronic means, an EGM to consider an ordinary resolution may, if the<br />
Directors deem it appropriate, be called at fourteen clear days’ notice.<br />
A quorum for a general meeting of the Company is constituted by five or more<br />
shareholders present in person and entitled to vote. The passing of resolutions at<br />
46 <strong>CRH</strong><br />
Board Acquisitions Audit Finance Nomination Remuneration<br />
A B A B A B A B A B A B<br />
G.A. Culpepper 8 8 1 1 5 5<br />
W.P. Egan 8 8 4 4 8 8<br />
U-H. Felcht 8 8 14 12 6 5<br />
N. Hartery 8 8 4 3 8 8<br />
J.M. de Jong 8 8 14 14<br />
J.W. Kennedy* 4 4 1 1 2 2<br />
M. Lee 8 8 1 1 6 6 4 4<br />
K. McGowan 8 8 1 1 6 6 4 4 8 8<br />
A. Manifold 8 8 1 1<br />
T.V. Neill 8 8 1 - 5 5 4 4 8 8<br />
D.N. O’Connor 8 7 1 - 14 12<br />
J.M.C. O’Connor 8 8 14 14<br />
W.I. O’Mahony 8 8 1 1 6 5<br />
M.S. Towe 8 8<br />
Column A – indicates the number of meetings held during the period the Director was a member of the Board and/or Committee.<br />
Column B – indicates the number of meetings attended during the period the Director was a member of the Board and/or Committee.<br />
* Appointed on 24th June <strong>2009</strong><br />
a general meeting of the Company, other than special resolutions, requires a<br />
simple majority. To be passed, a special resolution requires a majority of at least<br />
75% of the votes cast.<br />
Shareholders have the right to attend, speak, ask questions and vote at general<br />
meetings. In accordance with Irish company law, the Company specifies record<br />
dates for general meetings, by which date shareholders must be registered in the<br />
Register of Members of the Company to be entitled to attend. Record dates are<br />
specified in the notes to the Notice of a general meeting. Shareholders may<br />
exercise their right to vote by appointing a proxy/proxies, by electronic means or<br />
in writing, to vote some or all of their shares. The requirements for the receipt of<br />
valid proxy forms are set out in the notes to the Notice convening the meeting. A<br />
shareholder, or a group of shareholders, holding at least 5% of the issued share<br />
capital of the Company, has the right to requisition a general meeting. A<br />
shareholder, or a group of shareholders, holding at least 3% of the issued share<br />
capital of the Company, has the right to put an item on the agenda of an AGM or<br />
to table a draft resolution for inclusion in the agenda of a general meeting, subject<br />
to any contrary provision in Irish company law.<br />
The Group’s website, www.crh.com, contains answers to questions frequently<br />
asked by shareholders, including questions regarding shareholder rights in<br />
respect of general meetings. The FAQ can be accessed in the Investor Relations<br />
section of the website under ‘Shareholder Services’.<br />
Internal Control<br />
The Directors have overall responsibility for the Group’s system of internal control<br />
and for reviewing its effectiveness. Such a system is designed to manage rather<br />
than eliminate the risk of failure to achieve business objectives and can provide<br />
only reasonable and not absolute assurance against material misstatement<br />
or loss.<br />
The Directors confirm that the Group’s ongoing process for identifying, evaluating<br />
and managing its significant risks is in accordance with the updated Turnbull<br />
guidance (Internal Control: Revised Guidance for Directors on the Combined<br />
Code) published in October 2005. The process has been in place throughout the
accounting period and up to the date of approval of the <strong>Annual</strong> <strong>Report</strong> and<br />
financial statements and is regularly reviewed by the Board.<br />
Group management has responsibility for major strategic development and<br />
financing decisions. Responsibility for operational issues is devolved, subject to<br />
limits of authority, to product group and operating company management.<br />
Management at all levels is responsible for internal control over the respective<br />
business functions that have been delegated. This embedding of the system of<br />
internal control throughout the Group’s operations ensures that the organisation<br />
is capable of responding quickly to evolving business risks, and that significant<br />
internal control issues, should they arise, are reported promptly to appropriate<br />
levels of management.<br />
The Board receives, on a regular basis, reports on the key risks to the business<br />
and the steps being taken to manage such risks. It considers whether the<br />
significant risks faced by the Group are being identified, evaluated and<br />
appropriately managed, having regard to the balance of risk, cost and opportunity.<br />
In addition, the Audit Committee meets with internal auditors on a regular basis<br />
and satisfies itself as to the adequacy of the Group’s internal control system. The<br />
Audit Committee also meets with and receives reports from the external auditors.<br />
The Chairman of the Audit Committee reports to the Board on all significant<br />
issues considered by the Committee and the minutes of its meetings are<br />
circulated to all Directors.<br />
The Directors confirm that they have conducted an annual review of the<br />
effectiveness of the system of internal control up to and including the date of<br />
approval of the financial statements. This had regard to the material risks that<br />
could affect the Group’s business (as outlined in the Directors’ <strong>Report</strong> on pages<br />
48 and 49), the methods of managing those risks, the controls that are in place<br />
to contain them and the procedures to monitor them.<br />
Going Concern<br />
The Company’s business activities, together with the factors likely to affect its<br />
future development, performance and position are set out in the Chief Executive’s<br />
Review on pages 15 to 17. The financial position of the Company, its cash flows,<br />
liquidity position and borrowing facilities are described in the Finance Review on<br />
pages 36 to 39. In addition, notes 21 to 25 to the financial statements include the<br />
Company’s objectives, policies and processes for managing its capital; its<br />
financial risk management objectives; details of its financial instruments and<br />
hedging activities; and its exposures to credit risk and liquidity risk.<br />
The Company has considerable financial resources and a large number of<br />
customers and suppliers across different geographic areas and industries. As a<br />
consequence, the Directors believe that the Company is well placed to manage<br />
its business risks successfully despite the current uncertain economic outlook.<br />
The Directors have a reasonable expectation that the Company, and the Group<br />
as a whole, have adequate resources to continue in operational existence for the<br />
foreseeable future. For this reason, they continue to adopt the going concern<br />
basis in preparing the financial statements.<br />
Compliance<br />
In the period under review, <strong>CRH</strong> complied with the provisions set out in section 1<br />
of the Combined Code. The Company also complied with the rules issued by the<br />
United States Securities and Exchange Commission to implement the Sarbanes-<br />
Oxley Act 2002, in so far as they apply to the Group.<br />
<strong>CRH</strong> 47
Directors’ <strong>Report</strong><br />
The Directors submit their <strong>Report</strong> and Financial Statements for the year ended<br />
31st December <strong>2009</strong>.<br />
Accounts and Dividends<br />
Sales revenue for <strong>2009</strong> of €17.4 billion was 17% lower than 2008. Profit before<br />
tax amounted to €732 million, a decrease of €896 million (55%) on the previous<br />
year. After providing for tax, Group profit for the financial year amounted to<br />
€598 million (2008: €1,262 million). Basic earnings per share amounted to 88.3c<br />
compared with 210.2c (restated for the impact of the March <strong>2009</strong> Rights Issue)<br />
in the previous year, a reduction of 58%.<br />
An interim dividend of 18.5c (2008: 18.48c, restated) per share was paid in<br />
October <strong>2009</strong>. It is proposed to pay a final dividend of 44.0c per share on 10th<br />
May 2010 to shareholders registered at close of business on 12th March 2010.<br />
This gives a total dividend of 62.5c for the year, slightly ahead of the restated<br />
dividend of 62.2c for 2008. Shareholders will have the option of receiving new<br />
shares in lieu of cash dividends.<br />
Other net expense recognised directly within comprehensive income in the year<br />
amounted to €130 million (2008: €402 million).<br />
Some key financial performance indicators are set out in the Finance Review on<br />
pages 36 to 39. The financial statements for the year ended 31st December <strong>2009</strong><br />
are set out in detail on pages 62 to 119.<br />
Books and Records<br />
The Directors are responsible for ensuring that proper books and accounting<br />
records, as outlined in Section 202 of the Companies Act, 1990, are kept by<br />
the Company. The Directors have appointed appropriate accounting personnel,<br />
including a professionally qualified Finance Director, in order to ensure that those<br />
requirements are met.<br />
The books and accounting records of the Company are maintained at the principal<br />
executive offices located at Belgard Castle, Clondalkin, Dublin 22.<br />
Business Review<br />
Development activity<br />
Acquisition and investment spend in <strong>2009</strong> amounted to approximately<br />
€0.46 billion on a total of 17 transactions. This included the €224 million purchase<br />
of a 26% associate stake in Yatai Cement, the leading cement manufacturer<br />
in northeastern China. The remaining transactions comprised ten bolt-on<br />
acquisitions in the Americas Materials business, four investments in China and<br />
Poland by the Europe Materials Division and one acquisition in each of our two<br />
Distribution segments.<br />
Results for <strong>2009</strong><br />
Trading in the first half of <strong>2009</strong> proved extremely demanding with most markets<br />
impacted by weakening economic activity, not helped by the most severe<br />
weather for many years in both Europe and North America. <strong>Report</strong>ed<br />
sales for the first half of <strong>2009</strong> declined by 15% (21% excluding acquisition<br />
and exchange translation effects), EBITDA fell 41% and operating profit and profit<br />
before tax were down 66% and 82% respectively.<br />
While conditions in the second half of <strong>2009</strong> remained challenging, a robust<br />
performance by the Americas Materials Division combined with increasing<br />
benefits from cost reduction measures resulted in improvements in the rate of<br />
profit decline compared to the first half of the year. Second half sales fell by 19%<br />
(18% excluding acquisition and translation effects), while EBITDA declined by<br />
26% with operating profit down 37% and profit before tax 39% lower than the<br />
second half of <strong>2009</strong>.<br />
Full year operating profit for the Group declined by 48% in <strong>2009</strong> to €955 million.<br />
In <strong>CRH</strong>’s European segments operating profit declined by €539 million to<br />
€510 million, a decrease of 51%. In the Americas, operating profit declined by<br />
€347 million (-44%) to €445 million; this decline is net of the positive €37 million<br />
exchange impact as a result of the stronger average US Dollar/euro in <strong>2009</strong>, and<br />
48 <strong>CRH</strong><br />
in US Dollar terms operating profit declined 47%. Overall operating profit margin<br />
for the Group decreased to 5.5% (2008: 8.8%). Profit on disposal of non-current<br />
assets at €26 million was well below 2008 (€69 million). Comprehensive reviews<br />
of the development and financial and operating performance of the Group during<br />
<strong>2009</strong> are set out in the Chief Executive’s Review on pages 15 to 17, the separate<br />
Operations Reviews for each of the Divisions on pages 19 to 35 and the Finance<br />
Review on pages 36 to 39 (including Key Financial Performance Indicators on<br />
page 37). The treasury policy and objectives of the Group are set out in note 21<br />
to the financial statements.<br />
The Group is fully committed to operating ethically and responsibly in all aspects<br />
of our business relating to employees, customers, neighbours and other<br />
stakeholders. The Corporate Social Responsibility (CSR) <strong>Report</strong> available on<br />
the Group’s website, www.crh.com, sets out <strong>CRH</strong>’s policies and performance<br />
relating to the Environment and Climate Change, Health & Safety and Social &<br />
Community matters.<br />
Future development<br />
Management remains firmly concentrated on operational delivery and<br />
development activity continues to be focussed on acquisition opportunities that<br />
offer compelling value and exceptional strategic fit. The Group remains very well<br />
positioned to take advantage of further appropriate development prospects<br />
and we continue to pursue opportunities in <strong>CRH</strong>’s traditional rigorous and<br />
disciplined manner.<br />
Events since financial year-end<br />
No important events have occurred since the end of the financial year which<br />
would have a material effect on the Group’s results for the year ended 31st<br />
December <strong>2009</strong> or on its financial position at that date, or which would have a<br />
significant impact on the Group’s operations or outlook for 2010.<br />
Outlook 2010<br />
We expect a difficult demand backdrop through much of 2010 with continuing<br />
declines in non-residential activity across our markets not helped by a poor start<br />
to the year as a result of prolonged severe weather in Europe and North America<br />
during January and February.<br />
In Europe concerns remain relating to fiscal deficits in a number of countries,<br />
although some markets have proved resilient. In Poland, which has weathered the<br />
economic downturn better than many other European countries, our operations<br />
are well-placed to benefit from infrastructure-driven growth in 2010. In the United<br />
States, recent data releases on residential construction activity have been below<br />
expectations and the likely timing of recovery in US residential activity remains<br />
unclear. On infrastructure, the extension of the SAFETEA-LU Federal Highway<br />
funding programme is currently the subject of intense debate in the US Senate<br />
and House of Representatives with progress anticipated over the next 10 days.<br />
Recent euro-weakness and the relative strengthening of the Polish Zloty and US<br />
Dollar compared with <strong>2009</strong> will, if maintained, be beneficial in 2010.<br />
The significant adjustments to our cost base achieved over the past three years<br />
and our ongoing restructuring measures, together with our substantial balance<br />
sheet capacity, have strengthened the Group operationally and position <strong>CRH</strong><br />
well to respond to upside demand developments and to avail of value-enhancing<br />
acquisition opportunities as these arise across our markets.<br />
Principal Risks and Uncertainties<br />
Under Irish Company law (Regulation 5(4)(c)(ii) of the Transparency (Directive<br />
2004/109/EC) Regulations 2007), the Group is required to give a description of<br />
the principal risks and uncertainties which it faces. These principal risks are set<br />
out below:<br />
# Current global economic conditions have negatively impacted and may continue<br />
to impact <strong>CRH</strong>’s business, results of operations and financial condition.<br />
# <strong>CRH</strong> may suffer from decreased customer demand as a consequence of<br />
reduced construction activity.
# <strong>CRH</strong>’s business may be affected by the default of counterparties in respect of<br />
money owed to <strong>CRH</strong>.<br />
# <strong>CRH</strong> operates in cyclical industries which are affected by factors beyond<br />
Group control such as the level of construction activity, fuel and raw material<br />
prices, which are in turn affected by the performance of national economies,<br />
the implementation of economic policies by sovereign governments and<br />
political developments.<br />
# <strong>CRH</strong> pursues a strategy of growth through acquisitions. <strong>CRH</strong> may not be able<br />
to continue to grow as contemplated in its business plan if it is unable to<br />
identify attractive targets, raise funds on acceptable terms, complete such<br />
acquisition transactions and integrate the operations of the acquired<br />
businesses.<br />
# <strong>CRH</strong> faces strong competition in its various markets, and if <strong>CRH</strong> fails to<br />
compete successfully, market share will decline.<br />
# Existing products may be replaced by substitute products which <strong>CRH</strong> does<br />
not produce and, as a result, <strong>CRH</strong> may lose market share in the markets for<br />
these products.<br />
# Severe weather can reduce construction activity and lead to a decrease in<br />
demand for Group products in areas affected by adverse weather conditions.<br />
# <strong>CRH</strong> is subject to stringent and evolving environmental and health and safety<br />
laws, regulations and standards which could result in costs related to<br />
compliance and remediation efforts that may adversely affect Group results of<br />
operations and financial condition.<br />
# <strong>CRH</strong> may be adversely affected by governmental regulations.<br />
# Economic, political and local business risks associated with international<br />
revenue and operations could adversely affect <strong>CRH</strong>’s business.<br />
# A write-down of goodwill could have a significant impact on the Group’s<br />
income and equity.<br />
# <strong>CRH</strong> does not have a controlling interest in certain of the businesses in which<br />
it has invested and in the future may invest in businesses in which there will not<br />
be a controlling interest. In addition, <strong>CRH</strong> is subject to restrictions due to<br />
minority interests in certain of its subsidiaries.<br />
# Financial institution failures may cause <strong>CRH</strong> to incur increased expenses or<br />
make it more difficult either to utilise <strong>CRH</strong>’s existing debt capacity or otherwise<br />
obtain financing for <strong>CRH</strong>’s operations or financing activities.<br />
# A downgrade of <strong>CRH</strong>’s credit ratings may increase its costs of funding.<br />
# <strong>CRH</strong> has incurred and will continue to incur debt, which could result in<br />
increased financing costs and could constrain <strong>CRH</strong>’s business activities.<br />
# Many of <strong>CRH</strong>’s subsidiaries operate in currencies other than the euro, and<br />
adverse changes in foreign exchange rates relative to the euro could adversely<br />
affect Group reported earnings and cash flow.<br />
# <strong>CRH</strong> is exposed to interest rate fluctuations.<br />
The Group has long experience of coping with these risks while delivering superior<br />
performance and strong Total Shareholder Return.<br />
<strong>Report</strong> on Directors’ Remuneration<br />
Resolution 3 to be proposed at the <strong>Annual</strong> General Meeting deals with the <strong>Report</strong><br />
on Directors’ Remuneration, as set out on pages 51 to 59, which the Board has<br />
decided to present to shareholders for the purposes of a non-binding advisory<br />
vote. This is in line with international best practice and the Directors believe that<br />
the resolution will afford shareholders an opportunity to have a ‘say on pay’.<br />
Board of Directors<br />
Mr. T.V. Neill retires from the Board by rotation and does not seek re-election.<br />
Mr. U-H. Felcht and Mr. D.N. O’Connor retire from the Board by rotation and,<br />
being eligible, offer themselves for re-election.<br />
The Board has decided that a non-executive Director who has previously served<br />
in an executive capacity will be subject to annual re-election. Accordingly,<br />
Mr. W.I. O’Mahony retires and, being eligible, offers himself for re-election.<br />
Mr. J.W. Kennedy was appointed to the Board on 24th June <strong>2009</strong>. In accordance<br />
with the provisions of Article 110, he retires and, being eligible, offers himself for<br />
re-election.<br />
Disapplication of Pre-emption Rights<br />
A special resolution will be proposed at the <strong>Annual</strong> General Meeting to renew<br />
the Directors’ authority to disapply statutory pre-emption rights in relation to<br />
allotments of shares for cash. In respect of allotments other than for rights issues<br />
to ordinary shareholders and employees’ share schemes, the authority is limited<br />
to Ordinary/Income Shares (excluding Treasury Shares) having a nominal value<br />
of €11,868,000, representing 5% approximately of the issued Ordinary/Income<br />
share capital at 1st March 2010. This authority will expire on the earlier of the date<br />
of the <strong>Annual</strong> General Meeting in 2011 or 4th August 2011.<br />
Purchase of Own Shares<br />
On 3rd January 2008, the Company announced the introduction of a share<br />
repurchase programme of up to 5% of the 547,227,194 Ordinary/Income Shares,<br />
with a nominal value of €0.32/€0.02 respectively, then in issue and the intention<br />
to hold the repurchased shares as Treasury Shares. Under the programme, the<br />
termination of which was announced in November 2008, 18,204,355 Ordinary/<br />
Income Shares were purchased, equivalent to 3.3% of the Ordinary Shares in<br />
issue at 31st December 2007, at an average price of €22.30 per share. During<br />
<strong>2009</strong>, 3,864,805 (2008: 2,000,350) Treasury Shares were re-issued under the<br />
Group’s Share Schemes. As at 1st March 2010, 12,331,671 shares were held as<br />
Treasury Shares, equivalent to 1.77% of the Ordinary Shares in issue (excluding<br />
Treasury Shares).<br />
Special resolutions will be proposed at the <strong>Annual</strong> General Meeting to renew the<br />
authority of the Company, or any of its subsidiaries, to purchase up to 10% of the<br />
Company’s Ordinary/Income Shares in issue at the date of the <strong>Annual</strong> General<br />
Meeting and in relation to the maximum and minimum prices at which Treasury<br />
Shares (effectively shares purchased and not cancelled) may be re-issued offmarket<br />
by the Company. If granted, the authorities will expire on the earlier of the<br />
date of the <strong>Annual</strong> General Meeting in 2011 or 4th August 2011.<br />
The minimum price which may be paid for shares purchased by the Company<br />
shall not be less than the nominal value of the shares and the maximum price will<br />
be 105% of the average market price of such shares over the preceding five days.<br />
As at 1st March 2010, options to subscribe for a total of 25,989,145 Ordinary/<br />
Income Shares are outstanding, representing 3.72% of the issued Ordinary/<br />
Income share capital (excluding Treasury Shares). If the authority to purchase<br />
Ordinary/Income Shares was used in full, the options would represent 4.14%.<br />
The Directors do not have any current intention of exercising the power to<br />
purchase the Company’s own shares and will only do so if they consider it to be<br />
in the best interests of the Company and its shareholders.<br />
Notice Period for Extraordinary General Meetings<br />
Resolution 9 to be proposed at the <strong>Annual</strong> General Meeting is a special resolution,<br />
which seeks shareholders’ approval to maintain the existing authority in the<br />
Articles of Association that permits the Company to convene an extraordinary<br />
general meeting on 14 clear days’ notice where the purpose of the meeting is<br />
to consider an ordinary resolution. If approved, it is the intention of the Directors<br />
only to utilise this authority where they consider it to be in the best interests of the<br />
Company and its shareholders.<br />
Articles of Association<br />
Resolution 12 to be proposed at the <strong>Annual</strong> General Meeting is a special<br />
resolution and seeks shareholders’ approval for certain changes to the Articles<br />
of Association. The proposed amendments set out in paragraphs (a) to (f) of<br />
the resolution will update the Articles and also make them consistent with the<br />
Shareholder Rights (Directive 2007/36/EC) Regulations <strong>2009</strong> by:<br />
<strong>CRH</strong> 49
Directors’ <strong>Report</strong> continued<br />
# amending the definitions to reflect recent legislative changes;<br />
# allowing for the convening of shareholder meetings to consider an ordinary<br />
resolution at 14 days’ notice provided that the Company offers shareholders<br />
the facility to vote electronically and provided that shareholders agree to this at<br />
a general meeting. Shareholders’ consent must be sought by way of a special<br />
resolution. Any consent given is valid only up to the date of the next annual<br />
general meeting and must, therefore, be renewed every year;<br />
# requiring that, where a member wishes to table a draft resolution in respect of<br />
an extraordinary general meeting under Section 133(1)(b) of the Companies<br />
Act 1963, notice of the resolution shall be received by the Company in hardcopy<br />
form or in electronic form at least 14 days before the extraordinary general<br />
meeting to which it relates;<br />
# removing the casting vote of the Chairman at general meetings of the<br />
Company;<br />
# clarifying that shareholders need not vote all of their shares in the same way;<br />
# allowing the Directors to implement procedures for voting electronically or by<br />
correspondence and for the real-time transmission of general meetings via the<br />
internet; and<br />
# allowing for the fixing of a record date and time which shall determine the<br />
eligibility of shareholders to participate and vote at general meetings.<br />
Paragraph (g) of Resolution 12 re-numbers the Articles of Association and all<br />
cross references therein to reflect the amendments provided for in paragraphs<br />
(a) to (f).<br />
Corporate Governance<br />
Statements by the Directors in relation to the Company’s appliance of corporate<br />
governance principles, compliance with the provisions of the Combined Code<br />
on Corporate Governance (June 2008), the Group’s system of internal controls<br />
and the adoption of the going concern basis in the preparation of the financial<br />
statements are set out on pages 42 to 47. For the purpose of Statutory Instrument<br />
450/<strong>2009</strong> European Communities (Directive 2006/46) Regulations <strong>2009</strong>, the<br />
Corporate Governance report is deemed to be incorporated in this part of the<br />
Directors’ <strong>Report</strong>.<br />
Details of the Company’s employee share schemes and capital structure can be<br />
found in notes 7 and 30 to the financial statements on pages 78 to 80 and 109<br />
to 111 respectively.<br />
Regulation 21 of SI 255/2006 EC (Takeover Directive) Regulations 2006<br />
For the purpose of Regulation 21 of Statutory Instrument 255/2006 EC (Takeover<br />
Directive) Regulations 2006, the information on the Board of Directors on pages<br />
40 and 41, share option schemes, savings-related share option schemes and<br />
the Performance Share Plan in note 7, share capital in note 30 and the <strong>Report</strong> on<br />
Directors’ Remuneration on pages 51 to 59 are deemed to be incorporated in this<br />
part of the Directors’ <strong>Report</strong>.<br />
The Company has certain banking facilities which may require repayment in the<br />
event that a change in control occurs with respect to the Company. In addition, the<br />
Company’s share option schemes and Performance Share Plan contain change<br />
of control provisions which can allow for the acceleration of the exercisability<br />
of share options and the vesting of share awards in the event that a change of<br />
control occurs with respect to the Company.<br />
SI 277/2007 Transparency (Directive 2004/109/EC) Regulations 2007<br />
For the purpose of Statutory Instrument 277/2007 Transparency (Directive<br />
2004/109/EC) Regulations 2007, the report on Corporate Social Responsibility<br />
as published on the <strong>CRH</strong> website is deemed to be incorporated in this part of the<br />
Directors’ <strong>Report</strong>, together with the following sections of the <strong>Annual</strong> <strong>Report</strong>: the<br />
Chairman’s Statement on pages 12 and 13, the Operations Reviews on pages 19<br />
50 <strong>CRH</strong><br />
to 35, the Finance Review on pages 36 to 39, the details of Earnings per Share<br />
on page 84, details of derivative financial instruments in note 24, the details of the<br />
re-issue of Treasury Shares in note 30 and details of employees in note 6.<br />
The Directors confirm that to the best of their knowledge, the annual report<br />
and the financial statements give a true and fair view of the assets, liabilities,<br />
financial position and the profit and loss of the Company and the undertakings<br />
included in the consolidation. It also includes a fair review of the development<br />
and performance of the business and the position of the Company and the<br />
undertakings included in the consolidation, taken as a whole, together with a<br />
description of the principal risks and uncertainties that they face.<br />
Subsidiary, Joint Venture and Associated Undertakings<br />
The Group has over 1,100 subsidiary, joint venture and associated undertakings.<br />
The principal ones as at 31st December <strong>2009</strong> are listed on pages 124 to 129.<br />
Auditors<br />
The Auditors, Ernst & Young, Chartered Accountants, are willing to continue in<br />
office and a resolution authorising the Directors to fix their remuneration will be<br />
submitted to the <strong>Annual</strong> General Meeting.<br />
<strong>Annual</strong> General Meeting<br />
Your attention is drawn to the letter to shareholders and the Notice of Meeting<br />
enclosed with this report, which set out details of additional matters to be<br />
considered at the <strong>Annual</strong> General Meeting.<br />
On behalf of the Board,<br />
K. McGowan, M. Lee,<br />
Directors<br />
1st March 2010
<strong>Report</strong> on Directors’ Remuneration<br />
The Remuneration Committee<br />
The Remuneration Committee of the Board consists of non-executive Directors<br />
of the Company. The terms of reference for the Remuneration Committee are<br />
to determine the Group’s policy on executive remuneration and to consider and<br />
approve salaries and other terms of the remuneration packages for the executive<br />
Directors. The Committee receives advice from leading independent firms of<br />
compensation and benefit consultants when necessary and the Chief Executive<br />
attends meetings except when his own remuneration is being discussed.<br />
Membership of the Remuneration Committee is set out on page 41.<br />
Remuneration Policy<br />
<strong>CRH</strong> is an international group of companies, with activities in 35 countries. <strong>CRH</strong>’s<br />
policy on Directors’ remuneration is designed to attract and retain Directors of<br />
the highest calibre who can bring their experience and independent views to the<br />
policy, strategic decisions and governance of <strong>CRH</strong>.<br />
Executive Directors must be properly rewarded and motivated to perform in<br />
the best interest of the shareholders. The spread of the Group’s operations<br />
requires that the remuneration packages in place in each geographical area are<br />
appropriate and competitive for that area. In setting remuneration levels, the<br />
Remuneration Committee takes into consideration the remuneration practices of<br />
other international companies of similar size and scope and the EU Commission’s<br />
recommendations on remuneration in listed companies.<br />
The EU Commission’s recommendations were published in December 2004 in<br />
a document entitled “fostering an appropriate regime for the remuneration of the<br />
directors of listed companies” and those recommendations were supplemented<br />
by additional recommendations issued in <strong>2009</strong>. The Remuneration Committee<br />
supports the general objectives of the EU’s recommendations and the broad<br />
issues they aim to address. This is reflected in the detailed disclosures in this<br />
<strong>Report</strong> in relation to the Group’s remuneration policy, the elements of executive<br />
Directors’ remuneration (including bonus structure, deferred bonus arrangements<br />
and share incentive plans), the collective and individual remuneration of Directors<br />
and pension entitlements. The Company believes that shareholders are entitled<br />
to have a ‘say on pay’ and, accordingly, at the 2010 <strong>Annual</strong> General Meeting, this<br />
<strong>Report</strong> will be presented to shareholders for the purposes of an advisory vote. A<br />
number of the EU Commission’s recommendations, some of which are the subject<br />
of on-going consideration at government level and in investment associations,<br />
have not been implemented by the Remuneration Committee. Those areas will<br />
continue to receive the Committee’s active consideration and their relevance and<br />
practicality in the business context in which <strong>CRH</strong> operates will be assessed.<br />
Performance-related rewards, based on measured targets, are a key component<br />
of remuneration. <strong>CRH</strong>’s strategy of fostering entrepreneurship in its regional<br />
companies requires well-designed incentive plans that reward the creation of<br />
shareholder value through organic and acquisitive growth. The typical elements of<br />
the remuneration package for executive Directors are basic salary and benefits,<br />
a performance-related incentive plan, a contributory pension scheme and<br />
participation in the performance share and share option plans. It is policy to grant<br />
participation in these plans to key management to encourage identification with<br />
shareholders’ interests and to create a community of interest among different<br />
regions and nationalities.<br />
The Group also operates share participation plans and savings-related share<br />
option schemes for eligible employees in all regions where the regulations permit<br />
the operation of such plans. In total there are approximately 7,300 employees of<br />
all categories who are shareholders in the Group.<br />
Executive Directors’ Remuneration<br />
Basic salary and benefits<br />
The basic salaries of executive Directors are reviewed annually having regard to<br />
personal performance, company performance, step changes in responsibilities<br />
and competitive market practice in the area of operation. Employment-related<br />
benefits relate principally to relocation costs, the use of company cars and<br />
medical/life assurance. No fees are payable to executive Directors.<br />
Performance-related incentive plan<br />
The performance-related incentive plan is totally based on achieving clearly<br />
defined and stretch annual profit targets and strategic goals with an approximate<br />
weighting of 80% for profits and cash flow generation and 20% for personal<br />
and strategic goals. At target performance, payout is 80% of basic salary for<br />
Europe-based participants and 90% of basic salary for US-based participants. A<br />
maximum payout of 1.5 times these levels is payable for a level of performance<br />
well in excess of target.<br />
The four components of the plan are:<br />
(i) Individual performance<br />
(ii) Earnings per share growth targets<br />
(iii) Cash flow generation targets<br />
(iv) Return on net assets targets.<br />
Up to one-third of the bonus in each year is payable in <strong>CRH</strong> shares and the<br />
entitlement to beneficial ownership of the shares is deferred for a period of three<br />
years, with the individual not becoming beneficially entitled to the shares in the<br />
event of departure from the Group in certain circumstances during that time<br />
period.<br />
In addition, the Chief Executive, Mr. M. Lee, has a special long-term incentive plan<br />
incorporating targets set for the five-year period <strong>2009</strong>-2013. The plan incorporates<br />
challenging goals in respect of Total Shareholder Return by comparison with a<br />
peer group, growth in earnings per share and the strategic development of the<br />
Group, with a total maximum earnings potential of 40% of aggregate basic salary.<br />
While accruals are made on an annual basis, there is no commitment to any<br />
payment until the end of the period. Details of the manner in which the earnings<br />
are provided for under the plan are set out in note 2 to the table of Directors’<br />
remuneration on page 53.<br />
Performance Share Plan/Share Option Scheme<br />
Long-term incentive plans involving conditional awards of shares are now a<br />
common part of executive remuneration packages, motivating high performance<br />
and aligning the interests of executives and shareholders. The Performance Share<br />
Plan (PSP) approved by shareholders in May 2006 is tied to Total Shareholder<br />
Return (TSR). Half of the award is assessed against TSR for a group of global<br />
building materials companies and the other half against TSR for the constituents<br />
of the Eurofirst 300 Index.<br />
The maximum award under the PSP is 150% of basic salary per annum in the<br />
form of conditional shares and the vesting period is three years. The awards lapse<br />
if over the three-year period <strong>CRH</strong>’s TSR is below the median of the peer group/<br />
index; 30% of the award vests if <strong>CRH</strong>’s performance is equal to the median while<br />
100% vests if <strong>CRH</strong>’s performance is equal to or greater than the 75th percentile;<br />
for TSR performance between the 50th and the 75th percentiles, between 30%<br />
and 100% of the award vests on a straight-line basis.<br />
When approved by shareholders in 2006, the Performance Share Plan incorporated<br />
an earnings per share (EPS) growth underpin of the Irish Consumer Price<br />
Index plus 5% per annum, a requirement of the Irish Association of Investment<br />
Managers (IAIM) at the time. During <strong>2009</strong>, the IAIM advised that it did not regard<br />
this financial test as an additional hurdle but rather as a mechanism to assist<br />
the Remuneration Committee in determining whether TSR reflected performance.<br />
Following discussion with the IAIM, the rules of the PSP were amended to delete<br />
the underpin requirement, substituting in its place the condition that no award,<br />
or portion of an award, which had satisfied the TSR performance criteria would<br />
be released unless the Remuneration Committee had confirmed that the TSR<br />
outcome was valid and had not been significantly affected by unusual events or<br />
extraneous factors. In addition, the Committee reviews EPS growth to assess<br />
its consistency with the objectives of the performance assessment, for example,<br />
comparing EPS performance with that of non-financial companies listed on the<br />
Irish Stock Exchange.<br />
<strong>CRH</strong> 51
<strong>Report</strong> on Directors’ Remuneration continued<br />
Participants in the Plan are not entitled to any dividends (or other distributions<br />
made) and have no right to vote in respect of the shares subject to the award,<br />
until such time as the shares vest. Details of awards to Directors under the Plan<br />
are provided on page 56.<br />
Under the terms of the Share Option Scheme approved by shareholders in May<br />
2000 (the 2000 Share Option Scheme), two tiers of options have been available<br />
subject to different performance conditions as set out below:<br />
(i) Exercisable only when EPS growth exceeds the growth of the Irish Consumer<br />
Price Index by 5% compounded over a period of at least three years<br />
subsequent to the granting of the options (Basic Tier).<br />
(ii) Exercisable, if over a period of at least five years subsequent to the granting of<br />
the options, the growth in EPS exceeds the growth of the Irish Consumer Price<br />
Index by 10% compounded and places the Company in the top 25% of EPS<br />
performance of a peer group of international building materials and other<br />
manufacturing companies. If below the 75th percentile, these options are not<br />
exercisable (Second Tier).<br />
With the introduction of the Performance Share Plan, the Remuneration<br />
Committee decided that no further Second Tier share options should be granted<br />
under the 2000 Share Option Scheme; however, Basic Tier options continued to<br />
be issued. Grants of share options were at the market price of the Company’s<br />
shares at the time of grant, and were made after the final results announcement<br />
ensuring transparency.<br />
The percentage of share capital which can be issued under the Performance<br />
Share Plan and share option schemes, and individual share option grant limits,<br />
comply with institutional guidelines.<br />
Review of Compensation Arrangements/New Share Option Scheme<br />
During <strong>2009</strong>, the Remuneration Committee carried out a review of senior executive<br />
remuneration, to ensure that the Company’s arrangements were aligned with<br />
<strong>CRH</strong>’s business strategy and remained competitive with the external marketplace.<br />
This followed a similar review in 2005, which led to amendments to the annual<br />
bonus plan and the introduction of the Performance Share Plan. The Committee<br />
concluded that no change was required to current remuneration arrangements.<br />
However, as the 2000 Share Option Scheme expires in May 2010, it is proposed<br />
to seek shareholder approval at the 2010 <strong>Annual</strong> General Meeting (AGM) for<br />
the introduction of a new share option scheme (the New Scheme). If approved,<br />
it is intended to grant options under the New Scheme following the AGM and<br />
thereafter, subject to satisfactory performance, to award options annually ensuring<br />
a smooth progression over the life of the New Scheme.<br />
The proposed New Scheme will be based on one tier of options with a single<br />
vesting test. The performance criteria for the scheme will be EPS-based. Vesting<br />
will only occur once an initial performance target has been reached and, thereafter,<br />
would be dependent on performance. In considering the level of vesting based<br />
on EPS performance, the Remuneration Committee will also consider the overall<br />
results of the Group. Performance targets for the initial grant of options have been<br />
agreed with the Irish Association of Investment Managers, who have approved the<br />
Scheme, and are as follows:<br />
# the option award lapses if EPS growth over the three year target period is less<br />
than 12.5% compounded over the period;<br />
# 20% of the option grant shall be exercisable if compound EPS growth is equal<br />
to 12.5%, while 100% shall be exercisable if compound EPS growth is equal<br />
to 27.5%;<br />
# subject to any reduction which the Remuneration Committee deems<br />
appropriate, options vest between 20% and 40% on a straight-line basis if<br />
compound growth is between 12.5% and 17.5%; and vest between 40% and<br />
100% on a straight-line basis if compound growth is between 17.5% and<br />
27.5%, which provides for proportionately more vesting for higher levels of<br />
EPS growth.<br />
52 <strong>CRH</strong><br />
The Remuneration Committee will have authority to set appropriate criteria for<br />
each subsequent grant.<br />
The Remuneration Committee believes that the introduction of the New Scheme will<br />
continue to closely align management with shareholder goals as well as fostering the<br />
attainment of superior performance and ensure that <strong>CRH</strong> can continue to recruit,<br />
retain and motivate high quality executives across its global areas of operation.<br />
A summary of the principal features of the New Scheme is included in the<br />
circular sent to all shareholders, which includes the Notice of the 2010 <strong>Annual</strong><br />
General Meeting.<br />
Non-executive Directors’ Remuneration<br />
The remuneration of non-executive Directors, including that of the Chairman, is<br />
determined by the Board of Directors as a whole. In determining the remuneration,<br />
the Board receives recommendations from the Remuneration Committee in respect<br />
of the Chairman and from the executive Directors in respect of the remaining<br />
non-executive Directors. Remuneration is set at a level which will attract individuals<br />
with the necessary experience and ability to make a substantial contribution to the<br />
Company’s affairs and reflect the time and travel demands of their Board duties.<br />
They do not participate in any of the Company’s performance-related incentive<br />
plans or share schemes.<br />
Pensions<br />
Mr. Lee and Mr. Manifold are participants in a contributory defined benefit plan<br />
which is based on an accrual rate of 1/60th of pensionable salary for each year of<br />
pensionable service and is designed to provide two-thirds of salary at retirement<br />
for full service. There is provision for Mr. Lee and Mr. Manifold to retire at<br />
60 years of age.<br />
The Finance Act 2006 established a cap on pension provision by introducing a<br />
penalty tax charge on pension assets in excess of the higher of €5 million or the<br />
value of individual accrued pension entitlements as at 7th December 2005. As<br />
a result of these legislative changes, the Remuneration Committee decided that<br />
Mr. Lee and Mr. Manifold should have the option of continuing to accrue pension<br />
benefits as previously, or of choosing an alternative arrangement – by accepting<br />
pension benefits limited by the cap – with a similar overall cost to the Group.<br />
Both have chosen to opt for the alternative arrangement which involves capping<br />
their pensions in line with the provisions of the Finance Act 2006 and receiving a<br />
supplementary taxable non-pensionable cash allowance in lieu of pension benefits<br />
foregone. These allowances are similar in value to the reduction in the Company’s<br />
liability represented by the pension benefits foregone. They are calculated based<br />
on actuarial advice as the equivalent of the reduction in the Company’s liability to<br />
each individual and spread over the term to retirement as annual compensation<br />
allowances. The allowances for <strong>2009</strong> are detailed in note (ii) on page 54.<br />
Mr. Culpepper and Mr. Towe participate in defined contribution retirement plans in<br />
respect of basic salary; and in addition participate in unfunded defined contribution<br />
Supplemental Executive Retirement Plans (SERP) also in respect of basic salary,<br />
to which contributions are made at an agreed rate, offset by contributions made<br />
to the other retirement plan.<br />
Since 1991, it has been the Board’s policy that non-executive Directors do not<br />
receive pensions.<br />
Directors’ Service Contracts<br />
No executive Director has a service contract extending beyond twelve months.<br />
No Director has a service contract that provides for any benefits on termination<br />
of employment.<br />
Directors’ Remuneration and Interests in Share Capital<br />
Details of Directors’ remuneration charged against profit in the year are given in<br />
the table across. Details of individual remuneration and pension benefits for the<br />
year ended 31st December <strong>2009</strong> are given on page 54. Directors’ share options<br />
and shareholdings are shown on pages 57 to 59.
Directors’ Remuneration<br />
Notes<br />
Executive Directors<br />
<strong>2009</strong> 2008<br />
€000 €000<br />
Basic salary 3,384 2,807<br />
Performance-related incentive plan<br />
– cash element 964 905<br />
– deferred shares element - -<br />
Retirement benefits expense 1,462 497<br />
Benefits 397 369<br />
(i) 6,207 4,578<br />
(ii) Provision for Chief Executive long-term incentive plan 460 456<br />
Total executive Directors’ remuneration 6,667 5,034<br />
Average number of executive Directors 4.00 3.00<br />
Non-executive Directors<br />
Fees 646 568<br />
Other remuneration 672 679<br />
(i) Total non-executive Directors’ remuneration 1,318 1,247<br />
Average number of non-executive Directors 9.50 8.35<br />
(iii) Severance - 2,160<br />
(iv) Payments to former Directors 59 66<br />
Total Directors’ remuneration 8,044 8,507<br />
Notes to Directors’ remuneration<br />
(i) See analysis of <strong>2009</strong> remuneration by individual on page 54.<br />
(ii) As set out on page 51, the Chief Executive has a special long-term incentive plan<br />
tied to the achievement of exceptional growth and key strategic goals for the fiveyear<br />
period <strong>2009</strong> to 2013 with a total maximum earnings potential of 40% of<br />
aggregate basic salary. While accruals are made on an annual basis, there is no<br />
commitment to any payment until the end of the five-year period. A similar plan<br />
was in place for the former Chief Executive Mr. O’Mahony for the four-year period<br />
2005 to 2008 with a total maximum earnings potential of 40% of aggregate basic<br />
salary, amounting to a potential €2,074,000. The actual earnings under this plan<br />
came to €1,950,000, payment of which was made in <strong>2009</strong>. <strong>Annual</strong> provisions of<br />
40% of basic salary were made in respect of Mr. O’Mahony’s plan for the years<br />
2005 through 2008 amounting in total to €1,494,000. Accordingly the balance of<br />
€456,000 was provided in 2008 and is reflected in total 2008 Directors’<br />
remuneration.<br />
(iii) Severance payment to Mr. T.W. Hill who resigned as an executive on 31st July<br />
2008 after 28 years service.<br />
(iv) Consulting and other fees paid to a number of former directors.<br />
<strong>CRH</strong> 53
<strong>Report</strong> on Directors’ Remuneration continued<br />
Individual remuneration for the year ended 31st December <strong>2009</strong><br />
54 <strong>CRH</strong><br />
Basic<br />
salary<br />
and fees<br />
Cash<br />
element<br />
(i)<br />
Incentive Plan<br />
Deferred<br />
shares<br />
(i)<br />
Retirement<br />
benefits<br />
expense<br />
(ii)<br />
Other<br />
remuneration<br />
(iii)<br />
Benefits<br />
(iv)<br />
Total<br />
<strong>2009</strong><br />
€000 €000 €000 €000 €000 €000 €000 €000<br />
Executive Directors<br />
G.A. Culpepper (v) 609 164 - 122 - 192 1,087 -<br />
T.W. Hill (vi) - - - - - - - 856<br />
M. Lee 1,150 300 - 980 - 25 2,455 1,114<br />
A. Manifold (v) 800 210 - 195 - 31 1,236 -<br />
W.I. O’Mahony (vii) - - - - - - - 1,746<br />
M.S. Towe (viii) 825 290 - 165 - 149 1,429 862<br />
3,384 964 - 1,462 - 397 6,207 4,578<br />
Non-executive Directors<br />
W.P. Egan 68 - - - 52 - 120 120<br />
U-H. Felcht 68 - - - 37 - 105 105<br />
N. Hartery 68 - - - 47 - 115 106<br />
J.M. de Jong 68 - - - 71 - 139 139<br />
D.M. Kennedy - - - - - - - 47<br />
J.W. Kennedy (ix) 34 - - - 11 - 45 -<br />
K. McGowan 68 - - - 337 - 405 450<br />
T.V. Neill 68 - - - 37 - 105 100<br />
D.N. O’Connor 68 - - - 22 - 90 90<br />
J.M.C. O’Connor 68 - - - 22 - 90 90<br />
W.I. O’Mahony (vii) 68 - - - 36 - 104 -<br />
646 - - - 672 - 1,318 1,247<br />
(i) Performance-related Incentive Plan Under the executive Directors’ incentive plan for <strong>2009</strong>, a bonus is payable for meeting clearly defined and stretch profit/<br />
cash flow targets and strategic goals. The structure of the <strong>2009</strong> incentive plan is set out on page 51. The <strong>2009</strong> plan payout levels reflect the very strong delivery<br />
under the cash flow generation component. For <strong>2009</strong> the bonus is payable entirely in cash.<br />
(ii) Retirement benefits expense The Irish Finance Act 2006 effectively established a cap on pension provision by introducing a penalty tax charge on pension<br />
assets in excess of the higher of €5 million or the value of individual prospective pension entitlements as at 7th December 2005. As a result of these legislative<br />
changes, the Remuneration Committee has decided that Executive Directors who are members of Irish pension schemes should have the option of continuing to<br />
accrue pension benefits as previously, or of choosing an alternative arrangement - by accepting pension benefits limited by the cap - with a similar overall cost to<br />
the Group. Mr. Lee, Mr. Manifold and former Chief Executive Mr. O’Mahony chose to opt for the alternative arrangement which involves capping their pensions in<br />
line with the provisions of the Finance Act and receiving a supplementary taxable non-pensionable cash allowance, in lieu of prospective pension benefits<br />
foregone. These allowances are similar in value to the reduction in the Company’s liability represented by the pension benefit foregone. They are calculated based<br />
on actuarial advice as the equivalent of the reduction in the Company’s liability to each individual and spread over the term to retirement as annual compensation<br />
allowances. For <strong>2009</strong> the compensation allowances amount to €980,000 (2008: €328,847) for Mr. Lee and €195,000 for Mr. Manifold. The level of <strong>2009</strong><br />
compensation allowance for Mr. Lee reflects the increase in salary following his appointment as Chief Executive and his relatively short time to retirement. In 2008<br />
the compensation allowance for Mr. O’Mahony amounted to €587,240, however, as Mr. O’Mahony had waived his right to equivalent prospective benefit<br />
entitlements from his benefit plan arrangements, which were fully funded at end-2004, no net pension-related expense arose in his respect.<br />
(iii) Other remuneration Non-executive Directors: Includes remuneration for Chairman and Board Committee work and in the case of Mr. O’Mahony also includes<br />
payment for services unrelated to Board and Committee work.<br />
(iv) Benefits These relate principally to relocation expenses, housing allowance, the use of company cars and medical/life assurance.<br />
(v) Mr. G.A. Culpepper and Mr. A. Manifold became Directors on 1st January <strong>2009</strong>.<br />
(vi) Mr. T.W. Hill resigned from the Board on 25th June 2008. He resigned as an executive on 31st July 2008, after 28 years service, and a severance payment in this<br />
regard amounting to €2,160,000 for 2008 is included in the summary of remuneration on page 53.<br />
(vii) Mr. W.I. O’Mahony retired as <strong>CRH</strong> Chief Executive on 31st December 2008 but remains on the <strong>CRH</strong> Board in a non-executive capacity.<br />
(viii) Mr. M.S. Towe became a Director on 31st July 2008.<br />
(ix) Mr. J.W. Kennedy became a Director on 24th June <strong>2009</strong>.<br />
Total<br />
2008
Pension entitlements – defined benefit<br />
Increase in<br />
accrued<br />
personal<br />
pension<br />
during <strong>2009</strong><br />
(i)<br />
Transfer value<br />
of increase in<br />
dependants’<br />
pension<br />
(i)<br />
Total accrued<br />
personal<br />
pension at<br />
year-end<br />
(ii)<br />
€000 €000 €000<br />
Executive Directors<br />
M. Lee - 967 284<br />
A. Manifold 7 105 273<br />
(i) As noted on page 52, the pensions of Mr. Lee and Mr. Manifold have been capped in line with the provisions of the Finance Act 2006. However, dependants’<br />
pensions continue to accrue resulting in Greenbury transfer values which have been calculated on the basis of actuarial advice. These amounts do not represent<br />
sums paid out or due, but are the amounts that the pension scheme would transfer to another pension scheme in relation to benefits accrued in <strong>2009</strong> in the event<br />
of Mr. Lee or Mr. Manifold leaving service.<br />
(ii) The accrued pensions shown in respect of Mr. Lee and Mr. Manifold are those which would be payable annually from normal retirement date.<br />
Pension entitlements – defined contribution<br />
The accumulated liabilities related to the unfunded Supplemental Executive Retirement Plans for Mr. G.A. Culpepper and Mr. M.S. Towe are as follows:<br />
As at 31st<br />
<strong>2009</strong><br />
As at 31st<br />
December<br />
<strong>2009</strong> notional<br />
<strong>2009</strong> Translation December<br />
2008 contribution<br />
interest payments adjustment<br />
<strong>2009</strong><br />
€000 €000 €000<br />
(iii)<br />
€000 €000 €000<br />
Executive Directors<br />
G.A. Culpepper 226 109 13 - (11) 337<br />
M.S. Towe 752 152 42 - (32) 914<br />
(iii) Notional interest, which is calculated based on the average bid yields of United States Treasury fixed-coupon securities with remaining terms to maturity of<br />
approximately 20 years, plus 1.5%, is credited to the above plans.<br />
Deferred Shares (iv)<br />
Number<br />
at 31st<br />
December<br />
2008<br />
Awards of<br />
Deferred<br />
Shares<br />
during <strong>2009</strong><br />
New Shares<br />
allotted under the<br />
Scrip Dividend<br />
Scheme<br />
during <strong>2009</strong><br />
New Shares<br />
taken up<br />
in 2 for 7<br />
Rights Issue in<br />
<strong>2009</strong><br />
Released<br />
during <strong>2009</strong><br />
(v)<br />
Number at<br />
31st December<br />
<strong>2009</strong> Release date<br />
Executive Directors<br />
M. Lee 6,033 - 238 1,723 - 7,994 March 2010<br />
7,644 - 301 2,184 - 10,129 March 2011<br />
13,677 - 539 3,907 - 18,123<br />
W.I. O’Mahony 13,873 - - - 13,873 -<br />
17,070 - - - 17,070 -<br />
30,943 - - - 30,943 -<br />
(iv) Under the executive Directors’ incentive plan, up to one-third of the bonus in each year is payable in <strong>CRH</strong> shares and the entitlement to beneficial ownership of<br />
the shares is deferred for a period of three years, with the individual not becoming beneficially entitled to the shares in the event of departure from the Group in<br />
certain circumstances during that time period.<br />
(v) Following his retirement as an executive Director, Mr. O’Mahony’s awards were released to him on 18th March <strong>2009</strong>.<br />
<strong>CRH</strong> 55
<strong>Report</strong> on Directors’ Remuneration continued<br />
Directors’ awards under the Performance Share Plan (i)<br />
56 <strong>CRH</strong><br />
31st December<br />
2008<br />
(ii)<br />
Granted in<br />
<strong>2009</strong><br />
Released in<br />
<strong>2009</strong><br />
(iii)<br />
Lapsed in<br />
<strong>2009</strong><br />
(iii)<br />
31st December<br />
<strong>2009</strong><br />
G.A. Culpepper (v) 11,090 - 8,316 2,774 -<br />
Performance<br />
period<br />
Release<br />
date<br />
Market<br />
price in euro<br />
on award<br />
(iv)<br />
9,981 - - - 9,981 01/01/07 – 31/12/09 March 2010 33.55<br />
12,199 - - - 12,199 01/01/08 – 31/12/10 March 2011 23.45<br />
- 47,500 - - 47,500 01/01/09 – 31/12/11 March 2012 17.00<br />
33,270 47,500 8,316 2,774 69,680<br />
M. Lee 22,180 - 16,632 5,548 -<br />
19,962 - - - 19,962 01/01/07 – 31/12/09 March 2010 33.55<br />
27,725 - - - 27,725 01/01/08 – 31/12/10 March 2011 23.45<br />
- 70,000 - - 70,000 01/01/09 – 31/12/11 March 2012 17.00<br />
69,867 70,000 16,632 5,548 117,687<br />
A. Manifold (v) 9,981 - 7,484 2,497 -<br />
16,635 - - - 16,635 01/01/07 – 31/12/09 March 2010 33.55<br />
27,725 - - - 27,725 01/01/08 – 31/12/10 March 2011 23.45<br />
- 47,500 - - 47,500 01/01/09 – 31/12/11 March 2012 17.00<br />
54,341 47,500 7,484 2,497 91,860<br />
W.I. O’Mahony 66,542 - 49,899 16,643 -<br />
M.S. Towe 24,953 - 18,712 6,241 -<br />
18,853 - - - 18,853 01/01/07 – 31/12/09 March 2010 33.55<br />
23,289 - - - 23,289 01/01/08 – 31/12/10 March 2011 23.45<br />
- 76,000 - - 76,000 01/01/09 – 31/12/11 March 2012 17.00<br />
67,095 76,000 18,712 6,241 118,142<br />
(i) Performance Share Plan This is a long-term share incentive plan under which share awards are granted in the form of a provisional allocation of shares for which<br />
no exercise price is payable. The shares scheduled for release in March 2010, March 2011 and March 2012 will be allocated to the extent that the relative TSR<br />
performance conditions are achieved. The structure of the Performance Share Plan is set out on page 51.<br />
(ii) Restated for the bonus element of the 2 for 7 Rights Issue in <strong>2009</strong>.<br />
(iii) On 25th March <strong>2009</strong>, the Remuneration Committee determined that 74.99% of the 2006 award vested and that portion of the award was released to participants.<br />
The balance of the 2006 award lapsed.<br />
(iv) The Trustees of the <strong>CRH</strong> plc Employee Benefit Trust purchased Ordinary Shares at €24.82 per share on 21st June 2006 in respect of the 2006 award, and at<br />
€33.55 per share on 11th April 2007 in respect of part of the 2007 award. No shares were purchased in respect of the 2008 award. No dividends are payable on<br />
these shares until such time as they are released to plan participants.<br />
(v) Mr. G.A. Culpepper and Mr. A. Manifold became Directors on 1st January <strong>2009</strong>. The opening balances above relate to the position at date of appointment<br />
restated for the bonus element of the <strong>2009</strong> Rights Issue.
Directors’ interests<br />
The Company’s Register of Directors’ Interests contains full details of Directors’ shareholdings and options to subscribe for shares.<br />
Directors’ share options<br />
Details of movements on outstanding options and those exercised during the year are set out in the table below:<br />
31st December<br />
2008*<br />
Granted in<br />
<strong>2009</strong><br />
Lapsed in<br />
<strong>2009</strong><br />
Exercised in 31st December<br />
<strong>2009</strong><br />
<strong>2009</strong><br />
Weighted<br />
average option<br />
price at<br />
31st December<br />
<strong>2009</strong><br />
Options exercised during <strong>2009</strong><br />
Weighted<br />
average<br />
exercised<br />
price<br />
Weighted<br />
average<br />
market price<br />
at date of<br />
exercise<br />
€ € €<br />
G.A. Culpepper** 42,611 - - 42,611 - (a) - 15.81 17.80<br />
30,437 - - 12,175 18,262 (b) 16.24 13.22 15.61<br />
113,673 35,000 - - 148,673 (c) 20.29 - -<br />
72,085 - - - 72,085 (d) 14.95 - -<br />
M. Lee 3,580 - - - 3,580 (b) 15.56 - -<br />
238,435 80,000 - - 318,435 (c) 19.32 - -<br />
138,625 - - - 138,625 (d) 14.86 - -<br />
1,752 - - - 1,752 (e) 18.39 - -<br />
A. Manifold** 18,262 - - 18,262 - (b) - 15.56 18.17<br />
116,445 50,000 - - 166,445 (c) 21.97 - -<br />
48,796 - - - 48,796 (d) 14.65 - -<br />
1,752 - - - 1,752 (e) 18.39 - -<br />
W.I. O’Mahony 164,357 - - 42,611 121,746 (a) 15.56 13.22 16.30<br />
146,095 - - 85,222 60,873 (b) 15.56 13.22 16.30<br />
576,680 - - - 576,680 (c) 18.31 - -<br />
277,250 - - - 277,250 (d) 16.99 - -<br />
M.S. Towe 60,873 - - 60,873 - (a) - 16.24 19.38<br />
60,873 - - 60,873 - (b) - 16.24 19.38<br />
243,981 - - - 243,981 (c) 20.26 - -<br />
155,260 - - - 155,260 (d) 14.80 - -<br />
2,511,822 165,000 - 322,627 2,354,195<br />
* The opening balances above and in the following table have been re-stated for the bonus element of the 2 for 7 Rights Issue in <strong>2009</strong>.<br />
** Mr. G.A. Culpepper and Mr. A. Manifold became Directors on 1st January <strong>2009</strong>. The opening balances above and in the following table relate to the position at date<br />
of appointment.<br />
<strong>CRH</strong> 57
<strong>Report</strong> on Directors’ Remuneration continued<br />
Options by Price<br />
€<br />
58 <strong>CRH</strong><br />
31st December<br />
2008*<br />
Granted in<br />
<strong>2009</strong><br />
Lapsed in<br />
<strong>2009</strong><br />
Exercised in<br />
<strong>2009</strong><br />
31st December<br />
<strong>2009</strong><br />
13.2155 48,698 - - 48,698 - (a)<br />
13.2155 97,397 - - 97,397 - (b)<br />
Earliest<br />
exercise date Expiry date<br />
15.5646 121,746 - - - 121,746 (a) March 2010 April 2010<br />
15.5646 82,715 - - 18,262 64,453 (b) March 2010 April 2010<br />
16.2381 97,397 - - 97,397 - (a)<br />
16.2381 79,135 - - 60,873 18,262 (b) March 2010 April 2010<br />
16.4830 166,350 - - - 166,350 (c) March 2010 April 2011<br />
16.4830 239,544 - - - 239,544 (d) March 2010 April 2011<br />
17.7454 138,625 - - - 138,625 (c) March 2010 April 2012<br />
17.7454 191,857 - - - 191,857 (d) March 2010 April 2012<br />
11.8573 110,900 - - - 110,900 (c) March 2010 April 2013<br />
11.8573 60,995 - - - 60,995 (d) March 2010 April 2013<br />
11.9565 44,360 - - - 44,360 (c) March 2010 April 2013<br />
11.9565 72,085 - - - 72,085 (d) March 2010 April 2013<br />
15.0674 66,540 - - - 66,540 (c) March 2010 April 2014<br />
15.0674 55,450 - - - 55,450 (d) April 2014<br />
15.0854 44,360 - - - 44,360 (c) March 2010 April 2014<br />
15.0854 72,085 - - - 72,085 (d) April 2014<br />
18.7463 72,085 - - - 72,085 (c) March 2010 April 2015<br />
18.8545 44,360 - - - 44,360 (c) March 2010 April 2015<br />
26.1493 108,128 - - - 108,128 (c) April 2016<br />
22.3892 221,800 - - - 221,800 (c) June 2016<br />
29.4855 66,540 - - - 66,540 (c) April 2017<br />
29.8643 58,223 - - - 58,223 (c) April 2017<br />
21.5235 146,943 - - - 146,943 (c) April 2018<br />
16.5800 - 130,000 - - 130,000 (c) April 2019<br />
17.3000 - 35,000 - - 35,000 (c) April 2019<br />
18.3946 3,504 - - - 3,504 (e) July 2013 December 2013<br />
2,511,822 165,000 - 322,627 2,354,195<br />
The market price of the Company’s shares at 31st December <strong>2009</strong> was €19.01 and the range during <strong>2009</strong> was €12.55 to €20.70.<br />
(a) Granted under the 1990 share option scheme, these options are only exercisable when earnings per share (EPS) growth exceeds the growth of the Irish<br />
Consumer Price Index over a period of at least three years subsequent to the granting of the options.<br />
(b) Granted under the 1990 share option scheme, these options are only exercisable if, over a period of at least five years subsequent to the granting of the options,<br />
the growth in EPS would place the Company in the top 25% of the companies listed in the FTSE 100 Stock Exchange Equity Index.<br />
(c) Granted under the 2000 share option scheme, these options are only exercisable when EPS growth exceeds the growth of the Irish Consumer Price Index by 5%<br />
compounded over a period of at least three years subsequent to the granting of the options.<br />
(d) Granted under the 2000 share option scheme, these options are only exercisable if, over a period of at least five years subsequent to the granting of the options,<br />
the growth in EPS exceeds the growth of the Irish Consumer Price Index by 10% compounded and places the Company in the top 25% of EPS performance of<br />
a peer group of international building materials and other manufacturing companies. If below the 75th percentile, these options are not exercisable.<br />
(e) Granted under the 2000 savings-related share option scheme.
Directors’ Interests in Share Capital at 31st December <strong>2009</strong><br />
The interests of the Directors and the Secretary in the shares of the Company as<br />
at 31st December <strong>2009</strong>, which are beneficial unless otherwise indicated, are<br />
shown below. The Directors and the Secretary have no beneficial interests in any<br />
of the Group’s subsidiary, joint venture or associated undertakings.<br />
Ordinary Shares 31st December<br />
<strong>2009</strong><br />
31st December<br />
2008<br />
Directors<br />
G.A. Culpepper 32,180 19,170 *<br />
W.P. Egan 16,427 15,000<br />
- Non-beneficial 12,000 12,000<br />
U-H. Felcht 1,285 1,000<br />
N. Hartery 1,285 1,000<br />
J.M. de Jong 13,502 10,190<br />
J.W. Kennedy 1,009 * -<br />
M. Lee 323,027 ** 258,246 **<br />
K. McGowan 21,344 16,167<br />
A. Manifold 11,790 5,742 *<br />
T.V. Neill 89,844 69,881<br />
D.N. O’Connor 15,040 11,478<br />
J.M.C. O’Connor 2,763 2,131<br />
W.I. O’Mahony 1,089,431 827,821 **<br />
M.S. Towe 34,420 18,857<br />
Secretary<br />
N. Colgan 10,527 10,434 *<br />
1,675,874 1,279,117<br />
There were no transactions in the above Directors’ and Secretary’s interests<br />
between 31st December <strong>2009</strong> and 1st March 2010.<br />
Of the above holdings, the following are held in the form of American Depositary<br />
Receipts (ADRs):<br />
31st December<br />
<strong>2009</strong><br />
31st December<br />
2008<br />
G.A. Culpepper 179 179 *<br />
W.P. Egan 10,000 10,000<br />
- Non-beneficial 12,000 12,000<br />
M.S. Towe 3,397 3,397<br />
* Holding as at date of appointment.<br />
** Excludes awards of Deferred Shares, details of which are shown on page 55.<br />
<strong>CRH</strong> 59
60 <strong>CRH</strong><br />
Statement of Directors’ Responsibilities<br />
in respect of the financial statements<br />
Company law in the Republic of Ireland requires the Directors to prepare financial<br />
statements for each financial year which give a true and fair view of the state of<br />
affairs of the Parent Company and of the Group and of the profit or loss of the<br />
Group for that period.<br />
In preparing the Consolidated Financial Statements, the Directors are required to:<br />
# select suitable accounting policies and then apply them consistently;<br />
# make judgements and estimates that are reasonable and prudent;<br />
# comply with applicable International Financial <strong>Report</strong>ing Standards as adopted<br />
by the European Union, subject to any material departures disclosed and<br />
explained in the financial statements; and<br />
# prepare the financial statements on the going concern basis unless it is<br />
inappropriate to presume that the Group will continue in business.<br />
The considerations set out above for the Group are also required to be addressed<br />
by the Directors in preparing the financial statements of the Parent Company<br />
(which are set out on pages 116 to 119), in respect of which the applicable<br />
accounting standards are those which are generally accepted in the Republic<br />
of Ireland.<br />
The Directors have elected to prepare the Parent Company’s Financial Statements<br />
in accordance with generally accepted accounting practice in Ireland (Irish GAAP)<br />
comprising the financial reporting standards issued by the Accounting Standards<br />
Board and published by the Institute of Chartered Accountants in Ireland, together<br />
with the Companies Acts, 1963 to <strong>2009</strong>.<br />
The Directors are responsible for keeping proper books of account which disclose<br />
with reasonable accuracy at any time the financial position of the Parent Company<br />
and which enable them to ensure that the Consolidated Financial Statements are<br />
prepared in accordance with applicable International Financial <strong>Report</strong>ing<br />
Standards as adopted by the European Union and comply with the provisions of<br />
the Companies Acts, 1963 to <strong>2009</strong> and Article 4 of the IAS Regulation. They are<br />
also responsible for safeguarding the assets of the Group and hence for taking<br />
reasonable steps for the prevention and detection of fraud and other<br />
irregularities.
Independent Auditors’ <strong>Report</strong><br />
to the members of <strong>CRH</strong> public limited company<br />
We have audited the Consolidated and Parent Company (“Company”) Financial<br />
Statements (the “financial statements”) of <strong>CRH</strong> plc for the year ended 31st<br />
December <strong>2009</strong> which comprise the Consolidated Income Statement, the<br />
Consolidated Statement of Comprehensive Income, the Consolidated and<br />
Company Balance Sheets, the Consolidated Statement of Changes in Equity, the<br />
Consolidated Statement of Cash Flows, the related notes 1 to 34 (Group) and the<br />
related notes 1 to 11 (Company). These financial statements have been prepared<br />
under the accounting policies set out therein.<br />
This <strong>Report</strong> is made solely to the Company’s members, as a body, in accordance<br />
with section 193 of the Companies Act, 1990. Our audit work has been<br />
undertaken so that we might state to the Company’s members those matters we<br />
are required to state to them in an auditors’ report and for no other purpose. To<br />
the fullest extent permitted by law, we do not accept or assume responsibility to<br />
anyone other than the Company and the Company’s members as a body, for our<br />
audit work, for this <strong>Report</strong>, or for the opinions we have formed.<br />
Respective responsibilities of Directors and Auditors<br />
The Directors are responsible for the preparation of the Consolidated Financial<br />
Statements in accordance with applicable Irish law and International Financial<br />
<strong>Report</strong>ing Standards (IFRSs) as adopted by the European Union, and for the<br />
preparation of the Company Financial Statements in accordance with applicable<br />
Irish law and Accounting Standards issued by the Accounting Standards Board<br />
and promulgated by the Institute of Chartered Accountants in Ireland (“Generally<br />
Accepted Accounting Practice in Ireland”) as set out in the Statement of Directors’<br />
Responsibilities.<br />
Our responsibility is to audit the financial statements in accordance with relevant<br />
legal and regulatory requirements and International Standards on Auditing (UK<br />
and Ireland).<br />
We report to you our opinion as to whether the financial statements give a true<br />
and fair view and have been properly prepared in accordance with the Companies<br />
Acts, 1963 to <strong>2009</strong> and whether, in addition, the Consolidated Financial<br />
Statements have been properly prepared in accordance with Article 4 of the IAS<br />
Regulation. We also report to you our opinion as to: whether proper books of<br />
account have been kept by the Company; whether, at the balance sheet date,<br />
there exists a financial situation which may require the convening of an<br />
extraordinary general meeting of the Company; and whether the information<br />
given in the Directors’ <strong>Report</strong> is consistent with the financial statements. In<br />
addition, we state whether we have obtained all the information and explanations<br />
necessary for the purposes of our audit and whether the Company Balance<br />
Sheet is in agreement with the books of account.<br />
We also report to you if, in our opinion, any information specified by law or the<br />
Listing Rules of the Irish Stock Exchange regarding Directors’ remuneration and<br />
other transactions is not disclosed and, where practicable, include such<br />
information in our <strong>Report</strong>.<br />
We are required by law to ascertain that the Company has produced a Corporate<br />
Governance Statement where this is prepared as a separate report and whether<br />
such statement contains the information required by law. We review whether the<br />
Corporate Governance Statement reflects the Company’s compliance with the<br />
nine provisions of the 2008 Financial <strong>Report</strong>ing Council’s Combined Code<br />
specified for our review by the Listing Rules of the Irish Stock Exchange, and we<br />
report if it does not. We are not required to consider whether the Board’s<br />
statements on internal control cover all risks and controls, or form an opinion on<br />
the effectiveness of the Group’s corporate governance procedures or its risk and<br />
control procedures.<br />
Where a separate Corporate Governance Statement is prepared, we also<br />
consider and report to you whether the information required under section 158<br />
(6D) (d) of the Companies Act, 1963 given in the Corporate Governance Statement<br />
is consistent with the financial statements.<br />
We read other information contained in the <strong>Annual</strong> <strong>Report</strong> and consider whether<br />
it is consistent with the audited financial statements. The other information<br />
comprises only the Directors’ <strong>Report</strong>, the Chairman’s Statement, Chief Executive’s<br />
Review, Operations Reviews, Finance Review and the Corporate Governance<br />
Statement. We consider the implications for our <strong>Report</strong> if we become aware of<br />
any apparent misstatements or material inconsistencies with the financial<br />
statements. Our responsibilities do not extend to any other information.<br />
Basis of Audit Opinion<br />
We conducted our audit in accordance with International Standards on Auditing<br />
(UK and Ireland) issued by the Auditing Practices Board. An audit includes<br />
examination, on a test basis, of evidence relevant to the amounts and disclosures<br />
in the financial statements. It also includes an assessment of the significant<br />
estimates and judgements made by the Directors in the preparation of the<br />
financial statements, and of whether the accounting policies are appropriate to<br />
the Group’s and Company’s circumstances, consistently applied and adequately<br />
disclosed.<br />
We planned and performed our audit so as to obtain all the information and<br />
explanations which we considered necessary in order to provide us with sufficient<br />
evidence to give reasonable assurance that the financial statements are free from<br />
material misstatement, whether caused by fraud or other irregularity or error. In<br />
forming our opinion we also evaluated the overall adequacy of the presentation of<br />
information in the financial statements.<br />
Opinion<br />
In our opinion the Consolidated Financial Statements give a true and fair view, in<br />
accordance with IFRSs as adopted by the European Union, of the state of affairs<br />
of the Group as at 31st December <strong>2009</strong> and of its profit for the year then ended<br />
and have been properly prepared in accordance with the Companies Acts, 1963<br />
to <strong>2009</strong> and Article 4 of the IAS Regulation.<br />
In our opinion the Company Financial Statements give a true and fair view, in<br />
accordance with Generally Accepted Accounting Practice in Ireland, of the state<br />
of affairs of the Company as at 31st December <strong>2009</strong> and have been properly<br />
prepared in accordance with the Companies Acts, 1963 to <strong>2009</strong>.<br />
We have obtained all the information and explanations we consider necessary for<br />
the purposes of our audit. In our opinion proper books of account have been kept<br />
by the Company. The Company Balance Sheet is in agreement with the books<br />
of account.<br />
In our opinion the information given in the Directors’ <strong>Report</strong> is consistent with the<br />
financial statements.<br />
In our opinion the information required under section 158 (6D) (d) of the Companies<br />
Act, 1963 given in the Corporate Governance Statement is consistent with the<br />
financial statements.<br />
In our opinion, the Company Balance Sheet does not disclose a financial situation<br />
which under section 40(1) of the Companies (Amendment) Act, 1983 would<br />
require the convening of an extraordinary general meeting of the Company.<br />
Ernst & Young<br />
Chartered Accountants and<br />
Registered Auditors<br />
Dublin<br />
1st March 2010<br />
<strong>CRH</strong> 61
62 <strong>CRH</strong><br />
Notes<br />
Consolidated Income Statement<br />
for the financial year ended 31st December <strong>2009</strong> <strong>2009</strong> 2008<br />
€m €m<br />
1 Revenue 17,373 20,887<br />
Cost of sales (12,510) (14,738)<br />
Gross profit 4,863 6,149<br />
3 Operating costs (3,908) (4,308)<br />
1, 4, 5 Group operating profit 955 1,841<br />
1,16 Profit on disposal of non-current assets 26 69<br />
Profit before finance costs 981 1,910<br />
8 Finance costs (419) (503)<br />
8 Finance revenue 122 160<br />
9 Group share of associates' profit after tax 48 61<br />
1 Profit before tax 732 1,628<br />
10 Income tax expense (134) (366)<br />
Group profit for the financial year 598 1,262<br />
Profit attributable to:<br />
Equity holders of the Company 592 1,248<br />
Minority interest 6 14<br />
Group profit for the financial year Group profit for the financial year 598 1,262<br />
12 Basic earnings per Ordinary Share 88.3c<br />
Restated<br />
210.2c<br />
Notes<br />
12 Diluted earnings per Ordinary Share 87.9c 209.0c<br />
All of the results relate to continuing operations.<br />
Consolidated Statement of Comprehensive Income<br />
for the financial year ended 31st December <strong>2009</strong><br />
<strong>2009</strong> 2008<br />
€m €m<br />
Group profit for the financial year 598 1,262<br />
Other comprehensive income<br />
Currency translation effects (96) (97)<br />
28 Actuarial loss on Group defined benefit pension obligations (67) (348)<br />
24 Gains/(losses) relating to cash flow hedges 15 (28)<br />
10 Tax on items recognised directly within other comprehensive income 18 71<br />
Net expense recognised directly within other comprehensive income (130) (402)<br />
Total comprehensive income for the financial year 468 860<br />
Attributable to:<br />
Equity holders of the Company 462 847<br />
Minority interest 6 13<br />
Total comprehensive income for the financial year 468 860<br />
K. McGowan, M. Lee, Directors
Consolidated Balance Sheet<br />
as at 31st December <strong>2009</strong> <strong>2009</strong> 2008<br />
€m €m<br />
Notes<br />
13<br />
ASSETS<br />
Non-current assets<br />
Property, plant and equipment 8,535 8,888<br />
14 Intangible assets 4,095 4,108<br />
15 Investments accounted for using the equity method 962 743<br />
15 Other financial assets 128 127<br />
24 Derivative financial instruments 244 416<br />
27 Deferred income tax assets 337 333<br />
Total non-current assets 14,301 14,615<br />
17<br />
Current assets<br />
Inventories 2,008 2,473<br />
18 Trade and other receivables 2,454 3,096<br />
Current income tax recoverable 77 -<br />
24 Derivative financial instruments 5 10<br />
22 Liquid investments 66 128<br />
22 Cash and cash equivalents 1,372 799<br />
Total current assets 5,982 6,506<br />
Total assets 20,283 21,121<br />
30<br />
EQUITY<br />
Capital and reserves attributable to the Company's equity holders<br />
Equity share capital 241 186<br />
30 Preference share capital 1 1<br />
30 Share premium account 3,778 2,448<br />
30 Treasury Shares and own shares (279) (378)<br />
Other reserves 128 87<br />
Foreign currency translation reserve (740) (644)<br />
Retained income 6,508 6,387<br />
9,637 8,087<br />
Minority interest 73 70<br />
Total equity 9,710 8,157<br />
LIABILITIES<br />
23<br />
Non-current liabilities<br />
Interest-bearing loans and borrowings 4,943 6,277<br />
24 Derivative financial instruments 78 84<br />
27 Deferred income tax liabilities 1,519 1,461<br />
19 Trade and other payables 155 137<br />
28 Retirement benefit obligations 454 414<br />
26 Provisions for liabilities 240 253<br />
29 Capital grants 12 14<br />
Total non-current liabilities 7,401 8,640<br />
19<br />
Current liabilities<br />
Trade and other payables 2,471 2,919<br />
Current income tax liabilities 192 186<br />
23 Interest-bearing loans and borrowings 381 1,021<br />
24 Derivative financial instruments 8 62<br />
26 Provisions for liabilities 120 136<br />
Total current liabilities 3,172 4,324<br />
Total liabilities 10,573 12,964<br />
Total equity and liabilities 20,283 21,121<br />
K. McGowan, M. Lee, Directors<br />
<strong>CRH</strong> 63
Notes<br />
64 <strong>CRH</strong><br />
Consolidated Statement of Changes in Equity<br />
for the financial year ended 31st December <strong>2009</strong><br />
Attributable to the equity holders of the Company<br />
Treasury<br />
Foreign<br />
Issued Share Shares/<br />
currency<br />
share premium own Other translation Retained Minority Total<br />
capital account shares reserves reserve income interest equity<br />
€m €m €m €m €m €m €m €m<br />
At 1st January <strong>2009</strong> 187 2,448 (378) 87 (644) 6,387 70 8,157<br />
Group profit for the financial year - - - - - 592 6 598<br />
Other comprehensive income - - - - (96) (34) - (130)<br />
Total comprehensive income 187 2,448 (378) 87 (740) 6,945 76 8,625<br />
30 Issue of share capital (net of expenses) 55 1,330 - - - - - 1,385<br />
7 Share-based payment expense<br />
- share option schemes - - - 18 - - - 18<br />
- Performance Share Plan (PSP) - - - 10 - - - 10<br />
Reclassification of Performance Share Plan expense - - (13) 13 - - - -<br />
10 Tax relating to share-based payment expense - - - - - 3 - 3<br />
Treasury/own shares re-issued - - 114 - - (114) - -<br />
30 Shares acquired by Employee Benefit Trust (own shares) - - (2) - - - - (2)<br />
30 Share option exercises - - - - - 60 - 60<br />
11 Dividends (including shares issued in lieu of dividends) - - - - - (386) (7) (393)<br />
32 Minority interest arising on acquisition - - - - - - 4 4<br />
At 31st December <strong>2009</strong> 242 3,778 (279) 128 (740) 6,508 73 9,710<br />
for the financial year ended 31st December 2008<br />
At 1st January 2008 187 2,420 (19) 70 (547) 5,843 66 8,020<br />
Group profit for the financial year - - - - - 1,248 14 1,262<br />
Other comprehensive income - - - - (97) (305) - (402)<br />
Minority interest profit attributable to associates - - - - - - (1) (1)<br />
Total comprehensive income 187 2,420 (19) 70 (644) 6,786 79 8,879<br />
30 Issue of share capital (net of expenses) - 28 - - - - - 28<br />
7 Share-based payment expense<br />
- share option schemes - - - 17 - - - 17<br />
- Performance Share Plan (PSP) - - 7 - - - - 7<br />
10 Tax relating to share-based payment expense - - - - - (13) - (13)<br />
30 Shares acquired by <strong>CRH</strong> plc (Treasury Shares) - - (411) - - - - (411)<br />
Treasury/own shares re-issued - - 48 - - (48) - -<br />
30 Shares acquired by Employee Benefit Trust (own shares) - - (3) - - - - (3)<br />
30 Share option exercises - - - - - 31 - 31<br />
11 Dividends (including shares issued in lieu of dividends) - - - - - (369) (5) (374)<br />
32 Minority interest arising on acquisition - - - - - - (4) (4)<br />
At 31st December 2008 187 2,448 (378) 87 (644) 6,387 70 8,157<br />
K. McGowan, M. Lee, Directors
Consolidated Statement of Cash Flows<br />
for the financial year ended 31st December <strong>2009</strong> <strong>2009</strong> 2008<br />
€m €m<br />
Notes<br />
Cash flows from operating activities<br />
Profit before tax 732 1,628<br />
Finance costs (net) 297 343<br />
Group share of associates' profit after tax (48) (61)<br />
Profit on disposal of non-current assets (26) (69)<br />
Group operating profit 955 1,841<br />
13 Depreciation charge (including impairments) 794 781<br />
7 Share-based payment expense 28 24<br />
14 Amortisation of intangible assets (including impairments) 54 43<br />
29 Amortisation of capital grants (2) (3)<br />
Other non-cash movements (37) (15)<br />
26 Net movement on provisions (41) (28)<br />
20 Decrease/(increase) in working capital 783 (57)<br />
Cash generated from operations 2,534 2,586<br />
Interest paid (including finance leases) (294) (371)<br />
Irish corporation tax paid (2) (18)<br />
Overseas corporation tax paid (102) (304)<br />
Net cash inflow from operating activities 2,136 1,893<br />
Cash flows from investing activities<br />
Inflows<br />
16 Proceeds from disposal of non-current assets 103 168<br />
Interest received 31 51<br />
29 Capital grants received - 4<br />
Dividends received from associates 38 42<br />
172 265<br />
Outflows<br />
13 Purchase of property, plant and equipment (532) (1,039)<br />
32 Acquisition of subsidiaries and joint ventures (174) (777)<br />
15 Investments in and advances to associates (235) (156)<br />
15 Advances to joint ventures and purchase of trade investments (9) (50)<br />
20 Increase in finance-related receivables (115) -<br />
20 Deferred and contingent acquisition consideration paid (37) (34)<br />
(1,102) (2,056)<br />
Net cash outflow from investing activities (930) (1,791)<br />
Cash flows from financing activities<br />
Inflows<br />
30 Proceeds from issue of shares (net) 1,237 6<br />
Proceeds from exercise of share options 60 31<br />
25 Decrease in liquid investments 65 175<br />
Increase in interest-bearing loans, borrowings and finance leases 757 1,382<br />
25 Net cash inflow arising from derivative financial instruments 16 -<br />
2,135 1,594<br />
Outflows<br />
Treasury/own shares purchased (2) (414)<br />
Repayment of interest-bearing loans, borrowings and finance leases (2,501) (1,024)<br />
25 Net cash outflow arising from derivative financial instruments - (100)<br />
11 Dividends paid to equity holders of the Company (238) (347)<br />
11 Dividends paid to minority interests (7) (5)<br />
(2,748) (1,890)<br />
Net cash outflow from financing activities (613) (296)<br />
Increase/(decrease) in cash and cash equivalents 593 (194)<br />
Reconciliation of opening to closing cash and cash equivalents<br />
25 Cash and cash equivalents at 1st January 799 1,006<br />
25 Translation adjustment (20) (13)<br />
Increase/(decrease) in cash and cash equivalents 593 (194)<br />
25 Cash and cash equivalents at 31st December 1,372 799<br />
A reconciliation of cash and cash equivalents to net debt is presented in note 25 to the financial statements.<br />
K. McGowan, M. Lee, Directors<br />
<strong>CRH</strong> 65
Accounting Policies<br />
Statement of compliance<br />
The Consolidated Financial Statements of <strong>CRH</strong> plc have been prepared in<br />
accordance with International Financial <strong>Report</strong>ing Standards (IFRS) as adopted by<br />
the European Union, which comprise standards and interpretations approved by<br />
the International Accounting Standards Board (IASB). IFRS as adopted by the<br />
European Union differ in certain respects from IFRS as issued by the IASB.<br />
However, the Consolidated Financial Statements for the financial years presented<br />
would be no different had IFRS as issued by the IASB been applied. References<br />
to IFRS hereafter should be construed as references to IFRS as adopted by the<br />
European Union.<br />
<strong>CRH</strong> plc, the parent company, is a publicly traded limited company incorporated<br />
and domiciled in the Republic of Ireland.<br />
Basis of preparation<br />
The Consolidated Financial Statements, which are presented in euro millions, have<br />
been prepared under the historical cost convention as modified by the measurement<br />
at fair value of share-based payments, retirement benefit obligations and certain<br />
financial assets and liabilities including derivative financial instruments.<br />
The accounting policies set out below have been applied consistently by all the<br />
Group’s subsidiaries, joint ventures and associates to all periods presented in<br />
these Consolidated Financial Statements.<br />
The preparation of financial statements in conformity with IFRS requires the use of<br />
certain critical accounting estimates. In addition, it requires management to<br />
exercise judgement in the process of applying the Company’s accounting policies.<br />
The areas involving a high degree of judgement or complexity, or areas where<br />
assumptions and estimates are significant to the Consolidated Financial<br />
Statements, relate primarily to accounting for defined benefit pension schemes,<br />
provisions for liabilities, property, plant and equipment and goodwill impairment.<br />
The financial year-ends of the Group’s subsidiaries, joint ventures and associates<br />
are co-terminous.<br />
Adoption of IFRS and International Financial <strong>Report</strong>ing Interpretations<br />
Committee (IFRIC) Interpretations<br />
IFRS and IFRIC Interpretations adopted during the financial year<br />
The Group has adopted the following new and amended IFRS and IFRIC<br />
interpretations in respect of the <strong>2009</strong> financial year-end:<br />
– IFRS 2 Share-based Payment – Vesting Conditions and Cancellations effective<br />
1st January <strong>2009</strong><br />
– IFRS 7 Financial Instruments: Disclosures effective 1st January <strong>2009</strong><br />
– IFRS 8 Operating Segments effective 1st January <strong>2009</strong><br />
– IAS 1 Presentation of Financial Statements effective 1st January <strong>2009</strong><br />
– IAS 23 Borrowing Costs (Revised) effective 1st January <strong>2009</strong><br />
– Amendments to IAS 32 and IAS 1 – Puttable Financial Instruments and<br />
Obligations Arising on Liquidation effective 1st January <strong>2009</strong><br />
– IFRIC 9 Remeasurement of Embedded Derivatives and IAS 39 Financial<br />
Instruments: Recognition and Measurement effective 1st July 2008<br />
– IFRIC 13 Customer Loyalty Programmes effective 1st July 2008<br />
– IFRIC 15 Agreements for the Construction of Real Estate effective 1st January<br />
<strong>2009</strong><br />
– IFRIC 16 Hedges of a Net Investment in a Foreign Operation effective 1st<br />
October 2008<br />
– IFRIC 18 Transfers of Assets from Customers effective for transfers on or after<br />
1st July <strong>2009</strong><br />
– Improvements to IFRSs (May 2008) with an effective date of 1st January <strong>2009</strong><br />
(i.e. all except for IFRS 5 amendment)<br />
IFRS 8 Operating Segments replaced IAS 14 Segment <strong>Report</strong>ing. Following a<br />
review of its requirements, the Group has concluded that the operating segments<br />
determined in accordance with IFRS 8 are the same as the business segments<br />
previously identified under IAS 14. IFRS 8 disclosures are shown in note 1,<br />
including the related revised comparative information.<br />
IAS 1 Presentation of Financial Statements has been revised and now requires the<br />
separation of owner and non-owner changes in equity and the presentation of a<br />
66 <strong>CRH</strong><br />
statement of changes in equity as a primary statement (the information contained<br />
in this statement had previously been provided by the Group in the notes to the<br />
Consolidated Financial Statements). The statement of changes in equity includes<br />
only details of transactions with owners, with non-owner changes in equity<br />
presented in a reconciliation of each component of equity. The revised standard<br />
also introduces the statement of comprehensive income; it presents all items of<br />
recognised income and expense, either in one single statement, or two linked<br />
statements. The Group has elected to present two statements, the Consolidated<br />
Income Statement and the Consolidated Statement of Comprehensive Income<br />
(similar to the Statement of Recognised Income and Expense previously provided<br />
except that taxation relating to equity items is now shown within the Consolidated<br />
Statement of Changes in Equity).<br />
IFRS 7 Financial Instruments – Disclosures (amendment) requires enhanced<br />
disclosures about fair value measurement and liquidity risk and disclosure of fair<br />
value measurements by level of a fair value measurement hierarchy. The changes<br />
required by the amended standard are purely disclosure-related.<br />
Adoption of the remaining standards and interpretations did not result in material<br />
changes in the Group’s financial statements.<br />
IFRS and IFRIC Interpretations which are not yet effective<br />
The Group has not applied the following standards and interpretations that have<br />
been issued but are not yet effective:<br />
– IFRS 2 Share-based Payment: Group Cash-settled Share-based Payment<br />
Transactions effective 1st January 2010<br />
– IFRS 3R Business Combinations (Revised) and IAS 27 Consolidated and<br />
Separate Financial Statements (Amended) effective 1st July <strong>2009</strong> including<br />
consequential amendments to IFRS 7, IAS 21, IAS 28, IAS 31 and IAS 39<br />
– IAS 39 Financial Instruments: Recognition and Measurement – Eligible Hedged<br />
Items effective 1st July <strong>2009</strong><br />
– IFRIC 17 Distributions of Non-cash Assets to Owners effective 1st July <strong>2009</strong><br />
– Improvements to IFRSs (April <strong>2009</strong>) – amendments applying in respect of 2010<br />
financial year-ends and thereafter<br />
The standards and interpretations addressed above will be applied for the<br />
purposes of the Group financial statements with effect from the dates listed.<br />
IFRS 3R Business Combinations, while it continues to apply the acquisition<br />
method to business combinations, introduces a number of changes to the<br />
accounting for business combinations that will impact the amount of goodwill<br />
recognised, the reported results in the period that an acquisition occurs and future<br />
reported results. These changes will include, but will not be limited to, the<br />
expensing of acquisition-related costs as incurred, the method of accounting for<br />
step acquisitions and the recognition and measurement of contingent consideration.<br />
IAS 27 (Amended) requires that a change in the ownership interest of a subsidiary<br />
(without loss of control) is accounted for as an equity transaction. The Group will<br />
apply IFRS 3R prospectively to all business combinations from 1st January 2010.<br />
The application of the other standards and interpretations is not envisaged to have<br />
any material impact on the Group financial statements.<br />
Basis of consolidation<br />
The Consolidated Financial Statements include the financial statements of the<br />
Parent Company and all subsidiaries, joint ventures and associates, drawn up to<br />
31st December each year.<br />
Subsidiaries<br />
The financial statements of subsidiaries are included in the Consolidated Financial<br />
Statements from the date on which control over the operating and financial<br />
decisions is obtained and cease to be consolidated from the date on which control<br />
is transferred out of the Group. Control exists when the Group has the power,<br />
directly or indirectly, to govern the financial and operating policies of an entity so<br />
as to obtain economic benefits from its activities. The existence and effect of<br />
potential voting rights that are currently exercisable or convertible are considered<br />
in determining the existence or otherwise of control.<br />
Joint ventures<br />
In line with IAS 31 Interests in Joint Ventures, the Group’s share of results and net<br />
assets of joint ventures (jointly controlled entities), which are entities in which the<br />
Group holds an interest on a long-term basis and which are jointly controlled by
the Group and one or more other venturers under a contractual arrangement, are<br />
accounted for on the basis of proportionate consolidation from the date on which<br />
the contractual agreements stipulating joint control are finalised and are<br />
derecognised when joint control ceases. The Group combines its share of the joint<br />
ventures’ individual income and expenses, assets and liabilities and cash flows on<br />
a line-by-line basis with similar items in the Consolidated Financial Statements.<br />
Loans to joint ventures are classified as loans and receivables within financial<br />
assets and are recorded at amortised cost.<br />
Associates<br />
Entities other than subsidiaries and joint ventures in which the Group has a<br />
participating interest, and over whose operating and financial policies the Group is<br />
in a position to exercise significant influence, are accounted for as associates<br />
using the equity method and are included in the Consolidated Financial Statements<br />
from the date on which significant influence is deemed to arise until the date on<br />
which such influence ceases to exist. If the Group’s share of losses exceeds the<br />
carrying amount of an associate, the carrying amount is reduced to nil and<br />
recognition of further losses is discontinued except to the extent that the Group<br />
has incurred obligations in respect of the associate.<br />
Equity method<br />
Under the equity method, which is used in respect of accounting for the Group’s<br />
investments in associates, the Consolidated Income Statement reflects the<br />
Group’s share of profit after tax of the related associates. Investments in associates<br />
are carried in the Consolidated Balance Sheet at cost adjusted in respect of postacquisition<br />
changes in the Group’s share of net assets, less any impairment in<br />
value. Goodwill relating to the associate is included in the carrying amount of the<br />
investment and is neither amortised nor individually tested for impairment. Where<br />
indicators of impairment arise in accordance with the requirements of IAS 39<br />
Financial Instruments: Recognition and Measurement, the carrying amount of the<br />
investment is tested for impairment by comparing its recoverable amount with its<br />
carrying amount.<br />
Minority interests<br />
Minority interests represent the portion of profit or loss and net assets not held by<br />
the Group and are presented separately in the Consolidated Income Statement<br />
and within equity in the Consolidated Balance Sheet, distinguished from Parent<br />
Company shareholders’ equity. Acquisitions of minority interests are accounted for<br />
using the parent entity extension method whereby the difference between the<br />
consideration and the book value of the share of net assets acquired is recognised<br />
in goodwill.<br />
Transactions eliminated on consolidation<br />
Intra-group balances and transactions, income and expenses, and any unrealised<br />
gains or losses arising from such transactions, are eliminated in preparing the<br />
Consolidated Financial Statements. Unrealised gains arising from transactions<br />
with joint ventures and associates are eliminated to the extent of the Group’s<br />
interest in the entity. Unrealised losses are eliminated in the same manner as<br />
unrealised gains, but only to the extent that there is no evidence of impairment in<br />
the Group’s interest in the entity.<br />
Revenue recognition<br />
Revenue represents the value of goods and services supplied to external<br />
customers and excludes intercompany sales, trade discounts and value added<br />
tax/sales tax. Other than in the case of construction contracts, revenue is<br />
recognised to the extent that it is subject to reliable measurement, that it is<br />
probable that economic benefits will flow to the Group and that the significant risks<br />
and rewards of ownership have passed to the buyer, usually on delivery of the<br />
goods.<br />
Construction contracts<br />
Revenue on construction contracts is recognised in accordance with the<br />
percentage-of-completion method with the completion percentage being<br />
computed generally by reference to the proportion that contract costs incurred at<br />
the balance sheet date bear to the total estimated cost of the contract. Contract<br />
costs are recognised as incurred. When the outcome of a construction contract<br />
cannot be estimated reliably, contract revenue is recognised only to the extent of<br />
contract costs incurred that are likely to be recoverable. When the outcome of a<br />
construction contract can be estimated reliably and it is probable that the contract<br />
will be profitable, contract revenue is recognised over the period of the contract.<br />
When it is probable that total contract costs will exceed total contract revenue, the<br />
expected loss is recognised immediately as an expense. If circumstances arise<br />
that may change the original estimates of revenues, costs or extent of progress<br />
towards completion, estimates are revised. These revisions may result in increases<br />
or decreases in revenue or costs and are reflected in income in the period in which<br />
the circumstances that give rise to the revision became known by management.<br />
Segment reporting<br />
Operating segments are reported in a manner consistent with the internal<br />
organisational and management structure and the internal reporting information<br />
provided to the chief operating decision maker who is responsible for allocating<br />
resources and assessing performance of the operating segments. The Group has<br />
determined that it has six reportable operating segments based on its lines of<br />
business; materials, products and distribution in Europe and the Americas.<br />
Foreign currency translation<br />
Items included in the financial statements of each of the Group’s entities are<br />
measured using the currency of the primary economic environment in which the<br />
entity operates (“the functional currency”). The Consolidated Financial Statements<br />
are presented in euro, which is the presentation currency of the Group and the<br />
functional currency of the Parent Company.<br />
Transactions in foreign currencies are recorded at the rate ruling at the date of the<br />
transaction. Monetary assets and liabilities denominated in foreign currencies are<br />
retranslated at the rate of exchange ruling at the balance sheet date. All currency<br />
translation differences are taken to the Consolidated Income Statement with the<br />
exception of all monetary items that provide an effective hedge for a net investment<br />
in a foreign operation. These are recognised in other comprehensive income until<br />
the disposal of the net investment, at which time they are recognised in the income<br />
statement.<br />
Results and cash flows of subsidiaries, joint ventures and associates with noneuro<br />
functional currencies have been translated into euro at average exchange<br />
rates for the year, and the related balance sheets have been translated at the rates<br />
of exchange ruling at the balance sheet date. Adjustments arising on translation of<br />
the results of non-euro subsidiaries, joint ventures and associates at average<br />
rates, and on restatement of the opening net assets at closing rates, are dealt with<br />
in a separate translation reserve within equity, net of differences on related currency<br />
borrowings. All other translation differences are taken to the Consolidated Income<br />
Statement.<br />
On disposal of a foreign operation, accumulated currency translation differences<br />
are recognised in the Consolidated Income Statement as part of the overall gain<br />
or loss on disposal. Goodwill and fair value adjustments arising on acquisition of a<br />
foreign operation are regarded as assets and liabilities of the foreign operation, are<br />
expressed in the functional currency of the foreign operation, are recorded in euro<br />
at the exchange rate at the date of the transaction and are subsequently<br />
retranslated at the applicable closing rates.<br />
The principal exchange rates used for the translation of results, cash flows and<br />
balance sheets into euro were as follows:<br />
Average Year-end<br />
euro 1 = <strong>2009</strong> 2008 <strong>2009</strong> 2008<br />
US Dollar 1.3948 1.4708 1.4406 1.3917<br />
Pound Sterling 0.8909 0.7963 0.8881 0.9525<br />
Polish Zloty 4.3276 3.5121 4.1045 4.1535<br />
Ukrainian Hryvnya 11.2404 7.7046 11.4738 10.8410<br />
Swiss Franc 1.5100 1.5874 1.4836 1.4850<br />
Canadian Dollar 1.5850 1.5594 1.5128 1.6998<br />
Argentine Peso 5.2111 4.6443 5.4885 4.7924<br />
Israeli Shekel 5.4756 5.2556 5.5134 5.3163<br />
Turkish Lira 2.1631 1.9064 2.1547 2.1488<br />
Indian Rupee 67.4271 63.7652 66.9539 67.5553<br />
<strong>CRH</strong> 67
Accounting Policies continued<br />
Retirement benefit obligations<br />
Costs arising in respect of the Group’s defined contribution pension schemes are<br />
charged to the Consolidated Income Statement in the period in which they are<br />
incurred. The Group has no legal or constructive obligation to pay further<br />
contributions in the event that the fund does not hold sufficient assets to meet its<br />
benefit commitments.<br />
The liabilities and costs associated with the Group’s defined benefit pension<br />
schemes (both funded and unfunded) are assessed on the basis of the projected<br />
unit credit method by professionally qualified actuaries and are arrived at using<br />
actuarial assumptions based on market expectations at the balance sheet date.<br />
The discount rates employed in determining the present value of the schemes’<br />
liabilities are determined by reference to market yields at the balance sheet date<br />
on high-quality corporate bonds of a currency and term consistent with the<br />
currency and term of the associated post-employment benefit obligations.<br />
When the benefits of a defined benefit scheme are improved, the portion of the<br />
increased benefit relating to past service by employees is recognised as an<br />
expense in the Consolidated Income Statement on a straight-line basis over the<br />
average period until the benefits become vested. To the extent that the enhanced<br />
benefits vest immediately, the related expense is recognised immediately in the<br />
Consolidated Income Statement.<br />
The net surplus or deficit arising on the Group’s defined benefit pension schemes,<br />
together with the liabilities associated with the unfunded schemes, are shown<br />
either within non-current assets or non-current liabilities on the face of the<br />
Consolidated Balance Sheet. The deferred tax impact of pension scheme<br />
surpluses and deficits is disclosed separately within deferred tax assets or<br />
liabilities as appropriate. Actuarial gains and losses are recognised immediately in<br />
the Consolidated Statement of Comprehensive Income.<br />
The defined benefit pension asset or liability in the Consolidated Balance Sheet<br />
comprises the total for each plan of the present value of the defined benefit<br />
obligation less the fair value of plan assets out of which the obligations are to be<br />
settled directly. Plan assets are assets that are held by a long-term employee<br />
benefit fund or qualifying insurance policies. Fair value is based on market price<br />
information and in the case of published securities it is the published bid price.<br />
The value of any defined benefit asset is limited to the present value of any<br />
economic benefits available in the form of refunds from the plan and reductions<br />
in the future contributions to the plan.<br />
The Group’s obligation in respect of post-employment healthcare and life<br />
assurance benefits represents the amount of future benefit that employees have<br />
earned in return for service in the current and prior periods. The obligation is<br />
computed on the basis of the projected unit credit method and is discounted to<br />
present value using a discount rate equating to the market yield at the balance<br />
sheet date on high-quality corporate bonds of a currency and term consistent<br />
with the currency and estimated term of the post-employment obligations.<br />
Share-based payments<br />
The Group operates both Share Option Schemes and a Performance Share Plan.<br />
Its policy in relation to the granting of share options and the granting of awards<br />
under the Performance Share Plan together with the nature of the underlying<br />
market and non-market performance and other vesting conditions are addressed<br />
in the <strong>Report</strong> on Directors’ Remuneration on pages 51 and 52.<br />
Share options<br />
For equity-settled share-based payment transactions (i.e. the issuance of share<br />
options), the Group measures the services received and the corresponding<br />
increase in equity at fair value at the grant date using the trinomial model. Fair<br />
value is determined on the basis that the services to be rendered by employees<br />
as consideration for the granting of share options will be received over the vesting<br />
period, which is assessed as at the grant date. The share options granted by the<br />
Company are not subject to market-based vesting conditions.<br />
The cost of equity-settled transactions is recognised, together with a<br />
corresponding increase in equity, over the period in which the performance and/<br />
or service conditions are fulfilled. The cumulative expense recognised at each<br />
reporting date until the vesting date reflects the extent to which the vesting period<br />
has expired and the Group’s best estimate of the number of equity instruments<br />
that will ultimately vest. The income statement expense/credit for a period<br />
represents the movement in cumulative expense recognised at the beginning and<br />
end of that period. The cumulative charge to the Consolidated Income Statement<br />
68 <strong>CRH</strong><br />
is reversed only where the performance condition is not met or where an employee<br />
in receipt of share options leaves service prior to completion of the expected<br />
vesting period and those options forfeit in consequence.<br />
No expense is recognised for awards that do not ultimately vest, except for<br />
equity-settled transactions where vesting is conditional upon a non-vesting<br />
condition which is treated as vesting irrespective of whether or not it is satisfied,<br />
provided that all other performance and/or service conditions are satisfied.<br />
Where an equity-settled award is cancelled, it is treated as if it vested on the date<br />
of cancellation, and any expense not yet recognised for the award is recognised<br />
immediately. This includes any award where non-vesting conditions within the<br />
control of either the Company or the employee are not met. All cancellations of<br />
equity-settled transaction awards are treated equally.<br />
The proceeds received net of any directly attributable transaction costs are<br />
credited to share capital (nominal value) and share premium when the options are<br />
exercised.<br />
The dilutive effect of outstanding options is reflected as additional share dilution<br />
in the determination of diluted earnings per share.<br />
The measurement requirements of IFRS 2 have been implemented in respect of<br />
share options that were granted after 7th November 2002. The disclosure<br />
requirements of IFRS 2 have been applied in relation to all outstanding sharebased<br />
payments regardless of their grant date.<br />
To the extent that the Group receives a tax deduction relating to the services paid<br />
in shares, deferred tax in respect of share options is provided on the basis of the<br />
difference between the market price of the underlying equity as at the date of the<br />
financial statements and the exercise price of the option; where the amount of<br />
any tax deduction (or estimated future tax deduction) exceeds the amount of the<br />
related cumulative remuneration expense, the current or deferred tax associated<br />
with the excess is recognised directly in equity.<br />
The Group has no exposure in respect of cash-settled share-based payment<br />
transactions and share-based payment transactions with cash alternatives.<br />
Awards under the Performance Share Plan<br />
The fair value of shares awarded under the Performance Share Plan is determined<br />
using a Monte Carlo simulation technique and is expensed in the Consolidated<br />
Income Statement over the vesting period. The Performance Share Plan contains<br />
inter alia a Total Shareholder Return-based (and hence market-based) vesting<br />
condition, and accordingly, the fair value assigned to the related equity instruments<br />
on initial application of IFRS 2 is adjusted so as to reflect the anticipated likelihood<br />
as at the grant date of achieving the market-based vesting condition.<br />
Property, plant and equipment<br />
Property, plant and equipment are stated at historical cost less any accumulated<br />
depreciation and any accumulated impairments except for certain items that had<br />
been revalued to fair value prior to the date of transition to IFRS (1st January<br />
2004); these items are measured on the basis of deemed cost, being the revalued<br />
amount as at the date the revaluation was performed.<br />
Depreciation and depletion<br />
Depreciation is calculated to write off the book value of each item of property,<br />
plant and equipment over its useful economic life on a straight-line basis at the<br />
following rates:<br />
Land and buildings: The book value of mineral-bearing land, less an estimate of<br />
its residual value, is depleted over the period of the mineral extraction in the<br />
proportion which production for the year bears to the latest estimates of mineral<br />
reserves. Land other than mineral-bearing land is not depreciated. In general,<br />
buildings are depreciated at 2.5% per annum (p.a.).<br />
Plant and machinery: These are depreciated at rates ranging from 3.3% p.a. to<br />
20% p.a. depending on the type of asset.<br />
Transport: On average, transport equipment is depreciated at 20% p.a.<br />
The residual values and useful lives of property, plant and equipment are reviewed,<br />
and adjusted if appropriate, at each balance sheet date.<br />
Impairment of property, plant and equipment<br />
In accordance with IAS 36 Impairment of Assets, the carrying values of items of<br />
property, plant and equipment are reviewed for impairment at each reporting date<br />
and are subject to impairment testing when events or changes in circumstances
indicate that the carrying values may not be recoverable. Where the carrying<br />
values exceed the estimated recoverable amount (being the greater of fair value<br />
less costs to sell and value-in-use), the assets or cash-generating units are<br />
written-down to their recoverable amount. In assessing value-in-use, the<br />
estimated future cash flows are discounted to their present value using a pre-tax<br />
discount rate that reflects current market assessments of the time value of money<br />
and the risks specific to the asset for which the future cash flow estimates have<br />
not been adjusted. The estimates of future cash flows exclude cash inflows or<br />
outflows attributable to financing activities and income tax. For an asset that does<br />
not generate largely independent cash inflows, the recoverable amount is<br />
determined by reference to the cash-generating unit to which the asset belongs.<br />
Repair and maintenance expenditure<br />
Repair and maintenance expenditure is included in an asset’s carrying amount or<br />
recognised as a separate asset, as appropriate, only when it is probable that<br />
future economic benefits associated with the item will flow to the Group and the<br />
cost of the item can be measured reliably. All other repair and maintenance<br />
expenditure is charged to the Consolidated Income Statement during the financial<br />
period in which it is incurred.<br />
Borrowing costs re items of property, plant and equipment<br />
Borrowing costs incurred in the construction of major assets which take a<br />
substantial period of time to complete are capitalised in the financial period in<br />
which they are incurred.<br />
Business combinations<br />
The purchase method of accounting is employed in accounting for the acquisition<br />
of subsidiaries, joint ventures and associates by the Group.<br />
The cost of a business combination is measured as the aggregate of the fair<br />
values at the date of exchange of assets given, liabilities incurred or assumed and<br />
equity instruments issued, together with any directly attributable expenses.<br />
To the extent that settlement of all or any part of a business combination is<br />
deferred, the fair value of the deferred component is determined through<br />
discounting the amounts payable to their present value at the date of exchange.<br />
The discount component is unwound as an interest charge in the Consolidated<br />
Income Statement over the life of the obligation. Where a business combination<br />
agreement provides for an adjustment to the cost of the combination contingent<br />
on future events, the amount of the adjustment is included in the cost at the<br />
acquisition date if the adjustment is probable and can be reliably measured.<br />
Contingent consideration is included in the acquisition balance sheet on a<br />
discounted basis.<br />
The assets and liabilities (and contingent liabilities, if relevant) arising on business<br />
combination activity are measured at their fair values at the date of acquisition. In<br />
the case of a business combination which is completed in stages, the fair values<br />
of the identifiable assets, liabilities and contingent liabilities are determined at the<br />
date of each exchange transaction. When the initial accounting for a business<br />
combination is determined provisionally, any adjustments to the provisional values<br />
allocated to the identifiable assets and liabilities (and contingent liabilities, if<br />
relevant) are made within twelve months of the acquisition date.<br />
Minority interest is stated at the proportionate share of the fair values of the<br />
acquired assets and liabilities recognised; goodwill is not allocated to the minority<br />
interest. Subsequently, any losses applicable to the minority interest in excess of<br />
the minority interest are allocated against the interests of the parent.<br />
Goodwill<br />
Goodwill is the excess of the consideration paid over the fair value of the<br />
identifiable assets and liabilities (and contingent liabilities, if relevant) in a business<br />
combination and relates to the future economic benefits arising from assets<br />
which are not capable of being individually identified and separately recognised.<br />
Goodwill applicable to jointly controlled entities is accounted for on the basis of<br />
proportionate consolidation and is therefore included in the goodwill caption in<br />
the Consolidated Balance Sheet, net of any impairments assessed in accordance<br />
with the methodology discussed below. The carrying amount of goodwill in<br />
respect of associates is included in investments in associates (i.e. within financial<br />
assets) under the equity method in the Consolidated Balance Sheet; such<br />
goodwill is not subject to annual impairment testing in accordance with IAS 28.<br />
Where a subsidiary is disposed of or terminated through closure, the carrying<br />
value of any goodwill which arose on acquisition of that subsidiary, net of any<br />
impairments, is included in the determination of the net profit or loss on disposal/<br />
termination.<br />
To the extent that the Group’s interest in the net fair value of the identifiable assets<br />
and liabilities (and contingent liabilities, if relevant) acquired exceeds the cost of a<br />
business combination, the identification and measurement of the related assets<br />
and liabilities and contingent liabilities are revisited and the cost is reassessed<br />
with any remaining balance being recognised immediately in the Consolidated<br />
Income Statement.<br />
Goodwill acquired in a business combination is allocated, from the acquisition<br />
date, to the cash-generating units that are anticipated to benefit from the<br />
combination’s synergies. Following initial recognition, goodwill is measured at<br />
cost less any accumulated impairment losses. The cash-generating units<br />
represent the lowest level within the Group at which goodwill is monitored for<br />
internal management purposes and these units are not larger than the operating<br />
segments determined in accordance with IFRS 8 Operating Segments. Goodwill<br />
is subject to impairment testing on an annual basis and at any time during the<br />
year if an indicator of impairment is considered to exist. In the year in which a<br />
business combination is effected, and where some or all of the goodwill allocated<br />
to a particular cash-generating unit arose in respect of that combination, the<br />
cash-generating unit is tested for impairment prior to the end of the relevant<br />
annual period. Where the recoverable amount of the cash-generating unit is less<br />
than the carrying amount, an impairment loss is recognised. Impairment losses<br />
arising in respect of goodwill are not reversed once recognised.<br />
Intangible assets (other than goodwill) arising on business<br />
combinations<br />
An intangible asset is capitalised separately from goodwill as part of a business<br />
combination at cost (fair value at date of acquisition) to the extent that it is<br />
probable that the expected future economic benefits attributable to the asset will<br />
flow to the Group and that its cost can be measured reliably.<br />
Subsequent to initial recognition, intangible assets are carried at cost less any<br />
accumulated amortisation and any accumulated impairment losses. The carrying<br />
values of definite-lived intangible assets are reviewed for indicators of impairment<br />
at each reporting date and are subject to impairment testing when events or<br />
changes in circumstances indicate that the carrying values may not be<br />
recoverable.<br />
The amortisation of intangible assets is calculated to write-off the book value of<br />
definite-lived intangible assets over their useful lives on a straight-line basis on the<br />
assumption of zero residual value. In general, definite-lived intangible assets are<br />
amortised over periods ranging from one to ten years, depending on the nature<br />
of the intangible asset.<br />
Other financial assets<br />
All investments are initially recognised at the fair value of the consideration given<br />
plus any directly attributable transaction costs. Where equity investments are<br />
actively traded in organised financial markets, fair value is determined by reference<br />
to Stock Exchange quoted market bid prices at the close of business on the<br />
balance sheet date. Unquoted equity investments are recorded at historical cost<br />
and are included within financial assets in the Consolidated Balance Sheet given<br />
that it is impracticable to determine fair value in accordance with IAS 39. Where<br />
non-derivative financial assets meet the definition of “loans and receivables”<br />
under IAS 39 Financial Instruments: Recognition and Measurement, such<br />
balances are, following initial recognition, recorded at amortised cost using the<br />
effective interest method less any allowance for impairment. Gains and losses are<br />
recognised in profit or loss when the loans and receivables are derecognised or<br />
impaired as well as through the amortisation process.<br />
Leases<br />
Assets held under finance leases, which are leases where substantially all the<br />
risks and rewards of ownership of the asset have transferred to the Group, and<br />
hire purchase contracts, are capitalised in the Consolidated Balance Sheet and<br />
are depreciated over their useful lives with any impairment being recognised in<br />
accumulated depreciation. The asset is recorded at an amount equal to the lower<br />
of its fair value and the present value of the minimum lease payments at the<br />
inception of the finance lease. The capital elements of future obligations under<br />
leases and hire purchase contracts are included in liabilities in the Consolidated<br />
Balance Sheet and analysed between current and non-current amounts. The<br />
interest elements of the rental obligations are charged to the Consolidated<br />
<strong>CRH</strong> 69
Accounting Policies continued<br />
Income Statement over the periods of the relevant agreements and represent a<br />
constant proportion of the balance of capital repayments outstanding in line with<br />
the implicit interest rate methodology.<br />
Leases where the lessor retains substantially all the risks and rewards of ownership<br />
are classified as operating leases. Operating lease rentals are charged to the<br />
Consolidated Income Statement on a straight-line basis over the lease term.<br />
Inventories and construction contracts<br />
Inventories are stated at the lower of cost and net realisable value. Cost is based<br />
on the first-in, first-out principle (and weighted average, where appropriate) and<br />
includes all expenditure incurred in acquiring the inventories and bringing them to<br />
their present location and condition. Raw materials are valued on the basis of<br />
purchase cost on a first-in, first-out basis. In the case of finished goods and<br />
work-in-progress, cost includes direct materials, direct labour and attributable<br />
overheads based on normal operating capacity and excludes borrowing costs.<br />
Net realisable value is the estimated proceeds of sale less all further costs to<br />
completion, and less all costs to be incurred in marketing, selling and<br />
distribution.<br />
Amounts recoverable on construction contracts, which are included in receivables,<br />
are stated at the net sales value of the work done less amounts received as<br />
progress payments on account. Cumulative costs incurred, net of amounts<br />
transferred to cost of sales, after deducting foreseeable losses, provisions for<br />
contingencies and payments on account not matched with revenue, are included<br />
as construction contract balances in inventories. Cost includes all expenditure<br />
related directly to specific projects and an allocation of fixed and variable<br />
overheads incurred in the Group’s contract activities based on normal operating<br />
capacity.<br />
Trade and other receivables and payables<br />
Trade and other receivables and payables are stated at cost, which approximates<br />
fair value given the short-dated nature of these assets and liabilities.<br />
Trade receivables are carried at original invoice amount less an allowance for<br />
potentially uncollectible debts. Provision is made when there is objective evidence<br />
that the Group will not be in a position to collect the associated debts. Bad debts<br />
are written-off in the Consolidated Income Statement on identification.<br />
Cash and cash equivalents<br />
Cash and cash equivalents comprise cash balances held for the purposes of<br />
meeting short-term cash commitments and investments which are readily<br />
convertible to a known amount of cash and are subject to an insignificant risk of<br />
changes in value. Where investments are categorised as cash equivalents, the<br />
related balances have a maturity of three months or less from the date of<br />
acquisition. Bank overdrafts are included within current interest-bearing loans<br />
and borrowings in the Consolidated Balance Sheet. Where the overdrafts are<br />
repayable on demand and form an integral part of cash management, they are<br />
netted against cash and cash equivalents.<br />
Liquid investments<br />
Liquid investments comprise short-term deposits and current asset investments<br />
which are held as readily disposable stores of value and include investments in<br />
government gilts and commercial paper and deposits of less than one year in<br />
duration. The maturity of these investments falls outside the three months<br />
timeframe for classification as cash and cash equivalents under IAS 7 Statement<br />
of Cash Flows, and accordingly these investments are treated as financial assets<br />
and are categorised as either “held-for-trading” or “loans and receivables” in<br />
accordance with IAS 39. Where relevant, the fair value of liquid investments is<br />
determined by reference to the traded value of actively traded instruments.<br />
Derivative financial instruments and hedging practices<br />
In order to manage interest rate, foreign currency and commodity risks and to<br />
realise the desired currency profile of borrowings, the Group employs derivative<br />
financial instruments (principally interest rate swaps, currency swaps and forward<br />
foreign exchange contracts).<br />
At the inception of a derivative transaction, the Group documents the relationship<br />
between the hedged item and the hedging instrument together with its risk<br />
management objective and the strategy underlying the proposed transaction.<br />
The Group also documents its assessment, both at the inception of the hedging<br />
70 <strong>CRH</strong><br />
relationship and subsequently on an ongoing basis, of the effectiveness of the<br />
hedging instrument in offsetting movements in the fair values or cash flows of the<br />
hedged items.<br />
Derivative financial instruments are stated at fair value. Where derivatives do not<br />
fulfil the criteria for hedge accounting, they are classified as “held-for-trading” in<br />
accordance with IAS 39 and changes in fair values are reported in operating<br />
costs in the Consolidated Income Statement. The fair value of interest rate and<br />
currency swaps is the estimated amount the Group would pay or receive to<br />
terminate the swap at the balance sheet date taking into account interest and<br />
currency rates at that date and the creditworthiness of the swap counterparties.<br />
The fair value of forward exchange contracts is calculated by reference to forward<br />
exchange rates for contracts with similar maturity profiles and equates to the<br />
quoted market price at the balance sheet date (being the present value of the<br />
quoted forward price).<br />
Fair value and cash flow hedges<br />
The Group uses fair value hedges and cash flow hedges in its treasury activities.<br />
For the purposes of hedge accounting, hedges are classified either as fair value<br />
hedges (which entail hedging the exposure to movements in the fair value of a<br />
recognised asset or liability or an unrecognised firm commitment that could affect<br />
profit or loss) or cash flow hedges (which hedge exposure to fluctuations in future<br />
cash flows derived from a particular risk associated with a recognised asset or<br />
liability, or a highly probable forecast transaction that could affect profit or loss).<br />
Where the conditions for hedge accounting are satisfied and the hedging<br />
instrument concerned is classified as a fair value hedge, any gain or loss stemming<br />
from the re-measurement of the hedging instrument to fair value is reported in the<br />
Consolidated Income Statement. In addition, any gain or loss on the hedged item<br />
which is attributable to the hedged risk is adjusted against the carrying amount of<br />
the hedged item and reflected in the Consolidated Income Statement. Where the<br />
adjustment is to the carrying amount of a hedged interest-bearing financial<br />
instrument, the adjustment is amortised to the Consolidated Income Statement<br />
with the objective of achieving full amortisation by maturity.<br />
Where a derivative financial instrument is designated as a hedge of the variability<br />
in cash flows of a recognised asset or liability or a highly probable forecast<br />
transaction that could affect profit or loss, the effective part of any gain or loss on<br />
the derivative financial instrument is recognised as other comprehensive income<br />
with the ineffective portion being reported in the Consolidated Income Statement.<br />
The associated gains or losses that had previously been recognised as other<br />
comprehensive income are transferred to the Consolidated Income Statement<br />
contemporaneously with the materialisation of the hedged transaction. Any gain<br />
or loss arising in respect of changes in the time value of the derivative financial<br />
instrument is excluded from the measurement of hedge effectiveness and is<br />
recognised immediately in the Consolidated Income Statement.<br />
Hedge accounting is discontinued when the hedging instrument expires or is<br />
sold, terminated or exercised, or no longer qualifies for hedge accounting. At that<br />
point in time, any cumulative gain or loss on the hedging instrument recognised<br />
as other comprehensive income remains there until the forecast transaction<br />
occurs. If a hedged transaction is no longer anticipated to occur, the net<br />
cumulative gain or loss previously recognised as other comprehensive income is<br />
transferred to the Consolidated Income Statement in the period.<br />
Net investment hedges<br />
Where foreign currency borrowings provide a hedge against a net investment in<br />
a foreign operation, and the hedge is deemed to be effective, foreign exchange<br />
differences are taken directly to a foreign currency translation reserve. The<br />
ineffective portion of any gain or loss on the hedging instrument is recognised<br />
immediately in the Consolidated Income Statement. Cumulative gains and losses<br />
remain in equity until disposal of the net investment in the foreign operation at<br />
which point the related differences are transferred to the Consolidated Income<br />
Statement as part of the overall gain or loss on sale.<br />
Interest-bearing loans and borrowings<br />
All loans and borrowings are initially recorded at the fair value of the consideration<br />
received net of directly attributable transaction costs.<br />
Subsequent to initial recognition, current and non-current interest-bearing loans<br />
and borrowings are, in general, measured at amortised cost employing the<br />
effective interest methodology. Fixed rate term loans, which have been hedged to
floating rates (using interest rate swaps), are measured at amortised cost adjusted<br />
for changes in value attributable to the hedged risks arising from changes in<br />
underlying market interest rates. The computation of amortised cost includes any<br />
issue costs and any discount or premium materialising on settlement. Borrowings<br />
are classified as current liabilities unless the Group has an unconditional right to<br />
defer settlement of the liability for at least 12 months after the balance sheet<br />
date.<br />
Gains and losses are recognised in the Consolidated Income Statement through<br />
amortisation on the basis of the period of the loans and borrowings and/or on<br />
impairment and derecognition of the associated loans and borrowings.<br />
Borrowing costs arising on financial instruments are recognised as an expense in<br />
the period in which they are incurred (unless capitalised as part of the cost of<br />
property, plant and equipment).<br />
Provisions for liabilities<br />
A provision is recognised when the Group has a present obligation (either legal or<br />
constructive) as a result of a past event; it is probable that a transfer of economic<br />
benefits will be required to settle the obligation and a reliable estimate can be<br />
made of the amount of the obligation. Where the Group anticipates that a<br />
provision will be reimbursed, the reimbursement is recognised as a separate<br />
asset only when it is virtually certain that the reimbursement will arise. The<br />
expense relating to any provision is presented in the income statement net of any<br />
reimbursement. Provisions are measured at the present value of the expenditures<br />
expected to be required to settle the obligation. The increase in the provision due<br />
to passage of time is recognised as interest expense. Provisions arising on<br />
business combination activity are recognised only to the extent that they would<br />
have qualified for recognition in the financial statements of the acquiree prior to<br />
acquisition. Provisions are not recognised for future operating losses.<br />
Tax (current and deferred)<br />
Current tax represents the expected tax payable (or recoverable) on the taxable<br />
profit for the year using tax rates enacted or substantively enacted at the balance<br />
sheet date and taking into account any adjustments stemming from prior years.<br />
Any interest or penalties arising are included within current tax.<br />
Deferred tax is provided using the liability method on all relevant temporary<br />
differences at the balance sheet date between the tax bases of assets and<br />
liabilities and their carrying amounts for financial reporting purposes. Deferred tax<br />
assets and liabilities are not subject to discounting and are measured at the tax<br />
rates that are anticipated to apply in the period in which the asset is realised or<br />
the liability is settled based on tax rates and tax laws that have been enacted or<br />
substantively enacted at the balance sheet date.<br />
Deferred tax liabilities are recognised for all taxable temporary differences with the<br />
exception of the following:<br />
# where the deferred tax liability arises from the initial recognition of goodwill or<br />
of an asset or a liability in a transaction that is not a business combination and,<br />
at the time of the transaction, affects neither the accounting profit nor the<br />
taxable profit or loss; and<br />
# in respect of taxable temporary differences associated with investments in<br />
subsidiaries, associates and joint ventures, where the timing of reversal of the<br />
temporary differences can be controlled and it is probable that the temporary<br />
differences will not reverse in the foreseeable future.<br />
Deferred tax assets are recognised in respect of all deductible temporary<br />
differences, carry-forward of unused tax credits and unused tax losses, to the<br />
extent that it is probable that taxable profits will be available against which to<br />
offset these items. The following exceptions apply in this instance:<br />
# where the deferred tax asset arises from the initial recognition of an asset or a<br />
liability in a transaction that is not a business combination and affects neither<br />
the accounting profit nor the taxable profit or loss at the time of the transaction;<br />
and<br />
# where, in respect of deductible temporary differences associated with<br />
investments in subsidiaries, joint ventures and associates, a deferred tax asset<br />
is recognised only if it is probable that the deductible temporary difference will<br />
reverse in the foreseeable future and that sufficient taxable profits will be<br />
available against which the temporary difference can be utilised.<br />
The carrying amounts of deferred tax assets are subject to review at each balance<br />
sheet date and are reduced to the extent that future taxable profits are considered<br />
to be inadequate to allow all or part of any deferred tax asset to be utilised.<br />
Where items are accounted for outside of profit or loss, the related income tax is<br />
recognised either in other comprehensive income or directly in equity as<br />
appropriate.<br />
Government grants<br />
Capital grants are recognised at their fair value where there is reasonable<br />
assurance that the grant will be received and all attaching conditions have been<br />
complied with. When the grant relates to an expense item, it is recognised as<br />
income over the periods necessary to match the grant on a systematic basis to<br />
the costs that it is intended to compensate. Where the grant relates to an asset,<br />
the fair value is treated as a deferred credit and is released to the Consolidated<br />
Income Statement over the expected useful life of the relevant asset through<br />
equal annual instalments.<br />
Share capital<br />
Treasury Shares<br />
Own equity instruments (i.e. Ordinary Shares) acquired by the Parent Company<br />
are deducted from equity and presented on the face of the Consolidated Balance<br />
Sheet. No gain or loss is recognised in profit or loss on the purchase, sale, issue<br />
or cancellation of the Parent Company’s Ordinary Shares.<br />
Own shares<br />
Ordinary Shares purchased by the Employee Benefit Trust on behalf of the Parent<br />
Company under the terms of the Performance Share Plan are recorded as a<br />
deduction from equity on the face of the Consolidated Balance Sheet.<br />
Dividends<br />
Dividends on Ordinary Shares are recognised as a liability in the Consolidated<br />
Financial Statements in the period in which they are declared by the Parent<br />
Company.<br />
Emission rights<br />
Emission rights are accounted for such that a liability is recognised only in<br />
circumstances where emission rights have been exceeded from the perspective<br />
of the Group as a whole and the differential between actual and permitted<br />
emissions will have to be remedied through the purchase of the required additional<br />
rights at fair value; assets and liabilities arising in respect of under and overutilisation<br />
of emission credits respectively are accordingly netted against one<br />
another in the preparation of the Consolidated Financial Statements. To the<br />
extent that excess emission rights are disposed of during a financial period, the<br />
profit or loss materialising thereon is recognised immediately within operating<br />
profit in the Consolidated Income Statement.<br />
<strong>CRH</strong> 71
Notes on Financial Statements<br />
1. Segment Information<br />
<strong>CRH</strong> is a diversified international building materials group which manufactures and distributes a range of building materials products from the fundamentals of heavy<br />
materials and elements to construct the frame, through value-added products that complete the building envelope, to distribution channels which service construction<br />
fit-out and renewal. Based on these key strategic drivers across the value chain, the Group is organised into six business segments comprising Europe Materials<br />
(including activities in China and India), Europe Products, Europe Distribution, Americas Materials, Americas Products and Americas Distribution. No operating<br />
segments have been aggregated to form these segments.<br />
Materials businesses are predominantly engaged in the production and sale of a range of primary materials including cement, aggregates, readymixed concrete,<br />
asphalt/bitumen and agricultural and/or chemical lime.<br />
Products businesses are predominantly engaged in the production and sale of architectural and structural concrete products, clay products, insulation products,<br />
fabricated and tempered glass products, construction accessories and the provision of a wide range of inter-related products and services to the construction sector.<br />
Distribution businesses encompass builders merchanting activities and Do-It-Yourself (DIY) stores engaged in the marketing and sale of supplies to the construction<br />
sector and to the general public.<br />
The principal factors employed in the identification of the six segments reflected in this note include the Group’s organisational structure, the nature of the reporting<br />
lines to the Chief Operating Decision-Maker (as defined in IFRS 8 Operating Segments), the structure of internal reporting documentation such as management<br />
accounts and budgets, and the degree of homogeneity of products, services and geographical areas within each of the segments from which revenue is derived.<br />
The Chief Operating Decision-Maker monitors the operating results of segments separately in order to allocate resources between segments and to assess<br />
performance. Segment performance is predominantly evaluated based on operating profit. As performance is also evaluated using operating profit before depreciation<br />
and amortisation (EBITDA), supplemental information based on EBITDA is also provided below. Given that net finance costs and income tax are managed on a<br />
centralised basis, these items are not allocated between operating segments for the purposes of the information presented to the Chief Operating Decision-Maker<br />
and are accordingly omitted from the detailed segmental analysis below.<br />
Although IFRS 8 is being applied for the first time, there have been no changes to the basis of segmentation or to the basis of measurement of operating profit in<br />
compiling the consolidated financial statements in respect of the year ended 31st December <strong>2009</strong>. In addition, there are no asymmetrical allocations to reporting<br />
segments which would require disclosure.<br />
A. Operating segments disclosures - Consolidated Income Statement data<br />
72 <strong>CRH</strong><br />
Continuing operations - year ended 31st December<br />
Materials Products Distribution Total Group<br />
<strong>2009</strong> 2008 <strong>2009</strong> 2008 <strong>2009</strong> 2008 <strong>2009</strong> 2008<br />
€m €m €m €m €m €m €m €m<br />
Segment revenue<br />
Europe 2,749 3,696 3,002 3,686 3,633 3,812 9,384 11,194<br />
Americas 4,280 5,007 2,536 3,243 1,173 1,443 7,989 9,693<br />
7,029 8,703 5,538 6,929 4,806 5,255 17,373 20,887<br />
Group operating profit before depreciation and amortisation (EBITDA)<br />
Europe 434 806 283 392 204 258 921 1,456<br />
Americas 670 724 173 369 39 116 882 1,209<br />
1,104 1,530 456 761 243 374 1,803 2,665<br />
Depreciation and amortisation (including asset impairment charges)<br />
Europe 177 175 167 168 67 64 411 407<br />
Americas 263 262 150 131 24 24 437 417<br />
440 437 317 299 91 88 848 824<br />
Group operating profit (EBIT)<br />
Europe 257 631 116 224 137 194 510 1,049<br />
Americas 407 462 23 238 15 92 445 792<br />
664 1,093 139 462 152 286 955 1,841<br />
Profit on disposal of non-current assets (i) 26 69<br />
Finance costs (net) (297) (343)<br />
Group share of associates' profit after tax (ii) 48 61<br />
Profit before tax 732 1,628
1. Segment Information continued<br />
A. Operating segments disclosures - Consolidated Income Statement data continued<br />
Segment revenue includes €3,252 million (2008: €3,593 million) in respect of revenue applicable to construction contracts. Revenue derived through the supply of<br />
services and intersegment revenue is not material to the Group. The transfer pricing policy implemented by the Group between operating segments and across its<br />
constituent entities is described in greater detail in note 33. In addition, due to the nature of building materials, which exhibit a low value-to-weight ratio, the Group’s<br />
revenue streams include a low level of cross-border transactions.<br />
Asset impairment charges of €41 million (2008: €14 million) relate to Europe Materials €9 million (2008: €nil million), Europe Products €19 million (2008: €12 million)<br />
and Americas Products €13 million (2008: €2 million).<br />
Continuing operations - year ended 31st December<br />
Materials Products Distribution Total Group<br />
<strong>2009</strong> 2008 <strong>2009</strong> 2008 <strong>2009</strong> 2008 <strong>2009</strong> 2008<br />
€m €m €m €m €m €m €m €m<br />
(i) Profit on disposal of non-current assets<br />
Europe 4 16 1 15 5 15 10 46<br />
Americas 17 20 (1) 2 - 1 16 23<br />
21 36 - 17 5 16 26 69<br />
(ii) Group share of associates' profit after tax<br />
Europe 39 45 1 5 7 11 47 61<br />
Americas 1 - - - - - 1 -<br />
40 45 1 5 7 11 48 61<br />
B. Operating segments disclosures - Consolidated Balance Sheet<br />
Continuing operations - year ended 31st December<br />
Materials Products Distribution Total Group<br />
<strong>2009</strong> 2008 <strong>2009</strong> 2008 <strong>2009</strong> 2008 <strong>2009</strong> 2008<br />
€m €m €m €m €m €m €m €m<br />
Total assets<br />
Europe 4,224 4,319 2,879 3,191 1,991 2,174 9,094 9,684<br />
Americas 5,166 5,481 2,221 2,662 611 738 7,998 8,881<br />
9,390 9,800 5,100 5,853 2,602 2,912 17,092 18,565<br />
Reconciliation to total assets as reported in the Consolidated Balance Sheet<br />
Investments accounted for using the equity method 962 743<br />
Other financial assets 128 127<br />
Derivative financial instruments (current and non-current) 249 426<br />
Income tax assets (current and deferred) 414 333<br />
Liquid investments 66 128<br />
Cash and cash equivalents 1,372 799<br />
Total assets as reported in the Consolidated Balance Sheet 20,283 21,121<br />
Total liabilities<br />
Europe 954 966 802 759 457 465 2,213 2,190<br />
Americas 722 896 354 569 151 204 1,227 1,669<br />
1,676 1,862 1,156 1,328 608 669 3,440 3,859<br />
Reconciliation to total liabilities as reported in the Consolidated Balance Sheet<br />
Interest-bearing loans and borrowings (current and non-current) 5,324 7,298<br />
Derivative financial instruments (current and non-current) 86 146<br />
Income tax liabilities (current and deferred) 1,711 1,647<br />
Capital grants 12 14<br />
Total liabilities as reported in the Consolidated Balance Sheet 10,573 12,964<br />
<strong>CRH</strong> 73
1. Segment Information continued<br />
C. Operating segments disclosures - other items<br />
74 <strong>CRH</strong><br />
Continuing operations - year ended 31st December<br />
Materials Products Distribution Total Group<br />
<strong>2009</strong> 2008 <strong>2009</strong> 2008 <strong>2009</strong> 2008 <strong>2009</strong> 2008<br />
€m €m €m €m €m €m €m €m<br />
Additions to non-current assets<br />
Europe Property, plant and equipment (note 13) 260 429 51 106 42 70 353 605<br />
Financial assets (note 15) 235 1 - - 1 157 236 158<br />
Americas Property, plant and equipment (note 13) 125 304 51 121 3 9 179 434<br />
Financial assets (note 15) 8 48 - - - - 8 48<br />
628 782 102 227 46 236 776 1,245<br />
D. Entity-wide disclosures<br />
Section 1: Information about products and services<br />
The Group’s revenue from external customers in respect of its principal products and services is analysed in the disclosures above.<br />
Section 2: Information about geographical areas and customers<br />
<strong>CRH</strong> has a presence in 35 countries worldwide. The revenues from external customers and non-current assets (as defined in IFRS 8) attributable to the country of<br />
domicile and all foreign countries of operation are as follows; regions which exceed 10% of total external Group revenue have been highlighted separately on the basis<br />
of materiality.<br />
Year ended 31st December<br />
Revenues by destination<br />
As at 31st December<br />
Non-current assets<br />
<strong>2009</strong> 2008 <strong>2009</strong> 2008<br />
€m €m €m €m<br />
Country of domicile - Republic of Ireland 500 870 569 595<br />
Benelux (mainly Netherlands) 2,762 3,070 1,458 1,518<br />
Americas (mainly the United States) 7,997 9,702 6,200 6,527<br />
Other 6,114 7,245 5,493 5,226<br />
Group totals 17,373 20,887 13,720 13,866<br />
There are no material dependencies or concentrations on individual customers which would warrant disclosure under IFRS 8. The individual entities within the Group<br />
each have a large number of customers spread across various activities, end-uses and geographies.
2. Proportionate Consolidation of Joint Ventures<br />
The Group’s share of the income and expenses of its joint ventures for the years ended 31st December <strong>2009</strong> and 2008, the<br />
assets and liabilities as at 31st December <strong>2009</strong> and 2008 and future purchase commitments for property, plant and<br />
equipment, which are proportionately consolidated in the Consolidated Financial Statements where appropriate, are as<br />
follows:<br />
Impact on Consolidated Income Statement<br />
<strong>2009</strong> 2008<br />
€m €m<br />
Group share of:<br />
Revenue 1,095 1,172<br />
Cost of sales (768) (806)<br />
Gross profit 327 366<br />
Operating costs (233) (229)<br />
Operating profit 94 137<br />
Profit on disposal of non-current assets 1 1<br />
Profit before finance costs 95 138<br />
Finance costs (net) (7) (13)<br />
Profit before tax 88 125<br />
Income tax expense (19) (26)<br />
Group profit for the financial year 69 99<br />
Depreciation charge for year 55 50<br />
Impact on Consolidated Balance Sheet<br />
Group share of:<br />
Non-current assets 1,319 1,333<br />
Current assets 395 423<br />
Total assets 1,714 1,756<br />
Total equity 1,158 1,143<br />
Non-current liabilities 330 333<br />
Current liabilities 226 280<br />
Total liabilities 556 613<br />
Total equity and liabilities 1,714 1,756<br />
Net debt included above 114 153<br />
The Group’s share of net debt in joint ventures is non-recourse to the Group.<br />
Future purchase commitments for property, plant and equipment<br />
Contracted for but not provided in the financial statements 15 30<br />
Authorised by the Directors but not contracted for 120 122<br />
A listing of the principal joint ventures is contained on page 129.<br />
<strong>CRH</strong> 75
3. Operating Costs<br />
76 <strong>CRH</strong><br />
<strong>2009</strong> 2008<br />
€m €m<br />
Selling and distribution costs 2,410 2,753<br />
Administrative expenses 1,392 1,486<br />
Other operating expenses 112 82<br />
Other operating income (6) (13)<br />
Total 3,908 4,308<br />
Other operating expenses and income comprise the following charges/(credits):<br />
Other operating expenses<br />
Share-based payment expense (note 7) 28 24<br />
Amortisation of intangible assets (note 14) 43 43<br />
Impairment of intangible assets (note 14) 11 -<br />
Impairment of property, plant and equipment (note 13) 30 14<br />
Mark-to-market of undesignated derivative financial instruments (held-for-trading) - 1<br />
Total 112 82<br />
Other operating income<br />
Excess of fair value of identifiable net assets over consideration paid (note 32) - (6)<br />
Mark-to-market of undesignated derivative financial instruments (held-for-trading) (1) (2)<br />
Income from financial assets (3) (2)<br />
Capital grants released (note 29) (2) (3)<br />
Total (6) (13)<br />
4. Group Operating Profit<br />
Group operating profit has been arrived at after charging the following amounts (including the Group’s proportionate share<br />
of amounts in joint ventures):<br />
<strong>2009</strong> 2008<br />
€m €m<br />
Depreciation<br />
- included in cost of sales 570 563<br />
- included in operating costs 194 204<br />
Total 764 767<br />
Foreign exchange gains and losses (net)<br />
- included in operating costs 2 (6)<br />
Total 2 (6)<br />
Operating lease rentals (minimum lease payments)<br />
- hire of plant and machinery 86 104<br />
- land and buildings 152 145<br />
- other operating leases 44 36<br />
Total 282 285<br />
Auditors' remuneration (included in administrative expenses)<br />
Audit fees (i) 13 14<br />
Audit-related fees (ii) 1 2<br />
Tax fees 1 1<br />
All other fees (iii) - -<br />
15 17<br />
(i) Audit fees include Sarbanes-Oxley attestation.<br />
(ii) Audit-related fees include acquisition-related due diligence amounting to €nil million (2008: €1.3 million) and other<br />
attestation services that are closely related to the performance of the audit. In addition to the due diligence fees<br />
expensed in the Consolidated Income Statement and included in the audit-related fees caption above, further due<br />
diligence fees of €nil (2008: €0.6 million) paid to the auditors have been included in the fair value of purchase consideration<br />
of business combinations for the respective periods; these amounts are reflected in the totals presented in note 32.<br />
(iii) All other fees relate principally to transaction advisory services.
5. Directors’ Emoluments and Interests<br />
Directors’ emoluments (which are included in administrative expenses in note 3) and interests are given in the <strong>Report</strong> on Directors’ Remuneration on pages 51 to 59<br />
of this <strong>Annual</strong> <strong>Report</strong>.<br />
6. Employment<br />
The average number of employees (including <strong>CRH</strong>’s proportionate share of employees in joint ventures) is as follows:<br />
Year ended 31st December <strong>2009</strong> Materials Products Distribution Total Group<br />
Europe 12,599 18,454 10,997 42,050<br />
Americas 18,075 16,349 3,348 37,772<br />
Total 30,674 34,803 14,345 79,822<br />
Year ended 31st December 2008<br />
Europe 14,560 21,265 11,499 47,324<br />
Americas 22,028 20,227 3,993 46,248<br />
Total 36,588 41,492 15,492 93,572<br />
Employment costs charged in the Consolidated Income Statement (including the Group’s proportionate share of joint ventures’ costs) are analysed as follows:<br />
<strong>2009</strong> 2008<br />
€m €m<br />
Wages and salaries 2,711 3,077<br />
Social welfare costs 340 377<br />
Other employment-related costs 418 401<br />
Share-based payment expense (note 7) 28 24<br />
Total pension costs (note 28) 179 176<br />
Total 3,676 4,055<br />
Total charge analysed between:<br />
Cost of sales 1,834 2,061<br />
Operating costs 1,834 2,009<br />
Finance costs (net) - applicable to defined benefit pension schemes (note 8) 8 (15)<br />
Total 3,676 4,055<br />
<strong>CRH</strong> 77
7. Share-based Payment Expense<br />
78 <strong>CRH</strong><br />
<strong>2009</strong> 2008<br />
€m €m<br />
Share option expense 18 17<br />
Performance Share Plan expense 10 7<br />
28 24<br />
€2 million (2008: €1 million) of the total expense reported in the Consolidated Income Statement relates to the Directors.<br />
Share Option Schemes<br />
The Group operates share option schemes, which were approved by shareholders in May 2000 (replacing the schemes which were approved in May 1990), and<br />
savings-related share option schemes, also approved by shareholders in May 2000. The general terms and conditions applicable to the share options granted by <strong>CRH</strong><br />
under the share option schemes are set out in the <strong>Report</strong> on Directors’ Remuneration on pages 51 to 59.<br />
The Group’s employee share options are equity-settled share-based payments as defined in IFRS 2 Share-based Payment. The measurement requirements of IFRS<br />
2 have been implemented in respect of share options that were granted after 7th November 2002. As options to acquire Ordinary Shares in the Company are<br />
traditionally granted in April of each year, the expense reflected in operating costs in the Consolidated Income Statement of €18 million (2008: €17 million) relates to<br />
options granted in April 2003 and in the subsequent periods. The expense has been arrived at through applying a trinomial valuation technique; this is a lattice optionpricing<br />
model in accordance with IFRS 2.<br />
All unexercised options and share awards under the Group’s various share plans have been adjusted for the bonus element of the Rights Issue completed in March<br />
<strong>2009</strong> - see note 30 (iii). Throughout this note, prior year disclosures for options and share awards have not been restated for this bonus element.<br />
Details of options granted under the share option schemes (excluding savings-related share option schemes)<br />
A summary of activity under the Company’s share option schemes in the two years ended 31st December <strong>2009</strong> and 31st December 2008 together with the<br />
weighted average exercise price of the share options is as follows:<br />
Weighted average<br />
exercise price<br />
Number of<br />
Weighted average Number of<br />
options<br />
exercise price options<br />
<strong>2009</strong> 2008<br />
Share options<br />
Outstanding at beginning of year €21.03 / Stg£16.46 24,025,246 €20.38 / Stg£16.06 23,304,553<br />
Rights Issue adjustment - March <strong>2009</strong> n/a 2,594,915 n/a -<br />
Granted (a) €16.93 / Stg£15.30 2,596,000 €23.87 / Stg£19.06 2,912,000<br />
Exercised (b) €14.92 / Stg£10.17 (3,562,399) €15.89 / Stg£13.06 (1,558,866)<br />
Lapsed €21.92 / Stg£16.31 (1,027,740) €22.89 / Stg£18.22 (632,441)<br />
Outstanding at end of year €19.21 / Stg£15.46 24,626,022 €21.03 / Stg£16.46 24,025,246<br />
Exercisable at end of year €16.00 / Stg£11.57 11,816,179 €17.53 / Stg£12.48 14,118,956<br />
(a) Pursuant to the 2000 share option schemes, employees were granted options over 2,596,000 (2008: 2,912,000) of the Company’s Ordinary Shares on 14th April<br />
<strong>2009</strong>. These options may be exercised after the expiration of three years from their date of grant, subject to specified EPS growth targets being achieved. All<br />
options granted have a life of ten years.<br />
(b) The weighted average share price at the date of exercise of these options was €18.29 (2008: €23.53).<br />
The weighted average remaining contractual life for the share options outstanding as at 31st December <strong>2009</strong> is 5.16 years (2008: 5.24 years). The range of exercise prices<br />
for the 24,626,022 (2008: 24,025,246) options outstanding at the end of the year was €11.86 - €29.86 for the 24,478,108 (2008: 23,878,042) euro-denominated options<br />
(2008: €13.15 - €33.12) and Stg£8.17 - Stg£20.23 for the 147,914 (2008: 147,204) sterling-denominated options (2008: Stg£9.06 - Stg£22.43).<br />
The <strong>CRH</strong> share price at 31st December <strong>2009</strong> was €19.01 (approximately Stg£16.88) (2008: €17.85/approximately Stg£17.00). The following analysis shows the<br />
number of outstanding share options with prices lower/higher than the year-end share price:<br />
<strong>2009</strong> 2008<br />
Number of options with prices lower than year-end price<br />
Exercisable 11,816,179 6,075,620<br />
Not exercisable 4,583,144 2,009,145<br />
Number of options with prices higher than year-end price<br />
16,399,323 8,084,765<br />
Exercisable - 8,043,336<br />
Not exercisable 8,226,699 7,897,145<br />
8,226,699 15,940,481<br />
Total options outstanding 24,626,022 24,025,246
7. Share-based Payment Expense continued<br />
The weighted average fair values assigned to options granted in <strong>2009</strong> and 2008 under the 2000 Share Option Schemes, which were computed in accordance with<br />
the trinomial valuation methodology, were as follows:<br />
Denominated in<br />
€ Stg£*<br />
3-year 3-year<br />
Granted during <strong>2009</strong> (amounts in €) 3.05 2.97<br />
Granted during 2008 (amounts in €) 4.46 4.46<br />
* € equivalents at the date of grant<br />
The fair values of these options were determined using the following assumptions:<br />
<strong>2009</strong> 2008<br />
3-year 3-year<br />
Weighted average exercise price (amounts in €) 16.92 23.87<br />
Risk-free interest rate (%) 2.38 3.61<br />
Expected dividend payments over the expected life (€ cent) 320.1 401.26<br />
Expected volatility (%) 24.5 21.7<br />
Expected life in years 5 5<br />
The expected volatility was determined using an historical sample of 61 month-end <strong>CRH</strong> share prices. Share options are granted at market value at the date of grant.<br />
The expected lives of the options are based on historical data and are therefore not necessarily indicative of exercise patterns that may materialise.<br />
Other than the assumptions listed above, no other features of option grants were factored into the determination of fair value. The terms of the options granted under<br />
the share option schemes do not contain any market conditions within the meaning of IFRS 2. No relevant modifications were effected to the share option schemes<br />
during the course of <strong>2009</strong> or 2008.<br />
Details of options granted under the savings-related share option schemes<br />
Weighted average<br />
exercise price<br />
Number of<br />
Weighted average Number of<br />
options<br />
exercise price options<br />
<strong>2009</strong> 2008<br />
Savings-related share options<br />
Outstanding at beginning of year €21.20 / Stg£15.51 1,033,071 €18.37 / Stg£12.53 1,259,082<br />
Rights Issue adjustment - March <strong>2009</strong> n/a 103,787 n/a -<br />
Granted (a) €11.18 / Stg£11.36 932,491 €20.40 / Stg£16.07 520,741<br />
Exercised (b) €13.23 / Stg£11.18 (118,477) €11.07 / Stg£8.34 (487,350)<br />
Lapsed €18.58 / Stg£14.21 (580,220) €22.67 / Stg£15.88 (259,402)<br />
Outstanding at end of year €13.85 / Stg£12.62 1,370,652 €21.20 / Stg£15.51 1,033,071<br />
Exercisable at end of year €19.60 / Stg£14.14 5,193 €11.87 / Stg£10.69 20,086<br />
(a) Pursuant to the savings-related share option schemes operated by the Company in the Republic of Ireland and the United Kingdom, employees were granted<br />
options over 932,491 of the Company’s Ordinary Shares on 2nd April <strong>2009</strong> (2008: 302,405 share options on 16th May 2008 and 218,336 share options on 3rd<br />
April 2008). Options granted during the year comprise options over 511,689 (2008: 248,572) shares which are normally exercisable within a period of six months<br />
after the third anniversary of the contract. Options over the remaining 420,802 (2008: 272,169) shares are normally exercisable within a period of six months of<br />
the fifth anniversary of the contract. Options granted under the savings-related share option schemes are not subject to EPS growth targets. The exercise price<br />
at which the options are granted under the schemes represents a discount of 15% to the market price on the date of grant.<br />
(b) The weighted average share price at the date of exercise of these options was €17.71 (2008: €17.21).<br />
The weighted average remaining contractual life for the savings-related share options outstanding as at 31st December <strong>2009</strong> is 3.34 years (2008: 2.89 years). The<br />
range of exercise prices for the 1,370,652 (2008: 1,033,071) savings-related share options outstanding at the end of the year was €11.18 - €24.25 for the 665,886<br />
(2008: 496,634) euro-denominated options (2008: €10.63 - €26.89) and Stg£11.16 - Stg£16.78 for the 704,766 (2008: 536,437) sterling-denominated options (2008:<br />
Stg£7.18 - Stg£18.61).<br />
The weighted average fair values assigned to options issued under the savings-related share option schemes, which were computed in accordance with the trinomial<br />
valuation methodology, were as follows:<br />
<strong>CRH</strong> 79
7. Share-based Payment Expense continued<br />
80 <strong>CRH</strong><br />
Denominated in<br />
€ € Stg£* Stg£*<br />
3-year 5-year 3-year 5-year<br />
Granted during <strong>2009</strong> (amounts in €) 6.86 6.92 5.67 5.77<br />
Granted during 2008 (amounts in €) 5.85 6.41 5.98 6.56<br />
* € equivalents at the date of grant<br />
The fair values of these options were determined using the following assumptions:<br />
<strong>2009</strong> 2008<br />
3-year 5-year 3-year 5-year<br />
Weighted average exercise price (amounts in €) 12.04 11.82 20.72 20.57<br />
Risk-free interest rate (%) 1.80 2.40 3.95/3.58 4.00/3.69<br />
Expected dividend payments over the expected life (€ cent) 188.75 320.10 219.73 401.26<br />
Expected volatility (%) 28.1 24.5 21.6/21.8 20.9/21.7<br />
Expected life in years 3 5 3 5<br />
The expected volatility was determined using an historical sample of 37 month-end <strong>CRH</strong> share prices in respect of the three-year savings-related share options and<br />
61 month-end share prices in respect of the five-year savings-related share options. The expected lives of the options are based on historical data and are therefore<br />
not necessarily indicative of exercise patterns that may materialise.<br />
Other than the assumptions listed above, no other features of option grants were factored into the determination of fair value. The terms of the options issued under<br />
the savings-related share option schemes do not contain any market conditions within the meaning of IFRS 2. No relevant modifications were effected to the savingsrelated<br />
share option schemes during the course of <strong>2009</strong> or 2008.<br />
Performance Share Plan<br />
The Group operates a Performance Share Plan which was approved by shareholders in May 2006. The general terms and conditions applicable to shares awarded<br />
by <strong>CRH</strong> under this Plan are set out in the <strong>Report</strong> on Directors’ Remuneration on pages 51 to 59.<br />
Shares awarded under the Group’s Performance Share Plan are equity-settled share-based payments as defined in IFRS 2 Share-based Payment. IFRS 2 requires<br />
that a recognised valuation methodology be employed to determine the fair value of shares awarded and stipulates that this methodology should be consistent with<br />
methodologies used for the pricing of financial instruments. The expense of €10 million (2008: €7 million) reported in the Consolidated Income Statement has been<br />
arrived at through applying a Monte Carlo simulation technique to model the combination of market-based and non-market-based performance conditions in the<br />
Plan.<br />
Number of Shares<br />
Period to<br />
Share price earliest<br />
Rights Cumulative<br />
at date release Initial Issue lapses/releases Net Fair<br />
of award* date award adjustment to date** outstanding value<br />
Granted in 2006 €24.82 3 years 627,750 62,249 689,999 - €12.11<br />
Granted in 2007 €33.29 3 years 594,750 60,122 45,218 609,654 €17.14<br />
Granted in 2008 €23.45 3 years 741,000 76,331 43,272 774,059 €10.27<br />
Granted in <strong>2009</strong> €17.00 3 years 1,658,000 - - 1,658,000 €8.29<br />
* Share prices in respect of awards prior to the Rights Issue have not been rights adjusted.<br />
** In March <strong>2009</strong>, 474,997 (74.99% of the initial award net of lapses and adjusted for the Rights Issue) of the shares awarded under the Performance Share Plan in<br />
2006 vested and accordingly were released to the participants of the scheme.<br />
The fair value of the shares awarded was determined using a Monte Carlo simulation technique taking account of peer group total shareholder return, volatilities and<br />
correlations, together with the following assumptions:<br />
<strong>2009</strong> 2008<br />
Risk-free interest rate (%) 1.77 3.49<br />
Expected volatility (%) 28.1 21.8<br />
The expected volatility was determined using an historical sample of 37 month-end <strong>CRH</strong> share prices.
8. Finance Costs and Finance Revenue<br />
<strong>2009</strong> 2008<br />
€m €m<br />
Finance costs<br />
Interest payable on bank loans and overdrafts repayable wholly within five years:<br />
- by instalments 4 11<br />
- not by instalments 223 275<br />
Interest payable under finance leases and hire purchase contracts 1 2<br />
Interest payable on other borrowings 149 123<br />
Total interest payable 377 411<br />
Unwinding of discount element of provisions for liabilities (note 26) 15 16<br />
Unwinding of discount applicable to deferred and contingent acquisition consideration 4 5<br />
Income on interest rate and currency swaps<br />
Mark-to-market of derivatives and related fixed rate debt:<br />
(77) (34)<br />
- interest rate swaps (i) 133 (283)<br />
- currency swaps and forward contracts 7 3<br />
- fixed rate debt (i) (135) 287<br />
Interest cost on defined benefit pension scheme liabilities 95 98<br />
Total finance costs 419 503<br />
Finance revenue<br />
Interest receivable on loans to joint ventures and associates (3) (4)<br />
Interest receivable on liquid investments (4) (8)<br />
Interest receivable on cash and cash equivalents (28) (35)<br />
(35) (47)<br />
Expected return on defined benefit pension scheme assets (87) (113)<br />
Total finance revenue (122) (160)<br />
Finance costs (net) 297 343<br />
(i) The Group uses interest rate swaps to convert fixed rate debt to floating rate. Fixed rate debt, which has been converted to floating rate through the use of interest<br />
rate swaps, is stated in the Consolidated Balance Sheet at adjusted fair value to reflect movements in underlying fixed rates. The movement on this adjustment,<br />
together with the offsetting movement in the fair value of the related interest rate swaps, is included in finance costs in each reporting period.<br />
9. Group Share of Associates’ Profit after Tax<br />
The Group’s share of associates’ profit after tax is equity-accounted and is presented as a single-line item in the Consolidated Income Statement. The Group’s share<br />
of profit after tax generated by associates is analysed as follows between the principal Consolidated Income Statement captions:<br />
<strong>2009</strong> 2008<br />
€m €m<br />
Group share of:<br />
Revenue 1,029 1,006<br />
Profit before finance costs 64 86<br />
Finance costs (net) (5) (3)<br />
Profit before tax 59 83<br />
Income tax expense (11) (22)<br />
Profit after tax 48 61<br />
An analysis of the profit after tax by operating segment is presented in note 1. The aggregated balance sheet data (analysed between current and non-current assets<br />
and liabilities) in respect of the Group’s investment in associates is presented in note 15.<br />
<strong>CRH</strong> 81
10. Income Tax Expense<br />
82 <strong>CRH</strong><br />
<strong>2009</strong> 2008<br />
€m €m<br />
Current tax<br />
Republic of Ireland<br />
Corporation tax at 12.5% (2008: 12.5%) (5) 21<br />
Less: manufacturing relief - (3)<br />
Tax on disposal of non-current assets 1 3<br />
(4) 21<br />
Overseas tax 29 239<br />
Tax on disposal of non-current assets - Overseas 11 17<br />
Total current tax 36 277<br />
Deferred tax<br />
Origination and reversal of temporary differences:<br />
Defined benefit pension obligations 11 5<br />
Share-based payment expense (3) 2<br />
Derivative financial instruments (11) (1)<br />
Other items 101 83<br />
Total deferred tax 98 89<br />
Income tax expense 134 366<br />
Reconciliation of applicable tax rate to effective tax rate<br />
Profit before tax (€m) 732 1,628<br />
Tax charge expressed as a percentage of profit before tax (effective tax rate):<br />
- current tax expense only 4.9% 17.0%<br />
- total income tax expense (current and deferred) 18.3% 22.5%<br />
The following table reconciles the applicable Republic of Ireland statutory tax rate to the effective tax rate (current and deferred) of the Group:<br />
% of profit before tax<br />
Irish corporation tax rate 12.5 12.5<br />
Manufacturing relief in the Republic of Ireland - (0.2)<br />
Higher tax rates on overseas earnings 3.8 10.5<br />
Other items (comprising items not chargeable to tax/expenses not deductible for tax) 2.0 (0.3)<br />
Total effective tax rate 18.3 22.5<br />
Current and deferred tax movements recognised directly within equity<br />
€m €m<br />
Recognised within the Consolidated Statement of Comprehensive Income:<br />
Deferred tax<br />
Defined benefit pension obligations 20 67<br />
Cash flow hedges (2) 4<br />
18 71<br />
Recognised within the Consolidated Statement of Changes in Equity:<br />
Current tax<br />
Share option exercises<br />
Deferred tax<br />
1 2<br />
Share-based payment expense 2 (15)<br />
3 (13)<br />
Income tax recognised within equity 21 58
10. Income Tax Expense continued<br />
Factors that may affect future tax charges and other disclosure requirements<br />
Excess of capital allowances over depreciation<br />
Based on current capital investment plans, the Group expects to continue to be in a position to claim capital allowances in excess of depreciation in future years.<br />
Investments in subsidiaries and associates and interests in joint ventures<br />
No provision has been made for temporary differences applicable to investments in subsidiaries and interests in joint ventures as the Group is in a position to control<br />
the timing of reversal of the temporary differences and it is probable that the temporary differences will not reverse in the foreseeable future. Due to the absence of<br />
control in the context of associates (significant influence only), deferred tax liabilities are recognised where appropriate in respect of <strong>CRH</strong>’s investments in these entities<br />
on the basis that the exercise of significant influence would not necessarily prevent earnings being remitted by other shareholders in the undertaking. Given that<br />
participation exemptions and tax credits would be available in the context of the Group’s investments in subsidiaries and joint ventures in the majority of the jurisdictions<br />
in which the Group operates, the aggregate amount of temporary differences in respect of which deferred tax liabilities have not been recognised would be immaterial<br />
(with materiality defined in the context of the year-end <strong>2009</strong> financial statements).<br />
Other considerations<br />
The total tax charge in future periods will be affected by any changes to the corporation tax rates in force in the countries in which the Group operates. The current<br />
tax charge will also be impacted by changes in the excess of tax depreciation (capital allowances) over accounting depreciation and the use of tax credits.<br />
11. Dividends<br />
As shown in note 30, the Company has various classes of share capital in issue comprising Ordinary Shares, 5% Cumulative Preference Shares and 7% ‘A’ Cumulative<br />
Preference Shares. The dividends paid and proposed in respect of these classes of share capital are as follows:<br />
<strong>2009</strong> 2008<br />
€m €m<br />
Dividends to shareholders<br />
Preference<br />
5% Cumulative Preference Shares €3,175 (2008: €3,175) - -<br />
7% 'A' Cumulative Preference Shares €77,521 (2008: €77,521)<br />
Equity (i)<br />
- -<br />
Final - 43.74c (restated) per Ordinary Share in May <strong>2009</strong> (43.28c, restated paid in May 2008) 258 260<br />
Interim - paid 18.50c per Ordinary Share (2008: 18.48c, restated) 128 109<br />
Total 386 369<br />
Dividends proposed (memorandum disclosure)<br />
Equity (i)<br />
Final <strong>2009</strong> - proposed 44.00c per Ordinary Share (2008: 43.74c, restated) 307 258<br />
Reconciliation to Consolidated Statement of Cash Flows<br />
Dividends to shareholders 386 369<br />
Less: issue of shares in lieu of dividends (ii) (148) (22)<br />
Dividends paid to equity holders of the Company 238 347<br />
Dividends paid by subsidiaries to minority interest 7 5<br />
Total dividends paid 245 352<br />
(i) Comparative per share amounts for 2008 have been restated to reflect the bonus element of the March <strong>2009</strong> Rights Issue - see note 12 (iii) below.<br />
(ii) In accordance with the scrip dividend scheme, shares to the value of €148 million (2008: €22 million) were issued in lieu of dividends.<br />
<strong>CRH</strong> 83
12. Earnings per Ordinary Share<br />
The computation of basic and diluted earnings per Ordinary Share is set out below:<br />
84 <strong>CRH</strong><br />
<strong>2009</strong> 2008<br />
€m €m<br />
Numerator computations - basic and diluted earnings per Ordinary Share<br />
Group profit for the financial year 598 1,262<br />
Profit attributable to minority interest (6) (14)<br />
Profit attributable to equity holders of the Company 592 1,248<br />
Preference dividends - -<br />
Profit attributable to ordinary equity holders of the Company 592 1,248<br />
Amortisation of intangible assets (including impairments) 54 43<br />
Profit attributable to ordinary equity holders of the Company excluding amortisation of intangible assets 646 1,291<br />
Depreciation charge (including impairments) 794 781<br />
Numerator for "cash" earnings per Ordinary Share (i) 1,440 2,072<br />
Denominator computations Restated (iii)<br />
Denominator for basic earnings per Ordinary Share<br />
Weighted average number of Ordinary Shares (millions) outstanding for the year (ii) 670.8 593.9<br />
Effect of dilutive potential Ordinary Shares (employee share options) (millions) (ii) and (iv) 2.7 3.3<br />
Denominator for diluted earnings per Ordinary Share 673.5 597.2<br />
Basic earnings per Ordinary Share<br />
- including amortisation of intangible assets 88.3c 210.2c<br />
- excluding amortisation of intangible assets 96.3c 217.4c<br />
Diluted earnings per Ordinary Share<br />
- including amortisation of intangible assets 87.9c 209.0c<br />
- excluding amortisation of intangible assets 95.9c 216.2c<br />
"Cash" earnings per Ordinary Share (i) 214.7c 348.9c<br />
(i) “Cash” earnings per Ordinary Share, which is computed through adding amortisation of intangible assets, depreciation and asset impairments to profit attributable<br />
to ordinary equity holders of the Company, is presented here for information as management believes it is a useful indicator of the Group’s ability to generate cash<br />
from operations. Cash earnings per share is not a recognised measure under generally accepted accounting principles.<br />
(ii) Basic and diluted earnings per Ordinary Share: The weighted average number of Ordinary Shares included in the computation of basic and diluted earnings per<br />
Ordinary Share has been adjusted to exclude shares held by the Employee Benefit Trust and Ordinary Shares re-purchased and held by the Company (<strong>CRH</strong> plc)<br />
as Treasury Shares given that these shares do not rank for dividend. The number of Ordinary Shares so held at the balance sheet date is detailed in note 30.<br />
(iii) As set out in note 30 (iii) 152,087,952 new Ordinary/Income Shares were issued in March <strong>2009</strong> at €8.40 per share on the basis of two new Ordinary/Income<br />
Shares for every seven existing Ordinary/Income Shares under the terms of a Rights Issue. The actual cum rights price on 3rd March <strong>2009</strong>, the last day of<br />
quotation cum rights, was €15.065, and the theoretical ex rights price for an Ordinary/Income Share was therefore €13.5839 per share. The comparative earnings<br />
per share figures have been calculated by applying a factor of 1.1090 to the average number of shares in issue for 2008 in order to adjust for the bonus element<br />
of the Rights Issue.<br />
(iv) The issue of certain Ordinary Shares in respect of employee share options and Performance Share Plan awards are contingent upon the satisfaction of specified<br />
performance conditions in addition to the passage of time. In accordance with IAS 33 Earnings per Share, these contingently issuable Ordinary Shares (totalling<br />
15,851,556 at 31st December <strong>2009</strong> and 13,036,617 on a rights-adjusted basis at 31st December 2008) are excluded from the computation of diluted earnings<br />
per Ordinary Share where the conditions governing exercisability have not been satisfied as at the end of the reporting period.
13. Property, Plant and Equipment<br />
Land and Plant and<br />
Assets in<br />
course of<br />
buildings (i) machinery Transport construction Total<br />
€m €m €m €m €m<br />
At 31st December <strong>2009</strong><br />
Cost/deemed cost 5,710 7,113 803 416 14,042<br />
Accumulated depreciation (and impairment charges) (1,245) (3,758) (504) - (5,507)<br />
Net carrying amount 4,465 3,355 299 416 8,535<br />
At 1st January <strong>2009</strong>, net carrying amount 4,321 3,567 380 620 8,888<br />
Translation adjustment (59) (61) (8) (5) (133)<br />
Reclassifications 279 164 (2) (441) -<br />
Additions at cost (ii) 70 207 17 238 532<br />
Arising on acquisition (note 32) 46 51 9 4 110<br />
Disposals at net carrying amount (39) (19) (10) - (68)<br />
Depreciation charge for year (146) (531) (87) - (764)<br />
Impairment charge for year (iii) (7) (23) - - (30)<br />
At 31st December <strong>2009</strong>, net carrying amount 4,465 3,355 299 416 8,535<br />
The equivalent disclosure for the prior year is as follows:<br />
At 31st December 2008<br />
Cost/deemed cost 5,434 6,952 847 620 13,853<br />
Accumulated depreciation (and impairment charges) (1,113) (3,385) (467) - (4,965)<br />
Net carrying amount 4,321 3,567 380 620 8,888<br />
At 1st January 2008, net carrying amount 4,030 3,416 378 402 8,226<br />
Translation adjustment 61 8 13 (26) 56<br />
Reclassifications 58 128 (4) (182) -<br />
Additions at cost (ii) 141 413 71 414 1,039<br />
Arising on acquisition (note 32) 218 179 20 12 429<br />
Disposals at net carrying amount (41) (33) (7) - (81)<br />
Depreciation charge for year (140) (536) (91) - (767)<br />
Impairment charge for year (iii) (6) (8) - - (14)<br />
At 31st December 2008, net carrying amount 4,321 3,567 380 620 8,888<br />
At 1st January 2008<br />
Cost/deemed cost 4,963 6,303 731 402 12,399<br />
Accumulated depreciation (933) (2,887) (353) - (4,173)<br />
Net carrying amount 4,030 3,416 378 402 8,226<br />
(i) The carrying value of mineral-bearing land included in the land and buildings category above amounted to €1,797 million at the balance sheet date (2008: €1,780<br />
million).<br />
(ii) Borrowing costs capitalised during the financial year amounted to €9.5 million (2008: €13 million). The average capitalisation rate employed to determine the<br />
amount of borrowing costs eligible for capitalisation was 5.5% (2008: 5.5%).<br />
(iii) Property, plant and equipment assets are reviewed for potential impairment at each reporting date by applying a series of external and internal indicators specific<br />
to the assets under consideration; these indicators would encompass macroeconomic issues including the inherent cyclicality of the building materials sector,<br />
actual obsolescence or physical damage, a deterioration in forecast performance in the internal reporting cycle and restructuring and rationalisation programmes<br />
inter alia. In the event that there is an indication that an asset (or collection of assets) may be impaired, the Group measures the potential impairment using a<br />
discounted cash flow technique and records an impairment where the recoverable amount (being the higher of fair value less costs to sell and value-in-use) is less<br />
than the carrying amount. The impairment charge for <strong>2009</strong> of €30 million (2008: €14 million) represents charges across a number of business units in the Group,<br />
none of which is individually material.<br />
<strong>CRH</strong> 85
13. Property, Plant and Equipment continued<br />
Assets held under finance leases<br />
The net carrying amount and the depreciation charge during the period in respect of assets held under finance leases, and capitalised in property, plant and<br />
equipment, are as follows:<br />
<strong>2009</strong> 2008<br />
€m €m<br />
Cost 79 91<br />
Accumulated depreciation (45) (43)<br />
Net carrying amount 34 48<br />
Depreciation charge for year 9 8<br />
Future purchase commitments for property, plant and equipment<br />
Contracted for but not provided in the financial statements 272 433<br />
Authorised by the Directors but not contracted for 139 133<br />
14. Intangible Assets<br />
86 <strong>CRH</strong><br />
Other intangible assets<br />
MarketingCustomerContract- Goodwill relatedrelated (i) based Total<br />
€m €m €m €m €m<br />
At 31st December <strong>2009</strong><br />
Cost 3,976 35 274 22 4,307<br />
Accumulated amortisation (and impairment charges) (57) (20) (128) (7) (212)<br />
Net carrying amount 3,919 15 146 15 4,095<br />
At 1st January <strong>2009</strong>, net carrying amount 3,884 22 185 17 4,108<br />
Translation adjustment (21) (1) (2) - (24)<br />
Arising on acquisition (note 32) 64 - 2 - 66<br />
Disposals (1) - - - (1)<br />
Amortisation charge for year (ii) - (5) (36) (2) (43)<br />
Impairment charge for year (7) (1) (3) - (11)<br />
At 31st December <strong>2009</strong>, net carrying amount 3,919 15 146 15 4,095<br />
The equivalent disclosure for the prior year is as follows:<br />
At 31st December 2008<br />
Cost 3,934 36 278 22 4,270<br />
Accumulated amortisation (and impairment charges) (50) (14) (93) (5) (162)<br />
Net carrying amount 3,884 22 185 17 4,108<br />
At 1st January 2008, net carrying amount 3,482 18 175 17 3,692<br />
Translation adjustment 37 - 4 1 42<br />
Arising on acquisition (note 32) 366 9 42 1 418<br />
Disposals (1) - - - (1)<br />
Amortisation charge for year (ii) - (5) (36) (2) (43)<br />
At 31st December 2008, net carrying amount 3,884 22 185 17 4,108<br />
At 1st January 2008<br />
Cost 3,532 27 230 21 3,810<br />
Accumulated amortisation (and impairment charges) (50) (9) (55) (4) (118)<br />
Net carrying amount 3,482 18 175 17 3,692<br />
(i) The customer-related intangible assets relate predominantly to non-contractual customer relationships.<br />
(ii) Goodwill is not subject to amortisation under IFRS. The useful lives of all other intangible assets are finite and, in general, range from one to ten years dependent<br />
on the nature of the asset.<br />
Due to the asset-intensive nature of operations in the Materials business segments, no significant intangible assets are recognised on business combinations in these<br />
segments. Business combinations in the Group’s Products and Distribution segments do not exhibit the same level of asset intensity and intangible assets are<br />
recognised, where appropriate, on such combination activity.
14. Intangible Assets continued<br />
Goodwill<br />
The goodwill balances disclosed above include goodwill arising on the acquisition of joint ventures which are accounted for on the basis of proportionate consolidation.<br />
Goodwill arising in respect of investments in associates is included in financial assets in the Consolidated Balance Sheet (see note 15). The net book value of goodwill<br />
capitalised under previous GAAP (Irish GAAP) as at the transition date to IFRS (1st January 2004) has been treated as deemed cost. Goodwill arising on acquisition<br />
since that date is capitalised at cost.<br />
Cash-generating units<br />
Goodwill acquired through business combination activity has been allocated to cash-generating units (CGUs) that are expected to benefit from synergies in that<br />
combination. The cash-generating units represent the lowest level within the Group at which the associated goodwill is monitored for internal management purposes<br />
and are not larger than the operating segments determined in accordance with IFRS 8 Operating Segments. A total of 29 (2008: 27) cash-generating units have been<br />
identified and these are analysed below between the six business segments in the Group. All businesses within the various cash-generating units exhibit similar and/<br />
or consistent profit margin and asset intensity characteristics. Assets, liabilities, deferred tax and goodwill have been assigned to the cash-generating units on a<br />
reasonable and consistent basis. Investments accounted for using the equity method have not been allocated given that such investments fall to be assessed for<br />
impairment under IAS 39 Financial Instruments: Recognition and Measurement.<br />
Cash-generating units Goodwill<br />
<strong>2009</strong> 2008 <strong>2009</strong> 2008<br />
€m €m<br />
Europe Materials 11 10 751 747<br />
Europe Products 3 4 707 708<br />
Europe Distribution 1 1 573 558<br />
Americas Materials 8 6 1,037 992<br />
Americas Products 5 5 586 603<br />
Americas Distribution 1 1 265 276<br />
Total cash-generating units 29 27 3,919 3,884<br />
Impairment testing methodology and results<br />
Goodwill is subject to impairment testing on an annual basis. The recoverable amount of each of the 29 cash-generating units is determined based on a value-in-use<br />
computation, which is the only methodology applied by the Group and which has been selected due to the impracticality of obtaining fair value less costs to sell<br />
measurements for each reporting period. The cash flow forecasts are based on a five-year strategic plan document formally approved by senior management and the<br />
Board of Directors and specifically exclude the impact of future development activity. These cash flows are projected forward for an additional five years to determine<br />
the basis for an annuity-based terminal value, calculated on the same basis as the Group’s acquisition modelling methodology. As in prior years, the terminal value is<br />
based on a 20-year annuity, with the exception of certain long-lived cement assets, where an assumption of a 40-year annuity has been used in <strong>2009</strong>. The projected<br />
cash flows assume zero growth in real cash flows beyond the initial evaluation period. The value-in-use represents the present value of the future cash flows, including<br />
the terminal value, discounted at a rate appropriate to each cash-generating unit. The real pre-tax discount rates used range from 7.9% to 12.0% (2008: 8.1% to<br />
13.4%); the average rate is in line with the Group’s estimated weighted average cost of capital, arrived at using the Capital Asset Pricing Model.<br />
An impairment charge of €7 million (2008: €nil million) has been recognised by the Group; this charge relates to the rationalisation of two individual sites in Europe Products.<br />
Key sources of estimation uncertainty<br />
The cash flows have been arrived at taking account of the Group’s strong financial position, its established history of earnings and cash flow generation and the nature<br />
of the building materials industry, where product obsolescence is very low. However, expected future cash flows are inherently uncertain and are therefore liable to<br />
material change over time. The key assumptions employed in arriving at the estimates of future cash flows factored into impairment testing are subjective and include<br />
projected EBITDA (i.e. operating profit before depreciation and amortisation of intangible assets) margins, net cash flows, discount rates used and the duration of the<br />
discounted cash flow model.<br />
Sensitivity analysis<br />
Sensitivity analysis has been performed in respect of 6 of the 29 CGUs. These 6 CGUs had aggregate goodwill of €784 million and an aggregate carrying value of<br />
€2,566 million at the date of testing. The table below identifies the amounts by which each of the following assumptions may either decline or increase to arrive at a<br />
zero excess of the present value of future cash flows over the book value of net assets in the 6 CGUs selected for sensitivity analysis testing:<br />
Reduction in EBITDA margin 0.8 to 3.7 percentage points<br />
Reduction in profit before tax 11.1% to 34.9%<br />
Reduction in net cash flow 8.3% to 19.5%<br />
Increase in pre-tax discount rate 1.1 to 2.6 percentage points<br />
Additional disclosures - significant goodwill amounts<br />
The goodwill allocated to each of the 29 (2008: 27) cash-generating units accounts for between 10% and 20% of the total carrying amount of €3,919 million in one<br />
instance and less than 10% of the total carrying amount in all other cases. The additional disclosures required under IAS 36 Impairment of Assets are as follows:<br />
Europe Distribution<br />
<strong>2009</strong> 2008<br />
Carrying amount of goodwill allocated to the cash-generating unit at date of testing €573m €492m<br />
Carrying amount of indefinite-lived intangible assets allocated to the cash-generating unit Nil Nil<br />
Basis on which the recoverable amount of the cash-generating unit has been assessed Value-in-use Value-in-use<br />
Discount rate applied to the cash flow projections (real pre-tax) 10.0% 10.2%<br />
Excess of value-in-use over carrying amount €307m €938m<br />
The key assumptions, methodology used and values applied to each of the key assumptions for this cash-generating unit are in line with those addressed above.<br />
Given the magnitude of the excess of value-in-use over carrying amount, and the reasonableness of the key assumptions employed, no further disclosures relating to<br />
sensitivity of the value-in-use computations for this CGU were considered to be warranted.<br />
<strong>CRH</strong> 87
15. Financial Assets<br />
88 <strong>CRH</strong><br />
Investments accounted for using the equity method<br />
(i.e. associates)<br />
Share of net<br />
assets Goodwill Loans Total Other (ii)<br />
€m €m €m €m €m<br />
At 1st January <strong>2009</strong> 532 208 3 743 127<br />
Translation adjustment (13) (3) - (16) (3)<br />
Associate becoming a subsidiary (note 32) (7) - - (7) -<br />
Investments and advances (i) 144 90 1 235 9<br />
Disposals and repayments (2) - (1) (3) (5)<br />
Retained profit 16 (6) - 10 -<br />
At 31st December <strong>2009</strong> 670 289 3 962 128<br />
The equivalent disclosure for the prior year is as follows:<br />
At 1st January 2008 465 105 4 574 78<br />
Translation adjustment 2 1 - 3 5<br />
Arising on acquisition (note 32) 1 - - 1 2<br />
Investments and advances (i) 54 102 - 156 50<br />
Disposals and repayments (8) - (1) (9) (8)<br />
Retained profit 18 - - 18 -<br />
At 31st December 2008 532 208 3 743 127<br />
The total investment in associates is analysed as follows:<br />
<strong>2009</strong> 2008<br />
€m €m<br />
Non-current assets 1,065 792<br />
Current assets 581 469<br />
Non-current liabilities (302) (248)<br />
Current liabilities (382) (270)<br />
Net assets 962 743<br />
A listing of the principal associates is contained on page 129.<br />
The Group holds a 21.23% stake (2008: 21.66%) in Groupe SAMSE, a publicly-quoted distributor of building materials to the merchanting sector in France which is<br />
accounted for as an associate investment above. The fair value of this investment as at the balance sheet date amounted to €42 million (2008: €40 million).<br />
(i) The major investment during the year was the purchase on 5th January <strong>2009</strong> of a 26% stake in Yatai Cement, the leading cement manufacturer in northeastern<br />
China, for a consideration of €224 million.<br />
(ii) Other financial assets primarily comprise trade investments carried at historical cost and loans extended by the Group to joint ventures (which are treated as loans<br />
and receivables under IAS 39 Financial Instruments: Recognition and Measurement and are included within financial assets at amortised cost). The balance as at<br />
31st December <strong>2009</strong> comprises €14 million primarily in respect of trade investments and €114 million in respect of loans to joint ventures (2008: €15 million and<br />
€112 million respectively).<br />
16. Disposal of Non-current Assets<br />
<strong>2009</strong> 2008<br />
€m €m<br />
Non-current assets disposed of at net carrying amount:<br />
- property, plant and equipment (note 13) 68 81<br />
- intangible assets (note 14) 1 1<br />
- financial assets (note 15) 8 17<br />
Total 77 99<br />
Profit on disposal of non-current assets 26 69<br />
Proceeds from disposal of non-current assets - Consolidated Statement of Cash Flows 103 168
17. Inventories<br />
<strong>2009</strong> 2008<br />
€m €m<br />
Raw materials 585 749<br />
Work-in-progress (i) 82 110<br />
Finished goods 1,341 1,614<br />
Total inventories at the lower of cost and net realisable value 2,008 2,473<br />
(i) Work-in-progress includes €nil million (2008: €nil million) in respect of the cumulative costs incurred, net of amounts transferred to cost of sales under percentageof-completion<br />
accounting, for construction contracts in progress at the balance sheet date.<br />
Write-downs of inventories recognised as an expense within cost of sales amounted to €41 million (2008: €17 million).<br />
None of the above carrying amounts has been pledged as security for liabilities entered into by the Group.<br />
18. Trade and Other Receivables<br />
<strong>2009</strong> 2008<br />
€m €m<br />
All current<br />
Trade receivables 1,608 2,100<br />
Amounts receivable in respect of construction contracts (i) 350 458<br />
Total trade receivables, gross 1,958 2,558<br />
Provision for impairment (158) (161)<br />
Total trade receivables, net 1,800 2,397<br />
Other receivables (ii) 477 486<br />
Amounts receivable from associates 1 -<br />
Prepayments and accrued income 176 213<br />
Total 2,454 3,096<br />
(i) Unbilled revenue at the balance sheet date in respect of construction contracts amounting to €89 million (2008: €119 million).<br />
(ii) Other receivables include retentions held by customers in respect of construction contracts at the balance sheet date amounting to €82 million (2008: €94 million).<br />
Trade receivables and amounts receivable in respect of construction contracts are in general receivable within 90 days of the balance sheet date.<br />
A general discussion of the terms and conditions applicable to related party receivables is provided in note 33 to the financial statements.<br />
The carrying amounts of trade and other receivables approximate their fair value largely due to the short-term maturities of these instruments.<br />
Provision for impairment<br />
The movements in the provision for impairment of receivables during the financial year were as follows:<br />
At 1st January 161 158<br />
Translation adjustment (1) 1<br />
Provided during year 71 63<br />
Written-off during year (68) (51)<br />
Recovered during year (5) (10)<br />
At 31st December 158 161<br />
Information in relation to the Group’s credit risk management is provided in note 21 to the financial statements.<br />
Aged analysis<br />
The aged analysis of gross trade receivables and amounts receivable in respect of construction contracts at the balance sheet date was as follows:<br />
Neither past due nor impaired 1,528 2,148<br />
Past due but not impaired:<br />
- less than 60 days 112 71<br />
- 60 days or greater but less than 120 days 89 65<br />
- 120 days or greater 32 40<br />
Past due and impaired (partial or full provision) 197 234<br />
Total 1,958 2,558<br />
<strong>CRH</strong> 89
19. Trade and Other Payables<br />
90 <strong>CRH</strong><br />
<strong>2009</strong> 2008<br />
€m €m<br />
Current<br />
Trade payables 1,172 1,440<br />
Irish employment-related taxes 3 3<br />
Other employment-related taxes 76 78<br />
Value added tax 85 92<br />
Deferred and contingent acquisition consideration 32 44<br />
Other payables (i) 372 495<br />
Accruals and deferred income 682 731<br />
Amounts payable to associates 49 36<br />
Subtotal – current 2,471 2,919<br />
Non-current<br />
Other payables 74 36<br />
Deferred and contingent acquisition consideration (stated at net present cost) due as follows:<br />
- between one and two years 16 33<br />
- between two and five years 35 36<br />
- after five years 30 32<br />
Subtotal – non-current 155 137<br />
(i) Other payables include billings in excess of costs incurred together with advances received from customers in respect of work to be performed under construction<br />
contracts and foreseeable losses thereon amounting to €174 million at the balance sheet date (2008: €190 million).<br />
The carrying amounts of trade and other payables approximate their fair value largely due to the short-term maturities of these instruments.<br />
20. Movement in Working Capital<br />
Trade Trade<br />
and other and other<br />
Inventories receivables payables Total<br />
€m €m €m €m<br />
At 1st January <strong>2009</strong> 2,473 3,096 (3,056) 2,513<br />
Translation adjustment (34) (31) 14 (51)<br />
Arising on acquisition (note 32) 11 22 (14) 19<br />
Movement in finance-related receivables - 115 - 115<br />
Deferred and contingent acquisition consideration:<br />
- arising on acquisitions during the year (note 32) - - (8) (8)<br />
- paid during the year - - 37 37<br />
Interest accruals - 4 (10) (6)<br />
(Decrease)/increase in working capital (442) (752) 411 (783)<br />
At 31st December <strong>2009</strong> 2,008 2,454 (2,626) 1,836<br />
The equivalent disclosure for the prior year is as follows:<br />
At 1st January 2008 2,226 3,199 (3,097) 2,328<br />
Translation adjustment 8 26 (15) 19<br />
Arising on acquisition (note 32) 66 126 (89) 103<br />
Deferred and contingent acquisition consideration:<br />
- arising on acquisitions during the year (note 32) - - (12) (12)<br />
- paid during the year - - 34 34<br />
Interest accruals - (4) (12) (16)<br />
Increase/(decrease) in working capital 173 (251) 135 57<br />
At 31st December 2008 2,473 3,096 (3,056) 2,513
21. Capital and Financial Risk Management<br />
Capital management<br />
Overall summary<br />
The primary objectives of <strong>CRH</strong>’s capital management strategy are to ensure that the Group maintains a strong credit rating to support its business and to create<br />
shareholder value by managing the debt and equity balance and the cost of capital.<br />
The Board periodically reviews the capital structure of the Group, including the cost of capital and the risks associated with each class of capital. The Group manages<br />
and, if necessary, adjusts its capital structure taking account of underlying economic conditions; any material adjustments to the Group’s capital structure in terms of<br />
the relative proportions of debt and equity are approved by the Board. In order to maintain or adjust the capital structure, the Group may issue new shares, dispose<br />
of assets, amend investment plans, alter dividend policy or return capital to shareholders. The Group is committed to optimising the use of its balance sheet within<br />
the confines of the overall objective to maintain an investment grade credit rating. Dividend cover for the year ended 31st December <strong>2009</strong> amounted to 1.4 times<br />
(2008: 3.4 times).<br />
The capital structure of the Group, which comprises net debt and capital and reserves attributable to the Company’s equity holders, may be summarised as follows:<br />
<strong>2009</strong> 2008<br />
€m €m<br />
Capital and reserves attributable to the Company's equity holders 9,637 8,087<br />
Net debt (note 25) 3,723 6,091<br />
Capital and net debt 13,360 14,178<br />
Financial risk management objectives and policies<br />
The Group uses financial instruments throughout its businesses: interest-bearing loans and borrowings, cash and cash equivalents, short-dated liquid investments<br />
and finance leases are used to finance the Group’s operations; trade receivables and trade payables arise directly from operations; and derivatives, principally interest<br />
rate and currency swaps and forward foreign exchange contracts, are used to manage interest rate risks and currency exposures and to achieve the desired profile<br />
of borrowings. The Group does not trade in financial instruments nor does it enter into any leveraged derivative transactions.<br />
The Group’s corporate treasury function provides services to the business units, co-ordinates access to domestic and international financial markets, and monitors<br />
and manages the financial risks relating to the operations of the Group. The Group Treasurer reports to the Finance Director and the activities of the corporate treasury<br />
function are subject to regular internal audit. Systems are in place to monitor and control the Group’s liquidity risks. The Group’s net debt position forms part of the<br />
monthly documentation presented to the Board of Directors.<br />
The main risks attaching to the Group’s financial instruments are interest rate risk, foreign currency risk, credit risk and liquidity risk. Commodity price risk is of minimal<br />
relevance given that exposure is confined to a small number of contracts entered into for the purpose of hedging future movements in energy costs. The Board reviews<br />
and agrees policies for the prudent management of each of these risks as documented below.<br />
Interest rate risk<br />
The Group’s exposure to market risk for changes in interest rates stems predominantly from its long-term debt obligations. Interest cost is managed by the Group’s<br />
corporate treasury function using a mix of fixed and floating rate debt. With the objective of managing this mix in a cost-efficient manner, the Group enters into interest<br />
rate swaps, under which the Group contracts to exchange, at predetermined intervals, the difference between fixed and variable interest amounts calculated by<br />
reference to a pre-agreed notional principal. Such contracts enable the Group to mitigate the risk of changing interest rates on the fair value of issued fixed rate debt<br />
and the cash flow exposures of issued floating rate debt.<br />
The majority of these swaps are designated under IAS 39 to hedge underlying debt obligations and qualify for hedge accounting; undesignated financial instruments<br />
are termed “not designated as hedges” in the analysis of derivative financial instruments presented in note 24. The following table demonstrates the impact on profit<br />
before tax of a range of possible changes in the interest rates applicable to net floating rate borrowings, with all other variables held constant:<br />
Percentage change in cost of borrowings +/- 1% +/- 0.5%<br />
Impact on profit before tax <strong>2009</strong> -/+ €8m -/+ €4m<br />
2008 -/+ €32m -/+ €16m<br />
<strong>CRH</strong> 91
21. Capital and Financial Risk Management continued<br />
Foreign currency risk<br />
Due to the nature of building materials, which in general exhibit a low value-to-weight ratio, <strong>CRH</strong>’s activities are conducted primarily in the local currency of the country<br />
of operation resulting in low levels of foreign currency transaction risk; variances arising in this regard are reflected in operating costs or cost of sales in the Consolidated<br />
Income Statement in the period in which they arise and are shown in note 4.<br />
Given the Group’s presence in 35 countries worldwide, the principal foreign exchange risk arises from fluctuations in the euro value of the Group’s net investment in<br />
a wide basket of currencies other than the euro; such changes are reported separately within the Consolidated Statement of Comprehensive Income. A currency<br />
profile of the Group’s net debt and net worth is presented in note 25. The Group’s established policy is to spread its net worth across the currencies of its various<br />
operations with the objective of limiting its exposure to individual currencies and thus promoting consistency with the geographical balance of its operations. In order<br />
to achieve this objective, the Group manages its borrowings, where practicable and cost effective, partially to hedge its foreign currency assets. Hedging is done using<br />
currency borrowings in the same currency as the assets being hedged or through the use of other hedging methods such as currency swaps.<br />
The following table demonstrates the sensitivity of profit before tax and equity to selected movements in the relevant €/US$ exchange rate (with all other variables held<br />
constant); the US Dollar has been selected as the appropriate currency for this analysis given the materiality of the Group’s activities in the United States:<br />
Percentage change in relevant €/US$ exchange rate +/- 5% +/-2.5%<br />
Impact on profit before tax <strong>2009</strong> -/+ €14m -/+ €7m<br />
2008 -/+ €29m -/+ €15m<br />
Impact on equity * <strong>2009</strong> -/+ €170m -/+ €87m<br />
2008 -/+ €160m -/+ €82m<br />
* Includes the impact on financial instruments which is as follows: <strong>2009</strong> +/- €105m +/- €54m<br />
2008 +/- €139m +/- €71m<br />
Financial instruments include deposits, money market funds, bank loans, medium term notes and other fixed term debt, interest rate swaps, commodity swaps and<br />
foreign exchange contracts. It excludes trade receivables and trade payables.<br />
Credit risk<br />
In addition to cash at bank and in hand, the Group holds significant cash balances which are invested on a short-term basis and are classified as either cash<br />
equivalents or liquid investments (see note 22). These deposits and other financial instruments (principally certain derivatives and loans and receivables included within<br />
financial assets) give rise to credit risk on amounts due from counterparties. Credit risk is managed by limiting the aggregate amount and duration of exposure to any<br />
one counterparty primarily depending on its credit rating and by regular review of these ratings. Acceptable credit ratings are high investment grade ratings - generally<br />
counterparties have ratings of A2/A or higher from Moody’s/Standard & Poor’s ratings agencies. The maximum exposure arising in the event of default on the part of<br />
the counterparty is the carrying value of the relevant financial instrument.<br />
Credit risk arising in the context of the Group’s operations is not significant with the total bad debt provision at the balance sheet date amounting to circa 8.1% of<br />
gross trade receivables (2008: 6.3%). Customer credit risk is managed at appropriate Group locations subject to established policies, procedures and controls.<br />
Customer credit quality is assessed in line with strict credit rating criteria and credit limits established where appropriate. Outstanding customer balances are regularly<br />
monitored and a review for indicators of impairment (evidence of financial difficulty of the customer, payment default, breach of contract etc.) is carried out at each<br />
reporting date. Significant balances are reviewed individually while smaller balances are grouped and assessed collectively. Receivables balances are in general<br />
unsecured and non-interest-bearing. The trade receivables balances disclosed in note 18 comprise a large number of customers spread across the Group’s activities<br />
and geographies with balances classified as neither past due nor impaired representing 78% of the total receivables balance at the balance sheet date (2008: 84%);<br />
amounts receivable from related parties (notes 18 and 33) are immaterial. Factoring and credit guarantee arrangements are employed in certain of the Group’s<br />
operations where deemed relevant by operational management.<br />
Liquidity risk<br />
The principal liquidity risks faced by the Group stem from the maturation of debt obligations and derivative transactions. The Group’s corporate treasury function<br />
ensures that sufficient resources are available to meet such liabilities as they fall due through a combination of liquid investments, cash and cash equivalents, cash<br />
flows and undrawn committed bank facilities. Flexibility in funding sources is achieved through a variety of means including (i) maintaining cash and cash equivalents<br />
and liquid resources only with a diversity of highly-rated counterparties; (ii) limiting the maturity of such balances; (iii) borrowing the bulk of the Group’s debt requirements<br />
under committed bank lines or other term financing; and (iv) having surplus committed lines of credit.<br />
The undrawn committed facilities available to the Group as at the balance sheet date are quantified in note 23; these facilities span a wide number of highly-rated<br />
financial institutions thus minimising any potential exposure arising from concentrations in borrowing sources. The repayment schedule (analysed by maturity date)<br />
applicable to the Group’s outstanding interest-bearing loans and borrowings as at the balance sheet date is also presented in note 23.<br />
92 <strong>CRH</strong>
21. Capital and Financial Risk Management continued<br />
The tables below show the projected contractual undiscounted total cash outflows (principal and interest) arising from the Group’s trade and other payables, gross<br />
debt and derivative financial instruments. The tables also include the gross cash inflows projected to arise from derivative financial instruments. These projections are<br />
based on the interest and foreign exchange rates applying at the end of the relevant financial year.<br />
Between Between Between Between<br />
Within 1 and 2 2 and 3 3 and 4 4 and 5 After<br />
1 year years years years years 5 years Total<br />
€m €m €m €m €m €m €m<br />
At 31st December <strong>2009</strong><br />
Financial liabilities - cash outflows<br />
Trade and other payables 2,471 91 13 14 15 39 2,643<br />
Finance leases 4 2 2 1 1 3 13<br />
Interest-bearing loans and borrowings 377 550 782 507 893 1,911 5,020<br />
Interest payments on finance leases 1 1 1 - - 1 4<br />
Interest payments on interest-bearing loans and borrowings 323 303 241 220 163 464 1,714<br />
Interest rate swaps - net cash outflows 6 6 6 6 5 40 69<br />
Cross-currency swaps - gross cash outflows 790 274 42 427 24 327 1,884<br />
Other derivative financial instruments 3 2 - 1 - - 6<br />
Gross projected cash outflows 3,975 1,229 1,087 1,176 1,101 2,785 11,353<br />
Derivative financial instruments - cash inflows<br />
Interest rate swaps - net cash inflows (114) (111) (72) (57) (37) (132) (523)<br />
Cross-currency swaps - gross cash inflows (776) (257) (26) (424) (23) (289) (1,795)<br />
Other derivative financial instruments (1) (1) - - - - (2)<br />
Gross projected cash inflows (891) (369) (98) (481) (60) (421) (2,320)<br />
The equivalent disclosure for the prior year is as follows:<br />
At 31st December 2008<br />
Financial liabilities - cash outflows<br />
Trade and other payables 2,919 72 14 14 15 41 3,075<br />
Finance leases 6 4 2 1 1 5 19<br />
Interest-bearing loans and borrowings 1,016 1,303 783 1,043 571 2,129 6,845<br />
Interest payments on finance leases 1 1 1 - - 2 5<br />
Interest payments on interest-bearing loans and borrowings 377 323 268 195 169 649 1,981<br />
Cross-currency swaps - gross cash outflows 1,394 42 42 41 428 351 2,298<br />
Other derivative financial instruments 14 4 2 1 - - 21<br />
Gross projected cash outflows 5,727 1,749 1,112 1,295 1,184 3,177 14,244<br />
Derivative financial instruments - cash inflows<br />
Interest rate swaps - net cash inflows (60) (60) (57) (37) (30) (108) (352)<br />
Cross-currency swaps - gross cash inflows (1,342) (34) (34) (33) (438) (291) (2,172)<br />
Other derivative financial instruments (3) - (1) - - - (4)<br />
Gross projected cash inflows (1,405) (94) (92) (70) (468) (399) (2,528)<br />
Commodity price risk<br />
The Group’s exposure to commodity price risk is minimal with the fair value of derivatives used to hedge future energy costs being €5 million unfavourable as at the<br />
balance sheet date (2008: €19 million unfavourable).<br />
<strong>CRH</strong> 93
22. Liquid Investments and Cash and Cash Equivalents<br />
Liquid investments and cash and cash equivalents balances are spread across a wide number of highly-rated financial<br />
institutions with no material concentrations in credit or liquidity risk.<br />
Liquid investments<br />
Liquid investments comprise short-term deposits and current asset investments which are held as readily disposable stores<br />
of value and include investments in government gilts and commercial paper and deposits of less than one year in duration.<br />
The maturity of these investments falls outside the three months timeframe for classification as cash and cash equivalents<br />
under IAS 7 Cash Flow Statements, and accordingly, the related balances have been separately reported in the Consolidated<br />
Balance Sheet and have been categorised as either “held-for-trading” or “loans and receivables” in accordance with IAS 39<br />
Financial Instruments: Recognition and Measurement in the table below. The credit risk attaching to these items is<br />
documented in note 21.<br />
94 <strong>CRH</strong><br />
<strong>2009</strong> 2008<br />
€m €m<br />
Held-for-trading (fair value through profit or loss) 62 127<br />
Loans and receivables 4 1<br />
Total 66 128<br />
Cash and cash equivalents<br />
In accordance with IAS 7, cash and cash equivalents comprise cash balances held for the purposes of meeting short-term<br />
cash commitments and investments which are readily convertible to a known amount of cash and are subject to an<br />
insignificant risk of change in value. Where investments are categorised as cash equivalents, the related balances have a<br />
maturity of three months or less from the date of investment. Bank overdrafts are included within current interest-bearing<br />
loans and borrowings in the Consolidated Balance Sheet.<br />
Cash and cash equivalents are reported at fair value and are analysed as follows:<br />
<strong>2009</strong> 2008<br />
€m €m<br />
Cash at bank and in hand 406 483<br />
Investments (short-term deposits) 966 316<br />
Included in Consolidated Balance Sheet and Consolidated Statement of Cash Flows 1,372 799<br />
Cash at bank earns interest at floating rates based on daily deposit bank rates. Short-term deposits are made for varying<br />
periods of between one day and three months depending on the immediate cash requirements of the Group, and earn<br />
interest at the respective short-term deposit rates.
23. Interest-bearing Loans and Borrowings<br />
<strong>2009</strong> 2008<br />
€m €m<br />
Bank loans and overdrafts:<br />
- unsecured 169 2,250<br />
- secured *<br />
Other term loans:<br />
35 28<br />
- unsecured 4,881 4,754<br />
- secured *<br />
Group share of joint ventures' interest-bearing loans and borrowings (non-current and current):<br />
16 22<br />
- unsecured 198 215<br />
- secured * 25 29<br />
Interest-bearing loans and borrowings (non-current and current) 5,324 7,298<br />
Included in current liabilities in the Consolidated Balance Sheet:<br />
- loans repayable within one year (268) (872)<br />
- bank overdrafts (113) (149)<br />
Current interest-bearing loans and borrowings (381) (1,021)<br />
Non-current interest-bearing loans and borrowings 4,943 6,277<br />
* Secured on specific items of property, plant and equipment; these figures include finance leases<br />
Repayment schedule<br />
Within one year 381 1,021<br />
Between one and two years 570 1,309<br />
Between two and three years 857 811<br />
Between three and four years 547 1,148<br />
Between four and five years 924 631<br />
After five years 2,045 2,378<br />
5,324 7,298<br />
Categorisation by manner of repayment<br />
Loans fully repayable within five years:<br />
- not by instalments 3,135 4,747<br />
- by instalments 124 145<br />
Subtotal<br />
Loans fully repayable in more than five years:<br />
3,259 4,892<br />
- not by instalments 2,037 2,364<br />
- by instalments ** 28 42<br />
Subtotal 2,065 2,406<br />
Interest-bearing loans and borrowings (non-current and current) 5,324 7,298<br />
** €8 million (2008: €14 million) falls due for repayment after five years<br />
<strong>CRH</strong> 95
23. Interest-bearing Loans and Borrowings continued<br />
Borrowing facilities<br />
The Group manages its borrowing ability by entering into committed borrowing agreements. Revolving committed bank<br />
facilities are generally available to the Group for periods of up to five years from the date of inception. The undrawn<br />
committed facilities available as at 31st December <strong>2009</strong> and 31st December 2008, in respect of which all conditions<br />
precedent had been met, mature as follows:<br />
96 <strong>CRH</strong><br />
<strong>2009</strong> 2008<br />
€m €m<br />
Within one year 203 589<br />
Between one and two years 391 519<br />
Between two and three years 782 160<br />
Between three and four years 164 196<br />
Between four and five years 3 53<br />
After five years 26 49<br />
1,569 1,566<br />
Included in the figures above is an amount of €189 million in respect of the Group’s share of facilities available to joint<br />
ventures (2008: €304 million).<br />
Guarantees<br />
The Company has given letters of guarantee to secure obligations of subsidiary undertakings as follows: €5,098 million in<br />
respect of loans, bank advances, derivative obligations and future lease obligations (2008: €7,051 million), €6 million in<br />
respect of deferred and contingent acquisition consideration (2008: €7 million), €319 million in respect of letters of credit<br />
(2008: €419 million) and €43 million in respect of other obligations (2008: €43 million).<br />
Pursuant to the provisions of Section 17, Companies (Amendment) Act, 1986, the Company has guaranteed the liabilities<br />
of its wholly-owned subsidiary undertakings and the Oldcastle Finance Company and Oldcastle North America Funding<br />
Company general partnerships in the Republic of Ireland for the financial year ended 31st December <strong>2009</strong> and, as a result,<br />
such subsidiary undertakings and the general partnerships have been exempted from the filing provisions of Section 7,<br />
Companies (Amendment) Act, 1986 and Regulation 20 of the European Communities (Accounts Regulations), 1993<br />
respectively.<br />
The Company has not guaranteed any debt or other obligations of joint ventures or associates.<br />
Lender covenants<br />
The Group’s major bank facilities and debt issued pursuant to Note Purchase Agreements in private placements require the<br />
Group to maintain certain financial covenants. Non-compliance with financial covenants would give the relevant lenders the<br />
right to terminate facilities and demand early repayment of any sums drawn thereunder thus altering the maturity profile of<br />
the Group’s debt and the Group’s liquidity. Calculations for financial covenants are completed for twelve-month periods<br />
ending quarterly on 31st March, 30th June, 30th September and 31st December. <strong>CRH</strong> was in full compliance with its<br />
financial covenants throughout each of the periods presented. The Group is not aware of any stated events of default.<br />
The financial covenants are:<br />
(1) Minimum interest cover (excluding share of joint ventures) defined as EBITDA/net interest cover at no lower than 4.5<br />
times. As at 31st December <strong>2009</strong> the ratio was 6.1 times (2008: 7.4 times);<br />
(2) Minimum interest cover (excluding share of joint ventures) defined as EBITDA plus rentals/net interest plus rentals at<br />
no lower than 3.0 times. As at 31st December <strong>2009</strong> the ratio was 3.8 times (2008: 4.8 times);<br />
(3) Maximum debt cover (excluding share of joint ventures) defined as consolidated total net debt/EBITDA (taking into<br />
account proforma adjustments for acquisitions and disposals) at no higher than 3.5 times. As at 31st December <strong>2009</strong><br />
the ratio was 2.2 times (2008: 2.4 times).
24. Derivative Financial Instruments<br />
The fair values of derivative financial instruments are analysed by year of maturity and by accounting designation as follows:<br />
At 31st December <strong>2009</strong><br />
Between Between Between Between<br />
Within 1 and 2 2 and 3 3 and 4 4 and 5 After<br />
Total 1 year years years years years 5 years<br />
€m €m €m €m €m €m €m<br />
Assets<br />
Fair value hedges 186 - 18 71 36 27 34<br />
Net investment hedges 4 4 - - - - -<br />
Not designated as hedges (held-for-trading) 59 1 1 - - - 57<br />
249 5 19 71 36 27 91<br />
Analysed as:<br />
Non-current assets 244<br />
Current assets 5<br />
Total 249<br />
Liabilities<br />
Fair value hedges (30) - - - (30) - -<br />
Cash flow hedges (51) (3) (2) - (1) - (45)<br />
Net investment hedges (5) (5) - - - - -<br />
(86) (8) (2) - (31) - (45)<br />
Analysed as:<br />
Non-current liabilities (78)<br />
Current liabilities (8)<br />
Total (86)<br />
Net asset arising on derivative financial instruments 163<br />
The equivalent disclosure for the prior year is as follows:<br />
At 31st December 2008<br />
Assets<br />
Fair value hedges 301 - - 26 100 57 118<br />
Cash flow hedges 2 2 - - - - -<br />
Net investment hedges 7 7 - - - - -<br />
Not designated as hedges (held-for-trading) 116 1 - 1 - - 114<br />
426 10 - 27 100 57 232<br />
Analysed as:<br />
Non-current assets 416<br />
Current assets 10<br />
Total 426<br />
Liabilities<br />
Fair value hedges (40) (26) - - - (14) -<br />
Cash flow hedges (81) (13) (4) (3) (1) - (60)<br />
Net investment hedges (23) (23) - - - - -<br />
Not designated as hedges (held-for-trading) (2) - - - - - (2)<br />
(146) (62) (4) (3) (1) (14) (62)<br />
Analysed as:<br />
Non-current liabilities (84)<br />
Current liabilities (62)<br />
Total (146)<br />
Net asset arising on derivative financial instruments 280<br />
<strong>CRH</strong> 97
24. Derivative Financial Instruments continued<br />
Components of other comprehensive income:<br />
Cash flow hedges:<br />
98 <strong>CRH</strong><br />
<strong>2009</strong> 2008<br />
€m €m<br />
Gains/(losses) arising during the year:<br />
Currency forward contracts - 2<br />
Commodity forward contracts 1 (24)<br />
Reclassification adjustments for (gains)/losses included in:<br />
- the Consolidated Income Statement 16 (6)<br />
- property, plant and equipment (2) -<br />
15 (28)<br />
Fair value hedges consist of interest rate swaps and currency swaps. These instruments hedge risks arising from changes in asset/liability fair values due to interest<br />
rate and foreign exchange rate movements. In accordance with IAS 39 Financial Instruments: Recognition and Measurement, fair value hedges and the related<br />
hedged items are marked-to-market at each reporting date with any movement in the fair values of the hedged item and the hedging instrument being reflected in<br />
the Consolidated Income Statement.<br />
Cash flow hedges consist of forward foreign exchange and commodity contracts and interest rate and currency swaps. These instruments hedge risks arising to<br />
future cash flows from movements in foreign exchange rates, commodity prices and interest rates. Cash flow hedges are expected to affect profit and loss over the<br />
period to maturity. To the extent that the hedging instrument satisfies effectiveness testing, any movements in the fair values of the hedged item and the hedging<br />
instrument are reflected in equity. Ineffectiveness is reflected in the Consolidated Income Statement.<br />
Net investment hedges comprise cross-currency swaps and hedge changes in the value of net investments due to currency movements.<br />
The profit/(loss) arising on fair value, cash flow and net investment hedges reflected in the Consolidated Income Statement is shown below:<br />
<strong>2009</strong> 2008<br />
€m €m<br />
Cash flow hedges - ineffectiveness (6) -<br />
Fair value hedges (108) 284<br />
Fair value of the hedged item 105 (287)<br />
Net investment hedges - ineffectiveness - 2
25. Analysis of Net Debt<br />
Components of and reconciliation of opening to closing net debt<br />
Net debt comprises cash and cash equivalents, liquid investments, derivative financial instrument assets and liabilities and interest-bearing loans and borrowings.<br />
At 1st<br />
At 31st At 31st<br />
January Cash<br />
Mark-to- Translation December December<br />
Book value flow Acquisitions market adjustment Book value Fair value (i)<br />
€m €m €m €m €m €m €m<br />
31st December <strong>2009</strong><br />
Cash and cash equivalents (note 22) 799 589 4 - (20) 1,372 1,372<br />
Liquid investments (note 22) 128 (65) - - 3 66 66<br />
Interest-bearing loans and borrowings (note 23) (7,298) 1,744 (3) 135 98 (5,324) (5,432)<br />
Derivative financial instruments (net) (note 24)<br />
Group net debt (including share of non-recourse debt in<br />
280 (16) - (140) 39 163 163<br />
joint ventures)<br />
Group net debt excluding proportionately consolidated<br />
(6,091) 2,252 1 (5) 120 (3,723) (3,831)<br />
joint ventures (5,938) 2,215 1 (5) 118 (3,609) (3,717)<br />
The equivalent disclosure for the prior year is as follows:<br />
31st December 2008<br />
Cash and cash equivalents (note 22) 1,006 (262) 68 - (13) 799 799<br />
Liquid investments (note 22) 318 (175) - - (15) 128 128<br />
Interest-bearing loans and borrowings (note 23) (6,498) (358) (55) (287) (100) (7,298) (6,324)<br />
Derivative financial instruments (net) (note 24)<br />
Group net debt (including share of non-recourse debt in<br />
11 100 - 281 (112) 280 280<br />
joint ventures)<br />
Group net debt excluding proportionately consolidated<br />
(5,163) (695) 13 (6) (240) (6,091) (5,117)<br />
joint ventures (4,999) (678) (19) (6) (236) (5,938) (4,964)<br />
(i) The fair values of cash and cash equivalents and floating rate loans and borrowings are based on their carrying amounts, which constitute a reasonable<br />
approximation of fair value. The carrying value of liquid investments is the market value of these investments with these values quoted on liquid markets. The<br />
carrying value of derivatives is fair value based on discounted future cash flows at current foreign exchange and interest rates. The fair value of fixed rate debt is<br />
calculated based on actual traded prices for publicly traded debt or discounted future cash flows reflecting market interest rate changes since issuance for other<br />
fixed rate debt.<br />
Fair value hierarchy<br />
The table below analyses financial instruments carried at fair value, by valuation method. The different levels have been defined as follows:<br />
– Level 1: quoted prices (unadjusted) in active markets for identical assets or liabilities<br />
– Level 2: inputs other than quoted prices included within Level 1 that are observable for the asset or liability, either directly (i.e. as prices) or indirectly (i.e. derived<br />
from prices)<br />
– Level 3: inputs for the asset or liability that are not based on observable market data (unobservable inputs)<br />
Level 1 Level 2 Total<br />
€m €m €m<br />
At 31st December <strong>2009</strong><br />
Assets measured at fair value<br />
Fair value hedges - interest rate swaps - 186 186<br />
Net investment hedges - cross currency swaps - 4 4<br />
Not designated as hedges (held-for-trading) - interest rate swaps - 59 59<br />
Held-for-trading (fair value through profit or loss) 62 - 62<br />
62 249 311<br />
Liabilities measured at fair value<br />
Fair value hedges - interest rate swaps - (30) (30)<br />
Cash flow hedges - cross currency swaps - (51) (51)<br />
Liquid investments: Net investment hedges - cross currency swaps - (5) (5)<br />
- (86) (86)<br />
During the reporting period ending 31st December <strong>2009</strong>, there were no transfers between Level 1 and Level 2 fair value measurements, and no transfers into and out<br />
of Level 3 fair value measurements.<br />
<strong>CRH</strong> 99
25. Analysis of Net Debt continued<br />
Currency profile<br />
The currency profile of the Group’s net debt and net worth (capital and reserves attributable to the Company’s equity holders) as at 31st December <strong>2009</strong> is as<br />
follows:<br />
US Pound Swiss<br />
euro Dollar Sterling Franc Other (ii) Total<br />
€m €m €m €m €m €m<br />
Cash and cash equivalents - floating rate 441 678 39 88 126 1,372<br />
Liquid investments - floating rate 24 - 9 - 33 66<br />
Interest-bearing loans and borrowings - fixed rate (775) (3,837) (282) (1) (5) (4,900)<br />
Interest-bearing loans and borrowings - floating rate (200) (117) (27) (4) (76) (424)<br />
Net (debt)/cash by major currency excluding derivative financial instruments (510) (3,276) (261) 83 78 (3,886)<br />
Derivative financial instruments (including mark-to-market) (642) 1,065 227 (352) (135) 163<br />
Net debt by major currency including derivative financial instruments (1,152) (2,211) (34) (269) (57) (3,723)<br />
Non-debt assets and liabilities analysed as follows:<br />
Non-current assets 4,610 6,142 508 700 2,097 14,057<br />
Current assets 1,690 1,856 212 325 456 4,539<br />
Non-current liabilities (706) (1,196) (193) (108) (177) (2,380)<br />
Current liabilities (1,140) (1,009) (184) (213) (237) (2,783)<br />
Minority interest (25) (5) - (8) (35) (73)<br />
Capital and reserves attributable to the Company's equity holders 3,277 3,577 309 427 2,047 9,637<br />
The equivalent disclosure for the prior year is as follows:<br />
Cash and cash equivalents - floating rate 331 174 22 66 206 799<br />
Liquid investments - floating rate 42 43 43 - - 128<br />
Interest-bearing loans and borrowings - fixed rate (34) (4,271) (263) (4) (3) (4,575)<br />
Interest-bearing loans and borrowings - floating rate (1,536) (413) (406) (247) (121) (2,723)<br />
Net (debt)/cash by major currency excluding derivative financial instruments (1,197) (4,467) (604) (185) 82 (6,371)<br />
Derivative financial instruments (including mark-to-market) (1,349) 1,543 542 (300) (156) 280<br />
Net debt by major currency including derivative financial instruments (2,546) (2,924) (62) (485) (74) (6,091)<br />
Non-debt assets and liabilities analysed as follows:<br />
Non-current assets 4,662 6,512 470 790 1,765 14,199<br />
Current assets 2,023 2,337 234 395 580 5,569<br />
Non-current liabilities (629) (1,204) (145) (135) (166) (2,279)<br />
Current liabilities (1,200) (1,365) (181) (196) (299) (3,241)<br />
Minority interest (27) (6) - (8) (29) (70)<br />
Capital and reserves attributable to the Company's equity holders 2,283 3,350 316 361 1,777 8,087<br />
100 <strong>CRH</strong>
25. Analysis of Net Debt continued<br />
Interest profile and analysis of gross debt and effective interest rates<br />
31st December <strong>2009</strong><br />
The fixed rate interest-bearing loans and borrowings including the impact of derivative financial instruments (interest rate and cross-currency swaps) as at 31st<br />
December <strong>2009</strong> are as follows:<br />
US Pound Swiss<br />
euro Dollar Sterling Franc Other (ii) Total<br />
€m €m €m €m €m €m<br />
Interest-bearing loans and borrowings - fixed rate as above (iii) (775) (3,837) (282) (1) (5) (4,900)<br />
Impact of derivative financial instruments on fixed rate debt (568) 2,306 282 - - 2,020<br />
Net fixed rate interest-bearing loans and borrowings (1,343) (1,531) - (1) (5) (2,880)<br />
Weighted average fixed interest rates 6.4% 6.3% - 5.0% 4.6% 6.3%<br />
Weighted average fixed periods - years 4.0 7.6 - 1.7 4.7 5.9<br />
Gross debt by major currency - analysis of effective interest rates<br />
- interest rates excluding derivative financial instruments 6.3% 6.6% 7.7% 2.9% 4.0% 6.5%<br />
- gross debt excluding derivative financial instruments (975) (3,954) (309) (5) (81) (5,324)<br />
- interest rates including derivative financial instruments 6.2% 4.6% 1.5% 0.4% 2.4% 4.7%<br />
- gross debt including derivative financial instruments (1,617) (2,889) (82) (357) (216) (5,161)<br />
The equivalent disclosure for the prior year is as follows:<br />
31st December 2008<br />
The fixed rate interest-bearing loans and borrowings including the impact of derivative financial instruments (interest rate and cross-currency swaps) as at 31st<br />
December 2008 are as follows:<br />
Interest-bearing loans and borrowings - fixed rate as above (iii) (34) (4,271) (263) (4) (3) (4,575)<br />
Impact of derivative financial instruments on fixed rate debt (1,124) 2,553 263 - (22) 1,670<br />
Net fixed rate interest-bearing loans and borrowings (1,158) (1,718) - (4) (25) (2,905)<br />
Weighted average fixed interest rates 5.5% 6.3% - 4.2% 6.6% 5.9%<br />
Weighted average fixed periods - years 4.1 8.5 - 1.5 1.7 6.7<br />
Gross debt by major currency - analysis of effective interest rates<br />
- interest rates excluding derivative financial instruments 6.6% 6.5% 5.6% 2.9% 6.2% 6.3%<br />
- gross debt excluding derivative financial instruments (1,570) (4,684) (669) (251) (124) (7,298)<br />
- interest rates including derivative financial instruments 5.8% 6.1% 3.7% 2.0% 5.8% 5.6%<br />
- gross debt including derivative financial instruments (2,919) (3,141) (127) (551) (280) (7,018)<br />
(ii) The principal currencies included in this category are the Canadian Dollar, the Polish Zloty, the Argentine Peso, the Ukranian Hryvnya, the Israeli Shekel, the Turkish<br />
Lira, the Chinese Renminbi and the Indian Rupee.<br />
(iii) Of the Group’s gross fixed rate debt at 31st December <strong>2009</strong>, €2,913 million (2008: €2,892 million) was hedged to floating rate at inception using interest rate<br />
swaps. In accordance with IAS 39 Financial Instruments: Recognition and Measurement, hedged fixed rate debt is recorded at amortised cost adjusted for the<br />
change in value arising from changes in underlying market interest rates and the related hedging instruments (interest rate swaps) are stated at fair value.<br />
Adjustments to fixed rate debt values and the changes in the fair value of the hedging instrument are reflected in the Consolidated Income Statement. The balance<br />
of gross fixed rate debt of €1,987 million (2008: €1,683 million) are financial liabilities measured at amortised cost in accordance with IAS 39.<br />
Floating rate debt comprises bank borrowings and finance leases bearing interest at rates set in advance for periods ranging from overnight to less than one year<br />
largely by reference to inter-bank interest rates (US$ LIBOR, Sterling LIBOR, Swiss Franc LIBOR and Euribor).<br />
Gains and losses arising on the re-translation of net worth are dealt with in the Consolidated Statement of Comprehensive Income. Transactional currency exposures<br />
arise in a number of the Group’s operations and these result in net currency gains and losses which are recognised in the Consolidated Income Statement and are<br />
immaterial (with materiality defined in the context of the year-end <strong>2009</strong> financial statements).<br />
<strong>CRH</strong> 101
26. Provisions for Liabilities<br />
Net present cost<br />
102 <strong>CRH</strong><br />
At 1st<br />
January<br />
Translation<br />
adjustment<br />
Arising on<br />
acquisition<br />
Provided<br />
during<br />
year<br />
Utilised<br />
during<br />
year<br />
Reversed<br />
unused<br />
Discount<br />
unwinding<br />
(note 8)<br />
At 31st<br />
December<br />
€m €m €m €m €m €m €m €m<br />
31st December <strong>2009</strong><br />
Insurance (i) 214 (3) - 88 (108) - 10 201<br />
Environment and remediation (ii) 67 (1) - 2 (5) - 2 65<br />
Rationalisation and redundancy (iii) 19 - - 114 (109) - 1 25<br />
Other (iv) 89 - 1 11 (28) (6) 2 69<br />
Total 389 (4) 1 215 (250) (6) 15 360<br />
Analysed as:<br />
Non-current liabilities 253 240<br />
Current liabilities 136 120<br />
Total 389 360<br />
The equivalent disclosure for the prior year is as follows:<br />
31st December 2008<br />
Insurance (i) 209 7 1 66 (79) - 10 214<br />
Environment and remediation (ii) 64 3 1 9 (11) (1) 2 67<br />
Rationalisation and redundancy (iii) 13 - - 23 (17) (1) 1 19<br />
Other (iv) 103 (2) 2 22 (27) (12) 3 89<br />
Total 389 8 4 120 (134) (14) 16 389<br />
Analysed as:<br />
Non-current liabilities 248 253<br />
Current liabilities 141 136<br />
Total 389 389<br />
(i) Insurance<br />
This provision relates to workers’ compensation (employers’ liability) and third-party liabilities or claims covered under the Group’s self-insurance schemes.<br />
Reflecting the operation of these self-insurance schemes, a substantial portion of the total provision relates to claims which are classified as incurred but not<br />
reported in respect of which the Group will bear an excess which will not be recoverable from insurers. In addition, due to the extended timeframe which is typically<br />
involved in such claims, a significant component of the total provision is subject to actuarial valuation through the application of historical claims triangles. Where<br />
actuarial valuation is either inappropriate or impractical, other external assessments are made. The claims triangles applied in valuation indicate that these<br />
provisions have an average life of four years (2008: three years).<br />
(ii) Environment and remediation<br />
This provision comprises obligations governing site remediation and improvement costs to be incurred in compliance with either local or national environmental<br />
regulations together with constructive obligations stemming from established best practice. Whilst a significant element of the total provision will reverse in the<br />
medium-term (two to ten years), the majority of the legal and constructive obligations applicable to long-lived assets (principally mineral-bearing land) will unwind<br />
over a 30-year timeframe. In discounting the related obligations, expected future cash outflows have been determined with due regard to extraction status and<br />
anticipated remaining life.<br />
(iii) Rationalisation and redundancy<br />
These provisions relate to irrevocable commitments under various rationalisation and redundancy programmes, none of which is individually material to the Group.<br />
The increased amount provided and utilised in <strong>2009</strong> reflects the additional cost reduction initiatives undertaken during the year. The Group expects that these<br />
provisions will be utilised within two years (2008: three years) of the balance sheet date.<br />
(iv) Other<br />
This includes provisions relating to guarantees and warranties of €20 million (2008: €22 million) throughout the Group at 31st December <strong>2009</strong>. The Group expects<br />
that these provisions will be utilised within three years of the balance sheet date (2008: four years).<br />
All provisions are discounted at a rate of 5% (2008: 5%), derived primarily from the average effective interest rate for the Group’s borrowings.
27. Deferred Income Tax<br />
The deductible and taxable temporary differences at the balance sheet date in respect of which deferred tax has been recognised are analysed as follows:<br />
<strong>2009</strong> 2008<br />
€m €m<br />
Deferred income tax assets (deductible temporary differences)<br />
Deficits on Group defined benefit pension obligations (note 28) 103 94<br />
Revaluation of derivative financial instruments to fair value 21 13<br />
Share-based payment expense 9 4<br />
Provisions for liabilities and working capital related items 157 206<br />
Other deductible temporary differences 47 16<br />
Total 337 333<br />
Deferred income tax assets have been recognised in respect of all deductible temporary differences.<br />
Deferred income tax liabilities (taxable temporary differences)<br />
Taxable temporary differences principally attributable to accelerated tax depreciation and fair value adjustments arising on acquisition (i) 1,498 1,441<br />
Revaluation of derivative financial instruments to fair value 1 1<br />
Rolled-over capital gains 20 19<br />
Total 1,519 1,461<br />
(i) Fair value adjustments arising on acquisition principally relate to property, plant and equipment.<br />
Movement in net deferred income tax liability<br />
At 1st January 1,128 976<br />
Translation adjustment (26) 17<br />
Net charge for the year (note 10) 98 89<br />
Arising on acquisition (note 32) (2) 81<br />
Movement in deferred tax asset on Group defined benefit pension obligations (20) (67)<br />
Movement in deferred tax asset on share-based payment expense (2) 15<br />
Movement in deferred tax liability on cash flow hedges 2 (4)<br />
Reclassification 4 21<br />
At 31st December 1,182 1,128<br />
28. Retirement Benefit Obligations<br />
The Group operates either defined benefit or defined contribution pension schemes in all of its principal operating areas. Scheme assets are held in separate trustee<br />
administered funds.<br />
At the year-end, €46 million (2008: €43 million) was included in other payables in respect of defined contribution pension liabilities and €1 million (2008: €1 million) was<br />
included in other receivables in respect of defined contribution pension prepayments.<br />
The Group operates defined benefit pension schemes in the Republic of Ireland, Britain and Northern Ireland, the Netherlands, Belgium, Germany, Portugal, Switzerland<br />
and the United States; for the purposes of the disclosures which follow, the schemes in the Republic of Ireland, the Netherlands, Belgium, Germany and Portugal (49%<br />
joint venture) have been aggregated into a “eurozone” category on the basis of common currency and financial assumptions. In line with the principle of proportionate<br />
consolidation, the assets, liabilities, income and expenses attaching to defined benefit pension schemes in joint ventures are reflected in the figures below on the basis<br />
of the Group’s share of these entities. The majority of the defined benefit pension schemes operated by the Group are funded as disclosed in the analysis of the defined<br />
benefit obligation presented below with unfunded schemes restricted to one scheme in each of the Netherlands, Portugal and the United States and four schemes in<br />
Germany.<br />
In addition to the aforementioned defined benefit pension schemes, provision has been made in the financial statements for post-retirement healthcare obligations in<br />
respect of certain current and former employees principally in the United States and in Portugal and for long-term service commitments in respect of certain employees<br />
in the eurozone and Switzerland. These obligations are unfunded in nature and the required disclosures are set out below.<br />
In all cases, the projected unit credit method has been employed in determining the present value of the obligations arising, the related current service cost and, where<br />
applicable, past service cost.<br />
The cumulative actuarial gains and losses attributable to the Group’s defined benefit pension scheme obligations at 1st January 2004 (the date of transition to IFRS)<br />
were recognised in full as at that date and adjusted against retained income. Actuarial gains and losses and the associated movement in the net deferred tax asset<br />
are recognised via the Consolidated Statement of Comprehensive Income.<br />
<strong>CRH</strong> 103
28. Retirement Benefit Obligations continued<br />
Actuarial valuations - funding requirements<br />
The funding requirements in relation to the Group’s defined benefit schemes are assessed in accordance with the advice of independent and qualified actuaries and<br />
valuations are prepared in this regard either annually, where local requirements mandate that this be done, or at triennial intervals at a maximum in all other cases. In<br />
Ireland and Britain, either the attained age or projected unit credit methods are used in the valuations. In the Netherlands and Switzerland, the actuarial valuations<br />
reflect the current unit method, while the valuations are performed in accordance with the projected unit credit methodology in Portugal and Germany. In the United<br />
States, valuations are performed using a variety of actuarial cost methodologies - current unit, projected unit and aggregate cost. The actuarial valuations range<br />
from April 2006 to December <strong>2009</strong>.<br />
The assumptions which have the most significant effect on the results of the actuarial valuations are those relating to the rate of return on investments and the rates<br />
of increase in remuneration and pensions. In the course of preparing the funding valuations, it was assumed that the rate of return on investments would, on average,<br />
exceed annual remuneration increases by 2% and pension increases by 3% per annum. In general, actuarial valuations are not available for public inspection; however,<br />
the results of valuations are advised to the members of the various schemes.<br />
Financial assumptions<br />
The financial assumptions employed in the valuation of the defined benefit liabilities arising on pension schemes, post-retirement healthcare obligations and<br />
long-term service commitments applying the projected unit credit methodology are as follows:<br />
Scheme liabilities<br />
The major long-term assumptions used by the Group’s actuaries in the computation of scheme liabilities as at 31st December <strong>2009</strong> and 31st December 2008 are<br />
as follows:<br />
Britain and<br />
Eurozone Northern Ireland Switzerland United States<br />
<strong>2009</strong> 2008 <strong>2009</strong> 2008 <strong>2009</strong> 2008 <strong>2009</strong> 2008<br />
% % % % % % % %<br />
Rate of increase in:<br />
- salaries 4.00 3.80 4.50 3.50 2.25 2.25 3.50 3.50<br />
- pensions in payment 2.00 1.80 3.50-3.70 2.75-3.25 0.50 0.50 - -<br />
Inflation 2.00 1.80 3.50 2.75 1.50 1.50 2.00 2.00<br />
Discount rate 6.00 5.80 5.75 6.25 3.25 3.50 5.75 6.25<br />
Medical cost trend rate 5.25 5.25 n/a n/a n/a n/a 9.50 10.00<br />
The mortality assumptions employed in determining the present value of scheme liabilities under IAS 19 are in accordance with the underlying funding valuations and<br />
represented actuarial best practice in the relevant jurisdictions taking account of mortality experience and industry circumstances. With regard to the most material of the<br />
Group’s schemes, the future life expectations factored into the relevant valuations based on retirement at 65 years of age for current and future retirees, are as follows:<br />
104 <strong>CRH</strong><br />
Republic of<br />
Ireland<br />
Britain and<br />
Northern Ireland Switzerland<br />
<strong>2009</strong> 2008 <strong>2009</strong> 2008 <strong>2009</strong> 2008<br />
Current retirees<br />
- male 20.7 19.8 22.7 21.9 18.5 18.4<br />
- female 23.8 22.8 25.5 24.6 22.0 21.9<br />
Future retirees<br />
- male 21.8 20.8 24.5 22.4 18.5 18.4<br />
- female 24.8 23.8 27.2 25.1 22.0 21.9<br />
The above data allow for future improvements in life expectancy.<br />
Scheme assets<br />
The long-term rates of return expected at 31st December <strong>2009</strong> and 31st December 2008, determined in conjunction with the Group’s actuaries and analysed by class<br />
of investment, are as follows:<br />
Eurozone<br />
Britain and<br />
Northern Ireland Switzerland United States<br />
<strong>2009</strong> 2008 <strong>2009</strong> 2008 <strong>2009</strong> 2008 <strong>2009</strong> 2008<br />
% % % % % % % %<br />
Equities 8.00 9.00 8.00 9.00 6.75 7.50 8.00 9.00<br />
Bonds 4.50 4.25 5.00 4.75 2.75 3.25 5.50 6.00<br />
Property 7.00 7.00 7.00 7.00 4.75 4.50 7.00 7.00<br />
Other 2.50 2.50 2.50 2.50 2.50 2.50 2.50 2.50<br />
The methodology applied in relation to the expected return on equities is driven by prevailing risk-free rates in the four jurisdictions listed and the application of an<br />
equity risk premium (which varies by country) to those rates. The differences between the expected return on bonds and the yields used to discount the liabilities in<br />
each of the four jurisdictions listed are driven by the fact that the majority of the Group’s schemes hold an amalgam of government and corporate bonds. The property<br />
and “other” (largely cash holdings) components of the asset portfolio are not material. In all cases, the reasonableness of the assumed rates of return is assessed by<br />
reference to actual and target asset allocations in the long-term and the Group’s overall investment strategy as articulated to the trustees of the various defined benefit<br />
pension schemes in operation.
28. Retirement Benefit Obligations continued<br />
(a) Impact on Consolidated Income Statement<br />
The total expense charged to the Consolidated Income Statement in respect of defined contribution and defined benefit pension schemes, post-retirement healthcare<br />
obligations and long-term service commitments is as follows:<br />
Analysis of defined benefit expense<br />
The total defined benefit expense (comprising funded and unfunded defined benefit pension schemes and unfunded post-retirement healthcare obligations and longterm<br />
service commitments) is analysed as follows:<br />
Eurozone<br />
Britain and<br />
Northern Ireland Switzerland United States Total Group<br />
<strong>2009</strong> 2008 <strong>2009</strong> 2008 <strong>2009</strong> 2008 <strong>2009</strong> 2008 <strong>2009</strong> 2008<br />
€m €m €m €m €m €m €m €m €m €m<br />
Charged in arriving at Group operating profit<br />
Current service cost 13 18 8 11 17 16 6 6 44 51<br />
Past service cost: benefit enhancements 11 (2) - 1 - 2 1 - 12 1<br />
Curtailment gain (i) - - (1) (2) - - (23) - (24) (2)<br />
Subtotal 24 16 7 10 17 18 (16) 6 32 50<br />
Included in finance revenue and finance costs respectively<br />
<strong>2009</strong> 2008<br />
€m €m<br />
Total defined contribution pension expense 139 141<br />
Defined benefit<br />
Pension schemes (funded and unfunded) 39 35<br />
Long-term service commitments (unfunded) 1 -<br />
Total defined benefit expense 40 35<br />
Total expense in Consolidated Income Statement 179 176<br />
Expected return on scheme assets (35) (52) (23) (30) (20) (21) (9) (10) (87) (113)<br />
Interest cost on scheme liabilities 42 45 24 27 17 16 12 10 95 98<br />
Subtotal 7 (7) 1 (3) (3) (5) 3 - 8 (15)<br />
Net charge to Consolidated Income Statement 31 9 8 7 14 13 (13) 6 40 35<br />
Actual return on pension scheme assets 70 (200) 63 (82) 45 (48) 22 (34) 200 (364)<br />
(i) During <strong>2009</strong>, the Group closed certain of its defined benefit pension schemes in the United States to future accrual, giving rise to a curtailment gain of €23 million<br />
and a reduction in liabilities of the same amount. In compensation for the closure to future accrual, provision has been made for additional defined contribution<br />
top-up payments amounting to €11 million; this obligation is reflected in the <strong>2009</strong> defined contribution expense of €139 million presented above.<br />
Based on the assumptions employed for the valuation of assets and liabilities at year-end <strong>2009</strong>, and excluding the once-off past-service costs and curtailment gains<br />
recognised above of €12 million, the net charge in the 2010 Consolidated Income Statement is anticipated to exhibit a small increase from the <strong>2009</strong> figure of €52<br />
million at constant exchange rates.<br />
No reimbursement rights have been recognised as assets in accordance with IAS 19 Employee Benefits.<br />
<strong>CRH</strong> 105
28. Retirement Benefit Obligations continued<br />
(b) Impact on Consolidated Balance Sheet<br />
The net pension liability (comprising funded and unfunded defined benefit pension schemes and unfunded post-retirement healthcare obligations and long-term<br />
service commitments) as at 31st December <strong>2009</strong> and 31st December 2008 is analysed as follows:<br />
106 <strong>CRH</strong><br />
Eurozone<br />
Britain and<br />
Northern Ireland Switzerland United States Total Group<br />
<strong>2009</strong> 2008 <strong>2009</strong> 2008 <strong>2009</strong> 2008 <strong>2009</strong> 2008 <strong>2009</strong> 2008<br />
€m €m €m €m €m €m €m €m €m €m<br />
Equities 318 258 215 169 133 94 78 58 744 579<br />
Bonds 209 214 144 114 230 216 51 50 634 594<br />
Property 35 49 14 12 85 99 - - 134 160<br />
Other 22 10 11 5 56 59 4 7 93 81<br />
Bid value of assets 584 531 384 300 504 468 133 115 1,605 1,414<br />
Actuarial value of liabilities (present value) (814) (759) (534) (372) (519) (500) (192) (197) (2,059) (1,828)<br />
Recoverable deficit in schemes (230) (228) (150) (72) (15) (32) (59) (82) (454) (414)<br />
Related deferred income tax asset 35 35 42 20 3 7 23 32 103 94<br />
Net pension liability (195) (193) (108) (52) (12) (25) (36) (50) (351) (320)<br />
Analysis of liabilities - funded and unfunded<br />
Funded<br />
Defined benefit pension schemes<br />
Unfunded<br />
(770) (715) (534) (372) (514) (495) (180) (186) (1,998) (1,768)<br />
Defined benefit pension schemes (29) (29) - - - - (5) (4) (34) (33)<br />
Total - defined benefit pension schemes (799) (744) (534) (372) (514) (495) (185) (190) (2,032) (1,801)<br />
Post-retirement healthcare obligations (unfunded) (7) (8) - - - - (7) (7) (14) (15)<br />
Long-term service commitments (unfunded) (8) (7) - - (5) (5) - - (13) (12)<br />
Actuarial value of liabilities (present value) (814) (759) (534) (372) (519) (500) (192) (197) (2,059) (1,828)<br />
The assumption made in relation to discount rates is a material source of estimation uncertainty as defined in IAS 1 Presentation of Financial Statements. The impact<br />
of a reduction of 25 basis points in the discount rates applied would be as follows with a corresponding increase in discount rates being inversely proportional:<br />
Revised discount rate 5.75 5.55 5.50 6.00 3.00 3.25 5.50 6.00 n/a n/a<br />
Revised liabilities figure (842) (789) (562) (392) (540) (519) (198) (204) (2,142) (1,904)<br />
Split of asset values % % % % % % % % % %<br />
Equities 54.4 48.6 56.0 56.3 26.4 20.1 58.6 50.4 46.4 41.0<br />
Bonds 35.8 40.3 37.5 38.0 45.6 46.2 38.4 43.5 39.5 42.0<br />
Property 6.0 9.2 3.6 4.0 16.9 21.1 - - 8.3 11.3<br />
Other 3.8 1.9 2.9 1.7 11.1 12.6 3.0 6.1 5.8 5.7<br />
Total 100 100 100 100 100 100 100 100 100 100<br />
The asset values above include €3 million in respect of investment in Ordinary Shares of the Company (<strong>CRH</strong> plc) as at 31st December <strong>2009</strong> (2008: €3 million).<br />
Analysis of amounts included in the Consolidated Statement of Comprehensive Income<br />
Actual return less expected return on scheme assets<br />
Experience (loss)/gain arising on scheme liabilities<br />
35 (252) 40 (112) 25 (69) 13 (44) 113 (477)<br />
(present value)<br />
(12) (11) (5) (3) 7 1 (3) (2) (13) (15)<br />
Assumptions (loss)/gain arising on scheme liabilities<br />
(present value) (21) 59 (117) 61 (17) 17 (12) (3) (167) 134<br />
Asset limit adjustment - - - - - 10 - - - 10<br />
Actuarial gain/(loss) recognised 2 (204) (82) (54) 15 (41) (2) (49) (67) (348)
28. Retirement Benefit Obligations continued<br />
Actuarial gains and losses recognised in the Consolidated Statement of Comprehensive Income<br />
Eurozone<br />
Britain and<br />
Northern Ireland Switzerland United States Total Group<br />
<strong>2009</strong> 2008 <strong>2009</strong> 2008 <strong>2009</strong> 2008 <strong>2009</strong> 2008 <strong>2009</strong> 2008<br />
€m €m €m €m €m €m €m €m €m €m<br />
Actual return less expected return on scheme assets 35 (252) 40 (112) 25 (69) 13 (44) 113 (477)<br />
% of scheme assets 6.0% (47.5%) 10.4% (37.3%) 5.0% (14.7%) 9.8% (38.3%) 7.0% (33.7%)<br />
Experience (loss)/gain arising on scheme liabilities<br />
(present value) (12) (11) (5) (3) 7 1 (3) (2) (13) (15)<br />
% of scheme liabilities (present value) 1.5% 1.4% 0.9% 0.8% (1.3%) (0.2%) 1.6% 1.0% 0.6% 0.8%<br />
Actuarial gain/(loss) recognised 2 (204) (82) (54) 15 (41) (2) (49) (67) (348)<br />
% of scheme liabilities (present value) (0.2%) 26.9% 15.4% 14.5% (2.9%) 8.2% 1.0% 24.9% 3.3% 19.0%<br />
The cumulative actuarial loss recognised in the Consolidated Statement of Comprehensive Income, following transition to IFRS on 1st January 2004, is as follows:<br />
Recognised in 2004 financial year (119)<br />
Recognised in 2005 financial year (86)<br />
Recognised in 2006 financial year 155<br />
Recognised in 2007 financial year 159<br />
Recognised in 2008 financial year (348)<br />
Recognised in <strong>2009</strong> financial year (67)<br />
Cumulative actuarial loss recognised (306)<br />
€m<br />
<strong>CRH</strong> 107
28. Retirement Benefit Obligations continued<br />
108 <strong>CRH</strong><br />
Eurozone<br />
Britain and<br />
Northern Ireland Switzerland United States Total Group<br />
<strong>2009</strong> 2008 <strong>2009</strong> 2008 <strong>2009</strong> 2008 <strong>2009</strong> 2008 <strong>2009</strong> 2008<br />
€m €m €m €m €m €m €m €m €m €m<br />
Reconciliation of scheme assets (bid value)<br />
At 1st January<br />
Movement in year<br />
531 767 300 478 468 458 115 143 1,414 1,846<br />
Translation adjustment - - 22 (97) 1 51 (5) 6 18 (40)<br />
Arising on acquisition (note 32) - - - - - 10 - - - 10<br />
Employer contributions paid 27 17 18 20 15 15 10 7 70 59<br />
Contributions paid by plan participants 4 5 2 4 10 10 - - 16 19<br />
Benefit payments (48) (58) (21) (23) (35) (28) (9) (7) (113) (116)<br />
Actual return on scheme assets 70 (200) 63 (82) 45 (48) 22 (34) 200 (364)<br />
At 31st December 584 531 384 300 504 468 133 115 1,605 1,414<br />
Reconciliation of actuarial value of liabilities<br />
At 1st January<br />
Movement in year<br />
(759) (793) (372) (526) (500) (439) (197) (173) (1,828) (1,931)<br />
Translation adjustment - - (28) 114 - (51) 7 (10) (21) 53<br />
Arising on acquisition (note 32) - (6) - - - (12) - - - (18)<br />
Current service cost (13) (18) (8) (11) (17) (16) (6) (6) (44) (51)<br />
Contributions paid by plan participants (4) (5) (2) (4) (10) (10) - - (16) (19)<br />
Benefit payments 48 58 21 23 35 28 9 7 113 116<br />
Past service cost: benefit enhancements (11) 2 - (1) - (2) (1) - (12) (1)<br />
Interest cost on scheme liabilities<br />
Actuarial (loss)/gain arising on:<br />
(42) (45) (24) (27) (17) (16) (12) (10) (95) (98)<br />
- experience variations (12) (11) (5) (3) 7 1 (3) (2) (13) (15)<br />
- changes in assumptions (21) 59 (117) 61 (17) 17 (12) (3) (167) 134<br />
Curtailment gain - - 1 2 - - 23 - 24 2<br />
At 31st December (814) (759) (534) (372) (519) (500) (192) (197) (2,059) (1,828)<br />
Anticipated employer contributions payable in the 2010 financial year (expressed using average exchange rates for <strong>2009</strong>) amount to €65 million in aggregate; the<br />
difference between the actual employer contributions paid in <strong>2009</strong> and the expectation of €55 million included in the 2008 <strong>Annual</strong> <strong>Report</strong> is largely attributable to a<br />
cash payment pertaining to the benefit enhancement of €11 million in the eurozone and movements in exchange rates. Employer contributions are reflected in the<br />
reconciliation of scheme assets as paid.<br />
<strong>2009</strong> 2008 2007 2006 2005<br />
€m €m €m €m €m<br />
History of scheme assets, liabilities and actuarial gains and losses<br />
Bid value of assets 1,605 1,414 1,846 1,739 1,771<br />
Actuarial value of liabilities (present value) (2,059) (1,828) (1,931) (2,001) (2,221)<br />
Asset limit adjustment - - (10) - -<br />
Recoverable deficit (454) (414) (95) (262) (450)<br />
Actual return less expected return on scheme assets 113 (477) (61) 45 177<br />
% of scheme assets 7.0% (33.7%) (3.3%) 2.6% 10.0%<br />
Experience (loss)/gain arising on scheme liabilities (present value) (13) (15) (25) (6) 42<br />
% of scheme liabilities (present value) 0.6% 0.8% 1.3% 0.3% (1.9%)<br />
Post-retirement healthcare benefits - sensitivity analysis on key actuarial assumptions<br />
The impact of the sensitivity analysis on the key actuarial assumptions employed in the valuation of post-retirement healthcare benefits as required under IAS 19<br />
Employee Benefits is not material to the Group (with materiality defined in the context of the year-end <strong>2009</strong> financial statements).
29. Capital Grants<br />
<strong>2009</strong> 2008<br />
€m €m<br />
At 1st January 14 11<br />
Arising on acquisition (note 32) - 2<br />
Received - 4<br />
14 17<br />
Released to Consolidated Income Statement (2) (3)<br />
At 31st December 12 14<br />
30. Share Capital and Reserves<br />
Ordinary<br />
Shares of<br />
€0.32 each<br />
<strong>2009</strong> 2008<br />
Income<br />
Shares of<br />
€0.02 each<br />
Ordinary<br />
Shares of<br />
€0.32 each<br />
Income<br />
Shares of<br />
€0.02 each<br />
Equity Share Capital (i) (ii) (i) (ii)<br />
€m €m €m €m<br />
Authorised<br />
At 1st January 235 15 235 15<br />
Increase in authorised share capital 85 5 - -<br />
At 31st December 320 20 235 15<br />
Number of Shares at 1st January ('000s) 735,000 735,000 735,000 735,000<br />
Increase in number of Shares 265,000 265,000 - -<br />
Number of Shares at 31st December ('000s) 1,000,000 1,000,000 735,000 735,000<br />
Allotted, called-up and fully paid<br />
At 1st January 175 11 175 11<br />
Rights Issue (iii) 49 3 - -<br />
Share options and share participation schemes (iv) - - - -<br />
Shares issued in lieu of dividends (v) 3 - - -<br />
At 31st December 227 14 175 11<br />
The movement in the number of shares (expressed in '000s) during the financial year was as follows:<br />
At 1st January 548,502 548,502 547,208 547,208<br />
Rights Issue (iii) 152,088 152,088 - -<br />
Share options and share participation schemes (iv) - - 401 401<br />
Shares issued in lieu of dividends (v) 9,895 9,895 893 893<br />
At 31st December 710,485 710,485 548,502 548,502<br />
(i) Ordinary Shares<br />
The Ordinary Shares represent 93.66% of the total issued share capital.<br />
(ii) Income Shares<br />
The Income Shares, which represent 5.85% of the total issued share capital, were created on 29th August 1988 for the express purpose of giving shareholders<br />
the choice of receiving dividends on either their Ordinary Shares or on their Income Shares (by notice of election to the Company). The Income Shares carried a<br />
different tax credit to the Ordinary Shares. The creation of the Income Shares was achieved by the allotment of fully paid Income Shares to each shareholder equal<br />
to his/her holding of Ordinary Shares but the shareholder is not entitled to an Income Share certificate, as a certificate for Ordinary Shares is deemed to include<br />
an equal number of Income Shares and a shareholder may only sell, transfer or transmit Income Shares with an equivalent number of Ordinary Shares. Income<br />
Shares carry no voting rights. Due to changes in Irish tax legislation since the creation of the Income Shares, dividends on the Company’s shares no longer carry<br />
a tax credit. As elections made by shareholders to receive dividends on their holding of Income Shares were no longer relevant, the Articles of Association were<br />
amended on 8th May 2002 to cancel such elections.<br />
(iii) Rights Issue<br />
152,087,952 new Ordinary/Income Shares were issued in March <strong>2009</strong> at €8.40 per share under the terms of a Rights Issue on the basis of two new Ordinary/<br />
Income Shares for every seven existing Ordinary/Income Shares (excluding Treasury Shares). The aggregate nominal value of the Shares issued was €52 million<br />
and the total consideration amounted to €1.24 billion net of associated expenses.<br />
<strong>CRH</strong> 109
30. Share Capital and Reserves continued<br />
(iv) Share schemes<br />
Share option schemes<br />
Details of share options granted under the Company’s share option schemes and savings-related share option schemes and the terms attaching thereto are<br />
provided in note 7 to the financial statements. Under these schemes, options over a total of 3,680,876 Ordinary Shares were exercised during the financial year<br />
(2008: 2,046,216). Of this total, 3,553,043 (2008: 1,944,501) were satisfied by the re-issue of Treasury Shares and 127,833 (2008: 82,335) by the purchase of<br />
Ordinary Shares on the market by the Employee Benefit Trust. No new shares were issued in <strong>2009</strong> to satisfy share options exercised during the financial year<br />
(2008: 19,380).<br />
Share participation schemes<br />
At 31st December <strong>2009</strong>, 6,778,469 (2008: 6,466,707) Ordinary Shares had been appropriated to participation schemes. In the financial year ended 31st<br />
December <strong>2009</strong>, the appropriation of 311,762 shares was satisfied by the re-issue of Treasury Shares (2008: 55,849). The Ordinary Shares appropriated pursuant<br />
to these schemes were issued at market value on the dates of appropriation. The shares issued pursuant to these schemes are excluded from the scope of IFRS<br />
2 Share-based Payment and are hence not factored into the expense computation and the associated disclosures in note 7.<br />
During the ten-year period commencing on 3rd May 2000, the total number of Ordinary Shares which may be issued in respect of the share option schemes, the<br />
savings-related share option schemes, the share participation schemes and any subsequent share option schemes, may not exceed 15% in aggregate of the<br />
issued Ordinary share capital from time to time.<br />
(v) Shares issued in lieu of dividends<br />
In May <strong>2009</strong>, 6,588,110 (2008: 893,242) Ordinary Shares were issued to the holders of Ordinary Shares who elected to receive additional Ordinary Shares at a<br />
price of €13.83 (2008: €24.15) per share, instead of part or all of the cash element of their 2008 and 2007 final dividends. In November <strong>2009</strong>, 3,307,480 (2008:<br />
nil) Ordinary Shares were issued to the holders of Ordinary Shares who elected to receive additional Ordinary Shares at a price of €17.20 per share, instead of<br />
part or all of the cash element of their <strong>2009</strong> interim dividend. The 2008 interim dividend was paid wholly in cash.<br />
110 <strong>CRH</strong><br />
5%<br />
Cumulative<br />
Preference<br />
Shares of<br />
€1.27 each<br />
7% ‘A’<br />
Cumulative<br />
Preference<br />
Shares of<br />
€1.27 each<br />
Preference Share Capital (vi) (vii)<br />
€m €m<br />
Authorised<br />
At 1st January <strong>2009</strong> and 31st December <strong>2009</strong> - 1<br />
Number of Shares at 1st January <strong>2009</strong> and 31st December <strong>2009</strong> ('000s) 150 872<br />
Allotted, called-up and fully paid<br />
At 1st January <strong>2009</strong> and 31st December <strong>2009</strong> - 1<br />
Number of Shares at 1st January <strong>2009</strong> and 31st December <strong>2009</strong> ('000s) 50 872<br />
There was no movement in the number of cumulative preference shares in either the current or the prior year.<br />
(vi) 5% Cumulative Preference Shares<br />
The holders of the 5% Cumulative Preference Shares are entitled to a fixed cumulative preference dividend at a rate of 5% per annum and priority in a winding-up<br />
to repayment of capital, but have no further right to participate in profits or assets and are not entitled to be present or vote at general meetings unless their<br />
dividend is in arrears. Dividends on the 5% Cumulative Preference Shares are payable half-yearly on 15th April and 15th October in each year. The 5% Cumulative<br />
Preference Shares represent 0.03% of the total issued share capital.<br />
(vii) 7% ‘A’ Cumulative Preference Shares<br />
The holders of the 7% ‘A’ Cumulative Preference Shares are entitled to a fixed cumulative preference dividend at a rate of 7% per annum, and subject to the rights<br />
of the holders of the 5% Cumulative Preference Shares, priority in a winding-up to repayment of capital but have no further right to participate in profits or assets<br />
and are not entitled to be present or vote at general meetings unless their dividend is in arrears or unless the business of the meeting includes certain matters,<br />
which are specified in the Articles of Association. Dividends on the 7% ‘A’ Cumulative Preference Shares are payable half-yearly on 5th April and 5th October in<br />
each year. The 7% ‘A’ Cumulative Preference Shares represent 0.46% of the total issued share capital.
30. Share Capital and Reserves continued<br />
Treasury Shares/own shares <strong>2009</strong> 2008<br />
€m €m<br />
At 1st January (378) (19)<br />
Performance Share Plan expense - 7<br />
Shares acquired by <strong>CRH</strong> plc (Treasury Shares) - (411)<br />
Treasury/own shares re-issued 114 48<br />
Shares acquired by Employee Benefit Trust (own shares) (2) (3)<br />
Reclassification of Performance Share Plan expense (13) -<br />
At 31st December (279) (378)<br />
As at the balance sheet date, the total number of Treasury Shares held was 12,339,200 (2008: 16,204,005); the nominal value of these shares was €4 million (2008:<br />
€6 million). During the year ended 31st December <strong>2009</strong>, 3,864,805 Shares were re-issued (2008: 2,000,350) to satisfy exercises and appropriations under the Group’s<br />
share option and share participation schemes (see (iv) above). These re-issued Treasury Shares were previously purchased at an average price of €25.35 (2008:<br />
€23.94). No Treasury Shares were purchased during the year ended 31st December <strong>2009</strong> (2008: 18,204,355).<br />
In accordance with the terms of the Performance Share Plan (see note 7), which was approved by shareholders at the 2006 <strong>Annual</strong> General Meeting, Ordinary Shares<br />
have been purchased by the Employee Benefit Trust on behalf of <strong>CRH</strong> plc. The number of these shares held as at the balance sheet date was as follows:<br />
Ordinary shares<br />
<strong>2009</strong> 2008<br />
At 1st January 937,750 937,750<br />
Released to the participants of the Performance Share Plan (474,997) -<br />
At 31st December 462,753 937,750<br />
The nominal value of own shares, on which dividends have been waived by the Trustees of the Performance Share Plan, amounted to €0.2 million at 31st December<br />
<strong>2009</strong> (2008: €0.3 million).<br />
In accordance with section 148(8) of the Companies Act, 1963 and section 7(1A) of the Companies (Amendment) Act, 1986, the Company is availing of the exemption<br />
from presenting its individual profit and loss account to the <strong>Annual</strong> General Meeting and from filing it with the Registrar of Companies.<br />
Reconciliation of shares issued to proceeds shown in Consolidated Statement of Cash Flows<br />
<strong>2009</strong> 2008<br />
€m €m<br />
Shares issued at nominal amount:<br />
- shares issued in respect of Rights Issue 52 -<br />
- share options and share participation schemes - -<br />
- shares issued in lieu of dividends 3 -<br />
Premium on shares issued 1,370 28<br />
Total value of shares issued 1,425 28<br />
Shares issued in lieu of dividends (note 11) (148) (22)<br />
Proceeds from issue of shares 1,277 6<br />
Expenses paid in respect of share issues (40) -<br />
Net proceeds from issue of shares - Consolidated Statement of Cash Flows 1,237 6<br />
Share Premium<br />
<strong>2009</strong> 2008<br />
€m €m<br />
At 1st January 2,448 2,420<br />
Premium arising on shares issued 1,370 28<br />
Expenses paid in respect of shares issued (40) -<br />
At 31st December 3,778 2,448<br />
<strong>CRH</strong> 111
31. Commitments under Operating and Finance Leases<br />
Operating leases<br />
Future minimum rentals payable under non-cancellable operating leases at 31st December are as follows:<br />
112 <strong>CRH</strong><br />
<strong>2009</strong> 2008<br />
€m €m<br />
Within one year 230 240<br />
After one year but not more than five years 506 548<br />
More than five years 358 396<br />
1,094 1,184<br />
Finance leases<br />
Future minimum lease payments under finance leases together with the present value of the net minimum lease payments are as follows:<br />
<strong>2009</strong><br />
Present<br />
2008<br />
Minimum value of Minimum<br />
payments payments payments<br />
Present<br />
value of<br />
payments<br />
€m €m €m €m<br />
Within one year 5 4 8 6<br />
After one year but not more than five years 8 6 10 8<br />
More than five years 4 3 5 5<br />
Total minimum lease payments 17 23<br />
Less: amounts allocated to future finance costs (4) (4)<br />
Present value of minimum lease payments 13 13 19 19<br />
32. Acquisition of Subsidiaries and Joint Ventures<br />
The principal acquisitions completed during the year ended 31st December <strong>2009</strong> by reportable segment, together with the completion dates, are detailed below;<br />
these transactions entailed the acquisition of a 100% stake where not indicated to the contrary:<br />
Europe Materials<br />
Poland: Increased stake in Grupa Silikaty to 73.2% (27th August); Portugal: Quimipedra quarry (23rd April).<br />
Europe Distribution<br />
Belgium: Creyns N.V. (8th January).<br />
Americas Materials<br />
Kansas: Holland Corporation (11th May); Kentucky: Cat Daddy (29th July); Missouri: Hilty Quarries (2nd November), selected assets of Lafarge (30th December); New<br />
Hampshire: Interstate 93 (26th March); New York: Cleason (30th July); Texas: Wheeler Companies (11th December); Utah: Backus Pit (10th July); Burdick Paving<br />
Corporation (24th December); West Virginia: certain assets of Appalachian Paving Products (5th March).<br />
Americas Distribution<br />
Utah: Warburton Acoustical Products (11th March).
32. Acquisition of Subsidiaries and Joint Ventures continued<br />
The identifiable net assets acquired excluding net debt assumed and including adjustments to provisional fair values were as follows:<br />
<strong>2009</strong> 2008<br />
€m €m<br />
Assets<br />
Non-current assets<br />
Property, plant and equipment 110 429<br />
Intangible assets: - goodwill 64 366<br />
- excess of fair value of identifiable net assets over consideration paid - (6)<br />
- other intangible assets 2 52<br />
Investments in associates - 1<br />
Other financial assets - 2<br />
Deferred income tax assets 4 1<br />
Total non-current assets 180 845<br />
Current assets<br />
Inventories 11 66<br />
Trade and other receivables 22 126<br />
Total current assets 33 192<br />
Equity<br />
Minority interest (4) 4<br />
Total equity (4) 4<br />
Liabilities<br />
Non-current liabilities<br />
Deferred income tax liabilities (2) (82)<br />
Retirement benefit obligations - (8)<br />
Provisions for liabilities (stated at net present cost) (1) -<br />
Capital grants - (2)<br />
Total non-current liabilities (3) (92)<br />
Current liabilities<br />
Trade and other payables (14) (89)<br />
Current income tax liabilities - (12)<br />
Provisions for liabilities (stated at net present cost) - (4)<br />
Total current liabilities (14) (105)<br />
Total consideration (enterprise value) 192 844<br />
Consideration satisfied by<br />
Cash payments 178 837<br />
Professional fees incurred on business combinations - 8<br />
Cash and cash equivalents acquired on acquisition (4) (68)<br />
Net cash outflow<br />
Net debt (other than cash and cash equivalents) assumed on acquisition:<br />
174 777<br />
- non-current interest-bearing loans and borrowings and finance leases 2 9<br />
- current interest-bearing loans and borrowings and finance leases 1 46<br />
Deferred and contingent acquisition consideration (stated at net present cost) 8 12<br />
Associate becoming a subsidiary (note 15) 7 -<br />
Total consideration (enterprise value) 192 844<br />
None of the acquisitions completed during the financial year was considered sufficiently material to warrant separate disclosure of the attributable fair values. No<br />
contingent liabilities were recognised on the acquisitions completed during the financial year or the prior financial year. The principal factor contributing to the<br />
recognition of goodwill on acquisitions entered into by the Group is the realisation of cost savings and synergies with existing entities in the Group.<br />
<strong>CRH</strong> 113
32. Acquisition of Subsidiaries and Joint Ventures continued<br />
The carrying amounts of the assets and liabilities acquired determined in accordance with IFRS before completion of the acquisition, together with the adjustments<br />
made to those carrying values to arrive at the fair values disclosed above, were as follows:<br />
Accounting Adjustments<br />
Book Fair value policy to provisional<br />
Fair<br />
values adjustment alignments fair values value<br />
€m €m €m €m €m<br />
Non-current assets (excluding goodwill) 87 28 - 1 116<br />
Current assets 33 1 - (1) 33<br />
Non-current liabilities (2) (1) - - (3)<br />
Current liabilities (15) 1 - - (14)<br />
Minority interest - (4) - - (4)<br />
Identifiable net assets acquired (excluding goodwill and net debt assumed) 103 25 - - 128<br />
Goodwill arising on acquisition 91 (25) - (2) 64<br />
Total consideration (enterprise value) 194 - - (2) 192<br />
The initial assignment of fair values to identifiable net assets acquired has been performed on a provisional basis in respect of a number of the acquisitions disclosed<br />
above given the timing of closure of these deals; any amendments to these fair values made during the subsequent reporting window (within the twelve-month<br />
timeframe from the acquisition date imposed by IFRS 3) will be subject to subsequent disclosure.<br />
The following table analyses the 14 acquisitions (2008: 52 acquisitions) by reportable segment and provides details of the goodwill and consideration figures arising<br />
in each of those segments:<br />
Number Goodwill Consideration<br />
<strong>2009</strong> 2008 <strong>2009</strong> 2008 <strong>2009</strong> 2008<br />
€m €m €m €m<br />
<strong>Report</strong>able segments<br />
Europe Materials 2 8 2 125 20 293<br />
Europe Products - 9 - 111 - 202<br />
Europe Distribution 1 7 4 57 9 177<br />
Americas Materials 10 19 60 32 164 101<br />
Americas Products - 8 - 18 - 52<br />
Americas Distribution 1 1 - 4 1 8<br />
14 52 66 347 194 833<br />
The post-acquisition impact of acquisitions completed during the year on Group profit for the financial year was as follows:<br />
The revenue and profit of the Group for the financial year determined in accordance with IFRS as though the acquisition date for all acquisitions effected during the<br />
year had been the beginning of that year would be as follows:<br />
Pro-forma <strong>2009</strong><br />
114 <strong>CRH</strong><br />
<strong>2009</strong> 2008<br />
€m €m<br />
Revenue 43 530<br />
Cost of sales (35) (392)<br />
Gross profit 8 138<br />
Operating costs (5) (85)<br />
Group operating profit 3 53<br />
Profit on disposal of non-current assets - -<br />
Profit before finance costs 3 53<br />
Finance costs (net) (1) (26)<br />
Profit before tax 2 27<br />
Income tax expense (1) (8)<br />
Group profit for the financial year 1 19<br />
<strong>CRH</strong> Group Pro-forma<br />
<strong>2009</strong> excluding <strong>2009</strong> consolidated Pro-forma<br />
acquisitions acquisitions Group 2008<br />
€m €m €m €m<br />
Revenue 188 17,330 17,518 21,174<br />
Group profit for the financial year 19 597 616 1,271<br />
There have been no acquisitions completed subsequent to the balance sheet date which would be individually material to the Group, thereby requiring disclosure<br />
under either IFRS 3 or IAS 10 Events after the Balance Sheet Date. Development updates, giving details of acquisitions which do not require separate disclosure, are<br />
published in January and July each year.
33. Related Party Transactions<br />
The principal related party relationships requiring disclosure in the Consolidated Financial Statements of the Group under<br />
IAS 24 Related Party Disclosures pertain to: the existence of subsidiaries, joint ventures and associates; transactions with<br />
these entities entered into by the Group; and the identification and compensation of key management personnel.<br />
Subsidiaries, joint ventures and associates<br />
The Consolidated Financial Statements include the financial statements of the Company (<strong>CRH</strong> plc, the ultimate parent) and<br />
its subsidiaries, joint ventures and associates as documented in the accounting policies on pages 66 to 71. The Group’s<br />
principal subsidiaries, joint ventures and associates are disclosed on pages 124 to 129.<br />
Sales to and purchases from, together with outstanding payables to and receivables from, subsidiaries and joint ventures<br />
are eliminated in the preparation of the Consolidated Financial Statements (either in full or to the extent of the Group’s<br />
interest) in accordance with IAS 27 Consolidated and Separate Financial Statements and IAS 31 Interests in Joint Ventures.<br />
The amounts in respect of joint ventures are immaterial in the context of the year-end <strong>2009</strong> financial statements. Loans<br />
extended by the Group to joint ventures and associates (see note 15) are included in financial assets (whilst the Group’s<br />
share of the corresponding loans payable by joint ventures is included in interest-bearing loans and borrowings due to the<br />
application of proportionate consolidation in accounting for the Group’s interests in these entities). Sales to and purchases<br />
from associates during the financial year ended 31st December <strong>2009</strong> amounted to €17 million (2008: €17 million) and €458<br />
million (2008: €584 million) respectively. Amounts receivable from and payable to associates (arising from the aforementioned<br />
sales and purchases transactions) as at the balance sheet date are included as separate line items in notes 18 and 19 to<br />
the Consolidated Financial Statements.<br />
Terms and conditions of transactions with subsidiaries, joint ventures and associates<br />
In general, the transfer pricing policy implemented by the Group across its subsidiaries is market-based. Sales to and<br />
purchases from other related parties (being joint ventures and associates) are conducted in the ordinary course of business<br />
and on terms equivalent to those that prevail in arm’s-length transactions. The outstanding balances included in receivables<br />
and payables as at the balance sheet date in respect of transactions with associates are unsecured and settlement arises in<br />
cash. No guarantees have been either requested or provided in relation to related party receivables and payables. Loans to<br />
joint ventures and associates (the respective amounts being disclosed in note 15) are extended on normal commercial terms<br />
in the ordinary course of business with interest accruing and, in general, paid to the Group at predetermined intervals.<br />
Key management personnel<br />
For the purposes of the disclosure requirements of IAS 24, the term “key management personnel” (i.e. those persons having<br />
authority and responsibility for planning, directing and controlling the activities of the Company) comprises the Board of<br />
Directors which manages the business and affairs of the Company. As identified in the <strong>Report</strong> on Directors’ Remuneration<br />
on pages 51 to 59, the Directors, other than the non-executive Directors, serve as executive officers of the Company. Full<br />
disclosure in relation to the <strong>2009</strong> and 2008 compensation entitlements of the Board of Directors is provided in the <strong>Report</strong><br />
on Directors’ Remuneration with disclosure of the share-based payment expense relating to the Board of Directors provided<br />
in note 7 to the Consolidated Financial Statements. Other than these compensation entitlements, there were no other<br />
transactions involving key management personnel.<br />
34. Board Approval<br />
The Board of Directors approved and authorised for issue the financial statements on pages 62 to 115 in respect of the year<br />
ended 31st December <strong>2009</strong> on 1st March 2010.<br />
<strong>CRH</strong> 115
116 <strong>CRH</strong><br />
Company Balance Sheet<br />
as at 31st December <strong>2009</strong> <strong>2009</strong> 2008<br />
€m €m<br />
Notes<br />
2<br />
Non-current assets<br />
Financial assets 491 460<br />
Current assets<br />
3 Debtors 7,922 5,683<br />
Cash at bank and in hand 152 149<br />
8,074 5,832<br />
4<br />
Creditors (amounts falling due within one year)<br />
Trade and other creditors 2,814 1,636<br />
Corporation tax liability - 2<br />
Bank loans and overdrafts 2 1<br />
2,816 1,639<br />
Total assets less liabilities 5,749 4,653<br />
6<br />
Capital and reserves<br />
Called-up share capital 241 186<br />
6 Preference share capital 1 1<br />
6 Share premium 3,782 2,452<br />
7 Treasury Shares and own shares (279) (378)<br />
7 Revaluation reserve 42 42<br />
7 Other reserves 118 827<br />
7 Profit and loss account 1,844 1,523<br />
Shareholders' funds 5,749 4,653<br />
K. McGowan, M. Lee, Directors
Notes to the Company Balance Sheet<br />
1. Accounting Policies<br />
Basis of accounting<br />
The financial statements have been prepared under the historical cost convention in accordance with the Companies Acts,<br />
1963 to <strong>2009</strong> and Generally Accepted Accounting Practice in the Republic of Ireland (“Irish GAAP”). The following paragraphs<br />
describe the principal accounting policies under Irish GAAP, which have been applied consistently.<br />
Operating income and expense<br />
Operating income and expense arises from the Company’s principal activities as a holding company for the Group and is<br />
accounted for on an accruals basis.<br />
Financial assets<br />
Fixed asset investments, including investments in subsidiaries, are stated at cost (and at valuation at 31st December 1980<br />
for those investments in existence at that date) less any accumulated impairments and are reviewed for impairment if there<br />
are indications that the carrying value may not be recoverable.<br />
Foreign currencies<br />
The reporting currency of the Company is euro. Transactions in foreign currencies are translated at the rates of exchange<br />
ruling at the transaction date. Monetary assets and liabilities denominated in foreign currencies are translated into euro at the<br />
rates of exchange ruling at the balance sheet date, with a corresponding charge or credit to the profit and loss account.<br />
Share issue expenses and share premium account<br />
Costs of share issues are written-off against the premium arising on issues of share capital.<br />
Share-based payments<br />
The Company has applied the requirements of FRS 20 Share-based Payment.<br />
The accounting policy applicable to share-based payments is consistent with that applied under IFRS and is accordingly<br />
addressed in detail on page 68 of the Consolidated Financial Statements.<br />
Cash flow statement<br />
The Company has taken advantage of the exemption afforded by FRS 1 Cash Flow Statements not to provide a statement<br />
of cash flows.<br />
Treasury Shares and own shares<br />
Treasury Shares<br />
Own equity instruments (i.e. Ordinary Shares) acquired by the Company are deducted from equity and presented on the<br />
face of the Company Balance Sheet. No gain or loss is recognised in profit or loss on the purchase, sale, issue or cancellation<br />
of the Company’s Ordinary Shares.<br />
Own shares<br />
Ordinary Shares purchased by the Employee Benefit Trust on behalf of the Company under the terms of the Performance<br />
Share Plan are recorded as a deduction from equity on the face of the Company Balance Sheet.<br />
Dividends<br />
Dividends on Ordinary Shares are recognised as a liability in the Company’s Financial Statements in the period in which they<br />
are declared by the Company.<br />
<strong>CRH</strong> 117
2. Financial Assets<br />
The Company’s investment in its subsidiaries is as follows:<br />
118 <strong>CRH</strong><br />
<strong>2009</strong><br />
Shares (i) Other Total<br />
€m €m €m<br />
At 1st January <strong>2009</strong> at cost/valuation 377 83 460<br />
Capital contribution in respect of share-based payments - 34 34<br />
Impairment (3) - (3)<br />
At 31st December <strong>2009</strong> at cost/valuation 374 117 491<br />
The equivalent disclosure for the prior year is as follows:<br />
2008<br />
Shares (i) Other Total<br />
€m €m €m<br />
At 1st January 2008 at cost/valuation 251 60 311<br />
Additions 126 - 126<br />
Capital contribution in respect of share-based payments - 23 23<br />
At 31st December 2008 at cost/valuation 377 83 460<br />
(i) The Company’s investment in shares in its subsidiaries was revalued at 31st December 1980 to reflect the surplus on<br />
revaluation of certain property, plant and equipment (land and buildings) of subsidiaries. The original historical cost of<br />
the shares equated to approximately €9 million. The analysis of the closing balance between amounts carried at<br />
valuation and at cost is as follows:<br />
<strong>2009</strong> 2008<br />
€m €m<br />
At valuation 31st December 1980 47 47<br />
At cost post 31st December 1980 327 330<br />
Total 374 377<br />
3. Debtors<br />
<strong>2009</strong> 2008<br />
€m €m<br />
Amounts owed by subsidiary undertakings 7,922 5,683<br />
4. Trade and Other Creditors<br />
<strong>2009</strong> 2008<br />
€m €m<br />
Amounts falling due within one year<br />
Amounts owed to subsidiary undertakings 2,814 1,636<br />
5. Dividends Proposed (Memorandum Disclosure)<br />
Details in respect of dividends proposed of €307 million (2008: €258 million) are presented in the dividends note (note 11)<br />
on page 83 of the notes to the Consolidated Financial Statements.<br />
6. Called-up Share Capital<br />
Details in respect of called-up share capital, Treasury Shares and own shares are presented in the share capital and reserves<br />
note (note 30) on pages 109 to 111 of the notes to the Consolidated Financial Statements.
7. Movement in Shareholders’ Funds<br />
Issued<br />
share<br />
capital<br />
Share<br />
premium<br />
account<br />
Treasury<br />
Shares/<br />
own shares<br />
<strong>2009</strong><br />
Revaluation<br />
reserve<br />
Other<br />
reserves<br />
Profit<br />
and loss<br />
account<br />
€m €m €m €m €m €m<br />
At 1st January <strong>2009</strong> 187 2,452 (378) 42 827 1,523<br />
Currency translation effects - - - - - 1<br />
Issue of share capital (net of expenses) 55 1,330 - - - -<br />
Transfer to profit and loss account - - - - (750) 750<br />
Profit after tax before dividends - - - - - 10<br />
Treasury/own shares re-issued - - 114 - - (114)<br />
Shares acquired by Employee Benefit Trust (own shares) - - (2) - - -<br />
Share option exercises - - - - - 60<br />
Share-based payment expense - - - - 28 -<br />
Reclassification of Performance Share Plan expense - - (13) - 13 -<br />
Dividends (including shares issued in lieu of dividends) - - - - - (386)<br />
At 31st December <strong>2009</strong> 242 3,782 (279) 42 118 1,844<br />
Issued<br />
share<br />
capital<br />
Share<br />
premium<br />
account<br />
Treasury<br />
Shares/<br />
own shares<br />
2008<br />
Revaluation<br />
reserve<br />
Other<br />
reserves<br />
Profit<br />
and loss<br />
account<br />
€m €m €m €m €m €m<br />
At 1st January 2008 187 2,424 (19) 42 60 812<br />
Currency translation effects - - - - - 4<br />
Issue of share capital (net of expenses) - 28 - - - -<br />
Profit after tax before dividends - - - - 750 1,093<br />
Shares acquired by <strong>CRH</strong> plc (Treasury Shares) - - (411) - - -<br />
Treasury/own shares re-issued - - 48 - - (48)<br />
Shares acquired by Employee Benefit Trust (own shares) - - (3) - - -<br />
Share option exercises - - - - - 31<br />
Share-based payment expense - - 7 - 17 -<br />
Dividends (including shares issued in lieu of dividends) - - - - - (369)<br />
At 31st December 2008 187 2,452 (378) 42 827 1,523<br />
In accordance with section 148(8) of the Companies Act, 1963 and section 7(1A) of the Companies (Amendment) Act, 1986, the Company is availing of the exemption<br />
from presenting its individual profit and loss account to the <strong>Annual</strong> General Meeting and from filing it with the Registrar of Companies. The loss retained for the financial<br />
year dealt with in the Company Financial Statements amounted to €376 million (2008: profit retained of €1,474 million).<br />
8. Share-based Payments<br />
The total expense of €28 million (2008: €24 million) reflected in note 7 to the Consolidated Financial Statements attributable to employee share options and the<br />
Performance Share Plan has been included as a capital contribution in financial assets (note 2) in addition to any payments to/from subsidiaries.<br />
9. Section 17 Guarantees<br />
Pursuant to the provisions of Section 17, Companies (Amendment) Act, 1986, the Company has guaranteed the liabilities of its wholly-owned subsidiary undertakings<br />
and the Oldcastle Finance Company and Oldcastle North America Funding Company general partnerships in the Republic of Ireland for the financial year ended 31st<br />
December <strong>2009</strong> and, as a result, such subsidiary undertakings and the general partnerships have been exempted from the filing provisions of Section 7, Companies<br />
(Amendment) Act, 1986 and Regulation 20 of the European Communities (Accounts Regulations), 1993 respectively.<br />
The Company has not guaranteed any debt or other obligations of joint ventures or associates.<br />
Details in relation to other guarantees provided by the Company are provided in the interest-bearing loans and borrowings note (note 23) on pages 95 and 96 of the<br />
notes to the Consolidated Financial Statements.<br />
10. Related Party Transactions<br />
The Company has taken advantage of the exemption in FRS 8 not to disclose transactions with wholly-owned subsidiaries.<br />
11. Approval by Board<br />
The Board of Directors approved and authorised for issue the Company Financial Statements on pages 116 to 119 in respect of the year ended 31st December <strong>2009</strong><br />
on 1st March 2010.<br />
<strong>CRH</strong> 119
120 <strong>CRH</strong><br />
Shareholder Information<br />
Dividend payments<br />
An interim dividend of 18.5c was paid in respect of Ordinary Shares on 30th<br />
October <strong>2009</strong>.<br />
A final dividend of 44.0c, if approved, will be paid in respect of Ordinary Shares<br />
on 10th May 2010. A scrip alternative will be offered to shareholders.<br />
Dividend Withholding Tax (DWT) must be deducted from dividends paid by an<br />
Irish resident company, unless a shareholder is entitled to an exemption and has<br />
submitted a properly completed exemption form to the Company’s Registrars,<br />
Capita Registrars. DWT applies to dividends paid by way of cash or by way of<br />
shares under a scrip dividend scheme and is deducted at the standard rate of<br />
Income Tax (currently 20%). Non-resident shareholders and certain Irish<br />
companies, trusts, pension schemes, investment undertakings and charities may<br />
be entitled to claim exemption from DWT. Copies of the form may be obtained<br />
from Capita Registrars. Shareholders should note that DWT will be deducted<br />
from dividends in cases where a properly completed form has not been received<br />
by the record date for a dividend. Individuals who are resident in Ireland for tax<br />
purposes are not entitled to an exemption.<br />
Shareholders who wish to have their dividend paid direct to a bank account, by<br />
electronic funds transfer, should contact Capita Registrars to obtain a mandate<br />
form. Tax vouchers will be sent to the shareholder’s registered address under this<br />
arrangement.<br />
Dividends are generally paid in euro. However, in order to avoid costs to<br />
shareholders, dividends are paid in Sterling and US Dollars to shareholders<br />
whose address, according to the Share Register, is in the UK and the United<br />
States respectively, unless they require otherwise.<br />
As the above arrangements can be inflexible for institutional shareholders, where<br />
shares are held in CREST, dividends are automatically paid in euro unless a<br />
currency election is made. CREST members should use the facility in CREST to<br />
make currency elections. Such elections must be made in respect of entire<br />
holdings as partial elections are not permissible.<br />
Dividends in respect of 7% ‘A’ Cumulative Preference Shares are paid half-yearly<br />
on 5th April and 5th October. Dividends in respect of 5% Cumulative Preference<br />
Shares are paid half-yearly on 15th April and 15th October.
CREST<br />
Transfer of the Company’s shares takes place through the CREST system.<br />
Shareholders have the choice of holding their shares in electronic form or in the<br />
form of share certificates.<br />
Share price data<br />
<strong>2009</strong> 2008<br />
€ €<br />
Share price at 31st December 19.01 16.10*<br />
Market capitalisation<br />
Share price movement<br />
13.3bn 9.5bn<br />
during the year: - high 20.70 24.50*<br />
- low 12.55 12.44*<br />
* Restated for the bonus element of the 2 for 7 Rights Issue in March <strong>2009</strong>.<br />
Shareholdings as at 31st December <strong>2009</strong><br />
Ownership of Ordinary Shares<br />
Geographic location *<br />
Number of<br />
shares held<br />
‘000<br />
% of<br />
total<br />
Ireland 59,925 8<br />
United Kingdom 107,910 15<br />
United States 254,154 36<br />
Europe/Other 194,077 27<br />
Retail 82,081 12<br />
Treasury 12,338 2<br />
710,485 100<br />
* This represents a best estimate of the number of shares controlled by fund<br />
managers resident in the geographic regions indicated. Private shareholders<br />
are classified as retail above.<br />
Holdings<br />
Number of<br />
shareholders<br />
% of<br />
total<br />
Number of<br />
shares held<br />
‘000<br />
% of<br />
total<br />
1 - 1,000 17,261 59.25 6,217 0.87<br />
1,001 - 10,000 10,166 34.90 29,539 4.16<br />
10,001 - 100,000 1,360 4.67 35,077 4.94<br />
100,001 - 1,000,000 262 0.90 82,449 11.60<br />
Over 1,000,000 82 0.28 557,203 78.43<br />
29,131 100 710,485 100<br />
Stock Exchange listings<br />
<strong>CRH</strong> has primary listings on the Irish and London Stock Exchanges. The Group’s<br />
American Depositary Shares (ADSs), each representing one Ordinary Share, are<br />
listed on the New York Stock Exchange (NYSE). The ADSs are evidenced by<br />
American Depositary Receipts.<br />
Financial calendar<br />
Announcement of final results for <strong>2009</strong> 2nd March 2010<br />
Ex-dividend date 10th March 2010<br />
Record date for dividend 12th March 2010<br />
Latest date for receipt of scrip forms 23rd April 2010<br />
Interim Management Statement 5th May 2010<br />
<strong>Annual</strong> General Meeting<br />
Dividend payment date and first day of dealing<br />
5th May 2010<br />
in scrip dividend shares 10th May 2010<br />
Trading Update Statement 7th July 2010<br />
Announcement of interim results for 2010 24th August 2010<br />
Interim Management Statement 9th November 2010<br />
Website<br />
The Group’s website, www.crh.com, provides the full text of the <strong>Annual</strong> and<br />
Interim <strong>Report</strong>s, the <strong>Annual</strong> <strong>Report</strong> on Form 20-F, which is filed annually with the<br />
United States Securities and Exchange Commission, trading statements, interim<br />
management statements and copies of presentations to analysts and investors.<br />
News releases are made available, in the News & Media section of the website,<br />
immediately after release to the Stock Exchanges.<br />
Electronic communications<br />
Following the introduction of the 2007 Transparency Regulations, and in order to<br />
adopt a more environmentally friendly and cost effective approach, the Company<br />
provides the <strong>Annual</strong> <strong>Report</strong> to shareholders electronically via the <strong>CRH</strong> website,<br />
www.crh.com, and only sends a printed copy to those shareholders who<br />
specifically request a copy. Shareholders who choose to do so can receive other<br />
shareholder communications, for example, notices of General Meetings and<br />
shareholder circulars, electronically. However, shareholders will continue to<br />
receive printed proxy forms, dividend documentation and, if the Company deems<br />
it appropriate, other documentation by post. Shareholders can alter the method<br />
by which they receive communications by contacting Capita Registrars.<br />
Electronic proxy voting<br />
Shareholders may lodge a proxy form for the 2010 <strong>Annual</strong> General Meeting<br />
electronically. Shareholders who wish to submit proxies via the internet may do so<br />
by accessing <strong>CRH</strong>’s, or Capita Registrars’, website as described below.<br />
Shareholders must register for this service on-line before proxy forms can be<br />
lodged electronically.<br />
CREST members wishing to appoint a proxy via CREST should refer to the<br />
CREST Manual and the notes to the Notice of the <strong>Annual</strong> General Meeting.<br />
Registrars<br />
Enquiries concerning shareholdings should be addressed to:<br />
Capita Registrars,<br />
P.O. Box 7117,<br />
Dublin 2,<br />
Ireland.<br />
Telephone: +353 (0) 1 810 2400<br />
Fax: +353 (0) 1 810 2422<br />
Shareholders with access to the internet may check their accounts either by<br />
accessing <strong>CRH</strong>’s website and selecting “Registrars” under “Shareholder Services”<br />
in the Investor Relations section or by accessing Capita Registrars’ website,<br />
www.capitaregistrars.ie and selecting “Login to Shareholder Services” under<br />
“Online Services”. This facility allows shareholders to check their shareholdings<br />
and dividend payments, register e-mail addresses and download standard forms<br />
required to initiate changes in details held by Capita Registrars. Shareholders will<br />
need to register for a User ID before using some of the services.<br />
American Depositary Receipts (ADRs)<br />
The ADR programme is administered by the Bank of New York Mellon and<br />
enquiries regarding ADRs should be addressed to:<br />
BNY Mellon Shareowner Services,<br />
P.O. Box 358516,<br />
Pittsburgh,<br />
PA 15252-8516,<br />
U.S.A.<br />
Telephone: Toll Free Number (United States residents): 1-888-269-2377<br />
International: +1 201-680-6825<br />
E-mail: shrrelations@bnymellon.com<br />
Website: http://www.bnymellon.com/shareowner<br />
Frequently Asked Questions (FAQ)<br />
The Group’s website contains answers to questions frequently asked by<br />
shareholders, including questions regarding shareholdings, dividend payments,<br />
electronic communications and shareholder rights. The FAQ can be accessed in<br />
the Investor Relations section of the website under “Shareholder Services”.<br />
<strong>CRH</strong> 121
Management<br />
Senior Group Staff<br />
Myles Lee<br />
Chief Executive<br />
Albert Manifold<br />
Chief Operating Officer<br />
Glenn Culpepper<br />
Finance Director<br />
Neil Colgan<br />
Company Secretary<br />
Colm Bannon<br />
Group Technical Advisor<br />
Maeve Carton<br />
Head of Group Finance<br />
Jack Golden<br />
Group HR Director<br />
Rossa McCann<br />
Group Treasurer<br />
Éimear O’Flynn<br />
Head of Investor Relations<br />
Pat O’Shea<br />
Group Taxation Director<br />
122 <strong>CRH</strong><br />
Europe<br />
Materials<br />
Henry Morris<br />
Managing Director<br />
Ken McKnight<br />
Regional Director<br />
Ireland and Asia<br />
Declan Maguire<br />
Regional Director<br />
Europe South<br />
Alan Connolly<br />
Finance Director<br />
Eamon Geraghty<br />
Technical Director<br />
Philip Wheatley<br />
Development Director<br />
John Corbett<br />
Human Resources Director<br />
John McKeon<br />
Procurement Director<br />
John Madden<br />
Cement Operations Manager<br />
Ireland<br />
Jim Mintern<br />
Country Manager<br />
Ireland<br />
Seamus Lynch<br />
Managing Director<br />
Irish Cement<br />
Pat McCleery<br />
Managing Director<br />
Premier Periclase<br />
Larry Byrne<br />
Managing Director<br />
Clogrennane Lime<br />
Frank Byrne<br />
Managing Director<br />
Roadstone Wood Group<br />
Mark Lowry<br />
Managing Director<br />
Northstone<br />
Benelux<br />
Jan Boon<br />
Managing Director<br />
Cementbouw<br />
Poland<br />
Owen Rowley<br />
Country Manager<br />
Mossy O’Connor<br />
Cement Director<br />
Mariusz Bogacz<br />
Concrete Products Director<br />
Brian Walsh<br />
Aggs, Blacktop & Lime<br />
Director<br />
Poland & Slovakia<br />
Andrzej Ptak<br />
President<br />
Grupa O . z arów<br />
Michal Jankowski<br />
President<br />
ZPW Trzuskawica<br />
Ukraine<br />
Michael O’Sullivan<br />
Country Director<br />
Finland<br />
David Dillon<br />
Country Manager<br />
Kalervo Matikainen<br />
Managing Director<br />
Finnsementti<br />
Lauri Kivekäs<br />
Managing Director<br />
Rudus<br />
Switzerland<br />
Urs Sandmeier<br />
Country Manager<br />
Spain<br />
Sebastia Alegre<br />
Managing Director<br />
Beton Catalan<br />
Turkey & Portugal<br />
Frank Heisterkamp<br />
Country Manager<br />
China<br />
Peter Buckley<br />
Country Director<br />
India<br />
Oliver Mahon<br />
Country Director<br />
Tony Macken<br />
Country Manager<br />
Products & Distribution<br />
Máirtín Clarke<br />
Managing Director<br />
Edwin Bouwman<br />
Finance Director<br />
Michael Stirling<br />
Human Resources Director<br />
Concrete Products<br />
Rudy Aertgeerts<br />
Managing Director<br />
Kees Verburg<br />
Finance Director<br />
Peter Eigenhuis<br />
Human Resources Director<br />
Edwin van den Berg<br />
Managing Director<br />
Landscaping Products<br />
Alain Kirchmeyer<br />
Managing Director<br />
Civil Networks<br />
Claus Bering<br />
Managing Director<br />
Structural Products<br />
Clay Products<br />
Wayne Sheppard<br />
Managing Director<br />
Clay Products & Ibstock Brick<br />
Geoff Bull<br />
Finance Director<br />
Jan van Ommen<br />
Managing Director<br />
Clay Mainland Europe<br />
Ruud van den Akker<br />
Managing Director<br />
Kooy<br />
Grzegorz Ploska<br />
Managing Director<br />
<strong>CRH</strong> Klinkier<br />
Richard Lee<br />
Managing Director<br />
Supreme<br />
Building Products<br />
Marc St. Nicolaas<br />
Managing Director<br />
Walter de Backer<br />
Finance Director<br />
Peter Liesker<br />
Human Resources Director<br />
Dirk Vael<br />
Managing Director<br />
Construction Accessories–<br />
Engineered Products<br />
Jean-Luc Bernard<br />
Managing Director<br />
Construction Accessories–<br />
Convenience Products<br />
Henk Dibbets<br />
Managing Director<br />
Fencing & Security<br />
Kees-Jan van ‘t Westeinde<br />
Managing Director<br />
Shutters & Barriers<br />
Gerben Stilma<br />
Managing Director<br />
Insulation & Rooflight<br />
Products<br />
Distribution<br />
Erik Bax<br />
Managing Director<br />
Peter Erkamp<br />
Finance Director<br />
Erik de Groot<br />
Human Resources Director<br />
Harry Bosshardt<br />
Managing Director<br />
Builders Merchants Central<br />
Europe<br />
Peter Stravers<br />
Managing Director<br />
Builders Merchants Benelux<br />
Philippe Denécé<br />
Managing Director<br />
Builders Merchants France<br />
Emiel Hopmans<br />
Managing Director<br />
DIY Europe<br />
The Americas<br />
Mark S. Towe<br />
Chief Executive Officer<br />
Michael O’Driscoll<br />
Chief Financial Officer<br />
Don Eshleman<br />
Executive Vice President<br />
Gary Hickman<br />
Senior Vice President Tax &<br />
Risk Management<br />
Bill Miller<br />
Vice President & General<br />
Counsel<br />
Brian Reilly<br />
Vice President Finance<br />
North America<br />
Materials<br />
Doug Black<br />
Chief Executive Officer<br />
John Keating<br />
President & Chief Operating<br />
Officer, East
John Parson<br />
President & Chief Operating<br />
Officer, West<br />
Randy Lake<br />
President Performance Group<br />
Charles Brown<br />
Chief Financial Officer<br />
Pascal Convers<br />
Senior Vice President<br />
Development<br />
Northeast<br />
Chris Madden<br />
President<br />
Northeast Division<br />
Christian Zimmermann<br />
President<br />
New England North<br />
Ciaran Brennan<br />
President<br />
New England South<br />
John Cooney, Jr.<br />
President<br />
New York Region<br />
George Thompson<br />
President<br />
Tilcon New Jersey<br />
Central<br />
John Powers<br />
President<br />
Central Division<br />
Doug Rauh<br />
President<br />
Shelly<br />
Dan Stover<br />
President<br />
Michigan Paving & Materials<br />
Mid-Atlantic<br />
Dan Cooperrider<br />
President<br />
Mid-Atlantic Division<br />
Mark Snyder<br />
President<br />
MidA<br />
Willie Crane<br />
President<br />
AMG – North<br />
Kevin Bragg<br />
President<br />
AMG – South<br />
Southeast<br />
Rick Mergens<br />
President<br />
Southeast Division<br />
Seán O’Sullivan<br />
President<br />
Mid-South Materials<br />
Gary Yelvington<br />
President<br />
Conrad Yelvington<br />
Distributors<br />
Robert Duke<br />
President<br />
Preferred Materials<br />
John Skidmore<br />
President<br />
APAC Florida<br />
Staker Parson<br />
Scott Parson<br />
President<br />
Staker Parson Division<br />
John Grunenwald<br />
Vice President<br />
Idaho<br />
Randy Anderson<br />
Vice President<br />
Staker Parson North<br />
Michael Kurz<br />
Vice President<br />
Staker Parson South<br />
Darrell Whitney<br />
Vice President<br />
Western Rock Products<br />
Northwest<br />
Jeff Schaffer<br />
President<br />
Northwest Division<br />
Rocky Mountain &<br />
Midwest<br />
Shane Evans<br />
President<br />
Rocky Mountain & Midwest<br />
Division<br />
Lane Bybee<br />
President<br />
North Region<br />
Craig Lamberty<br />
President<br />
South Region<br />
Jim Gauger<br />
President<br />
Midwest Region<br />
Southwest<br />
Kirk Randolph<br />
President<br />
Southwest Division<br />
Raymond Lane<br />
President<br />
Texas Region<br />
Chris Lodge<br />
President<br />
Region 1 & APAC Central<br />
Products & Distribution<br />
William J. Sandbrook<br />
Chief Executive Officer<br />
Architectural Products<br />
Keith Haas<br />
Chief Executive Officer<br />
Paul Valentine<br />
President Masonry &<br />
Hardscapes<br />
Mike Schaeffer<br />
Chief Financial Officer<br />
Damian Burke<br />
Vice President<br />
Development<br />
Bertin Castonguay<br />
Director, Research<br />
& Development<br />
Georges Archambault<br />
President<br />
APG Canada<br />
Steve Matsick<br />
President<br />
Glen-Gery<br />
Wade Ficklin<br />
President<br />
APG West<br />
John O’Neill<br />
President<br />
APG Northeast<br />
Tim Ortman<br />
President<br />
APG South<br />
David Maske<br />
President<br />
Bonsal American<br />
Eoin Lehane<br />
President<br />
Oldcastle Lawn & Garden<br />
Precast<br />
Mark Schack<br />
Chief Executive Officer<br />
Bob Quinn<br />
Chief Administrative Officer<br />
Eric Farinha<br />
Chief Financial Officer<br />
George Heusel<br />
Vice President Development<br />
George Hand<br />
President<br />
Northeast Division<br />
Jan Olsen<br />
President<br />
Central / Southeast Division<br />
Ray Rhees<br />
President<br />
National Sales, Marketing &<br />
Engineering Group<br />
Mike Scott<br />
President<br />
Western Division<br />
Dave Steevens<br />
President<br />
Enclosures Division<br />
Tab Buckner<br />
Vice President Operational<br />
Excellence<br />
Glass<br />
Ted Hathaway<br />
Chief Executive Officer<br />
Dan Hamblen<br />
Chief Financial Officer<br />
Daipayan Bhattacharya<br />
Vice President<br />
Development & Technology<br />
Jim Avanzini<br />
President<br />
Architectural Glass<br />
John B. Graham<br />
President<br />
Aluminum Glazing Systems<br />
Mary Carol Witry<br />
President<br />
Engineered Products<br />
MMI<br />
Celeste Mastin<br />
Chief Executive Officer<br />
Bob Tenczar<br />
Chief Financial Officer<br />
David Clark<br />
President<br />
Merchants Metals<br />
Edward Klavin<br />
President<br />
Meadow Burke<br />
Elizabeth Potts<br />
President<br />
Ivy Steel<br />
Distribution<br />
Michael Lynch<br />
Chairman<br />
Robert Feury, Jr.<br />
Chief Executive Officer<br />
Ron Pilla<br />
President<br />
Interior Products<br />
Donald Toth<br />
President<br />
Exterior Products<br />
Frank Furia<br />
Vice President Finance<br />
Kevin Hawley<br />
Vice President Development<br />
South America<br />
Juan Carlos Girotti<br />
Managing Director<br />
<strong>CRH</strong> Sudamericana &<br />
Canteras Cerro Negro<br />
Alejandro Javier Bertrán<br />
Business Development<br />
Manager<br />
Benjamin Fernández<br />
Business Development<br />
Manager<br />
Bernardo Alamos<br />
Managing Director<br />
Vidrios Dell Orto & South<br />
American Glass Group<br />
Gustavo Arona<br />
Operations Manager<br />
Superglass<br />
Federico Ferro<br />
Managing Director<br />
Cormela<br />
Jaime Bustamante<br />
Managing Director<br />
Comercial Duomo<br />
<strong>CRH</strong> 123
Principal Subsidiary Undertakings as at 31st December <strong>2009</strong><br />
Incorporated and operating in % held Products and services Incorporated and operating in % held Products and services<br />
Europe Materials<br />
Britain & Northern Ireland<br />
Northstone (NI) Limited (including<br />
Farrans, Ready Use Concrete,<br />
R.J. Maxwell & Son, Scott<br />
(Toomebridge) Limited)<br />
124 <strong>CRH</strong><br />
100 Aggregates, readymixed concrete,<br />
mortar, coated macadam, rooftiles,<br />
building and civil engineering contracting<br />
Premier Cement Limited 100 Marketing and distribution of cement<br />
T.B.F. Thompson (Properties)<br />
Limited<br />
China<br />
Harbin Sanling Cement<br />
Company Limited *<br />
100 Property development<br />
100 Cement<br />
Finland<br />
Finnsementti Oy 100 Cement<br />
Rudus Oy 100 Aggregates and readymixed concrete<br />
Ireland<br />
Irish Cement Limited 100 Cement<br />
Premier Periclase Limited 100 High quality seawater magnesia<br />
Clogrennane Lime Limited 100 Burnt and hydrated lime<br />
Roadstone Wood Limited 100 Aggregates, readymixed concrete,<br />
mortar, coated macadam, concrete<br />
blocks and pipes, asphalt, agricultural<br />
and chemical limestone and contract<br />
surfacing<br />
Netherlands<br />
Cementbouw B.V. 100 Cement transport and trading,<br />
readymixed concrete and aggregates<br />
Poland<br />
Bosta Beton Sp. z o.o. 90.3 Readymixed concrete<br />
Cementownia Rejowiec S.A. 100 Cement<br />
Drogomex Sp. z o.o.* 99.94 Asphalt and contract surfacing<br />
Faelbud S.A.* 100 Readymixed concrete, concrete<br />
products and concrete paving<br />
Grupa O . z arów S.A. 100 Cement<br />
Grupa Prefabet S.A.* 100 Concrete products<br />
Masfalt Sp. z o.o.* 100 Asphalt and contract surfacing<br />
O.K.S.M. Sp. z o.o. 99.92 Aggregates<br />
Polbruk S.A.* 100 Readymixed concrete and concrete<br />
paving<br />
ZPW Trzuskawica S.A. 99.98 Production of lime and lime products<br />
Spain<br />
Beton Catalan S.A. 100 Readymixed concrete<br />
Cabi S.A. 99.99 Cementitious materials<br />
Cantera de Aridos Puig<br />
Broca S.A.<br />
99.81 Aggregates<br />
Explotacion de Aridos<br />
Calizos S.A.<br />
100 Aggregates<br />
Formigo i Bigues S.A. 99.81 Aggregates<br />
Formigons Girona S.A. 100 Readymixed concrete and precast<br />
concrete products<br />
Suberolita S.A. 100 Readymixed concrete and precast<br />
concrete products<br />
Tamuz S.A. 100 Aggregates<br />
Switzerland<br />
JURA-Holding 100 Cement, aggregates and readymixed<br />
concrete<br />
Ukraine<br />
OJSC Podilsky Cement 98.89 Cement<br />
Europe Products & Distribution<br />
Austria<br />
Quester Baustoffhandel GmbH 100 Builders merchants<br />
Belgium<br />
Concrete Products<br />
Douterloigne N.V. 100 Concrete floor elements, pavers and<br />
blocks<br />
Ergon N.V. 100 Precast concrete structural elements<br />
Klaps N.V. 100 Concrete paving, sewerage and water<br />
treatment<br />
Marlux Klaps N.V. 100 Decorative concrete paving<br />
MBI Beton B.V. 100 Architectural products<br />
Oeterbeton N.V. 100 Precast concrete<br />
Olivier Betonfabriek N.V. 100 Architectural products<br />
Prefaco N.V. 100 Precast concrete structural elements<br />
Remacle S.A. 100 Precast concrete products<br />
Schelfhout N.V. 100 Precast concrete wall elements<br />
Clay Products<br />
J. De Saegher Steenhandel en<br />
Bouwspecialiteiten N.V.<br />
100 Clay brick factors<br />
Building Products<br />
Plakabeton N.V. 100 Construction accessories<br />
Portal S.A. 100 Glass roof structures<br />
Distribution<br />
Van Neerbos België N.V. 100 DIY stores<br />
Britain & Northern Ireland<br />
Concrete Products<br />
Forticrete Limited 100 Concrete masonry products and rooftiles<br />
Supreme Concrete Limited 100 Concrete fencing, lintels and floorbeams<br />
Clay Products<br />
Ibstock Brick Limited 100 Clay brick manufacturer<br />
Kevington Building Products<br />
Limited<br />
100 Specialist brick fabricator<br />
Manchester Brick and Precast<br />
Limited<br />
100 Brick-clad precast components<br />
Trinity Bricks Limited 100 Clay brick factors
Incorporated and operating in % held Products and services Incorporated and operating in % held Products and services<br />
Building Products<br />
Airvent Systems (Services)<br />
Limited<br />
100 Smoke ventilation systems and services<br />
Ancon Limited 100 Construction accessories<br />
Broughton Controls Limited 100 Access control systems<br />
Cox Building Products Limited 100 Domelights, ventilation systems and<br />
continuous rooflights<br />
<strong>CRH</strong> Fencing Limited 100 Security fencing<br />
EcoTherm Insulation (UK)<br />
Limited<br />
100 PUR/PIR insulation<br />
FCA Wholesalers Limited * 100 Construction accessories<br />
Geoquip Limited 100 Perimeter intrusion detection systems<br />
Springvale EPS Limited 100 EPS insulation and packaging<br />
TangoRail Limited 100 Non-welded railing systems<br />
West Midland Fencing Limited 100 Security fencing<br />
Denmark<br />
Concrete Products<br />
Betongruppen RBR A/S 100 Paving manufacturer<br />
<strong>CRH</strong> Concrete A/S 100 Structural products<br />
Building Products<br />
ThermiSol Denmark A/S 100 EPS insulation<br />
Finland<br />
Building Products<br />
ThermiSol Oy 100 EPS insulation<br />
France<br />
Concrete Products<br />
Béton Moulé Industriel S.A. 99.95 Precast concrete products<br />
Chapron Leroy S.A.S. 100 Utility products<br />
Cinor S.A.S. 100 Structural products<br />
Stradal S.A.S. 100 Landscape, utility and infrastructural<br />
concrete products<br />
Building Products<br />
Ste. Heda S.A. 100 Security fencing<br />
Heras Clôture S.A.R.L. * 100 Temporary fencing<br />
Laubeuf S.A.S. 100 Glass roof structures<br />
Plakabeton France S.A. 100 Construction accessories<br />
Distribution<br />
<strong>CRH</strong> Ile de France Distribution<br />
S.A.S. *<br />
Germany<br />
100 Builders merchants<br />
Concrete Products<br />
EHL AG 100 Concrete paving and landscape walling<br />
products<br />
Rhebau Rheinische Beton und<br />
Bauindustrie GmbH & Co. KG<br />
100 Water treatment and sewerage products<br />
Clay Products<br />
<strong>CRH</strong> Clay Solutions GmbH 100 Clay brick, pavers and rooftiles<br />
Building Products<br />
Adronit GmbH 100 Security fencing and access control<br />
EcoTherm GmbH 100 PUR/PIR insulation<br />
Gefinex Gesellschaft für<br />
Innovative Extrusionprodukte<br />
mbH<br />
100 XPE insulation<br />
Greschalux GmbH 100 Domelights and ventilation systems<br />
Hammerl GmbH & Co. KG 100 Construction accessories<br />
Halfen GmbH 100 Metal construction accessories<br />
Heras SKS GmbH 100 Security fencing<br />
Jet Brakel Aero GmbH 100 Rooflights, glass roof structures and<br />
ventilation systems<br />
JET-Tageslicht & RWA GmbH 100 Domelights, ventilation systems and<br />
continuous rooflights<br />
Magnetic Autocontrol GmbH 100 Vehicle and pedestrian access control<br />
systems<br />
Syncotec Inmobilien GmbH 100 Construction accessories<br />
Unidek Deutschland GmbH 100 EPS insulation<br />
Distribution<br />
Paulsen & Bräuninger GmbH 100 Sanitary ware, heating and plumbing<br />
Hungary<br />
Concrete Products<br />
Ferrobeton Zrt. 100 Precast concrete structural elements<br />
Ireland<br />
Concrete Products<br />
Concrete Stair Systems Limited 100 Precast concrete products<br />
Building Products<br />
Aerobord Limited 100 EPS insulation and packaging<br />
Construction Accessories 100 Metal and plastic construction<br />
Limited *<br />
accessories<br />
Italy<br />
Concrete Products<br />
Record S.P.A. 100 Concrete landscaping<br />
Building Products<br />
Plastybeton S.R.L. 100 Construction accessories<br />
Netherlands<br />
Concrete Products<br />
Alvon Bouwsystemen B.V. 100 Precast concrete structural elements<br />
Calduran Kalkzandsteen B.V. 100 Sand-lime bricks and building elements<br />
Dycore B.V. 100 Concrete flooring elements<br />
Jonker Beton B.V. 100 Concrete paving products<br />
Heembeton B.V. 100 Precast concrete structural elements<br />
Struyk Verwo Groep B.V. 100 Concrete paving products<br />
<strong>CRH</strong> 125
Principal Subsidiary Undertakings continued<br />
Incorporated and operating in % held Products and services Incorporated and operating in % held Products and services<br />
Netherlands continued<br />
Clay Products<br />
Kleiwarenfabriek Buggenum<br />
B.V.<br />
100 Clay brick manufacturer<br />
Kleiwarenfabriek Façade Beek<br />
B.V.<br />
100 Clay brick manufacturer<br />
B.V. Kleiwarenfabriek Joosten 100 Clay brick manufacturer<br />
Kleiwarenfabriek Joosten<br />
Wessem B.V.<br />
100 Clay brick manufacturer<br />
Kooy Bilthoven B.V. 100 Clay brick factors<br />
Steenfabriek Nuth B.V. 100 Clay brick manufacturer<br />
Building Products<br />
Arfman Hekwerk B.V. * 100 Producer and installer of fauna and<br />
railway fencing solutions<br />
Aluminium Verkoop Zuid B.V. 100 Roller shutter and awning systems<br />
BIK Bouwprodukten B.V. 100 Domelights and continuous rooflights<br />
Brakel Atmos B.V. 100 Glass roof structures, continuous<br />
rooflights and ventilation systems<br />
EcoTherm B.V. 100 PUR/PIR insulation<br />
Heras Nederland B.V. 100 Security fencing and perimeter<br />
protection<br />
Mavotrans B.V. 100 Construction accessories<br />
Unidek Group B.V. 100 EPS insulation<br />
Unipol Holland B.V. 100 EPS granulates<br />
Vaculux B.V. 100 Domelights<br />
Distribution<br />
<strong>CRH</strong> Bouwmaterialenhandel B.V. 100 Holding company<br />
<strong>CRH</strong> Roofing Materials B.V. 100 Roofing materials merchant<br />
N.V. B. Bouwstoffen B.V. 100 Builders merchants<br />
Stoel van Klaveren Bouwstoffen<br />
B.V.<br />
100 Builders merchants<br />
Syntec B.V. 100 Ironmongery merchants<br />
Van Neerbos Bouwmarkten B.V. 100 DIY stores<br />
<strong>CRH</strong> Bouwmaten B.V. 100 Cash & Carry building materials<br />
Van Neerbos Bouwmaterialen<br />
B.V.<br />
Norway<br />
126 <strong>CRH</strong><br />
100 Builders merchants<br />
Building Products<br />
Halfen-Frimeda AS 100 Construction accessories<br />
Poland<br />
Concrete Products<br />
Ergon Poland Sp. z o.o. 100 Structural products<br />
Faelbud Prefabrykaty Sp. z o.o.* 100 Readymixed concrete, concrete<br />
products and concrete paving<br />
Clay Products<br />
CERG Sp. z o.o. 67.55 Clay brick manufacturer<br />
Cerpol Kozlowice Sp. z o.o. 99.60 Clay brick manufacturer<br />
<strong>CRH</strong> Klinkier Sp. z o.o.* 100 Clay brick manufacturer<br />
Gozdnickie Zaklady Ceramiki<br />
Budowlanej Sp. z o.o.*<br />
100 Clay brick manufacturer<br />
Krotoszyñskie Przedsi biorstwo 96.37<br />
Ceramiki Budowlanej<br />
CERABUD S.A.<br />
Clay blocks, bricks and rooftiles<br />
Patoka Industries Limited<br />
Sp. z o.o.*<br />
99.19 Clay brick manufacturer<br />
Building Products<br />
Termo Organika Sp. z o.o. 100 EPS insulation<br />
Romania<br />
Concrete Products<br />
Elpreco SA 100 Architectural products<br />
Ergon Concrete International 100 Structural products<br />
Slovakia<br />
Concrete Products<br />
Premac spol. s.r.o. 100 Concrete paving and floor elements<br />
Ferrobeton Slovakia, s.r.o. 100 Precast concrete structural elements<br />
Spain<br />
Building Products<br />
Plakabeton S.L.U.<br />
Distribution<br />
100 Accessories for construction and<br />
precast concrete<br />
JELF Brico House S.L. 94.75 Builders merchants<br />
Sweden<br />
Building Products<br />
ThermiSol AB 100 EPS insulation<br />
TUVAN-stängsel AB 100 Security fencing<br />
Switzerland<br />
Concrete Products<br />
Element AG<br />
Building Products<br />
100 Prefabricated structural concrete<br />
elements<br />
U.C. Aschwanden Holding AG * 100 Construction accessories<br />
Distribution<br />
BR Bauhandel AG (trading as 100 Builders merchants, sanitary ware and<br />
BauBedarf, Richner, Sanmat<br />
and Sabez)<br />
ceramic tiles<br />
<strong>CRH</strong> Gétaz Holding AG (trading<br />
as Gétaz Romang and Miauton)<br />
100 Builders merchants<br />
Regusci S.A. (trading as<br />
Regusci and Reco)<br />
100 Builders merchants
Incorporated and operating in % held Products and services Incorporated and operating in % held Products and services<br />
Americas Materials<br />
United States<br />
Oldcastle Materials, Inc. 100 Holding company<br />
APAC Holdings, Inc. and 100 Aggregates, asphalt and related<br />
Subsidiaries<br />
construction activities<br />
Callanan Industries, Inc. 100 Aggregates, asphalt, readymixed<br />
concrete and related construction<br />
activities<br />
Conrad Yelvington Distributors,<br />
Inc.<br />
100 Aggregates distribution<br />
CPM Development Corporation 100 Aggregates, asphalt, readymixed<br />
concrete, prestressed concrete and<br />
related construction activities<br />
Dolomite Products Company, 100 Aggregates, asphalt and readymixed<br />
Inc.<br />
concrete<br />
Eugene Sand Construction, Inc. 100 Aggregates, asphalt, readymixed<br />
concrete and related construction<br />
activities<br />
Evans Construction Company 100 Aggregates, asphalt, readymixed<br />
concrete and related construction<br />
activities<br />
Hills Materials Company 100 Aggregates, asphalt, readymixed<br />
concrete and related construction<br />
activities<br />
Hilty Quarries, Inc. 100 Aggregates, asphalt and related<br />
construction activities<br />
Michigan Paving and Materials 100 Aggregates, asphalt and related<br />
Company<br />
construction activities<br />
Mountain Enterprises, Inc. 100 Aggregates, asphalt and related<br />
construction activities<br />
OMG Midwest, Inc. 100 Aggregates, asphalt, readymixed<br />
concrete and related construction<br />
activities<br />
Oldcastle SW Group, Inc. 100 Aggregates, asphalt, readymixed<br />
concrete and related construction<br />
activities<br />
Pennsy Supply, Inc. 100 Aggregates, asphalt, readymixed<br />
concrete and related construction<br />
activities<br />
Pike Industries, Inc. 100 Aggregates, asphalt and related<br />
construction activities<br />
P.J. Keating Company 100 Aggregates, asphalt and related<br />
construction activities<br />
Preferred Materials, Inc. 100 Aggregates and readymixed concrete<br />
Staker & Parson Companies 100 Aggregates, asphalt, readymixed<br />
concrete and related construction<br />
activities<br />
The Shelly Company 100 Aggregates, asphalt and related<br />
construction activities<br />
Tilcon Connecticut, Inc. 100 Aggregates, asphalt, readymixed<br />
concrete and related construction<br />
activities<br />
Tilcon New York, Inc. 100 Aggregates, asphalt and related<br />
construction activities<br />
West Virginia Paving, Inc. 100 Aggregates, asphalt and related<br />
construction activities<br />
Americas Products & Distribution<br />
Argentina<br />
<strong>CRH</strong> Sudamericana S.A. 100 Holding company<br />
Canteras Cerro Negro S.A. 99.98 Clay rooftiles, wall tiles and floor tiles<br />
Cormela S.A. 100 Clay blocks<br />
Superglass S.A. 100 Fabricated and tempered glass products<br />
Canada<br />
Architectural Products Group<br />
Oldcastle Building Products<br />
Canada, Inc. (trading as Décor<br />
Precast, Groupe Permacon,<br />
Oldcastle Glass and Synertech<br />
Moulded Products)<br />
Glass Group<br />
Oldcastle Glass Engineered<br />
Products Canada, Inc.<br />
Xemax International, Inc.<br />
(trading as Antamex<br />
International)<br />
100 Masonry, paving and retaining walls,<br />
utility boxes and trenches and custom<br />
fabricated and tempered glass products<br />
100 Architectural-rated operable windows<br />
and curtain wall<br />
100 Architectural curtain wall<br />
Chile<br />
Vidrios Dell Orto, S.A. 99.9 Fabricated and tempered glass products<br />
Comercial Duomo Limitada 81 Wholesaler and retailer of specialised<br />
building products<br />
United States<br />
<strong>CRH</strong> America, Inc. 100 Holding company<br />
Oldcastle, Inc. 100 Holding company<br />
Oldcastle Building Products, Inc. 100 Holding company<br />
Architectural Products Group<br />
Big River Industries, Inc. 100 Lightweight aggregates and fly-ash<br />
Bonsal American, Inc. 100 Pre-mixed products and specialty stone<br />
products<br />
Oldcastle Surfaces, Inc. 100 Custom fabrication and installation of<br />
countertops<br />
Glen-Gery Corporation 100 Clay bricks<br />
Northfield Block Company<br />
(trading as Bend-Northfield)<br />
100 Specialty masonry, hardscape and patio<br />
products<br />
Oldcastle Architectural, Inc. 100 Holding company<br />
Oldcastle APG Midwest, Inc.<br />
(trading as 4D Schusters and<br />
Miller Rhino Materials)<br />
Oldcastle APG Northeast, Inc.<br />
(trading as Anchor Concrete<br />
Products, Arthur Whitcomb,<br />
Betco Supreme, Domine<br />
Builders Supply, Foster-<br />
Southeastern, Trenwyth<br />
Industries)<br />
Oldcastle APG South, Inc.<br />
(trading as Adams Products,<br />
Georgia Masonry Supply)<br />
100 Specialty masonry, hardscape and patio<br />
products<br />
100 Specialty masonry, hardscape and patio<br />
products<br />
100 Specialty masonry, hardscape and patio<br />
products<br />
<strong>CRH</strong> 127
Principal Subsidiary Undertakings continued<br />
Incorporated and operating in % held Products and services<br />
United States continued<br />
Oldcastle APG Texas, Inc.<br />
(trading as Custom-Crete,<br />
Custom Stone Supply, Jewell<br />
Concrete Products)<br />
Oldcastle APG West, Inc.<br />
(trading as Amcor Masonry<br />
Products, Central Pre-Mix<br />
Concrete Products, Sierra<br />
Building Products, Superlite<br />
Block)<br />
128 <strong>CRH</strong><br />
100 Specialty masonry and stone products,<br />
hardscape and patio products<br />
100 Specialty masonry, hardscape and patio<br />
products<br />
Oldcastle Lawn & Garden, Inc. 100 Patio products, bagged stone, mulch<br />
and stone<br />
Oldcastle Coastal, Inc. 100 Patio products<br />
Distribution Group<br />
Oldcastle Distribution, Inc. 100 Holding company<br />
Allied Building Products Corp. 100 Distribution of roofing, siding and related<br />
products, wallboard, metal studs,<br />
acoustical tile and grid<br />
A.L.L. Roofing & Building 100 Distribution of roofing and related<br />
Materials Corp.<br />
products<br />
AMS Holdings, Inc. 100 Distribution of drywall, acoustical ceiling<br />
systems, metal studs and commercial<br />
door solutions<br />
Arzee Acquisition Corp. (trading 100 Distribution of roofing, siding and related<br />
as Arzee Supply)<br />
products<br />
Mahalo Acquisition Corp. 100 Distribution of roofing and related<br />
(trading as G. W. Killebrew)<br />
products<br />
Glass Group<br />
Antamex (US), Inc. 100 Architectural curtain walls<br />
Oldcastle Glass, Inc. 100 Custom fabricated architectural glass<br />
Oldcastle Glass Engineered 100 Engineered aluminium glazing systems<br />
Products, Inc.<br />
and integrated building envelope<br />
solutions<br />
Construction Accessories, Fencing<br />
and Welded Wire Reinforcement<br />
Merchants Metals Holding<br />
Company<br />
100 Holding company<br />
MMI Products, Inc. (trading as<br />
Merchants Metals, Meadow<br />
Burke and ADC Manufacturing)<br />
100 Fabrication and distribution of metal<br />
products including fencing, welded wire<br />
reinforcement and concrete accessories;<br />
distribution of plastic, lumber and other<br />
metal products<br />
Ivy Steel & Wire, Inc. 100 Welded wire reinforcement manufacturer<br />
Precast Group<br />
Oldcastle Precast, Inc. 100 Precast concrete products, concrete<br />
pipe, prestressed plank and structural<br />
elements
Principal Joint Venture Undertakings as at 31st December <strong>2009</strong> Principal Associated Undertakings as at 31st December <strong>2009</strong><br />
Incorporated and operating in % held Products and services Incorporated and operating in % held Products and services<br />
Europe Materials<br />
India<br />
My Home Industries Limited 50 Cement<br />
Ireland<br />
Kemek Limited * 50 Commercial explosives<br />
Portugal<br />
Secil-Companhia Geral de<br />
Cal e Cimento, S.A. *<br />
48.99 Cement, aggregates, concrete products,<br />
mortar and readymixed concrete<br />
Turkey<br />
Denizli Çimento Sanayii T.A. . 50 Cement and readymixed concrete<br />
Europe Products & Distribution<br />
Belgium<br />
Building Products<br />
Jackon Insulation N.V. 49 XPS insulation<br />
Germany<br />
Building Products<br />
Jackon Insulation GmbH * 49.20 XPS insulation<br />
Distribution<br />
Bauking AG * 47.82 Builders merchants, DIY stores<br />
France<br />
Distribution<br />
Doras S.A. * 57.85 Builders merchants<br />
Ireland<br />
Building Products<br />
Williaam Cox Ireland Limited 50 Glass construction, continuous rooflights<br />
and ventilation systems<br />
Netherlands<br />
Distribution<br />
Bouwmaterialenhandel de<br />
Schelde B.V.<br />
Portugal<br />
Distribution<br />
Modelo Distribuição de<br />
Materials de Construção S.A. *<br />
Americas Materials<br />
50 DIY stores<br />
50 Cash & Carry building materials<br />
American Cement<br />
Company, LLC *<br />
50 Cement<br />
Bizzack Construction LLC * 50 Construction<br />
Boxley Aggregates of West<br />
Virginia, LLC *<br />
50 Aggregates<br />
Cadillac Asphalt, LLC * 50 Asphalt<br />
Europe Materials<br />
China<br />
Jilin Yatai Group Building<br />
Materials Investment Company<br />
Limited *<br />
Israel<br />
Mashav Initiating and<br />
Development Limited<br />
26 Cement<br />
25 Cement<br />
Spain<br />
Corporación Uniland S.A. * 26.3 Cement, aggregates, readymixed<br />
concrete and mortar<br />
Europe Products & Distribution<br />
France<br />
Distibution<br />
Samse S.A. * 21.23 Builders merchants and DIY stores<br />
Melin Trialis S.A.S. * 34.81 Builders merchants<br />
Americas Materials<br />
Buckeye Ready Mix, LLC * 45 Readymixed concrete<br />
* Audited by firms other than Ernst & Young<br />
Pursuant to Section 16 of the Companies<br />
Act, 1986, a full list of subsidiary, joint<br />
venture and associated undertakings will be<br />
annexed to the Company’s <strong>Annual</strong> Return to<br />
be filed in the Companies Registration Office<br />
in the Republic of Ireland.<br />
<strong>CRH</strong> 129
Group Financial Summary<br />
(Figures prepared in accordance with Irish GAAP)<br />
130 <strong>CRH</strong><br />
1995 1996 1997 1998 1999 2000 2001 2002 2003 2004<br />
€ m € m € m € m € m € m € m € m € m € m<br />
Turnover including share of joint ventures 2,520 3,354 4,234 5,211 6,734 8,870 10,444 10,794 11,080 12,820<br />
Group operating profit 224 283 349 442 676 919 1,020 1,049 1,046 1,247<br />
Goodwill amortisation - - - (1) (19) (44) (61) (70) (76) (101)<br />
Profit on disposal of fixed assets 1 1 9 11 7 13 17 16 13 11<br />
Exceptional items - - - - 64 - - - - -<br />
Profit on ordinary activities before interest 225 284 358 452 728 888 976 995 983 1,157<br />
Net interest payable (21) (28) (36) (43) (93) (191) (173) (139) (118) (140)<br />
Profit on ordinary activities before taxation 204 256 322 409 635 697 803 856 865 1,017<br />
Taxation on profit on ordinary activities (42) (58) (76) (100) (152) (194) (217) (227) (218) (247)<br />
Taxation on exceptional items - - - - (26) - - - - -<br />
Profit on ordinary activies after taxation 162 198 246 309 457 503 586 629 647 770<br />
Employment of capital<br />
Fixed assets<br />
- Tangible assets 895 1,236 1,519 2,288 3,226 4,551 5,150 5,004 5,145 5,320<br />
- Intangible asset - goodwill - - - 138 629 955 1,153 1,154 1,475 1,443<br />
- Financial assets 118 127 132 53 66 104 316 275 349 702<br />
Net working capital (a) 133 255 313 512 608 915 1,040 1,078 1,116 1,244<br />
Other liabilities (b) (13) (25) (61) (286) (430) (470) (479) (443) (429) (429)<br />
Total 1,133 1,593 1,903 2,705 4,099 6,055 7,180 7,068 7,656 8,280<br />
Financed as follows<br />
Equity shareholders' funds 868 1,056 1,308 1,553 2,201 3,074 4,734 4,747 4,758 5,217<br />
Preference share capital 1 1 1 1 1 1 1 1 1 1<br />
Minority shareholders' equity interest 12 13 14 285 37 36 135 111 90 82<br />
Capital grants 12 11 11 20 19 17 16 14 13 11<br />
Deferred tax 49 70 104 116 172 307 400 485 486 528<br />
Net debt (c) 189 442 465 730 1,669 2,620 1,894 1,710 2,308 2,441<br />
Convertible capital bonds (d) 2 - - - - - - - - -<br />
1,133 1,593 1,903 2,705 4,099 6,055 7,180 7,068 7,656 8,280<br />
Purchase of tangible assets 109 150 147 232 360 430 452 367 402 520<br />
Acquisitions and investments 164 532 241 604 1,421 1,605 1,080 992 1,615 922<br />
Total 273 682 388 836 1,781 2,035 1,532 1,359 2,017 1,442<br />
Depreciation and goodwill amortisation 81 104 129 166 275 395 497 526 534 596<br />
Earnings per share after goodwill amortisation (cent) (e) 37.1 43.9 52.4 65.0 87.5 102.6 104.0 107.5 109.9 129.8<br />
Earnings per share before goodwill amortisation (cent) (e) 37.1 43.9 52.4 65.3 91.6 111.6 114.8 119.5 122.8 147.1<br />
Dividend per share (cent) (e) 9.49 10.64 12.21 14.08 16.43 18.73 20.74 22.90 25.34 29.76<br />
Cash earnings per share (cent) (e),(f) 55.9 67.1 80.2 100.3 145.4 184.0 192.7 198.2 201.4 231.2<br />
Dividend cover (times) (g) 3.9 4.1 4.3 4.6 5.3 5.5 5.0 4.7 4.3 4.4<br />
Notes to Irish GAAP financial summary data<br />
(a) Excluding bank advances and cash and liquid investments which are included under net debt (see note (c) below).<br />
(b) Including deferred and contingent acquisition consideration due after more than one year and provisions for liabilities and charges and excluding deferred tax.<br />
(c) Net debt represents the sum of loans (including finance leases) and overdrafts falling due within one year, bank loans (including finance leases) falling due after<br />
more than one year less cash and liquid investments.<br />
(d) Including supplemental interest.<br />
(e) Per share amounts for 1995 to 2004 have been restated for the bonus element of the Rights Issue in March <strong>2009</strong>.<br />
(f) Cash earnings per share equals the sum of profit for the year attributable to ordinary shareholders, depreciation and goodwill amortisation divided by the average<br />
number of Ordinary Shares outstanding for the year.<br />
(g) Excluding exceptional net gains in 1999.
Group Financial Summary<br />
(Figures prepared in accordance with IFRS) Restated<br />
2004 2005 2006 2007 2008 <strong>2009</strong><br />
€ m € m € m € m € m € m<br />
Revenue 12,755 14,449 18,737 20,992 20,887 17,373<br />
Group operating profit 1,220 1,392 1,767 2,086 1,841 955<br />
Profit on disposal of non-current assets 11 20 40 57 69 26<br />
Profit before finance costs 1,231 1,412 1,807 2,143 1,910 981<br />
Finance costs (264) (297) (407) (473) (503) (419)<br />
Finance revenue 118 138 155 170 160 122<br />
Group share of associates' profit after tax 19 26 47 64 61 48<br />
Profit before tax 1,104 1,279 1,602 1,904 1,628 732<br />
Income tax expense (232) (273) (378) (466) (366) (134)<br />
Group profit for the financial year 872 1,006 1,224 1,438 1,262 598<br />
Employment of capital<br />
Non-current and current assets<br />
Property, plant and equipment 5,831 6,824 7,480 8,226 8,888 8,535<br />
Intangible assets 1,774 2,252 2,966 3,692 4,108 4,095<br />
Investments in associates/other financial assets 292 635 651 652 870 1,090<br />
Net working capital (h) 1,540 1,944 2,420 2,469 2,650 1,991<br />
Other liabilities - current and non-current (i) (1,035) (1,243) (1,099) (869) (1,126) (1,084)<br />
Total 8,402 10,412 12,418 14,170 15,390 14,627<br />
Capital and reserves excluding preference share capital 4,944 6,194 7,062 7,953 8,086 9,636<br />
Preference share capital 1 1 1 1 1 1<br />
Minority interest 34 39 41 66 70 73<br />
Capital grants 13 12 10 11 14 12<br />
Net deferred income tax liability 652 718 812 976 1,128 1,182<br />
Net debt (j) 2,758 3,448 4,492 5,163 6,091 3,723<br />
Total 8,402 10,412 12,418 14,170 15,390 14,627<br />
Purchase of property, plant and equipment 551 652 832 1,028 1,039 532<br />
Acquisitions and investments 1,019 1,298 2,311 2,227 1,072 458<br />
Total 1,570 1,950 3,143 3,255 2,111 990<br />
Depreciation of property, plant and equipment (including impairments) 516 556 664 739 781 794<br />
Amortisation of intangible assets (including impairments) 4 9 25 35 43 54<br />
Earnings per share after amortisation of intangible assets (cent) (k) 147.5 168.3 202.2 236.9 210.2 88.3<br />
Earnings per share before amortisation of intangible assets (cent) (k) 148.1 170.0 206.5 242.7 217.4 96.3<br />
Dividend per share (cent) (k) 29.76 35.17 46.89 61.31 62.22 62.50<br />
Cash earnings per share (cent) (k),(l) 236.1 263.7 317.5 365.1 348.9 214.7<br />
Dividend cover (times) (m) 5.0 4.8 4.3 3.9 3.4 1.4<br />
Notes to IFRS financial summary data<br />
(h) Represents the sum of inventories and trade and other receivables (included in current assets) less trade and other payables (included in current liabilities).<br />
(i) Represents the sum of current income tax liabilities, current and non-current provisions for liabilities, non-current trade and other payables and retirement benefit<br />
obligations.<br />
(j) Represents the sum of current and non-current interest-bearing loans and borrowings and derivative financial instrument liabilities less the sum of liquid investments,<br />
cash and cash equivalents and current and non-current derivative financial instrument assets.<br />
(k) Per share amounts for restated 2004 to 2008 have been restated for the bonus element of the Rights Issue in March <strong>2009</strong>.<br />
(l) Cash earnings per share represents profit attributable to equity holders of the Company less preference dividends paid plus depreciation of property, plant and<br />
equipment and amortisation of intangible assets, including impairments, where applicable, divided by the average number of Ordinary Shares outstanding<br />
for the year.<br />
(m) Represents earnings per Ordinary Share divided by dividends per Ordinary Share.<br />
<strong>CRH</strong> 131
Index<br />
A<br />
Accounting policies 66<br />
Acquisition of subsidiaries and joint ventures (note 32) 112<br />
Acquisitions Committee 41, 43<br />
American Depositary Receipts 121<br />
Americas Materials - <strong>2009</strong> Results 29<br />
Americas Materials - Operations Review 29<br />
Americas Products & Distribution - <strong>2009</strong> Results 33<br />
Americas Products & Distribution - Operations Review<br />
Amortisation<br />
33<br />
- Intangible assets (note 14) 86<br />
- Segmental analysis (note 1) 72<br />
<strong>Annual</strong> General Meeting 50<br />
Associated undertakings, principal 129<br />
Associates’ profit after tax, Group share of (note 9) 81<br />
Audit Committee 41, 43<br />
Auditors, <strong>Report</strong> of Independent 61<br />
Auditors’ remuneration (note 4) 76<br />
B<br />
Balance sheet<br />
- Company 116<br />
- Consolidated 63<br />
Board approval of financial statements (note 34) 115<br />
Board Committees 41, 43<br />
Board of Directors 40<br />
C<br />
Capital and financial risk management (note 21) 91<br />
Capital grants (note 29) 109<br />
Cash and cash equivalents (note 22) 94<br />
Cash flow statement, Consolidated 65<br />
Cash flow - summary 38<br />
Chairman’s Statement<br />
Changes in Equity: issued share capital, share premium<br />
account, Treasury Shares/own shares, foreign currency<br />
12<br />
translation, retained income and minority interest 64<br />
Chief Executive’s Review 15<br />
Code of business conduct 45<br />
Communications 10, 121<br />
Corporate governance 42<br />
Corporate social responsibility 10<br />
CREST 121<br />
<strong>CRH</strong> Overview 2<br />
D<br />
Debt, analysis of net (note 25) 99<br />
Deferred acquisition consideration payable (note 19)<br />
Deferred income tax<br />
90<br />
- Expense (note 10) 82<br />
- Assets and liabilities (note 27) 103<br />
132 <strong>CRH</strong><br />
Depreciation<br />
- Group operating profit (note 4) 76<br />
- Property, plant and equipment (note 13) 85<br />
- Segmental analysis (note 1) 72<br />
Derivative financial instruments (note 24) 97<br />
Development activity 12<br />
Directors’ emoluments and interests (note 5) 77<br />
Directors’ interests in share capital 59<br />
Directors’ interests - share options 57<br />
Directors’ remuneration, <strong>Report</strong> on 51<br />
Directors’ <strong>Report</strong> 48<br />
Directors’ responsibilities, Statement of 60<br />
Disposal of non-current assets (note 16) 88<br />
Diverse portfolio - strategy in action 9<br />
Dividend payments (shareholder information) 120<br />
Dividends (note 11) 83<br />
Dow Jones Sustainability Indexes 10<br />
E<br />
Earnings per Ordinary Share (note 12) 84<br />
Emerging regions - strategy in action 7<br />
Employees, average numbers (note 6) 77<br />
Employment costs (note 6)<br />
End-use<br />
77<br />
- Americas Distribution 3<br />
- Americas Materials 3<br />
- Americas Products 3<br />
- Europe Distribution 2<br />
- Europe Materials 2<br />
- Europe Products 2<br />
- Group inside cover<br />
Environment and climate change 10<br />
Europe Materials - <strong>2009</strong> Results 21<br />
Europe Materials - Operations Review 21<br />
Europe Products & Distribution - <strong>2009</strong> Results 25<br />
Europe Products & Distribution - Operations Review 25<br />
Exchange rates 67<br />
F<br />
Finance Committee 41, 45<br />
Finance costs and revenue (note 8) 81<br />
Finance leases (note 31) 112<br />
Finance Review 36<br />
Financial assets (note 15) 88<br />
Financial calendar 121<br />
Financial summary, Group (1995-<strong>2009</strong>) 130<br />
Frequently asked questions 121<br />
FTSE4Good 10
G<br />
Geographic leadership positions 2, 3<br />
Group operations 19<br />
Group overview 2<br />
Guarantees (note 23 and note 9 to Company Balance Sheet ) 95, 119<br />
H<br />
Health & safety 10<br />
I<br />
Income Statement, Consolidated 62<br />
Income tax expense (note 10) 82<br />
Intangible assets (note 14) 86<br />
Internal control (see Corporate Governance) 47<br />
Inventories (note 17) 89<br />
J<br />
Joint venture undertakings, principal 129<br />
Joint ventures, proportionate consolidation (note 2) 75<br />
K<br />
Key components of <strong>2009</strong> performance 36<br />
Key financial figures <strong>2009</strong> 1<br />
Key financial performance indicators 37<br />
L<br />
Leases, commitments under operating and finance (note 31) 112<br />
Liquid investments (note 22) 94<br />
Loans and borrowings, interest-bearing (note 23) 95<br />
M<br />
Management 122<br />
N<br />
Nomination Committee 41, 45<br />
Notes on financial statements 72 – 115<br />
O<br />
Operating costs (note 3) 76<br />
Operating leases (note 31) 112<br />
Operating profit, Group (note 4)<br />
Operations Reviews:<br />
76<br />
- Americas Materials 29<br />
- Americas Products & Distribution 33<br />
- Europe Materials 21<br />
- Europe Products & Distribution 25<br />
P<br />
Pensions, retirement benefit obligations (note 28) 103<br />
Property, plant and equipment (note 13) 85<br />
Provisions for liabilities (note 26) 102<br />
Proxy voting, electronic 121<br />
R<br />
Registrars 121<br />
Related party transactions (note 33) 115<br />
Remuneration Committee 41, 45<br />
Retirement benefit obligations (note 28) 103<br />
S<br />
Segmental information (note 1) 72<br />
Senior Independent Director 41, 43<br />
Share-based payments (note 7) 78<br />
Share capital and reserves (note 30)<br />
Share options<br />
109<br />
- Directors 57<br />
- Employees 79<br />
Share price data 121<br />
Shareholder information 120<br />
Shareholdings as at 31st December <strong>2009</strong> 121<br />
Social (Corporate Social Responsibility) 10<br />
Stakeholder communication 46<br />
Statement of Comprehensive Income, Consolidated 62<br />
Statement of Changes in Equity, Consolidated 64<br />
Statement of Directors’ responsibilities 60<br />
Stock Exchange listings 121<br />
Strategic vision 1<br />
Strategy in action 4, 7, 9<br />
Subsidiary undertakings, principal 124<br />
Substantial holdings 45<br />
Sustainable Asset Management (SAM) 10<br />
T<br />
Total Shareholder Return 1<br />
Trade and other payables (note 19) 90<br />
Trade and other receivables (note 18) 89<br />
V<br />
Volumes, annualised production<br />
- Americas Distribution 3<br />
- Americas Materials 3<br />
- Americas Products 3<br />
- Europe Distribution 2<br />
- Europe Materials 2<br />
- Europe Products 2<br />
W<br />
Website 121<br />
Working capital, movement during year (note 20) 90<br />
<strong>CRH</strong> 133
Notes
Notes
The International Building<br />
Materials Group<br />
<strong>CRH</strong> plc<br />
Belgard Castle<br />
Clondalkin<br />
Dublin 22<br />
Ireland<br />
Telephone: +353 1 404 1000<br />
Fax: +353 1 404 1007<br />
E-mail: mail@crh.com<br />
Website: www.crh.com<br />
Registered Office<br />
42 Fitzwilliam Square<br />
Dublin 2<br />
Ireland<br />
Telephone: +353 1 634 4340<br />
Fax: +353 1 676 5013<br />
E-mail: crh42@crh.com<br />
Gotthard Base Tunnel is part of the Swiss<br />
Alp Transit project, also known as the New<br />
Railway Link through the Alps. With a planned<br />
length of 57 km it will, on completion, be<br />
the longest railway/road tunnel in the world.<br />
Planning for the project started in 1993<br />
with mechanical excavation commencing<br />
in 2003. The project features two separate<br />
tunnels containing one track each. Final<br />
break-through is expected in Winter 2010<br />
with an opening date planned for 2017. Jura<br />
Cement, a <strong>CRH</strong> company, under contract<br />
to ARGE AGN, has to date (2003-<strong>2009</strong>)<br />
delivered circa 215,000 tonnes of cement to<br />
this project.