Benchmarking Physician Prescribing Against True ... - IMS Health
Benchmarking Physician Prescribing Against True ... - IMS Health
Benchmarking Physician Prescribing Against True ... - IMS Health

You also want an ePaper? Increase the reach of your titles
YUMPU automatically turns print PDFs into web optimized ePapers that Google loves.
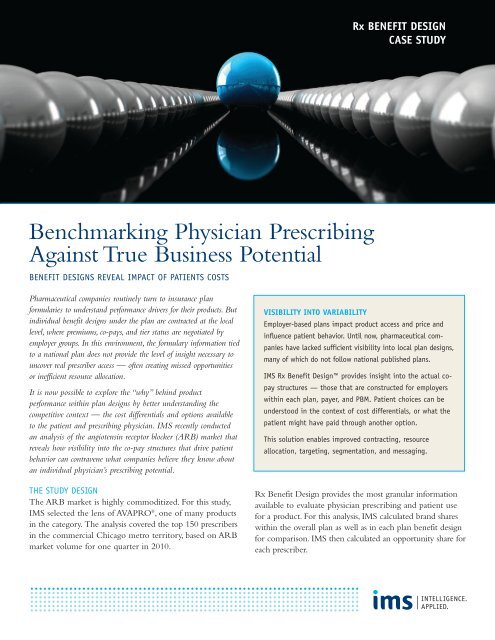
<strong>Benchmarking</strong> <strong>Physician</strong> <strong>Prescribing</strong><br />
<strong>Against</strong> <strong>True</strong> Business Potential<br />
BENEFIT DESIGNS REVEAL IMPACT OF PATIENTS COSTS<br />
Pharmaceutical companies routinely turn to insurance plan<br />
formularies to understand performance drivers for their products. But<br />
individual benefit designs under the plan are contracted at the local<br />
level, where premiums, co-pays, and tier status are negotiated by<br />
employer groups. In this environment, the formulary information tied<br />
to a national plan does not provide the level of insight necessary to<br />
uncover real prescriber access — often creating missed opportunities<br />
or inefficient resource allocation.<br />
It is now possible to explore the “why” behind product<br />
performance within plan designs by better understanding the<br />
competitive context — the cost differentials and options available<br />
to the patient and prescribing physician. <strong>IMS</strong> recently conducted<br />
an analysis of the angiotensin receptor blocker (ARB) market that<br />
reveals how visibility into the co-pay structures that drive patient<br />
behavior can contravene what companies believe they know about<br />
an individual physician’s prescribing potential.<br />
THE STUDY DESIGN<br />
The ARB market is highly commoditized. For this study,<br />
<strong>IMS</strong> selected the lens of AVAPRO ® , one of many products<br />
in the category. The analysis covered the top 150 prescribers<br />
in the commercial Chicago metro territory, based on ARB<br />
market volume for one quarter in 2010.<br />
Rx BENEFIT DESIGN<br />
CASE STUDY<br />
VISIBILITY INTO VARIABILITY<br />
Employer-based plans impact product access and price and<br />
influence patient behavior. Until now, pharmaceutical companies<br />
have lacked sufficient visibility into local plan designs,<br />
many of which do not follow national published plans.<br />
<strong>IMS</strong> Rx Benefit Design provides insight into the actual copay<br />
structures — those that are constructed for employers<br />
within each plan, payer, and PBM. Patient choices can be<br />
understood in the context of cost differentials, or what the<br />
patient might have paid through another option.<br />
This solution enables improved contracting, resource<br />
allocation, targeting, segmentation, and messaging.<br />
Rx Benefit Design provides the most granular information<br />
available to evaluate physician prescribing and patient use<br />
for a product. For this analysis, <strong>IMS</strong> calculated brand shares<br />
within the overall plan as well as in each plan benefit design<br />
for comparison. <strong>IMS</strong> then calculated an opportunity share for<br />
each prescriber.
BEYOND THE FORMULARY<br />
With <strong>IMS</strong> Xponent PlanTrak ® , <strong>IMS</strong> first evaluated subnational<br />
performance by plan. AVAPRO has an above<br />
average share in the Chicago territory and an even higher<br />
share in the top plan in the territory, Blue Cross Blue<br />
Shield (BCBS) of Illinois. (The preferred brands within this<br />
PPO are BENICAR ® and DIOVAN ® . )<br />
The analysis showed that 17 percent of AVAPRO volume for<br />
the BCBS PPO was through a 2-tier structure. This finding<br />
reveals that the assumption that tier status alone reflects<br />
therapeutic options available to patients does not<br />
necessarily hold true. It also refutes the commonly held<br />
belief that 2-tier designs are predominantly closed and thus<br />
provide very little opportunity for non-preferred brands.<br />
Performance of preferred brands also varies across multitiered<br />
benefit designs, as observed by an analysis of co-pay<br />
differentials available through Rx Benefit Design. AVAPRO<br />
and DIOVAN, for instance, mirrored what <strong>IMS</strong> has seen in<br />
almost every market studied: As co-pay differentials (i.e.,<br />
difference between tier 2 and tier 3 co-pays) decrease, the<br />
transaction shares of those drugs move closer together. (See<br />
Figure 1). For example, the non-preferred drug AVAPRO is<br />
only 2.3 percentage points lower than the preferred market<br />
leader Diovan when the differential is $15, compared to a<br />
FIG. 1: CO-PAY DIFFERENTIALS DRIVE<br />
PATIENT CHOICE<br />
BCBS-IL<br />
TRx Share<br />
35.0%<br />
30.0%<br />
25.0%<br />
20.0%<br />
15.0%<br />
10.0%<br />
5.0%<br />
28.9%<br />
4.8%<br />
17.6%<br />
7.5%<br />
— Avapro — Diovan<br />
13.7%<br />
11.4%<br />
0.0%<br />
$20-$50 $30-$50 $20-$35<br />
24.1 percentage point gap when the differential is $30. This<br />
finding is significant for a competitor to the dominant<br />
drug in the category.<br />
PHYSICIAN-LEVEL OPPORTUNITIES<br />
<strong>Physician</strong> performance can also be evaluated within the<br />
context of benefit design. As indicated in physician-level<br />
Xponent PlanTrak data, AVAPRO’s share is significantly<br />
different across the top prescribers in the top local plan,<br />
ranging from 0 percent to 31 percent. The volume for<br />
the top writer with no AVAPRO prescriptions is highly<br />
concentrated in BCBS-IL PPO (60 percent). Despite the<br />
fact that AVAPRO is not a preferred drug, Rx Benefit<br />
Design shows that 31 percent of the benefit design volume<br />
for this physician is advantageous for AVAPRO (18 percent<br />
from the $20/$30 co-pay category in which AVAPRO<br />
does well and 13 percent from the $15 2-tier design).<br />
(See Figure 2).<br />
After identifying such opportunities for growth within a<br />
plan for a product with relatively poor formulary position,<br />
the company can re-evaluate physician targeting, call plans,<br />
frequency, messaging and resource allocation, including<br />
sampling. Providing a doctor with information on patients’<br />
willingness to pay within certain design structures can be a<br />
value-add. Such insight also may be used in goal setting for<br />
the field force.<br />
<strong>Benchmarking</strong> at the level of granularity provided by Rx<br />
Benefit Design enables the company to compare a given<br />
physician’s prescription volume (11.1 percent in the case<br />
shown in Figure 3) to the shares within each specific design<br />
rather than solely to the overall plan volume (8.3 percent).<br />
AVAPRO performance is strong in the $30_$50 design and<br />
shows potential for growth in the $20_$35 design.<br />
Across the entire territory in the Chicago area, the analysis<br />
uncovered 45 prescribers for whom the prescribing<br />
opportunity had been understated and another 44 for<br />
whom the opportunity had been overstated prior to the<br />
benchmarking done with Rx Benefit Design. This is a<br />
significant change in potential resource allocation for one<br />
territory, which will result in a much higher ROI by<br />
focusing effort on prescribers with true potential.
FIG. 2: CO-PAY STRUCTURES<br />
REPRESENT HIDDEN POTENTIAL<br />
� OTHER (3) 14%<br />
� AETNA IL 5%<br />
� COUNTY HEALTH 5%<br />
� MEDCO 7%<br />
� FEPBLUE 9%<br />
THE ULTIMATE ROI<br />
Such analyses, which increase the accuracy of physician<br />
benchmarking, finally reveal the true impact of managed<br />
care. The data can be leveraged for goal setting, targeting,<br />
segmentation and monitoring sales force performance.<br />
Benefit design details can put the performance of individual<br />
physicians in a new light, revealing that some have greater<br />
FIG. 3: MORE ACCURATE BENCHMARKING BASED ON TRUE POTENTIAL<br />
Plan<br />
Benchmark<br />
Avapro BCBS-IL<br />
Plan Rx Benefit<br />
Design Benchmarks<br />
Avapro BCBS-IL in<br />
each Rx Benefit Design<br />
<strong>Physician</strong> 13434 TRx by Plan<br />
$30_$50<br />
7.4%<br />
20.7%<br />
Potential for Avapro<br />
31% of the BCBS-IL plan volume for<br />
this Dr is advantageous for Avapro<br />
BCBS-IL<br />
(PPO) 60%<br />
Avapro<br />
8.3%<br />
$40_$60<br />
0.2%<br />
0.0%<br />
BCBS-IL<br />
potential than had been assumed and that others, previously<br />
viewed as under-performers, are indeed prescribing to their<br />
full potential. Whether expectations are realistically reduced<br />
or dramatically raised, the results are the same: optimized<br />
resources and the highest possible return. ●<br />
For more information, call 800.523.5333 or contact<br />
your <strong>IMS</strong> representative.<br />
$20_$35<br />
11.4%<br />
0.0%<br />
11.1%<br />
25%<br />
20%<br />
15%<br />
10%<br />
5%<br />
0%<br />
BCBS-IL by Benefit Design<br />
21%<br />
$40_$60<br />
18% 16%<br />
$20_$35<br />
$25_$50<br />
Dr 75318<br />
Avapro<br />
Shares<br />
13%<br />
$15<br />
9% 6%<br />
$30_$50<br />
$20_$50<br />
17%<br />
Other<br />
Benefit<br />
Designs (5)
ABOUT <strong>IMS</strong> HEALTH<br />
Operating in more than 100 countries, <strong>IMS</strong> <strong>Health</strong><br />
is the world’s leading provider of market intelligence<br />
to the pharmaceutical and healthcare industries.<br />
With more than 55 years of industry experience,<br />
<strong>IMS</strong> <strong>Health</strong> offers leading-edge market intelligence<br />
products and services that are integral to clients’ dayto-day<br />
operations, including product and portfolio<br />
management capabilities; commercial effectiveness<br />
innovations; managed care and consumer health<br />
offerings; and consulting and services solutions that<br />
improve productivity and the delivery of quality<br />
healthcare worldwide.<br />
<strong>IMS</strong> HEALTH®<br />
200 Campus Drive<br />
Collegeville, PA 19426<br />
800.523.5333<br />
www.imshealth.com<br />
© 2011 <strong>IMS</strong> <strong>Health</strong> Incorporated or its affiliates. All Rights Reserved. 11070-A