Chapter 2 Diesel engine exhaust emissions - Tampereen teknillinen ...
Chapter 2 Diesel engine exhaust emissions - Tampereen teknillinen ...
Chapter 2 Diesel engine exhaust emissions - Tampereen teknillinen ...

Create successful ePaper yourself
Turn your PDF publications into a flip-book with our unique Google optimized e-Paper software.
<strong>Tampereen</strong> <strong>teknillinen</strong> yliopisto. Julkaisu 1078<br />
Tampere University of Technology. Publication 1078<br />
Matti Happonen<br />
Particle and NOx Emissions from a HVO-Fueled <strong>Diesel</strong><br />
Engine<br />
Thesis for the degree of Doctor of Science in Technology to be presented with due<br />
permission for public examination and criticism in Sähkötalo Building, Auditorium S4, at<br />
Tampere University of Technology, on the 26 th of October 2012, at 12 noon.<br />
<strong>Tampereen</strong> <strong>teknillinen</strong> yliopisto - Tampere University of Technology<br />
Tampere 2012
Doctoral candidate: Matti Happonen, M.Sc.<br />
Aerosol Physics Laboratory<br />
Department of Physics<br />
Tampere University of Technology<br />
Present address:<br />
Ecocat Oy, Vihtavuori<br />
Supervisors: Annele Virtanen, assoc. prof.<br />
Aerosol Physics Laboratory<br />
Department of Physics<br />
Tampere University of Technology<br />
Present address:<br />
Department of Applied Physics<br />
University of Eastern Finland, Kuopio<br />
Jorma Keskinen, prof.<br />
Aerosol Physics Laboratory<br />
Department of Physics<br />
Tampere University of Technology<br />
Pre-examiners: Miroslaw L. Wyszynski, prof.<br />
School of Mechanical Engineering<br />
University of Birmingham<br />
Erik Swietlicki, prof.<br />
Division of Nuclear Physics<br />
Department of Physics<br />
Lund University<br />
Opponent: Heejung Jung, assoc. prof.<br />
Department of Mechanical Engineering and CE-CERT<br />
University of California, Riverside<br />
ISBN 978-952-15-2921-4 (printed)<br />
ISBN 978-952-15-2935-1 (PDF)<br />
ISSN 1459-2045
Abstract<br />
Concerns about oil price, the strengthening climate change and traffic related health<br />
effects are all reasons which have promoted the research of renewable fuels. One<br />
renewable fuel candidate is diesel consisting of hydrotreated vegetable oils (HVO). The<br />
fuel is essentially paraffinic, has high cetane number (>80) and contains practically no<br />
oxygen, aromatics or sulphur. Furthermore, HVO fuel can be produced from various<br />
feedstocks including palm, soybean and rapeseed oils as well as animal fats. HVO<br />
has also been observed to reduce all regulated <strong>engine</strong> <strong>exhaust</strong> <strong>emissions</strong> compared to<br />
conventional diesel fuel.<br />
In this thesis, the effect of HVO fuel on <strong>engine</strong> <strong>exhaust</strong> <strong>emissions</strong> has been studied<br />
further. The thesis is roughly divided into two parts. The first part explores the emission<br />
reductions associated with the fuel and studies techniques which could be applied to<br />
achieve further emission reductions. One of the studied techniques was adjusting <strong>engine</strong><br />
settings to better suit HVO fuel. The settings chosen for adjustments were injection<br />
pressure, injection timing, the amount of EGR and the timing of inlet valve closing<br />
(with constant inlet air mass flow, i.e. Miller timing). The <strong>engine</strong> adjustments were<br />
also successfully targeted to reduce either NOx or particulate <strong>emissions</strong> or both. The<br />
other applied emission reduction technique was the addition of oxygenate to HVO fuel.<br />
The chosen oxygenate was di-n-pentyl ether (DNPE), and tested fuel blend included<br />
20 wt-% DNPE and 80 wt-% HVO. Thus, the oxygen content of the resulting blend<br />
was 2 wt-%. Reductions of over 25 % were observed in particulate <strong>emissions</strong> with the<br />
blend compared to pure HVO while NOx <strong>emissions</strong> altered under 5 %.<br />
On the second part of this thesis, the effect of the studied fuels on chosen surface<br />
properties of <strong>exhaust</strong> particles were studied using tandem differential mobility analyzer<br />
(TDMA) techniques and transmission electron microscopy (TEM). The studied surface<br />
properties were oxidizability and hygroscopicity. The oxidation properties were<br />
compared between soot particles emitted with HVO and with conventional diesel. The<br />
effects of fuel on hygroscopicity, on the other hand, were compared between HVO and<br />
oxygenated HVO fuel. In general, no considerable differences were observed in the<br />
<strong>exhaust</strong> particle surface properties due to the change of fuel.<br />
I
Preface<br />
The work of this thesis has been conducted in the Aerosol Physics Laboratory of<br />
the Department of Physics at Tampere University of Technology during the years<br />
2009–2012. I want to thank my supervisor Doc. Annele Virtanen for her guidance and<br />
support. Also, I would like to thank professor Jorma Keskinen, for his advises and,<br />
especially, for the opportunity to work in the Aerosol Physics Laboratory in the first<br />
place.<br />
No single researcher, nor even an institute in this case, can take all the credit for<br />
the work presented in this thesis. Therefore, I would like to express my sincere thanks<br />
to the group of professor Martti Larmi from Aalto University, especially Kalle Lehto<br />
and Teemu Sarjovaara, for operating the <strong>engine</strong> bench, to Maria Messing and Reine<br />
Wallenberg (Lund University) for HRTEM and EELS analyses and to Timo Murtonen<br />
and Päivi Aakko-Saksa (VTT) for PM measurements and chemical expertise. It has<br />
been a real pleasure to work with you.<br />
The same is valid also for the whole OQ group. Especially, I would like to thank<br />
Juha Heikkilä, with whom I have written most of the papers of this thesis, Tero<br />
Lähde and Topi Rönkkö, who guided me to the world of <strong>engine</strong> <strong>emissions</strong> and TDMA<br />
techniques, and Antti Rostedt, without whom the HTDMA would not have been built<br />
in time for the oxygenate measurements. Also, I would like to thank my roommates at<br />
work, Juha Harra and Heino Kuuluvainen, for creating this extraordinary atmosphere<br />
in which publishing bad pictures was not an option but, due to the standards set high,<br />
still hard to avoid.<br />
I acknowledge professor Miroslaw L. Wyszynski and professor Erik Swietlicki for the<br />
pre-examination of the thesis, as well as the project funding from Tekes – the Finnish<br />
Funding Agency for Technology and Innovation and Neste Oil Oyj. The personal<br />
financial support granted by Maj and Thor Nessling foundation, Kauko Haikarainen<br />
foundation, Finnish Foundation for Technology Promotion and Henry Ford foundation<br />
are also sincerely acknowledged.<br />
There are also people who have supported me to go on, not just through this thesis<br />
work, but throughout all my education. I am talking about my parents and my sister<br />
of course. Eila, Terho and Mari, you own my deepest thanks. Finally, I would like to<br />
thank my wife Pirjo for her love and for the patience she has shown over this project. I<br />
also appreciate her for kicking me off the bed to work at mornings. As for my daughter<br />
Veera, I think that I can safely say that you have no idea how much your presence has<br />
motivated me to finish the thesis in the schedule, so to speak.<br />
III
List of included publications<br />
This thesis is a compound thesis consisting of an introductory review and the following<br />
four publications. The publications are cited in the introductory review according to<br />
their numbering presented below.<br />
Paper 1 Juha Heikkilä, Matti Happonen, Timo Murtonen, Kalle Lehto, Teemu<br />
Sarjovaara, Martti Larmi, Jorma Keskinen, Annele Virtanen, ”Effect<br />
of Miller timing on particulate <strong>emissions</strong> of a HVO fueled research <strong>engine</strong>”,<br />
Journal of the Air and Waste Management Association, accepted in June 2012.<br />
DOI:10.1080/10962247.2012.708383.<br />
Paper 2 Matti Happonen, Juha Heikkilä, Timo Murtonen, Kalle Lehto, Teemu<br />
Sarjovaara, Martti Larmi, Jorma Keskinen, Annele Virtanen, ”Reductions<br />
in particulate and NOx <strong>emissions</strong> by diesel <strong>engine</strong> parameter adjustments<br />
with HVO fuel”, Environmental Science & Technology 46, 2012, pp. 6198–6204.<br />
Paper 3 Matti Happonen, Juha Heikkilä, Päivi Aakko-Saksa, Timo Murtonen,<br />
Kalle Lehto, Teemu Sarjovaara, Antti Rostedt, Martti Larmi, Jorma<br />
Keskinen, Annele Virtanen, ”<strong>Diesel</strong> <strong>exhaust</strong> <strong>emissions</strong> and particle hygroscopicity<br />
with HVO fuel-oxygenate blend”, Fuel, accepted in September 2012.<br />
DOI:10.1016/j.fuel.2012.09.006.<br />
Paper 4 Matti Happonen, Tero Lähde, Maria E. Messing, Teemu Sarjovaara,<br />
Martti Larmi, L. Reine Wallenberg, Annele Virtanen, Jorma Keskinen,<br />
”The comparison of particle oxidation and surface structure of diesel soot<br />
particles between fossil fuel and novel renewable diesel fuel”, Fuel 89, 2010, pp.<br />
4008–4013.<br />
V
VI<br />
Author’s contributions to the publications<br />
Paper 1: I planned and conducted particle size distribution measurements jointly<br />
with Juha Heikkilä. Further, I participated in deciding the contents of the paper and I<br />
had a minor contribution in the writing of the paper.<br />
Paper 2: I planned and conducted particle size distribution measurements jointly<br />
with Juha Heikkilä. In addition, I conducted the data-analysis, decided the contents of<br />
the paper and, with minor contribution from other authors, wrote the paper.<br />
Paper 3: I planned and conducted particle size distribution measurements jointly<br />
with Juha Heikkilä. I built and operated the HTDMA system and conducted the<br />
data-analysis for particle measurements. I also decided the contents of the paper and,<br />
with minor contribution from other authors, wrote the paper.<br />
Paper 4: I had the main responsibility in planning and conducting the oxidation<br />
measurements and collecting the TEM samples. I performed the data-analysis of the<br />
oxidation measurements. Further, I decided the contents of the paper and I had the<br />
main resposibility for writing the paper.
Symbols and abbreviations<br />
BTL Biomass to liquid<br />
CA Crank angle<br />
CO Carbon monoxide<br />
CPC Condensation particle counter<br />
DMA Differential mobility analyzer<br />
DME Dimethyl ether<br />
DNPE Di-n-pentyl ether<br />
DR Dilution ratio<br />
EC Elemental carbon<br />
EELS Electron energy loss spectrum/spectrometry<br />
EGR Exhaust gas recirculation<br />
ELNES Electron energy loss near-edge structure<br />
ELPI Electrical low-pressure impactor<br />
EN590 Current diesel fuel standard in Europe<br />
FAME Fatty acid methyl ester<br />
FSN Filter smoke number<br />
FT Fisher-Tropsch<br />
GMD Geometric mean diameter<br />
HC Hydrocarbons<br />
HR-TEM High resolution TEM<br />
HTDMA Hygroscopic TDMA<br />
HTO-TDMA High temperature oxidation TDMA<br />
HVO Hydrotreated vegetable oil<br />
IVC Intake valve closing<br />
Ntot<br />
Total particle number (emission)<br />
NOx<br />
Total of mono-nitrogen oxides (NO and NO2)<br />
OC Organic carbon<br />
Pinj<br />
Fuel injection pressure<br />
PAH Polyaromatic hydrocarbon<br />
PM Particulate matter, i.e. mass of <strong>exhaust</strong> collected on a filter<br />
RH Relative humidity<br />
SMPS Scanning mobility particle sizer<br />
SOI Start of fuel injection<br />
TDMA Tandem differential mobility analyzer<br />
TEM Transmission electron microscope/microscopy<br />
VVA Variable valve actuator<br />
VVT Variable valve timing<br />
VII
VIII
Contents<br />
1 Introduction 1<br />
2 <strong>Diesel</strong> <strong>engine</strong> <strong>exhaust</strong> <strong>emissions</strong>: an overview 5<br />
2.1 Exhaust <strong>emissions</strong> and regulations . . . . . . . . . . . . . . . . . . . . 5<br />
2.2 Exhaust particles . . . . . . . . . . . . . . . . . . . . . . . . . . . . . . 6<br />
2.3 Measuring <strong>emissions</strong> . . . . . . . . . . . . . . . . . . . . . . . . . . . . 7<br />
3 Hydrotreated vegetable oil diesel fuel 11<br />
3.1 Chemical composition and production . . . . . . . . . . . . . . . . . . . 11<br />
3.2 Exhaust <strong>emissions</strong> . . . . . . . . . . . . . . . . . . . . . . . . . . . . . 13<br />
4 Techniques to reduce <strong>emissions</strong> 17<br />
4.1 Engine parameter adjustments . . . . . . . . . . . . . . . . . . . . . . 17<br />
4.2 Blended oxygenate . . . . . . . . . . . . . . . . . . . . . . . . . . . . . 24<br />
4.3 Discussion of the results . . . . . . . . . . . . . . . . . . . . . . . . . . 29<br />
5 Effect of fuel on particle surface 31<br />
5.1 Studied properties . . . . . . . . . . . . . . . . . . . . . . . . . . . . . . 31<br />
5.2 Particle microstructure . . . . . . . . . . . . . . . . . . . . . . . . . . . 32<br />
5.3 Oxidizability . . . . . . . . . . . . . . . . . . . . . . . . . . . . . . . . 34<br />
5.4 Hygroscopicity . . . . . . . . . . . . . . . . . . . . . . . . . . . . . . . . 41<br />
5.5 Discussion of the results . . . . . . . . . . . . . . . . . . . . . . . . . . 46<br />
6 Summary and final remarks 49<br />
References 51<br />
IX
X CONTENTS
<strong>Chapter</strong> 1<br />
Introduction<br />
”We are not running out of oil, but we are running out of oil that can be produced<br />
easily and cheaply” claims a recent comment published in Nature (Murray and King<br />
2012). The grounds for this claim are that it seems we have reached an oil production<br />
peak in around 2005. Reaching the peak means that the supply of oil is no longer able<br />
to meet the demand leading to oil price swings which, possibly, are one of the reasons<br />
behind the current economic crisis (Murray and King 2012). Because of the impact of<br />
oil to the economy, and due to the fact that oil reserves on the world are quite localized<br />
to certain regions, it is not surprising that alternatives to oil are being researched in<br />
different fields of industry. Of these fields, transportation is the highest consumer of oil<br />
being responsible for 61.4 % (in 2008) of the annual overall consumption (IEA 2010).<br />
One route to ease the problem in the transportation sector is to add renewable fuel<br />
components to the fossil fuel or, further, substitute the fossil fuel with renewable fuel<br />
altogether. Using renewable fuel in a combustion <strong>engine</strong> is not a new idea. Already at<br />
the 1900 World’s Fair in Paris, a small diesel <strong>engine</strong> built for petroleum was used with<br />
peanut oil although only a few insiders knew about the situation (Knothe et al. 2005).<br />
After that, the progress in diesel <strong>engine</strong> technology has led to the use of less viscous<br />
fluids favouring fuels based on crude oil. However, the crises about the supply of<br />
mineral oil in 1970s and 1990s have rekindled the interest to use renewable components<br />
in fuels (Körbitz 1999).<br />
The use of renewable fuels has also potential to be a part of the solution to ease<br />
the current environmental crisis of climate change. Since the start of the industrial era<br />
(approximately 1750), human activities have had a warming effect on climate mainly<br />
caused by burning fossil fuels (Le Treut et al. 2007). If left unhindered, the climate<br />
change can lead to, for example, more intense tropical storms, more frequent heat<br />
waves, a rise of the sea level, more frequent heavy precipitation events and an increase<br />
in the area affected by droughts (Pachauri and Reisinger 2007). Increasing the share<br />
of renewable energy is one path to reduce the net <strong>emissions</strong> of greenhouse gases and,<br />
thus, mitigate the effects of the climate change.<br />
The biofuel that has been used most extensively so far as an addition to as well as a<br />
replacement for fossil diesel is biodiesel. Biodiesel can be defined as monoalkyl esters of<br />
vegetable oils or animal fats (Demirbas 2007a). Thus, the term fatty acid methyl esters<br />
1
2 1. Introduction<br />
(FAME) is often used instead of biodiesel. Biodiesels have been produced from variable<br />
feedstocks including palm oil (Kalam and Masjuki 2002), jathorpha (Jain and Sharma<br />
2010), soybean (Chang et al. 1996) and rapeseed (Labeckas and Slavinskas 2006) to<br />
name a few and they are commercially available. Other promising biofuels for diesel<br />
<strong>engine</strong>s are dimethyl ether (DME, Semelsberger et al. (2006)) and paraffinic diesels<br />
such as Fischer-Tropsch (FT) diesel (Dry 2002) and hydrotreated vegetable oils (HVO,<br />
Rantanen et al. (2005)). From these DME is a gaseous compound in room temperature<br />
so it requires new storage and fuel delivery systems (Semelsberger et al. 2006). FT<br />
diesel can be produced from coal, natural gas or biomass (Demirbas 2007b). The fuel is<br />
paraffinic, it can be blended to conventional diesel at random proportions and no <strong>engine</strong><br />
modifications are required (Huang et al. 2008). Unfortunately, the production costs of<br />
FT-diesel from biomass feedstock have not been competitive enough with conventional<br />
diesel prices to enable commercial production (Tijmensen et al. 2002). HVO fuel has<br />
very similar composition compared to FT diesel and, thus, it shares its advantages, for<br />
example, regarding <strong>engine</strong> modifications (Kuronen et al. 2007). However, HVO fuel is<br />
already being produced commercially.<br />
Besides reducing the dependence of crude oil and potential to reduce greenhouse<br />
gas <strong>emissions</strong>, the mentioned renewable diesels have the advantage to reduce certain<br />
<strong>exhaust</strong> emission components. Using FAME has been shown to noticeably reduce<br />
particulate emission mainly due to the oxygen content in the fuel (Lapuerta et al.<br />
2008). For the same reason DME reduces particulate <strong>emissions</strong> practically to zero<br />
(Sorenson 2001). For these fuels NOx <strong>emissions</strong> increase somewhat but the increase is<br />
small compared to the reduction in particulates (Lapuerta et al. 2008). FT fuels as well<br />
as HVO fuels have been shown to reduce all regulated (PM, CO, HC, NOx) <strong>emissions</strong><br />
(Gill et al. 2011a; Kuronen et al. 2007; Aatola et al. 2008). Most of this property is<br />
associated with the absence of aromatics in FT and HVO fuels. The reasons behind<br />
the emission reductions achieved with high cetane number paraffinic diesel fuels are<br />
discussed in more detail in Section 3.2 of this thesis.<br />
The reductions in particulate <strong>emissions</strong> achieved by using the mentioned renewable<br />
diesels are welcome as emitted diesel particles have been associated with adverse health<br />
effects. Correlations between ambient nanoparticle concentration and mortality has<br />
been found on several studies (e.g. Dockery et al. 1993; Laden et al. 2006; Pope III<br />
et al. 2009) but the exact mechanisms by which the particles affect health are still<br />
largely unknown and currently under intensive research. So far diesel particles have<br />
been associated with cardiovascular diseases (Miller et al. 2007; Mills et al. 2008)<br />
and sufficiently small particles have been shown to be able to enter the bloodstream<br />
through lungs and even reach the brain (Oberdörster et al. 2004). In June 2012,<br />
World Health Organization even promoted the classification of diesel <strong>exhaust</strong> from<br />
probably carcinogenic to humans (Group 2A) to carsinogenic to humans (Group 1)
ased on sufficient evidence (WHO 2012). Globally, but especially in Europe and in<br />
the USA, the increased knowledge of adverse health effects of diesel particles has led to<br />
stricter regularization of particulate <strong>emissions</strong>. Due to the particle reducing potential<br />
of renewable diesel fuels, they can be a part of the solution to reach the emission limits<br />
together with <strong>exhaust</strong> aftertreatment techniques and <strong>engine</strong> optimization.<br />
Not only the amount of emitted particles but also the properties of the particles may<br />
alter as a consequence of changing the fuel from fossil diesel to renewable diesel (e.g. Jung<br />
et al. 2006; Lapuerta et al. 2012). These properties include, for example, the amount<br />
of semivolatile matter on the particles (volatility), the eagerness of particles to oxidize<br />
(oxidizability/reactivity) and the ability of particles to take on water (hygroscopicity).<br />
These properties are important since they provide information on the behaviour of<br />
emitted particles in aftertreatment devices, in the atmosphere and, further, in human<br />
respiratory system.<br />
As it has been already shown that HVO fuel reduces several <strong>exhaust</strong> <strong>emissions</strong>,<br />
this thesis will take the research to a step further. This thesis aims to show how<br />
<strong>exhaust</strong> <strong>emissions</strong> from a HVO-fueled <strong>engine</strong> can be further reduced and how the use<br />
of HVO-based fuel affects <strong>exhaust</strong> particle properties. The applied methods to reduce<br />
<strong>exhaust</strong> <strong>emissions</strong> studied in this thesis are <strong>engine</strong> optimization via variable valve<br />
timing (Paper 1), multiparameter <strong>engine</strong> optimization (injection timing, valve timing,<br />
<strong>exhaust</strong> gas recirculation, injection pressure, Paper 2) and an addition of oxygenate<br />
to the HVO fuel (Paper 3). The chosen methods are, of course, only a fraction of<br />
possible techniques to control <strong>exhaust</strong> <strong>emissions</strong> of a diesel <strong>engine</strong> but, according to the<br />
author’s knowledge, they have not been previously applied to renewable fuels. Thus,<br />
this thesis studies some new paths for <strong>emissions</strong> reductions with renewable diesel. The<br />
<strong>emissions</strong> considered in this thesis are primarily particulate and NOx <strong>emissions</strong> since<br />
these two emission components are the main targets of the upcoming Euro VI emission<br />
legislation in Europe.<br />
In Paper 3 and Paper 4, the effects of different fuels on <strong>exhaust</strong> particles have<br />
been studied by using tandem differential mobility analyzer (TDMA) techniques. These<br />
techniques enabled the studying of hygroscopic and oxidation properties of emitted<br />
particles. The development of the required measurement equipment with the aim of<br />
using them at measurement sites was also a significant part of this thesis.<br />
3
4 1. Introduction
<strong>Chapter</strong> 2<br />
<strong>Diesel</strong> <strong>engine</strong> <strong>exhaust</strong><br />
<strong>emissions</strong>: an overview<br />
2.1 Exhaust <strong>emissions</strong> and regulations<br />
The main <strong>emissions</strong> of diesel <strong>exhaust</strong> are CO, oxides of nitrogen (NO and NO2,<br />
collectively known as NOx), unburned or partly burned volatile hydrocarbons (HC)<br />
and soot particles. From the mentioned <strong>emissions</strong>, soot, CO and HC are formed due<br />
to incomplete combustion. However, when these <strong>emissions</strong> are reduced by increasing<br />
combustion temperature, NOx <strong>emissions</strong> are generally increased. This is caused by the<br />
chemical reactions involving oxygen and nitrogen in a high temperature environment.<br />
The high temperature shifts the chemical equilibrium to become favourable for rapid<br />
NOx formation but the subsequent cooling of the <strong>exhaust</strong> gas traps the gases in their<br />
high temperature equilibrium concentrations (Fernando et al. 2006). There can also be<br />
oxides of sulphur in the <strong>exhaust</strong>. Sulphur comes to the combustion process from the<br />
fuel and the lubricant. During combustion, sulphur is mainly oxidized to SO2, but a<br />
small amount can be oxidized to sulphur trioxide (SO3), which combines with water<br />
to form sulphuric acid. The suphuric acid then either condensates on existing soot<br />
particles or form new particles via nucleation.<br />
In Europe, on-road <strong>engine</strong> <strong>exhaust</strong> <strong>emissions</strong> have been regulated since 1992, and<br />
the regulations have become stricter ever since (<strong>Diesel</strong>net 2012). Table 2.1 presents<br />
the current and the future emission limits for heavy-duty diesel <strong>engine</strong>s in Europe. As<br />
Table 2.1: The latest <strong>exhaust</strong> emission limits (g/kWh) for heavy-duty diesel<br />
<strong>engine</strong>s over ESC cycle according to European regulations (<strong>Diesel</strong>net<br />
2012)<br />
Tier CO HC NOx PM<br />
Euro V (2008) 1.5 0.46 2.0 0.02<br />
Euro VI (2013) 1.5 0.13 0.4 0.01<br />
5
6 2. <strong>Diesel</strong> <strong>engine</strong> <strong>exhaust</strong> <strong>emissions</strong>: an overview<br />
it can be seen, the most radical reduction, 80 % compared to Euro V limit, in the<br />
future Euro VI standard is going to be in NOx <strong>emissions</strong>. Moreover, at the same time<br />
the allowed particulate matter (PM) emission will be halved. Therefore, overcoming<br />
the trade-off between PM and NOx thus enabling the simultaneous decrease in both<br />
of these <strong>emissions</strong> is perhaps the most challenging problem in meeting the future<br />
Euro VI standard. In addition to the particle mass limit, also a particle number limit<br />
(8·10 11 #/kWh over the WHSC cycle with a measurement system based on the work<br />
of the Particulate Measurement Programme (PMP), EU (2011)) will be introduced to<br />
emission regulations. The particle number limit has been introduced to ensure that<br />
emission regulations are not met with technology that produces large amounts of small<br />
nanoparticles.<br />
2.2 Exhaust particles<br />
The formation of <strong>exhaust</strong> particles begins by the formation of soot in the high temperature,<br />
fuel-rich reaction zone around individual fuel droplets (Neeft et al. 1996).<br />
First, molecular precursors of soot, namely acetylene and heavy PAHs, are formed by<br />
pyrolysis and/or oxidation of fuel molecules (Heywood 1988; Xi and Zhong 2006). The<br />
precursor soot then grows in size via nucleation/inception, surface growth, condensation<br />
and coagulation (Neeft et al. 1996; Xi and Zhong 2006). The resulting ”primary” soot<br />
particles, which are still near spherical, then leave the cylinder and coagulate further to<br />
form agglomerates (Neeft et al. 1996). Furthermore, oxidation is present in all stages<br />
of soot formation and it occurs on the surface of soot particles. There is considerable<br />
agreement on these general features of soot particle formation but many underlying<br />
mechanisms especially relating to nucleation and surface growth are still relatively<br />
poorly understood (Xi and Zhong 2006).<br />
When the <strong>exhaust</strong> gas cools down in the <strong>exhaust</strong> pipe and during dilution, hydrocarbons<br />
of relatively low volatility, sulphates and sulphuric acid adsorb and condense<br />
on the soot (Neeft et al. 1996). In addition to adsorption and condensation, these<br />
compounds can also be transformed to solid and liquid particulate matter via nucleation,<br />
i.e. the formation of new nanoparticles (Kittelson 1998). However, some recent studies<br />
indicate that there might be also non-volatile particles in the size range of these so<br />
called nucleation particles or small non-volatile cores within some of the particles that<br />
have been generally assumed to be volatile (Rönkkö et al. 2007; Lähde et al. 2008;<br />
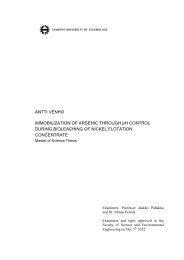
Filippo and Maricq 2008). An overall schematic of the composition and structure of<br />
diesel <strong>exhaust</strong> nanoparticles is shown in Figure 2.1.<br />
When <strong>exhaust</strong> particles are sorted by size, generally three separate particle modes<br />
can be observed (Kittelson 1998). These modes are usually quite near lognormal<br />
in shape and they are termed as nucleation, accumulation and coarse modes. The
Soot particles<br />
Volatile<br />
condensates<br />
Nucleation mode<br />
particles<br />
Figure 2.1: A schematic of the composition and structure of diesel <strong>exhaust</strong><br />
nanoparticles.<br />
nucleation mode is typically 5–50 nm in size and it consists of the mentioned nucleation<br />
particles. It may contribute over 90 % of the total particle number (Kittelson 1998)<br />
although its mass content is often low. The nucleation mode has also been observed to<br />
be quite sensitive to the dilution of the <strong>exhaust</strong> (Eastwood 2008). Most of the total<br />
particulate mass exists in the accumulation mode. Accumulation particles are generally<br />
under 300 nm in diameter and they consists of soot agglomerates coated by adsorbed<br />
material (Kittelson 1998). The coarse mode consists of accumulation mode particles<br />
that have deposited in the <strong>exhaust</strong> system and later re-entered the <strong>exhaust</strong> stream as<br />
much larger particles, over 1 µm in diameter (Eastwood 2008). This storage-release<br />
makes the coarse mode particle emission inconsistent which is one of the reasons why<br />
this thesis will concentrate on particles belonging to the other two modes.<br />
2.3 Measuring <strong>emissions</strong><br />
Particle sampling may cause unintentional transformations in the sampled aerosol.<br />
Depending on sampling and dilution conditions, the degree of condensation and<br />
nucleation of volatile hydrocarbons, particle losses and the amount of coagulation<br />
occurring before the measurement instruments may vary. In this thesis, two different<br />
sampling/dilution systems were applied. These systems will be now described shortly.<br />
7
8 2. <strong>Diesel</strong> <strong>engine</strong> <strong>exhaust</strong> <strong>emissions</strong>: an overview<br />
The sampling and dilution system applied in Paper 1, Paper 2 and Paper 3<br />
was based on a system developed for the "Particulates" research program of the EU<br />
(Ntziachristos et al. 2004). The sampled particles were first diluted by a porous tube<br />
diluter (Mikkanen et al. 2001) which had low particle losses and allowed nucleation of<br />
volatile compounds. A dilution ratio of 12 was used in the porous tube diluter as there<br />
is evidence that the chosen dilution ratio allows the imitation of nucleation particle<br />
formation in real world (Rönkkö et al. 2006). A dilution air temperature of 30 ◦ C was<br />
used in line with the "Particulates" system. The porous tube diluter was followed by<br />
an aging chamber (volume 2.3 dm 3 ) to allow the possibly formed nucleation mode<br />
to grow to measurable particle sizes (Vaaraslahti et al. 2004). The sample was then<br />
further diluted with an ejector diluter in order to reduce the particle concentrations to<br />
the range of the measurement instruments. According to Giechaskiel et al. (2009), the<br />
ejector diluter does not change the characteristics of particle size distribution so it can<br />
be safely used to further dilute the already diluted <strong>exhaust</strong>. The dilution ratio of the<br />
system was obtained by comparing the raw and diluted CO2 concentrations.<br />
A thermodenuder was also applied either to study the volatility of <strong>exhaust</strong> particles<br />
(Paper 1, Paper 2) or to ensure that the sampled particles were free of volatile<br />
compounds (Paper 4). The principle of the thermodenuder treatment is to first heat<br />
the aerosol sample to a high enough temperature (in this thesis 265 ◦ C), so that the<br />
possibly condensated volatile compounds on the <strong>exhaust</strong> particles evaporate, and then<br />
to absorb the evaporated compounds to a layer of active charcoal in order to avoid<br />
recondensation/nucleation. The flow rate through the thermodenuder was typically<br />
approximately 12 lpm. A schematic of the measurement setup applied in Paper 1,<br />
Paper 2 and Paper 3 is presented in Figure 2.2.<br />
In Paper 1, Paper 2 and Paper 3, particle number and particle size distribution<br />
measurements were conducted with condensation particle counters (CPC, Cheng (2011))<br />
and scanning mobility particle sizers (SMPS, Wang and Flagan (1990)), respectively. In<br />
addition, an electrical low pressure impactor (ELPI, Keskinen et al. (1992)) was always<br />
used together with the mentioned instruments to ensure that the <strong>exhaust</strong> sample was<br />
stable during the measurements.<br />
Particulate matter (PM) mass measurements were conducted using a separate<br />
sampling line with an AVL SPC 472 micro dilution tunnel according to the ISO<br />
8178-1:2006 standard whereas NOx measurements were measured with an Eco Physics<br />
CLD 822 S h analyzer through a heated sample line.<br />
The discussed measurement instruments primarily measure emission concentrations.<br />
Nevertheless, concentration is not the optimal quantity in representing <strong>exhaust</strong> <strong>emissions</strong><br />
since it does not take into account the differences in the <strong>exhaust</strong> mass flows in different<br />
<strong>engine</strong> conditions. Therefore, the <strong>emissions</strong> of PM, Ntot and NOx presented in this<br />
thesis are converted to the units of [emission]/kWh. This is performed by using the
Porous tube<br />
diluter<br />
CO2<br />
Exhaust pipe<br />
PM, NOx, CO2<br />
Filtered<br />
air<br />
Aging chamber<br />
Thermodenuder<br />
Particle number<br />
measurement instrumentation<br />
Ejector<br />
diluter<br />
3-way<br />
valve<br />
Figure 2.2: Measurement setup applied in Paper 1, Paper 2 and Paper 3.<br />
Figure modified from Paper 1.<br />
following equation:<br />
X<br />
E<br />
˙mexh<br />
= x , (2.1)<br />
ρairPind<br />
where X is the absolute emission in question, x is the emission concentration in question<br />
(e.g. in units #/cm 3 ), E is energy (kWh), ˙mexh is the <strong>exhaust</strong> mass flow, ρair is the<br />
density of <strong>exhaust</strong> air at the measurement temperature and Pind is the indicated power<br />
of the <strong>engine</strong>.<br />
In Paper 4, the dilution was performed by a heated ejector diluter. The heated<br />
ejector pump sampling has been applied previously by e.g. Maricq et al. (1999) and<br />
Lyyränen et al. (2004). Heating of the primary ejector diluter is required to avoid the<br />
blocking of the ejector nozzle due to thermophoretic and vapour deposition (Lyyränen<br />
et al. 2004). Due to the small temperature difference between the primary dilution<br />
air and <strong>exhaust</strong> gas, the condensation and nucleation of volatile compounds can be<br />
mostly avoided. Normally the heated ejector diluter is followed by a cold ejector as<br />
a secondary diluter. However, as the focus in Paper 4 was not on the concentration<br />
but on the properties of soot particles, and as a high concentration of particles was<br />
required, only the primary ejector diluter was used. A more detailed description of the<br />
9
10 2. <strong>Diesel</strong> <strong>engine</strong> <strong>exhaust</strong> <strong>emissions</strong>: an overview<br />
measurement system of Paper 4 is presented later in <strong>Chapter</strong> 5.
<strong>Chapter</strong> 3<br />
Hydrotreated vegetable oil<br />
diesel fuel<br />
3.1 Chemical composition and production<br />
Hydrotreated vegetable oil (HVO) is renewable diesel fuel that can be blended to fossil<br />
diesel or used as such (Kuronen et al. 2007). Hydrotreated vegetable oil (HVO) fuel<br />
composes of long chain n- and iso-paraffins (CnH2n+2) (Rantanen et al. 2005). As fully<br />
paraffinic fuel, HVO contains practically no sulphur, oxygen or aromatics. Typical<br />
HVO fuel properties and, for comparison, typical diesel fuel properties are presented<br />
in Table 3.1. The compared typical diesel fuel met the European EN590 diesel fuel<br />
standard. The most dramatic differences between fossil EN590 diesel fuel and HVO<br />
fuel are cetane number and density. In fact, the low density value of HVO is the reason<br />
why HVO does not meet the EN590 specification in which the lower density limit is 820<br />
kg/m 3 (<strong>Diesel</strong>net 2012). However, up to 30 % HVO can be blended into fossil diesel<br />
while still meeting the specification. Cetane number describes fuel ignition quality.<br />
More specifically, cetane number is a measure of the ignition delay of the fuel (Heywood<br />
1988). The higher is cetane number the shorter is the ignition delay. Pure HVO, in<br />
general, has very low lubricity due to the absence of sulphur and oxygen compounds<br />
(Lapuerta et al. 2011). However, similar doses of additives that are used to improve<br />
the lubricity of ultra-low sulphur diesels (ULSD) can be used to improve the lubricity<br />
of HVO fuel also (Kuronen et al. 2007).<br />
Due to the lower volumetric heating value of HVO, a larger volume of HVO is<br />
required in order to achieve a given load point. Thus, the volumetric fuel consumption<br />
increases compared to EN590 diesel fuel. However, as the density of HVO is lower than<br />
that of EN590 diesel, the mass based fuel consumption actually decreases with HVO.<br />
HVO is produced by hydrogenating the double bonds and removing the oxygen<br />
from the triglyceride chain of the vegetable oil (Lapuerta et al. 2011). In addition<br />
to the feedstock oil, the process requires hydrogen and produces n- and iso-alkanes<br />
as end products. Propane, water and CO or CO2 are produced as byproducts. A<br />
more detailed account of the chemical process is described, for example, by Huber<br />
and Corma (2007), Helwani et al. (2009) and Lapuerta et al. (2011). Fatty acids from<br />
11
12 3. Hydrotreated vegetable oil diesel fuel<br />
Table 3.1: Typical fuel properties of HVO fuel and European EN590 summer<br />
grade diesel fuel (Kuronen et al. 2007). The HVO fuel includes lubricity<br />
additive.<br />
HVO EN590<br />
density at 15 ◦ C (kg/m 3 ) 775–785 835<br />
viscosity 40 ◦ C (mm 2 /s) 2.9–3.5 3.5<br />
distillation area ( ◦ C) 190–320 180–360<br />
cloud point ( ◦ C) (−25)–(−5) −5<br />
lower heating value (MJ/kg) 44 42.7<br />
lower heating value (MJ/l) 34.4 35.7<br />
cetane number 80–99 53<br />
total aromatics (wt-%) 0 30<br />
oxygen content (wt-%) 0 0<br />
sulfur content (mg/kg)
during post-processing. The end product is high quality diesel fuel that has high cetane<br />
number and is virtually free from aromatics or suphur (Gill et al. 2011a).<br />
Thus, HVO fuel is chemically very similar to fuels produced using FT synthesis<br />
(Aatola et al. 2008). Paraffinic renewable fuels in general are more readily accepted by<br />
<strong>engine</strong> manufacturers and fuel distributors than transesterified biodiesels as paraffinic<br />
fuels have better storage stability (Kuronen et al. 2007). This enables the distribution<br />
of HVO and FT diesels with the current fuel logistics. It has been also reported<br />
that in most cases HVO outperforms transesterified biodiesels regarding the lifecycle<br />
environmental impacts of the fuels when produced from the same feedstock (Sunde<br />
et al. 2011).<br />
The HVO fuel that has been used in this thesis is produced by Neste Oil (Rantanen<br />
et al. 2005) and branded as NExBTL. The fuel is produced using mainly palm oil as<br />
feedstock.<br />
3.2 Exhaust <strong>emissions</strong><br />
Prior to the work in this thesis, quite few articles had studied the <strong>exhaust</strong> emission of<br />
a diesel <strong>engine</strong> run using HVO as fuel. Rantanen et al. (2005) studied the <strong>emissions</strong><br />
with maximum of 85 vol-% HVO blended to fossil diesel using three light duty cars and<br />
concluded that hydrocarbon (HC) and carbon monoxide (CO) concentration as well as<br />
particulate matter (PM) emission decreased with HVO blends but no clear decrease in<br />
NOx emission was observed. Kuronen et al. (2007) and Murtonen et al. (2010) studied<br />
<strong>emissions</strong> with heavy-duty <strong>engine</strong>s, mainly buses, using neat HVO fuel. Some of the<br />
studied <strong>engine</strong>s used aftertreatment devices and some used <strong>exhaust</strong> gas recirculation<br />
(EGR). Reported decreases were 3–28 % in NOx emission and 17–51 % in PM when<br />
the fuel was changed from fossil EN590 fuel to HVO. Decreases were observed also in<br />
CO and HC <strong>emissions</strong> as well as in aldehyde and polyaromatic hydrocarbon (PAH)<br />
<strong>emissions</strong> (Murtonen et al. 2010). Also Aatola et al. (2008) compared the <strong>emissions</strong><br />
with fossil EN590 fuel with neat HVO with a heavy-duty <strong>engine</strong> and obtained 35 %<br />
decrease in smoke and 5 % decrease in NOx with HVO on average.<br />
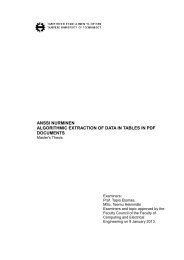
In Paper 1, particulate and NOx <strong>emissions</strong> of a single cylinder research <strong>engine</strong>,<br />
which was used also in Paper 2 and Paper 3, were studied both with fossil EN590<br />
fuel as well as with HVO. The <strong>engine</strong> used manufacturer’s <strong>engine</strong> settings for each load<br />
condition, and there were no aftertreatment devices installed to the <strong>engine</strong>. PM and<br />
NOx <strong>emissions</strong> of the <strong>engine</strong> with three different <strong>engine</strong> loads (50, 75 and 100 %) are<br />
shown in Figure 3.1. The decrease in PM emission with HVO was roughly 30–40 %<br />
depending on load (the 40 % decrease was observed at the highest load) compared to<br />
EN590 fuel. In addition, HVO decreased also NOx <strong>emissions</strong> roughly 3–6 % (lowest<br />
decrease with 100 % load). Thus, the decrease in PM and in NOx with the <strong>engine</strong> was<br />
13
14 3. Hydrotreated vegetable oil diesel fuel<br />
in line with the mentioned previous studies.<br />
PM (mg/kWh)<br />
240<br />
200<br />
160<br />
120<br />
80<br />
40<br />
0<br />
EN590, PM<br />
HVO, PM<br />
EN590, NOx<br />
HVO, NOx<br />
50 75<br />
Load (%)<br />
100<br />
Figure 3.1: Particulate mass (PM) and NOx <strong>emissions</strong> with HVO fuel and fossil<br />
EN590 fuel. The measurements were performed using a single-cylinder<br />
research <strong>engine</strong>. Modified from Paper 1.<br />
The main reasons for the lower PM emission with HVO fuel are probably the<br />
lower aromatic hydrocarbon concentration and the higher cetane number of HVO<br />
fuel. Most studies have shown that higher aromatic concentrations in fuel lead to<br />
higher particulate <strong>emissions</strong> although, in some cases, the effect of aromatics is disguised<br />
by, for example, the <strong>engine</strong> model and calibration (Eastwood 2008). Cetane number,<br />
on the other hand, affects the ignition delay of the fuel. In the case of the research<br />
<strong>engine</strong> of Paper 1, the manufacturer’s setting for the fuel injection was quite late<br />
in order to reduce NOx formation. Thus, as the higher cetane number advanced the<br />
ignition, the combustion phasing became more optimal for fuel combustion and the<br />
soot formation was somewhat suppressed. In some cases, the higher cetane number and,<br />
thus, shorter ignition delay may lead to increased particulate emission due to lower<br />
initial burning and long combustion duration (Kidoguchi et al. 2000). In general, there<br />
are studies reporting both positive and negative correlations between cetane number<br />
and particulate <strong>emissions</strong> (Eastwood 2008). The main problem with studying the<br />
effects of cetane number (and aromaticity) is that they are easily mixed to the effects<br />
of other fuel and <strong>engine</strong> parameters. Armas et al. (2010) attacked this problem by<br />
matching the combustion phasing and obtaining a similar rate of heat release between<br />
the tested fuels (ultra low sulphur diesel, FT diesel and FAME) by adjusting fuel<br />
injection timing and fuel rail pressure. They reported that with matched phasing, FT<br />
fuel reduced both PM and NOx <strong>emissions</strong> but the reduction was lower than in the<br />
original, non-matched case. Also the fact that using the HVO instead of fossil EN590<br />
12<br />
10<br />
8<br />
6<br />
4<br />
2<br />
0<br />
NOx (g/kWh)
increases the indicated efficiency of the <strong>engine</strong> (see Paper 1) will surely reduce the<br />
emission somewhat. The reason to this is that with higher efficiency the same load<br />
can be achieved with reduced mass of fuel. This increases the relative air to fuel ratio<br />
which, further, promotes the combustion (Huang et al. 2008).<br />
One of the reasons for higher NOx <strong>emissions</strong> for EN590 diesel fuel compared to<br />
HVO fuel could be that aromatic compounds have higher adiabatic flame temperature<br />
and a lower H/C-ratio. As aromatic compounds produce higher local combustion<br />
temperatures (Glaude et al. 2010), NOx formation is promoted with fuels having<br />
higher aromatic content. Aatola et al. (2008), on the other hand, suggested that the<br />
shorter ignition delay and lower volumetric heating value of HVO could increase the<br />
combustion time of the fuel resulting to lower temperature and, thereby, to lower NOx<br />
emission. The higher cetane number and, thus, the shorter ignition delay of HVO<br />
also reduces the energy released in the premixed combustion phase which reduces the<br />
maximum combustion temperature and pressure in the cylinder leading to suppressed<br />
NOx formation (Huang et al. 2008).<br />
Particle size distributions measured with HVO and with fossil EN590 fuel are<br />
presented in Figure 3.2. The total particle number emission in the figure was obtained<br />
from the distribution. Depending on load, the total particle number emission decreased<br />
13–27 % with HVO fuel. The largest decrease (6.5 nm, 10 %) in GMD was observed<br />
with 50 % load conditions. The decrease in GMD was probably due to the reduced<br />
<strong>exhaust</strong> particle number concentration which suppressed particle growth by coagulation.<br />
The volatility of the <strong>exhaust</strong> particles was low enough that no change in geometric<br />
mean diameter (GMD) was observed with thermodenuder treatment. This is in line<br />
with the low gaseous HC emission (less than 0.1 g/kWh at most) with both fuels.<br />
Overall, the HVO fuel produced quite similar <strong>exhaust</strong> particle size distributions than<br />
EN590. Both produced unimodal distributions with GMDs in the range of 62–67 nm.<br />
The particle number emission results are in agreement with those presented in the<br />
previous HVO studies (Rantanen et al. 2005; Kuronen et al. 2007; Murtonen et al.<br />
2010).<br />
15
16 3. Hydrotreated vegetable oil diesel fuel<br />
dN/d(log dp) (#/cm 3 )<br />
dN/d(log dp) (#/cm 3 )<br />
6 ·107<br />
4<br />
2<br />
10 1<br />
0<br />
6 ·107<br />
4<br />
2<br />
10 1<br />
0<br />
10 2<br />
10 2<br />
a) Load 50 %<br />
dp (nm)<br />
EN590<br />
HVO<br />
10 3<br />
c) Load 100 %<br />
dp (nm)<br />
EN590<br />
HVO<br />
10 3<br />
dN/d(log dp) (#/cm 3 )<br />
Particle number emission (#/kWh)<br />
6 ·107<br />
4<br />
2<br />
10 1<br />
0<br />
2 ·1016<br />
1<br />
0<br />
10 2<br />
b) Load 75 %<br />
dp (nm)<br />
EN590<br />
HVO<br />
10 3<br />
d) Number emission<br />
50 75 100<br />
Load (%)<br />
EN590<br />
HVO<br />
Figure 3.2: Particle number distributions of a research <strong>engine</strong> with 50 (a), 75 (b)<br />
and 100 % (c) loads with both HVO fuel and fossil EN590 fuel. Also<br />
total number concentrations emitted with different fuels and loads<br />
are presented (d). Modified from Paper 1.
<strong>Chapter</strong> 4<br />
Techniques to reduce<br />
<strong>emissions</strong><br />
4.1 Engine parameter adjustments<br />
To abate diesel <strong>exhaust</strong> <strong>emissions</strong>, one either has to influence on the combustion<br />
process or to prevent somehow the formed <strong>emissions</strong> from reaching the atmosphere.<br />
The former approach of emission abatement can be realized by influencing on the fuel<br />
and the lubricant or by adjusting the <strong>engine</strong>. Possible <strong>engine</strong> adjustments include e.g.<br />
optimizing the injector nozzle or the geometry of the combustion chamber, adjusting<br />
injection pressure, intake air pressure, injection timing and valve timings or applying<br />
<strong>exhaust</strong> gas recirculation (EGR). For the latter approach, different aftertreatment<br />
devices such as particulate filters, oxidations catalysts and deNOx-catalysts can be<br />
used. In this thesis, the emission reduction techniques for the HVO fuel are limited to<br />
influencing the fuel, which is presented in the next section, and to adjusting <strong>engine</strong><br />
parameters (injection timing, valve timing, EGR and injection pressure), which is<br />
discussed here.<br />
As HVO fuel differs from the common diesel fuel, e.g. in respects of cetane number<br />
and density, the original <strong>engine</strong> adjustments set by the manufacturer and chosen for<br />
common diesel fuel might not be optimal for HVO fuel. Aatola et al. (2008) concluded<br />
in their study that optimization of injection parameters for HVO allows more significant<br />
reductions in <strong>exhaust</strong> <strong>emissions</strong> compared to EN590 diesel fuel than those obtainable<br />
by only changing the EN590 to HVO fuel.<br />
The possibility to further diminish <strong>exhaust</strong> <strong>emissions</strong> with <strong>engine</strong> optimization<br />
has not escaped attention in the case of other alternative fuels either. For example,<br />
optimization of injection timing, injection pressure and EGR percentage have been<br />
studied with biodiesel (Leung et al. 2006; Bunce et al. 2011) and optimization of<br />
injection timing with FT diesel fuels (Abu-Jrai et al. 2006; Wu et al. 2007). However,<br />
a less explored area in the field of alternative diesel fuels is the application of variable<br />
valve timing (VVT). In VVT, the timing, duration and lift of the intake and/or <strong>exhaust</strong><br />
valve is altered during <strong>engine</strong> operation. VVT has been mostly associated with spark<br />
ignition <strong>engine</strong>s and, in this context, Hong et al. (2004) present a quite thorough review<br />
17
18 4. Techniques to reduce <strong>emissions</strong><br />
of different VVT strategies. The use of the strategies becomes more limited when VVT<br />
is applied to a modern diesel <strong>engine</strong> due to the very small clearance between the piston<br />
and valves in the <strong>engine</strong> (Lancefield et al. 2000). In diesel <strong>engine</strong>s, the main aim in<br />
utilizing VVT is to achieve reductions in <strong>exhaust</strong> <strong>emissions</strong> (Benajes et al. 2008).<br />
Here, the VVT strategy considered is the advance of intake valve closure (IVC).<br />
Advanced IVC reduces the effective compression ratio and, without an increase in<br />
intake air pressure, also the air/fuel ratio in the cylinder (Benajes et al. 2009a). These<br />
changes reduce peak temperature and pressure in the cylinder and increase the autoignition<br />
delay time of the fuel. The reduction of combustion temperature reduces NOx<br />
formation but, due to the reduction in the air/fuel ratio and cylinder temperature,<br />
particle <strong>emissions</strong> are increased. Advanced IVC, without alterations in intake air<br />
pressure, has been studied by e.g. Wang et al. (2005), Benajes et al. (2009a) and<br />
Benajes et al. (2009b). Benajes et al. (2009b) named this sort of cycle as a modern<br />
version of Atkinson cycle. Reason to this is that advanced (or retarded) IVC shortens<br />
the effective intake and compression strokes compared to the corresponding expansion<br />
stroke. In the original Atkinson cycle, the expansion stroke would continue as far as to<br />
the <strong>exhaust</strong> pressure (Heywood 1988).<br />
Benajes et al. (2009a) suggest that the most critical drawbacks of early IVC, for<br />
example the sharp increase in soot <strong>emissions</strong>, should be diminished if, while advancing<br />
IVC, the intake pressure is boosted accordingly. Thus, the reduction in the amount of<br />
intake air mass could be avoided and the nominal air/fuel ratio could be maintained.<br />
The resulting <strong>engine</strong> cycle will be referred from now on as the Miller cycle (Benajes<br />
et al. 2009b; Miller 1947). The use of the Miller cycle does not significantly alter the<br />
nominal density or pressure at the top dead center of the cylinder but the reduction in<br />
peak temperature, and thus in NOx, should be comparable to the modern Atkinson<br />
cycle discussed earlier (Benajes et al. 2009a). Benajes et al. (2008) studied the Miller<br />
cycle using retarded IVC strategy together with different injection timings. They<br />
observed that the ignition delay and fuel consumption increased somewhat with the<br />
Miller cycle but both soot and NOx <strong>emissions</strong> were decreased.<br />
The suitability of the Miller cycle via advanced IVC for HVO was studied in<br />
Paper 1. The <strong>engine</strong> used in the study was a single cylinder research <strong>engine</strong> based on<br />
a commercial 6-cylinder off-road common rail diesel <strong>engine</strong>. The studied advances of<br />
IVC were 0, 30, 50 and 70 ◦ CA (crank angle degrees) before the standard IVC angle<br />
set by the <strong>engine</strong> manufacturer. To achieve the Miller cycle, the intake air pressure was<br />
increased accordingly in order to avoid reductions in the intake air mass. In addition<br />
to IVC, fuel injection timing was also altered in order to study the combined effect of<br />
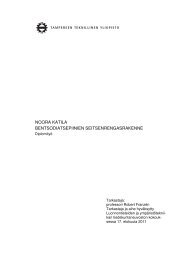
early IVC and adjusted injection timing. Particle number (Ntot) and NOx <strong>emissions</strong> of<br />
the study are presented in Figure 4.1. These tests were performed on the 100 % load.<br />
As it can be seen from the figure, advancing IVC to realize the Miller cycle decreased
Particle number emission (#/kWh)<br />
8<br />
6<br />
4<br />
2<br />
·10 15<br />
67 nm<br />
IVC -70 ◦<br />
IVC -50 ◦<br />
60 nm<br />
IVC -70 ◦ , SOI -2 ◦<br />
56 nm<br />
IVC -50 ◦ , SOI -2 ◦<br />
IVC -30 ◦<br />
57 nm<br />
55 nm<br />
59 nm<br />
IVC 0 ◦ (standard)<br />
55 nm<br />
IVC -30 ◦ , SOI -2 ◦<br />
4 5 6<br />
NOx (g/kWh)<br />
Figure 4.1: Particle number and NOx emission, as well as the GMDs of the<br />
measured particle size distributions, with different IVC and SOI<br />
timings on the 100 % load. Modified from Paper 1.<br />
NOx emission but increased Ntot as well as the particle size. Similar results have been<br />
reported by Imperato et al. (2010) although they used filter smoke number (FSN)<br />
as a measure of particulates. The initial 30 ◦ CA advance of IVC resulted in quite<br />
small changes in the <strong>emissions</strong> but, as the IVC advance was increased, the increase in<br />
Ntot and the decrease in NOx became more pronounced. As presented in Table 1 of<br />
Paper 1, specific fuel consumption (g/kWh) remained quite unchanged as a result of<br />
advancing IVC.<br />
Since advancing IVC reduces NOx formation due to the lower peak temperature of<br />
the cylinder, this provides an opportunity to reduce also soot particle formation by<br />
allowing better combustion conditions. One method to realize better combustion is to<br />
shift the start of fuel ignition towards the top dead center via adjustments in injection<br />
timing. The advance of 2 ◦ CA in the start of injection (SOI) in combination with the<br />
studied IVC timings is also presented in Figure 4.1. The figure shows that advancing<br />
SOI together with advanced IVC allows a simultaneous decrease in both Ntot and NOx.<br />
However, it should be noted that the SOI of the studied <strong>engine</strong> was originally set quite<br />
late (see Table 4.1) in order to limit NOx <strong>emissions</strong>.<br />
19
20 4. Techniques to reduce <strong>emissions</strong><br />
In order to study further how much the optimization of an <strong>engine</strong> run with HVO<br />
fuel could reduce <strong>exhaust</strong> <strong>emissions</strong> without significant drawbacks in the performance<br />
of the <strong>engine</strong>, more diverse adjustments of <strong>engine</strong> parameters were performed using the<br />
same <strong>engine</strong> as in Paper 1. In Paper 2, simultaneus adjustments of injection timing,<br />
injection pressure, intake valve timing and EGR percentage was applied in order to<br />
better utilize the benefits of the HVO fuel. In fact, Paper 2 presents the first HVO<br />
study where more than two <strong>engine</strong> parameteres have been simultaneusly balanced in<br />
order to optimize the <strong>engine</strong>.<br />
Three target conditions were chosen for the adjustments. These were low-NOx (LN)<br />
and low-smoke (LS) conditions and a condition where both NOx and particle <strong>emissions</strong><br />
were relatively low (LNLS). The adjustments were performed on the 50, 75 and 100<br />
% <strong>engine</strong> loads by using advanced IVC and adjusted SOI, EGR and fuel injection<br />
pressure (Pinj). EGR was simulated by supplying neat nitrogen gas in the charge air.<br />
The studied <strong>engine</strong> conditions are shown in Table 4.1. The indicated mean effective<br />
pressures of the 50, 75 and 100 % loads were 10.8, 16.2 and 21.4 bar, respectively. The<br />
standard settings mentioned in the table refer to the <strong>engine</strong> settings provided by the<br />
<strong>engine</strong> manufacturer for each load. The LN and LS conditions represented the cases<br />
where one emission, particles or NOx, can be reduced to the minimum using <strong>engine</strong><br />
parameter adjustments while the other could be reduced using a suitable aftertreatment<br />
device. The LNLS condition, on the other hand, shows how large emission reductions<br />
in both particles and NOx are possible with <strong>engine</strong> parameter adjustments only.<br />
The Miller cylce with 70 ◦ CA advanced IVC was used in all the studied adjusted<br />
conditions. NOx <strong>emissions</strong> were further reduced by applying varying percentages of<br />
EGR. EGR decreases the oxygen concentration in the cylinder and, thus, increases<br />
ignition delay (Ickes et al. 2009). This shifts combustion to later phasing and, thereby,<br />
decreases the cylinder peak temperature and pressure. This in turn reduces NOx formation.<br />
Unfortunately, the reductions in oxygen concentration and cylinder temperature<br />
hinder the rapid premix-combustion phase and, due to the lower oxygen concentration,<br />
the diffusion combustion is also suppressed (Satoh et al. 1997). Consequently, particle<br />
<strong>emissions</strong> are increased.<br />
The increased particle <strong>emissions</strong> caused by advanced IVC and increased EGR<br />
are compensated by increasing fuel injection pressure. Higher fuel injection pressure<br />
causes the combustion phasing to advance as the fuel spray breaks up faster and, thus,<br />
the mixing time is reduced (Ickes et al. 2009). The advanced phasing enhance the<br />
premix-combustion phase which shortens the overall combustion process (Heywood<br />
1988). Due to the better air mixing and higher flame temperatures induced by the<br />
enhanced premixed combustion, particle <strong>emissions</strong> are reduced and NOx <strong>emissions</strong><br />
increased (Lähde et al. 2011). At three conditions, the combination of EGR, advanced<br />
IVC and higher Pinj were also modified by adjusting the SOI timing. At the 50 % LS
Table 4.1: Engine load, power, efficiency (Eff.), IVC, SOI, EGR and Pinj of the<br />
measured <strong>engine</strong> conditions. IVC values are relative to the bottom<br />
dead center (BDC). Positive values mean after BDC and negative<br />
before BDC. The SOI values are relative to the top dead center (TDC).<br />
The <strong>engine</strong> speed was 1500 rpm at all measured conditions. (Paper 2)<br />
Load Power Eff. IVC SOI EGR Pinj<br />
(%) (kW) (%) (deg) (deg) (%) (bar)<br />
50 stand. 18.7 35.7 22 −1.2 0 464<br />
LN 18.5 39.5 −48 −1.2 10 600<br />
LS 18.4 41.5 −48 −4.2 2.5 600<br />
LNLS 18.5 39.6 −48 −1.2 5 600<br />
75 stand. 27.7 37.5 22 −2.1 0 594<br />
LN 27.7 37.4 −48 −0.1 10 1000<br />
LS 27.5 40.5 −48 −2.1 2.5 800<br />
LNLS 27.7 41.8 −48 −2.1 10 1000<br />
100 stand. 36.6 37.3 22 −1.6 0 878<br />
LN 36.4 41.1 −48 −0.6 12 1400<br />
LS 36.1 41.1 −48 −1.6 2.5 1200<br />
LNLS 36.1 41.9 −48 −1.6 10 1400<br />
conditions, SOI was advanced to improve combustion conditions and, at the 75 % and<br />
100 % LN conditions, SOI was retarded to achieve further reductions in NOx <strong>emissions</strong>.<br />
Relative changes in particle and NOx <strong>emissions</strong> as a result of different adjusted<br />
conditions are presented in Figure 4.2. The figure presents the changes relative to the<br />
standard <strong>engine</strong> conditions with HVO fuel. The absolute values of <strong>engine</strong> <strong>emissions</strong><br />
are presented in Table 4.2. Applying adjusted conditions did not impose changes in<br />
the shape of the particle size distribution.<br />
As it can be seen from Figure 4.2, approximately a 60 % decrease in the NOx<br />
emission was achieved on all the studied loads at LN conditions. As expected, the<br />
particle emission simultaneously increased. However, on other than 50 % loads, the<br />
PM emission remained under the reference level, i.e. the emission level of the <strong>engine</strong><br />
run at standard <strong>engine</strong> settings with EN590 fuel. On the 50 % load, the reference level<br />
of PM was exceeded by 17 %. This implies that the 60 % decrease in NOx <strong>emissions</strong><br />
might not be achievable on the 50 % load with the studied <strong>engine</strong> without exceeding<br />
the reference level of particle <strong>emissions</strong>. Relative increase in Ntot was on all the studied<br />
loads higher than the increase in PM. On the 50 % load, the difference between the<br />
changes in Ntot and PM was somewhat smaller due to the increase in the geometric<br />
21
22 4. Techniques to reduce <strong>emissions</strong><br />
Table 4.2: Total particulate mass (PM), total particle emission (Ntot), geometric<br />
mean diameter of the particle size distribution (GMD) and nitrogen<br />
oxide <strong>emissions</strong> (NOx) on the 50, 75 and 100 % loads at standard<br />
<strong>engine</strong> conditions. Modified from Paper 2.<br />
Load PM Ntot · 10 15 GMD NOx<br />
(%) (mg/kWh) (#/kWh) (nm) (g/kWh)<br />
50 99 1.08 61.5 2.97<br />
75 85 0.86 65.5 3.62<br />
100 42 0.42 61.5 5.21<br />
mean diameter of the particle size distribution. On the LN conditions at other loads, a<br />
decrease in GMD was observed compared to the standard <strong>engine</strong> settings.<br />
At the LS conditions, NOx emission remained at or slightly under the emission at<br />
standard <strong>engine</strong> conditions with HVO. PM emission, on the other hand, was decreased<br />
45–68 % depending on load. On all the studied loads at the LS conditions, GMDs<br />
of the particle size distributions were reduced roughly 20 %. By applying the LNLS<br />
adjustments, particle number emission remained quite unchanged but GMD, and<br />
thus also PM, was decreased. A reduction of 25–33 % was observed in PM at LNLS<br />
conditions depending on load together with a 30–50 % decrease in NOx emission.<br />
As shown in Figure 3.1, mere changing the fuel from EN590 decreases PM <strong>emissions</strong><br />
30–40 % depending on load. The results in Figure 4.2 show that the achieved PM<br />
emission level could be further reduced over 45 % by adjusting <strong>engine</strong> parameters with<br />
the studied <strong>engine</strong> without increasing NOx <strong>emissions</strong>. Alternatively, NOx <strong>emissions</strong>, or<br />
both particle and NOx <strong>emissions</strong>, could be reduced by <strong>engine</strong> parameter adjustments.<br />
In Figure 4.3, the LN, LS and LNLS conditions on the 100 % load are compared<br />
to the IVC -70 ◦ CA conditions of Paper 1. The Figure 4.3 is presented in the same<br />
fashion as Figure 4.1 but, in Figure 4.3, PM emission is used instead of particle number<br />
emission. The reason to this is that particle number emission was measured with a<br />
different particle counter in Paper 1 (a water based CPC 3786) than in Paper 2 (a<br />
butanol based CPC 3775 in the cloud counting mode) which further led to a difference<br />
in the absolute values of the particle number <strong>emissions</strong>. Nonetheless, the Figure 4.3<br />
illustrates that just by adjusting both IVC and injection timing it is possible to reduce<br />
both NOx and particulate <strong>emissions</strong> of an HVO-fueled <strong>engine</strong>. However, the figure<br />
also shows that much more pronounced emission reductions can be achieved when the<br />
advanced IVC (using constant intake air mass flow) is combined with EGR, higher<br />
injection pressure and adjusted injection timing.<br />
It should, nevertheless, be stressed that the emission reduction results obtained
Relative change (%)<br />
Relative change (%)<br />
100<br />
50<br />
0<br />
-50<br />
-100<br />
100<br />
50<br />
0<br />
-50<br />
-100<br />
(a)<br />
LS<br />
(c)<br />
LS<br />
LN<br />
LNLS<br />
Relative change (%)<br />
100<br />
50<br />
-50<br />
PM Ntot GMD -100<br />
LN<br />
PM Ntot GMD<br />
LNLS<br />
Change in NOx (%)<br />
0<br />
50<br />
0<br />
-50<br />
-100<br />
(b)<br />
LS<br />
(d)<br />
LN<br />
PM Ntot GMD<br />
LN LS LNLS<br />
LNLS<br />
50 75 100<br />
Load (%)<br />
Figure 4.2: Relative changes in particulate (PM, number emission, GMD and<br />
FSN) on the (a) 50 % , (b) 75 % and (c) 100 % loads and (d) NOx<br />
<strong>emissions</strong> due to <strong>engine</strong> parameter adjustments at the studied <strong>engine</strong><br />
loads. The presented changes are relative to the emission at standard<br />
<strong>engine</strong> conditions with HVO fuel. Modified from Paper 2.<br />
with this <strong>engine</strong> are only indicative. Especially the EGR values presented in Table 4.1<br />
might not be representative to the real situation. The reason to this is that, in the<br />
study of Paper 2, the EGR was simulated by supplying neat nitrogen gas in the<br />
charge air. Zheng et al. (2004) reported that simulating EGR by adding neat CO2 gas<br />
in <strong>engine</strong> intake simulates quite well the thermodynamic and dilution effects of EGR.<br />
Nevertheless, EGR simulated with gaseous add-ons is always pure from particulate<br />
matter contrary to actual recycled <strong>exhaust</strong> gases. As the use of EGR simulated with<br />
neat nitrogen should be quite close to the simulation by CO2, nitrogen EGR should<br />
reproduce NOx emission quite well but it may underestimate particle <strong>emissions</strong>. Thus,<br />
the conditions presented in Figure 4.2 might have produced higher particle emission if<br />
real EGR was used. Further, the <strong>engine</strong> model and technology will surely influence on<br />
the emission reductions obtainable by adjusting <strong>engine</strong> parameters for HVO fuel.<br />
23
24 4. Techniques to reduce <strong>emissions</strong><br />
PM (mg/kWh)<br />
100<br />
80<br />
60<br />
40<br />
20<br />
LN<br />
58 nm<br />
LNLS<br />
53 nm<br />
IVC -70 ◦<br />
67 nm<br />
IVC -70 ◦ , SOI -2 ◦<br />
IVC 0 ◦ = standard<br />
56 nm<br />
50 nm<br />
60 nm<br />
0<br />
1 2 3 4 5 6<br />
NOx (g/kWh)<br />
Figure 4.3: PM and NOx <strong>emissions</strong> as well as GMDs of measured size distributions<br />
on the 100 % load. The <strong>emissions</strong> and GMDs of the LN, LS and<br />
LNLS conditions (green), the adjusted IVC -70 ◦ CA conditions from<br />
Paper 1 (pink) and the standard 100 % conditions (darker red) are<br />
presented.<br />
4.2 Blended oxygenate<br />
One method to improve the combustion process in an <strong>engine</strong> is to modify fuel composition<br />
through the addition of oxygenate. Oxygenates are essentially fuel components<br />
which contain oxygen. Many biofuels that are used in <strong>engine</strong>s are thus in essence oxygenates.<br />
These biofuels include ethanol, methanol, DME and FAME (i.e. conventional<br />
biodiesel), for example.<br />
Oxygen in fuel facilitates combustion and, thereby, reduces particulate <strong>emissions</strong>.<br />
One suggested mechanism is that, since the carbon bonded to an oxygen atom does<br />
not readily participate in soot formation, the amount of soot precursors formed during<br />
combustion is reduced (Eastwood 2008). In addition, oxygen may facilitate the oxidation<br />
of the soot that has been already formed (Lapuerta et al. 2008). Nevertheless, it should<br />
be noted that adding an oxygenate component to fuel may significantly change such<br />
properties of the fuel as, for example, cetane number, viscosity or heating values, which<br />
may further have an influence on the combustion process. NOx <strong>emissions</strong> are also<br />
affected by the added oxygenate. Often the reduction of particulate is accompanied<br />
LS
with an increase in NOx but NOx <strong>emissions</strong> may also remain unchanged or reduce<br />
(McCormick et al. 1997; Wang et al. 2012).<br />
From the extensive research conducted regarding the use of oxygenates to complement<br />
conventional diesel fuel, one of the more accepted results is that the mass<br />
of soot particulate seems to reduce in proportion to the mass of oxygen in the fuel<br />
(Eastwood 2008). Nevertheless, there is also evidence that also the molecular structure<br />
of the oxygenate affects soot suppression (Kitamura et al. 2001). In any case, the<br />
proportionality of oxygen mass to soot mass suggest that, at high enough oxygen<br />
content in the fuel, the soot <strong>emissions</strong> will completely disappear. This threshold oxygen<br />
content is frequently cited to be 30–40 wt-% (Eastwood 2008). However, with as low as<br />
2 wt-% oxygen content in fuel, particulate mass has been observed to decrease 10–20<br />
% depending on the added oxygenate (McCormick et al. 1997; Ren et al. 2008).<br />
A large number of different compounds has been studied as potential oxygenates<br />
for diesel fuel (see e.g. Pecci et al. (1991)). However, the fact that oxygenates are<br />
generally polar compounds but fuel hydrocarbons are non-polar may lead to miscibility<br />
problems between the fuel and the oxygenate (Tilli et al. 2010). When choosing the<br />
oxygenate best suitable for HVO fuel, almost 140 possible oxygenate compounds were<br />
reviewed. The preliminary screening of the review was reported by Tilli et al. (2010).<br />
In Paper 3, the oxygenate was chosen according to the following criteria:<br />
• Cetane number greater than 51<br />
• Flash point above 55 ◦ C<br />
• Boiling point in the range of 180–340 ◦ C<br />
• Soluble in diesel fuel<br />
The target for the oxygen content of the resulting blend was set to be 2–3 wt-%.<br />
From this review, di-n-pentyl ether (DNPE) was chosen to be best suitable for<br />
blending with HVO fuel. For more information on the other candidates see Paper 3.<br />
The potential of DNPE to act as diesel oxygenate has been also reported elsewhere<br />
(Pecci et al. 1991; Murphy 1999, 2002; Marchionna et al. 2000; Martin et al. 1997).<br />
The cetane number of DNPE is high (103–153) and other properties are diesel-like.<br />
Oxygen mass content in DNPE is 10.1 wt-%.<br />
In order to achieve a fuel blend with 2 wt-% oxygen, 20 wt-% DNPE was added to<br />
HVO fuel. The properties of the resulting blend as well as the corresponding properties<br />
of HVO fuel are presented in Table 4.3. As it can be seen from the table, the addition<br />
of oxygenate increased the cetane number of the fuel but decreased heat values and<br />
viscosity. Further, the addition of oxygenate also increased the HFRR lubricity value<br />
meaning that the lubricity of the fuel was decreased. It should be noted that neither<br />
the oxygenate reviewing process, the final selection of the oxygenate compound nor<br />
the choosing of the blending percentage were performed by the author of this thesis.<br />
25
26 4. Techniques to reduce <strong>emissions</strong><br />
Table 4.3: Fuel properties of the studied HVO fuel and 80 % HVO + 20 % DNPE<br />
fuel blend. The studied HVO fuel included lubricity additive. Modified<br />
from Paper 3.<br />
HVO 80 % HVO<br />
+20 % DNPE<br />
density 15 ◦ C (kg/m 3 ) 779 781<br />
viscosity 40 ◦ C (mm 2 /s) 2.985 2.348<br />
higher heating value (MJ/kg) 47.216 46.25<br />
lower heating value (MJ/kg) 43.991 43.137<br />
cetane number 88.2 93.9<br />
HFRR lubricity (µm/60 ◦ C) 351 493<br />
Table 4.4: Total particulate mass (PM), total particle number emission (Ntot),<br />
geometric mean diameter of the particle size distribution (GMD) and<br />
nitrogen oxide <strong>emissions</strong> (NOx) of the <strong>engine</strong> at the 50, 75 and 100 %<br />
loads with standard <strong>engine</strong> conditions using HVO fuel. (Paper 3).<br />
Load PM Ntot · 10 14 GMD NOx<br />
(%) (mg/kWh) (#/kWh) (nm) (g/kWh)<br />
50 100 3.0 63 3.01<br />
75 85 2.4 68 3.58<br />
100 45 1.4 66 5.03<br />
The study on the effects of HVO-DNPE blend on <strong>exhaust</strong> <strong>emissions</strong> was performed<br />
using the same single cylinder research <strong>engine</strong> that was used to study the effects<br />
of <strong>engine</strong> parameter adjustments (see Section 4.1). The particle size distributions<br />
measured with HVO and with 80 wt-% HVO 20 wt-% DNPE blend are presented in<br />
Figure 4.4. According to the measurements, the particle size distributions were all<br />
unimodal. Further, no indication of particles less than 10 nm in diameter was found.<br />
This is in line with previous measurements conducted with this <strong>engine</strong>. The particulate<br />
and NOx <strong>emissions</strong> at standard <strong>engine</strong> conditions with HVO fuel for the three studied<br />
loads (50 %, 75 % and 100 %) are presented in Table 4.4.<br />
When comparing Tables 4.2 and 4.4, it can be noted that the PM emission was<br />
essentially the same at these separate measurements. Further, the GMDs and the<br />
NOx <strong>emissions</strong> were also quite similar to those measured previously. Particle number
dN/d(log dp) (#/cm 3 )<br />
8<br />
6<br />
4<br />
2<br />
0<br />
·10 7<br />
10 1<br />
10 2<br />
dp (nm)<br />
HVO<br />
50 % load<br />
75<br />
100<br />
HVO+DNPE<br />
50 % load<br />
75<br />
100<br />
Figure 4.4: Particle size distributions measured with HVO and 80 wt-% HVO<br />
20 wt-% DNPE blend used as fuel. Size distributions were measured<br />
on the 50, 75 and 100 % loads. Modified from Paper 3.<br />
emission values, on the other hand, were over three times higher in Table 4.2 compared<br />
to the values in Table 4.4. This is caused by a small difference in the particulate<br />
measurement system between the two measurement campaigns. At the oxygenate<br />
measurements, an additional dilution was used before the CPC (CPC 3775, TSI Inc.)<br />
measuring the total particle concentration. However, although the additional dilution<br />
ratio was taken into account when calculating the particulate emission, the additional<br />
dilution resulted in a change in the counting mode of the CPC 3775. Thus, at oxygenate<br />
measurements of Table 4.4, the CPC operated in the single-particle counting mode<br />
whereas, at the measurements of Table 4.2, the CPC operated in the cloud counting<br />
mode. Thus, the discontinuity between the different counting modes is the most<br />
probable reason explaining the difference in the number emission values between the<br />
separate measurements at standard <strong>engine</strong> conditions.<br />
Figure 4.5 presents the changes in particulate and NOx <strong>emissions</strong> induced by the<br />
use of the HVO-DNPE blend compared to pure HVO fuel. The results show that the<br />
relative changes in <strong>emissions</strong> remain quite similar between the studied <strong>engine</strong> loads.<br />
Particulate mass was reduced 25–30 % and the total particle number emission 10–17<br />
%. A decrease of 3 % and 7 % in the GMDs of the particle size distributions was<br />
observed on the 75 % and 100 % loads, respectively. On the 50 % load, the GMD was<br />
unchanged. However, even though the PM was reduced over 25 %, the simultaneous<br />
increase in NOx <strong>emissions</strong> was below 5 % on all measured loads. In fact, on the 50 %<br />
load, the NOx emission was actually decreased by 2 %.<br />
Here, the observed decrease in PM is greater than the reductions reported by<br />
27
28 4. Techniques to reduce <strong>emissions</strong><br />
Change in emission (%)<br />
20<br />
0<br />
-20<br />
-40<br />
50 % 75 % 100 %<br />
PM Ntot GMD NOx<br />
Figure 4.5: Relative changes in <strong>emissions</strong> caused by the use of 20 wt-% DNPE<br />
content with the HVO fuel on the 50, 75 and 100 % <strong>engine</strong> loads.<br />
Changes in particulate mass (PM), total number emission (Ntot),<br />
geometric mean diameter of the particle size distribution (GMD) and<br />
NOx are presented. (Paper 3)<br />
McCormick et al. (1997) and Ren et al. (2008) for fuel with 2 wt-% oxygen content.<br />
However, they used different base fuel (conventional diesel) and different oxygenate<br />
compounds in their study. Marchionna et al. (2000) studied the use of DNPE as<br />
oxygenate for conventional diesel with 10 wt-% and 20 wt-% blends. They reported<br />
that PM emission decreased by 15–20 % and NOx 2–2.5 % due to the use of the blends.<br />
This reduction is in line with the reports on the effects of 2 wt-% oxygen content fuel<br />
that were mentioned earlier (McCormick et al. 1997; Ren et al. 2008) but the PM<br />
reduction was still somewhat lower than that obtained with 80 wt-% HVO 20 wt-%<br />
DNPE blend.<br />
Nevertheless, all the above mentioned studies used conventional diesel fuel as the<br />
base fuel. An example of an oxygenate study with paraffinic diesel as base fuel was<br />
reported by Nabi and Hustad (2010). They blended jathorpa biodiesel to Fischer-<br />
Tropsch diesel and reported a 34 % decrease in smoke <strong>emissions</strong> with a blend containing<br />
2.825 wt-% oxygen. The agreement between this result to the results presented in<br />
Figure 4.5 depends on the amount of volatiles in the PM results of this thesis. However,<br />
the reduction of smoke could be in line with the PM reduction of this study as the<br />
OC/EC analysis presented later on (Figure 5.12) indicates.<br />
Gill et al. (2011b) studied conventional diesel with added oxygenate (biodiesel and<br />
diglyme) and reported that, in addition to PM, also particle number concentration<br />
decreased with increased oxygen content in the fuel. This result is in line with the<br />
results in Figure 4.5 which show the decrease in particle number concentration also.<br />
The decrease in number concentration may partly explain the observed decrease in
GMD as the reduced particle number concentration suppresses particle growth by<br />
coagulation.<br />
Both increases and decreases in NOx emission due to oxygenated fuel have been<br />
observed depending on the added oxygenate (McCormick et al. 1997). Often not only<br />
the presence of oxygenate in fuel but also the amount of blending affects NOx <strong>emissions</strong><br />
(Wang et al. 2012; Nabi and Hustad 2010). Further the results in Figure 4.5 show<br />
that also <strong>engine</strong> load affects the changes in NOx <strong>emissions</strong>. However, all the changes<br />
in NOx <strong>emissions</strong> were quite small (below 5 %) compared to the particulate emission<br />
reductions.<br />
4.3 Discussion of the results<br />
In this chapter, it has been shown that the <strong>exhaust</strong> <strong>emissions</strong> of a HVO-fueled <strong>engine</strong><br />
can be further decreased by utilizing <strong>engine</strong> parameter adjustments or by adding<br />
oxygenate to the fuel. The <strong>engine</strong> parameter adjustments tested in this thesis involved<br />
the appliance of Miller timing together with an increase in fuel injection pressure. The<br />
appliance of Miller timing requires an increase in the intake air pressure. This may<br />
be a bottleneck for some of the <strong>engine</strong>-early IVC combinations as the boost pressure<br />
required by Miller timing could be higher than the practical boost pressures obtainable<br />
with superchargers (Benajes et al. 2009a). However, in this thesis the maximum intake<br />
boost pressure was 3.9 bar which is well below the attainable boost pressure with a two<br />
stage turbocharged <strong>engine</strong> reported by Benajes et al. (2009a). Thus, the applicability<br />
of Miller timing depends on <strong>engine</strong> technology in this respect.<br />
In addition to high intake pressures, the realization of Miller timing requires also<br />
variable valve timing. Variable valve actuator (VVA) systems are in quite widespread<br />
use in gasoline <strong>engine</strong>s. Nevertheless, there are some issues that hinder the increasing<br />
frequency of VVA for diesel <strong>engine</strong>s. First, the VVA systems are more complex than<br />
current production systems and, second, the VVA systems do not increase the efficiency<br />
and performance of the diesel <strong>engine</strong> in the extent they do in gasoline <strong>engine</strong>s (Lancefield<br />
et al. 2000). Thus, the more common use of VVA systems in diesel <strong>engine</strong>s depends<br />
primarily on emission legislation and on customer related matters (Lancefield et al.<br />
2000).<br />
The applied elevated injection pressures in this thesis (600–1400 bar) are most<br />
likely applicable for a heavy-duty <strong>engine</strong>. At least, they were in the range of the<br />
study of Lähde et al. (2011) where the effect of injection pressure on the particle size<br />
distribution was studied with a 6-cylinder heavy-duty off-road <strong>engine</strong>.<br />
With the <strong>engine</strong> parameter adjustments, it was possible to decrease either PM<br />
emission 45–68 % or NOx emission roughly 60 % depending on load. It must be<br />
remembered that the emission reduction percentages are strongly depended on applied<br />
29
30 4. Techniques to reduce <strong>emissions</strong><br />
<strong>engine</strong> technology and aftertreatment systems but similar trends in <strong>emissions</strong> can<br />
probably be obtained also with different <strong>engine</strong> models. Nevertheless, at least with<br />
the current strictening limits for particles, it is practically impossible that light duty<br />
vehicles or heavy-duty <strong>engine</strong>s could achieve these limits without the use of particulate<br />
filters (DPF). However, by adjusting the <strong>engine</strong> to reduce NOx emission, separate NOx<br />
aftertreatment (i.e. SCR) could possibly be avoided.<br />
From the measurements, it becomes evident that <strong>engine</strong> performance with HVO<br />
fuel can be improved by adjusting <strong>engine</strong> parameters. Nevertheless, it is not probable<br />
that these kind of parameter adjustments ever become common in serial production<br />
<strong>engine</strong>s. As discussed by Aatola et al. (2008), the full benefits of the HVO fuel could<br />
be realized in dedicated centrally fueled vehicle fleets which could have their <strong>engine</strong>s<br />
optimized for the HVO fuel.<br />
The use of oxygenated HVO fuel could also be most beneficial in centrally fueled<br />
vehicle fleets. Even though the use of DNPE oxygenate decreased <strong>exhaust</strong> PM <strong>emissions</strong><br />
considerably (25–30 %), the reduction is by no means enough to enable <strong>engine</strong> operation<br />
without a DPF aftertreatment with the current PM emission legislation. However, the<br />
use of oxygenate would probably provide more margin to the use of EGR to further<br />
reduce NOx <strong>emissions</strong> of the fleet’s <strong>engine</strong>s.<br />
Furthermore, the choosing of DNPE as the oxygenate for HVO fuel was decided<br />
by considering only the technical aspects and the availability of the oxygenate for<br />
the tests. That is, the price of the oxygenate was not considered. Nevertheless, after<br />
the technical suitability, the price is probably the most important property of the<br />
oxygenate determining its applicability to more widespread use. Thus, even though<br />
DNPE is probably technically one of the best oxygenates available for HVO fuel, it is<br />
to be expected that, in near future, the more widespread use of oxygenate together<br />
with HVO fuel starts from a cheaper oxygenate, for example from FAME biodiesel.
<strong>Chapter</strong> 5<br />
Effect of fuel on particle<br />
surface<br />
5.1 Studied properties<br />
The nanoparticles emitted by different fuels during combustion may have differences<br />
in their chemistry and structure. These differences may show as differences in the<br />
behaviour of particles in aftertreatment devices, the atmosphere or in the human<br />
respiratory system. Often, the behaviour of particles in different environments is also<br />
linked to surface properties of the particles, such as hygroscopicity and oxidizability.<br />
In this thesis, particle microstructure, oxidizability and hygroscopicity of emitted<br />
diesel <strong>exhaust</strong> particles are studied in the context of HVO fuel. The studying of surface<br />
fine structure together with other surface properties of particles is important since<br />
the fine structure may explain some of these properties. For example, it is known<br />
that rougher surface and, thereby, higher specific surface area facilitate nanoparticle<br />
oxidation (Su et al. 2004b). Vander Wal and Tomasek (2003) even reported that the<br />
wide range of oxidation rates of soot reported in literature may possibly be caused by<br />
differences in the initial nanostructures of the studied soot particles.<br />
The oxidizability of soot particles is important for two reasons. First, the oxidation<br />
properties of soot particles affect vehicle <strong>exhaust</strong> especially in the vehicles equipped<br />
with particulate filters. The reason is that the regeneration of these filters are performed<br />
by oxidizing the soot deposited on the filter surface (Konstandopoulos and Kostoglou<br />
2000). Thus, the oxidizability of soot particles affects the reliability of the filters and,<br />
further, on the counterpressure caused by the filters, i.e., on fuel consumption. The<br />
second reason is that particles having higher oxidizability often also have higher overall<br />
reactivity. The overall reactivity, on the other hand, increases particles’ cytotoxicity<br />
(Su et al. 2008) and, thereby, their adverse health effects.<br />
Hygroscopicity describes particles’ ability to grow by adsorption or absorption of<br />
water vapour. It affects the deposition of particles in the human respiratory track<br />
and the light scattering of particles and, thereby, visibility as these properties are<br />
strongly particle size dependent. Moreover, hygroscopicity influences on the ability<br />
of emitted particles to act as cloud condensation nuclei and, thus, it affects particles’<br />
31
32 5. Effect of fuel on particle surface<br />
interactions with clouds. The addition of water in the atmosphere may also alter several<br />
chemical and physical properties of the particles such as acidity, amount of water soluble<br />
condensates, chemical reactivity, particle size, mass and optical properties.<br />
5.2 Particle microstructure<br />
The structure of soot particles emitted using HVO fuel was studied with a high<br />
resolution transmission electron microscope (HR-TEM) in Paper 4. The particles<br />
were produced with a turbocharged 6-cylinder direct injection heavy-duty diesel <strong>engine</strong><br />
meeting the European Stage III A emission standard. The particles were sampled with<br />
a single heated ejector diluter followed by a thermodenuder. The temperature of the<br />
heated dilution air as well as the temperature of the thermodenuder was 200 ◦ C. The<br />
collection was conducted on the 50 % and 100 % <strong>engine</strong> loads.<br />
The HR-TEM sample collection was performed by first charging the particles with<br />
a corona charger and then using an electric field to deposit the particles on holey<br />
carbon coated copper TEM grids. The holey carbon coated copper grids were used in<br />
order to be able to image the particles without the interference from the underlying<br />
TEM grids. This is possible for the particles that are collected on the edges of the<br />
grid’s holes in a way that they are protruding over the holes.<br />
TEM images of the measured soot particles produced with both HVO and conventional<br />
EN590 diesel fuel on the 50 % load are presented in Figure 5.1. In general,<br />
the soot particles were agglomerates consisting of primary particles having an average<br />
diameter of 26 (±4) nm. There was practically no difference in the average size of<br />
the primary particles between different <strong>engine</strong> conditions and fuels. High resolution<br />
TEM images on the 100 % load are presented in Figure 5.2 and, on the 50 % load, in<br />
Figure 5.3. No notable differences were observed between the soot particles collected<br />
on the two loads. Figure 5.2 shows that soot particles were formed from strongly bent<br />
graphene layers which resulted in an ”onion” like structure of soot. Near the center of<br />
the primary particles, graphene layers were more strongly bent and, thus, the structure<br />
appears less ordered. From some of the primary particles, it could be seen that they<br />
included multiple structural nuclei. According to Su et al. (2004b), the multiple nuclei<br />
are caused by the strong bending of the graphene layers.<br />
As seen in Figure 5.3, the outer surfaces, i.e. the edges of the particles, were quite<br />
rough. In general, rough outer surface induces greater reactivity than smooth surface<br />
since the rough surface includes a greater amount of non-completed carbon rings to<br />
which additional molecular oxidants may bond (Su et al. 2004a,b). It appears that<br />
the soot particles produced using HVO might have slightly rougher surface than those<br />
produced using conventional diesel, but the difference is quite small.<br />
In order to obtain a quantitative point of comparison, the distances between
(a) HVO (b) EN590<br />
Figure 5.1: TEM images of soot particles produced with HVO (a) and with<br />
conventional EN590 diesel (b) as fuel on the 50 % load 2200 rpm<br />
<strong>engine</strong> conditions.<br />
the graphene layers were measured from HR-TEM images of both <strong>engine</strong> conditions.<br />
The average distances were obtained by measuring line profiles across the fringes<br />
of graphene layers on 5–6 places on different images (Figure 5.3). The results for<br />
the average distances were 3.76 (±0.19) Å for the HVO and 3.63 (±0.19) Å for the<br />
conventional diesel. It should be noted that the observed distances between the<br />
graphene layers are greater than the distance between the layers in graphite which is<br />
3.362 Å (Müller et al. 2005). Thus, the distances between the graphene layers of soot<br />
particles were very similar between the fuels which strengthens the conclusion that<br />
soot particles were structurally very similar.<br />
In addition to HR-TEM images, also electron energy loss spectra (EELS) were<br />
obtained from the soot particle samples. The EELS were acquired from samples<br />
produced with both fuels on the 100 % and on the 50 % <strong>engine</strong> loads. An EELS<br />
spectrum is an energy spectrum of electrons that have traveled through the sample<br />
particle. These electrons may have lost no energy or they may have suffered inelastic<br />
collisions in the sample particle (Williams and Carter 2009). The energy loss events<br />
provide information about the chemistry and the electronic structure of the atoms<br />
in the sample particle. In order to avoid misinterpretations of the energy loss, all<br />
the spectra were acquired from the sample particles protruding over the holes of the<br />
underlying carbon film.<br />
The electron energy loss near-edge structures (ELNES) from the EELS spectra<br />
of the carbon K ionization edge of soot particles with different fuels are presented in<br />
33
34 5. Effect of fuel on particle surface<br />
(a) HVO (b) EN590<br />
Figure 5.2: HR-TEM images of soot particles produced with HVO (a) and with<br />
conventional EN590 diesel (b) as fuel on the 100 % load 2200 rpm<br />
<strong>engine</strong> conditions. (Paper 4)<br />
Figure 5.4. According to the ELNES presented in the figure, the soot particles of both<br />
fuels are graphite-like, but no clear differences between the soot particles could be<br />
found either in the first peak of the ELNES, corresponding to double bonds (1s–π ∗<br />
transitions), or in the second peak, corresponding to single bonds (1s–σ ∗ ). However,<br />
the soot samples differed from the ELNES of the TEM grid carbon film especially in<br />
the respect of the higher first peak in the spectra of soot particles. Thus, the study<br />
of EELS spectra of soot particles led to a conclusion that the soot samples produced<br />
with different fuels were similar in microstructure, but that structure deviated from<br />
the structure of graphite.<br />
5.3 Oxidizability<br />
In this thesis, a tandem differential mobility analyzer (TDMA) measurement technique<br />
was applied for studying oxidizability of soot particles. As the same general technique<br />
was used also in studying hygroscopicity, and as the building of the TDMA apparatuses<br />
has been a major part of the thesis work, it is worth to provide here a short introduction<br />
to TDMA techniques in general.<br />
Originally, the TDMA technique was introduced by Liu et al. (1978) to study<br />
sulphuric acid aerosols. A schematic of the technique is presented in Figure 5.5. The<br />
principle is to use a differential mobility analyzer (DMA) to first classify particles<br />
to obtain a sample of a chosen electrical mobility diameter and then to use sample
Figure 5.3: HR-TEM images of a sample HVO (a) and a sample conventional<br />
EN590 diesel (b) particle measured at 50 % 2200 rpm. Line profiles<br />
along A–B and C–D, 30 pixels wide, indicate very similar distances<br />
between graphene planes (in this measurement 0.366 and 0.386 nm<br />
respectively). (Paper 4)<br />
conditioning to potentially impose changes to the mobility diameter of the classified<br />
particles. Finally, the size distribution of the resulting sample aerosol is measured<br />
with another DMA followed by a particle counter. From measurements through and<br />
bypassing the conditioning, information about the properties of sampled particles can<br />
then be obtained. The applied conditioning can be humidification (e.g. Liu et al. 1978;<br />
Rader and McMurry 1986; Hennig et al. 2005), humidification and subsequent drying<br />
(e.g. Weingartner et al. 1997), humidification via ethanol vapour (Joutsensaari et al.<br />
2001) or furnace treatment (e.g. Higgins et al. 2003). The TDMA technique can also<br />
be used to measure the charge distribution of aerosol particles by installing a bipolar<br />
charger as the conditioner (Kim et al. 2005). In this thesis, the TDMA technique<br />
has been applied to study oxidizability and hygroscopicity of <strong>exhaust</strong> particles. More<br />
detailed descriptions of the actual TDMA measurements systems applied to study<br />
these properties can be found in the corresponding sections of this chapter.<br />
It has been shown that, in addition to the <strong>engine</strong> conditions and technology, also<br />
the applied fuel affects the oxidation properties of diesel soot particles (Jung et al.<br />
2006). Thus, it was worth studying whether there exists a difference in oxidizability<br />
between the particles produced using HVO fuel compared to those produced using<br />
35
36 5. Effect of fuel on particle surface<br />
Figure 5.4: ELNES of the carbon K ionization edge of HVO soot (black), conventional<br />
EN590 diesel soot (dark grey) and, for comparison, the<br />
ELNES of the TEM grid carbon film (light grey). The HVO soot<br />
was collected on the 50 % load and the EN590 soot on the 100 %<br />
load. (Paper 4)<br />
conventional EN590 diesel fuel. Oxidizability of HVO and conventional diesel produced<br />
soot particles was studied with a heavy-duty diesel <strong>engine</strong> (see Paper 4 for <strong>engine</strong><br />
and fuel details).<br />
The TDMA measurement system applied for studying oxidizability in this thesis is<br />
presented in Figure 5.6. Particle sample was first diluted by an ejector diluter having<br />
a dilution ratio (DR) of approximately 10. The dilution gas for the ejector diluter was<br />
heated to 200 ◦ C in order to prevent the condensation of volatiles on the particles<br />
during the dilution. The removal of volatiles was later ensured by having the sample<br />
treated with a thermodenuder.<br />
After the thermodenuder, the sample line split to two branches (Figure 5.6). The<br />
first branch continued with a secondary ejector diluter (DR≈10). In this branch, there<br />
was an electrical low pressure impactor (ELPI) to monitor the stability of the particle
dN/dlog Dp<br />
Dp<br />
dN/dlog Dp<br />
Dp<br />
DMA1 Conditioning<br />
Property Y<br />
Result<br />
Property X<br />
Figure 5.5: A schematic of the TDMA technique.<br />
sample and an NOx analyzer that was used to monitor the dilution ratio.<br />
dN/dlog Dp<br />
Dp<br />
DMA + CPC<br />
The second branch consisted of a so-called high-temperature oxidation TDMA<br />
(HTO-TDMA). The HTO-TDMA technique was introduced by Higgins et al. (2002)<br />
and, since then, it has been successfully applied, for example, by Higgins et al. (2003),<br />
Jung et al. (2006) and Shrivastava et al. (2010). In the HTO-TDMA system, as in<br />
TDMA systems in general, a narrow particle size distribution of a chosen particle size is<br />
first classified with a DMA after which the size distribution is subjected to conditioning.<br />
The conditioning in the case of HTO-TDMA is a high temperature treatment in a<br />
furnace. The function of the furnace was to heat the classified aerosol to so high<br />
temperatures that particle oxidation would further proceed. After the oxidation, the<br />
resulting particle size distribution was measured with a scanning mobility particle<br />
sizer (SMPS). The oxidation was measured by measuring the particle size reduction<br />
in the high temperature furnace. In order to estimate the significance of possible<br />
non-oxidative particle size reduction, the carrier gas of the particle sample was changed<br />
to non-oxidative gas by selecting nitrogen as the sheath gas of the first DMA. The<br />
measurement system also allowed bypassing the furnace, the first DMA or both.<br />
In earlier studies, the HTO-TDMA technique has been applied in determining the<br />
oxidation kinetics, especially activation energy, of soot generated by an ethylene flame<br />
(Higgins et al. 2002) and a diesel <strong>engine</strong> (Higgins et al. 2003; Jung et al. 2006). Higgins<br />
et al. (2003) reported that the oxidation of <strong>exhaust</strong> soot particles is more pronounced<br />
on the 10 % load than on the 50 % or 100 % load. Further, Jung et al. (2006) studied<br />
the oxidation of soot emitted by an <strong>engine</strong> run with 100 % soy methyl ester biodiesel as<br />
37
38 5. Effect of fuel on particle surface<br />
<strong>exhaust</strong> pipe<br />
Qsh (air)<br />
air / N2<br />
dilution air<br />
heater<br />
(T = 200 ◦ C)<br />
ejector diluter<br />
(DR ∼ 10)<br />
ELPI<br />
SMPS<br />
heater<br />
NOx-analyzer<br />
CPC<br />
thermodenuder<br />
(T = 200 ◦ C)<br />
air<br />
ejector diluter<br />
(DR ∼ 10)<br />
furnace<br />
(Tpeak = 400–1100 ◦ C)<br />
TEMcollecting<br />
neutralizer<br />
DMA<br />
Qsh<br />
(air / N2)<br />
Figure 5.6: Measuring system for studying the oxidizability of soot particles.<br />
(Paper 4)<br />
fuel and observed that such particles are more readily oxidized than conventional diesel<br />
generated particles. In the oxidation study of Paper 4, no emphasis was given to<br />
finding kinetic parameters of oxidation contrary to the mentioned earlier HTO-TDMA<br />
studies as the study was focused on the comparison of oxidation behaviour and surface<br />
properties between conventional EN590 diesel and HVO produced soot particles.<br />
An example of size-selected particle size distributions measured through the furnace<br />
are presented in Figure 5.7. The original dry particle size classified by the first DMA<br />
was 83.3 nm. It can be observed from the figure that as the furnace temperature<br />
increased, the particle concentration as well as the GMD of the particle size distribution<br />
decreased but the distribution became wider. The reduction in particle concentration<br />
is mainly caused by thermophoretic losses that occur during the cooling of the aerosol<br />
sample after the furnace. The widening of the distribution, on the other hand, is most<br />
probably caused by the wide distribution of particle residence times in the furnace
(Higgins et al. 2002).<br />
d N/ d log(dp) (#/cm 3 )<br />
1.5<br />
1<br />
0.5<br />
0<br />
·10 6<br />
10 100<br />
dp (nm)<br />
83.3 nm<br />
Figure 5.7: Lognormal distributions fitted to the measurements through the<br />
classifying DMA. The furnace peak temperatures from the darkest<br />
distribution to the lightest are 25, 744, 844, 894, 944 and 994 ◦ C.<br />
The fuel was fossil EN590 diesel and the original particle size selected<br />
by the classifying DMA was 83.3 nm. (Paper 4)<br />
The chosen particle size (83.3 nm) was situated roughly at the GMD of the particle<br />
size distribution measured on the 50 % load at 1500 rpm <strong>engine</strong> speed. The oxidation<br />
measurements were also conducted in the 100 % load 1500 rpm <strong>engine</strong> conditions.<br />
Particle size distributions at these loads are presented in Figure 2 of Paper 4. A<br />
lognormal distribution was fitted to each SMPS particle size distribution measurement<br />
in order to obtain an accurate value for the GMD of the distribution.<br />
Figure 5.8 presents the furnace treated mean particle sizes of monodisperse 83.3<br />
nm soot particles as a function of furnace peak temperature. In the results of Figure<br />
5.8(a), pressurized air was used as the carrier gas for the soot particles, whereas, in<br />
Figure 5.8(b), the carrier gas was nitrogen. As it can be seen from Figure 5.8(b),<br />
particle size starts to reduce in the furnace even without oxygen. The particle size<br />
reduction without oxygen in the carrier gas cannot, of course, be oxidation. The reason<br />
of the reduction cannot be further evaporation of volatile condensed species either<br />
since the particle size decrease did not start until the furnace temperature reached<br />
700 ◦ C. Further, the evaporation of volatile matter should only cause small changes in<br />
particle diameter since for, agglomerate particles such as soot, a major proportion of<br />
the condensated volatile matter fills the voids of the agglomerates. Thus, the reason for<br />
39
40 5. Effect of fuel on particle surface<br />
dg (nm)<br />
80<br />
60<br />
40<br />
(a)<br />
HVO 100% 2200rpm<br />
HVO 50% 2200rpm<br />
HVO 50% 1500rpm<br />
EN590 100% 2200rpm<br />
EN590 50% 2200rpm<br />
EN590 50% 1500rpm<br />
83.3 nm<br />
0 400 800 1200<br />
Furnace peak temperature ( ◦ C)<br />
dg (nm)<br />
80<br />
60<br />
40<br />
(b)<br />
HVO 100% 2200rpm<br />
HVO 50% 2200rpm<br />
HVO 50% 1500rpm<br />
EN590 100% 2200rpm<br />
EN590 50% 2200rpm<br />
EN590 50% 1500rpm<br />
83.3 nm<br />
0 400 800 1200<br />
Furnace peak temperature ( ◦ C)<br />
Figure 5.8: GMD of monodisperse (83.3 nm) diesel soot particles after furnace<br />
treatment as a function of furnace peak temperature. Pressurized<br />
air (a) and nitrogen (b) were used as the carrier gas for the particles.<br />
Modified from Paper 4.<br />
this size decrease is most probably non-oxidative particle restructuring, i.e. sintering.<br />
Particle size reductions having nitrogen as the carrier gas have been also observed<br />
before (Higgins et al. 2002, 2003) although the reductions have been lower than in<br />
Paper 4. As it can be seen from Figure 5.8(a), the particle size reduction was over<br />
20 nm at 1000 ◦ C. In previous studies (Higgins et al. 2002, 2003), the non-oxidative<br />
particle size decrease has been 11 nm at most (Higgins et al. 2003) but usually only<br />
few nanometers.<br />
However, when pressurized air was used as the carrier gas (Figure 5.8(a)), the particle<br />
size decrease was more pronounced. This indicates that further particle oxidation<br />
occurred. In all the measurement situations with pressurized air, the mean particle size<br />
remained at 83 nm until the furnace peak temperature reached approximately 750 ◦ C.<br />
On higher temperatures, particles started to decrease reaching almost 50 nm decrease<br />
in particle size at approximately 1000 ◦ C furnace peak temperature. However, the main<br />
result presented by Figures 5.8(a) and 5.8(b) is that there was no observable difference<br />
in the behaviour of the mean particle size as a function of the furnace peak temperature<br />
between the measurements performed with different fuels in different <strong>engine</strong> conditions.<br />
The result indicates that soot particles had similar oxidation characteristics in all the<br />
studied measurement situations.
All in all, the oxidation results presented above support well the particle structure<br />
results presented in Section 5.2. Both results conclude that there are no major chemical<br />
or structural differences between the soot particles generated with HVO and with<br />
conventional diesel. With the current setup, the temperature range of the oxidation<br />
measurements is limited by the amount of aerosol particles in the sample. The reason<br />
to this is that, at high furnace temperatures, the thermophoretic losses occurring during<br />
the cooling of the aerosol increase strongly with increasing temperature. Moreover, the<br />
increased losses at high temperatures occur together with the widening of the particle<br />
size distributions thus decreasing the accuracy of the determination of the GMD.<br />
5.4 Hygroscopicity<br />
Particle hygroscopicity was studied with a hygroscopic TDMA (HTDMA) in which the<br />
particle sample is conditioned by exposing it to high relative humidities. Already the<br />
first TDMA system of Liu et al. (1978) was essentially a HTDMA setup and, since<br />
then, several improved HTDMA setups have been built and reported (e.g. Rader and<br />
McMurry 1986; Weingartner et al. 1997, 2002; Hennig et al. 2005; Johnson et al. 2008).<br />
HTDMA systems produce particle growth factors as a function of relative humidity as<br />
the output. Particle growth factors are ratios of particle sizes between the humidified<br />
and the non-humidified, i.e. unconditioned, particles.<br />
The HTDMA system applied in this thesis is presented in Figure 5.9. After selecting<br />
the particle size with the first DMA (DMA1), the sample is led to an insulated chamber<br />
enclosing the humidification system and the second DMA (DMA2). The sample is first<br />
humidified in a Nafion humidifier and then measured with DMA2. The sheath air of<br />
DMA2 is also humidified in order to hinder the sample from evaporating or taking on<br />
more water due to the difference in relative humidities between the sample and sheath<br />
flows.<br />
The humidity conditioning in the system is performed on two stages. A pressurized<br />
air flow is first humidified with water in order to obtain an air flow having close to<br />
100 % relative humidity (RH). The temperature of the moisturizing water is controlled<br />
with a water bath capable of adjusting water temperature. The flow of high RH is<br />
then diluted with another flow of pressurized air to reach the humidity chosen by the<br />
operator. Next, the humidified air and the sample aerosol are conducted to the Nafion<br />
humidifier where the humidity between the two flows is balanced and, thus, the sample<br />
flow is humidified. The Nafion humidifier only transfers water from the humid flow<br />
to the drier one but it does not mix the flows. After balancing the humidity, the<br />
humidifying air flow is then used as the sheath air flow for DMA2.<br />
In the HTDMA system, temperature and humidity are monitored with five combined<br />
humidity and temperature sensors. One of these sensors (the uppermost in Figure<br />
41
42 5. Effect of fuel on particle surface<br />
water pump<br />
and bath<br />
air air<br />
MFC MFC<br />
sheath<br />
RH<br />
sample<br />
sample<br />
RH<br />
DMA1<br />
RH<br />
DMA2<br />
sheath<br />
RH<br />
RH<br />
excess<br />
MFC<br />
air<br />
MFC<br />
pump<br />
CPC<br />
Figure 5.9: HTDMA setup. Blue lines represent water lines and black lines sheath<br />
air/sample lines. The humidifiers are marked with blue patterns. The<br />
dashed line represents the insulated chamber enclosing the DMA2<br />
with the humidity control. (Paper 3)
5.9) monitors that the aerosol entering the system is dry enough, i.e. no significant<br />
hygroscopic growth had occurred before the HTDMA. Further, two of the sensors<br />
measuring temperature and humidity of the sheath and sample flow monitor whether<br />
the humidities of the flows had balanced in the Nafion humidifier so that no significant<br />
particle size change due to evaporation or condensation should occur within DMA2.<br />
However, the most important humidity sensor is the one measuring the humidity of<br />
the DMA2 excess flow, i.e. the humidity at which the growth factors are reported in<br />
the measurement results. In addition to these sensors, there was also a temperature<br />
and humidity sensor monitoring the sheath air flow before the Nafion humidifier. This<br />
sensor was important at the developing stage of the system as it monitors the humidity<br />
obtained by mixing the dry and humid pressurized air flows.<br />
The design of the HTDMA system shown here was chosen to enable the field use<br />
of the devise in different emission measurement campaigns. Therefore, the focus of the<br />
design was on portability and on fast RH adjustment. The humidity adjustment by<br />
mixing a nearly water saturated air flow with a dry air flow allowed the said fast RH<br />
adjustments. The time needed for the adjustment of humidity is mostly limited by the<br />
adaptability of the Nafion humidifier to the changed conditions. Also, the HTDMA<br />
sample had the capability to bypass the Nafion humidifier although it is not shown<br />
in Figure 5.9. Thus, by bypassing the Nafion humidifier with the sample flow and by<br />
providing the sheath flow as dry pressurized air, it is possible to reach dry conditions<br />
for measuring the dry particle size very quickly (≈1 min). Also the recovery from dry<br />
conditions to humid conditions is quite fast (≈5 min) since there are no flows through<br />
the humidifiers during the measurement of the dry particle size. A picture of the actual<br />
HTDMA system in its current form (in July 2012) is presented in Figure 5.10. The<br />
additional layer of insulation (the pinkish layer in Figure 5.10) and the Peltier cooler<br />
have been installed to the system after the measurements of Paper 3.<br />
The size change of <strong>exhaust</strong> particles caused by water uptake was measured for two<br />
particle sizes (20 and 50 nm) for both HVO fuel and the HVO–DNPE blend discussed in<br />
Section 4.2. The 50 nm particle size situated 10–15 nm below the GMD of the <strong>exhaust</strong><br />
particle size distributions (see Figure 4.4). The measured growth factors are presented<br />
in Figure 5.11. The particle sample was obtained with the porous tube sampling<br />
presented earlier in Figure 2.2. Thus, the particle sample contained both soot particles<br />
and the possible condensated species. The humidity error bar in Figure 5.11 represents<br />
the standard deviation of the temperature and humidity sensor reading during the<br />
measurement. The error bar of the growth factor, on the other hand, is calculated<br />
from the standard deviations of the measured GMDs of particle size distributions.<br />
It should be stressed, however, that the results in Figure 5.11 cannot be taken as<br />
accurate quantitative results. The reason to this is that the applied system had no<br />
active temperature control at the time of the measurements so the temperature control<br />
43
44 5. Effect of fuel on particle surface<br />
drain bottle<br />
for excess water<br />
water pump<br />
and bath<br />
DMA1<br />
Peltier cooler<br />
Humidifiers<br />
DMA2<br />
CPC<br />
Figure 5.10: HTDMA system in its current form (July 2012).<br />
relied only on insulation. This proved to be insufficient to remove temperature gradients<br />
from the system. There was a shift of 0.5 to 5.5 % RH between the sheath and sample<br />
flow entering DMA2, the sample flow having higher humidity in all cases. Further,<br />
there was a temperature drop between the sample flow and DMA2. This caused flow<br />
temperature to reduce 1.6–2.9 ◦ C within the DMA causing 2–5 % RH increase in<br />
humidity. However, the measured humidities at the excess flow were very repeatable<br />
with both fuels, see the error bars of RH in Figure 5.11 showing the standard deviation.<br />
Although the absolute values of RH had large uncertainties, the uncertainties were<br />
quite systematical and, thus, allowed to study the results qualitatively.<br />
The results show that hygroscopic growth of the measured particle sizes was very<br />
low (
Growth factor<br />
1.05<br />
1.04<br />
1.03<br />
1.02<br />
1.01<br />
1.00<br />
HVO HVO+DNPE<br />
20 nm 20 nm<br />
50 nm 50 nm<br />
90 91 92 93<br />
RH (%)<br />
Figure 5.11: Particle growth factors as a function of relative humidity with two<br />
fuels (HVO and HVO+DNPE) and with two initial particle sizes<br />
(20 and 50 nm). (Paper 3)<br />
expected since larger soot particles are more agglomerated and, thus, their more porous<br />
structure can hold more water without influencing the observed particle size. It has<br />
even been reported that large agglomerates may actually decrease in particle size due<br />
to the compaction of particles caused by the absorbed water (Weingartner et al. 1997;<br />
Henning et al. 2012).<br />
According to Figure 5.11, the average values of measured growth factors are slightly<br />
higher with 80 % HVO and 20 % DNPE blend than with pure HVO fuel. However,<br />
the growth factors of particles emitted with HVO fuel were measured at approximately<br />
2 % RH higher relative humidity. In general, the hygroscopic growth factor curves are<br />
exponential in their shape (e.g. Weingartner et al. 1997) so that higher humidities result<br />
in larger growth factors. Thus, the growth factors measured with HVO-oxygenate<br />
blend should have been even larger compared to those measured with HVO if the<br />
measurements had been conducted in exactly the same relative humidity.<br />
The particle composition was further studied by determining the ratio between<br />
organic carbon (OC) and elemental carbon (EC) from filtered samples. In the applied<br />
thermal optical analysis method (Birch and Cary 1996), a sample of filtered <strong>exhaust</strong><br />
gas is first heated in an oxygen-free atmosphere after which the amount of evaporated<br />
carbon (OC) is measured. After that, the sample is further heated in a helium/oxygen<br />
atmosphere while measuring the released carbon thus obtaining EC and pyrolysed OC.<br />
The results of OC/EC-ratios in the samples are presented in Figure 5.12. As it<br />
can be seen, the amount of total carbon (OC+EC) decreases when the fuel is changed<br />
from pure HVO to HVO-oxygenate blend. However, this decrease is mainly caused<br />
by the decrease in the EC fraction. Overall, the OC fraction decreases less than 15 %<br />
45
46 5. Effect of fuel on particle surface<br />
while the EC fraction loses roughly a third of its mass due to fuel change. This leads<br />
to higher OC/EC ratios for particles produced with HVO-oxygenate blend.<br />
Mass (mg/kWh)<br />
100<br />
80<br />
60<br />
40<br />
20<br />
0<br />
HVO HVO+DNPE<br />
EC EC<br />
OC OC<br />
50 75 100<br />
Load (%)<br />
Figure 5.12: The fractions of organic carbon (OC) and elemental carbon (EC)<br />
in the total filtered particle mass. (Paper 3)<br />
The result indicates that the slight increase in hygroscopicity might be caused by<br />
the somewhat larger amount of condensated organic species on the particles emitted<br />
with HVO-oxygenate blend. The higher OC content of particles may help to fill the<br />
cavities in the agglomerated structure of fresh <strong>exhaust</strong> particles. Therefore, less water<br />
might be required for ”oxygenated particles” than for ”HVO particles” to grow by a<br />
certain growth factor. Thus, in the view of the OC/EC results, it is possible that there<br />
are slightly more oxygen groups in particles emitted with the HVO-oxygenate blend<br />
and that they might contribute to the overall hygroscopicity but their contribution is<br />
very low.<br />
Overall, there was a difference in hygroscopic growth of particles between the<br />
different fuels but the difference was small. As the hygroscopic growth factors of fresh<br />
particles emitted with both fuels were generally very low, it is improbable that the<br />
choice of fuel between HVO and HVO-DNPE blend significantly affects the behaviour<br />
of emitted <strong>exhaust</strong> particles in the atmosphere.<br />
5.5 Discussion of the results<br />
Generally in this study, there were no major differences between the surface properties<br />
of particles emitted with different fuels. One question arising from this result is that
how large differences are in fact observable with the applied measurement techniques.<br />
It is possible that the applied TDMA techniques are not very sensitive to the studied<br />
particle properties due to the agglomerated nature of <strong>exhaust</strong> particles. The oxidation<br />
measurement may suffer from the dominance of sintering in the particle size reduction<br />
and, as discussed earlier, the hygroscopic growth of agglomerates is masked by the<br />
water filling the cavities within the agglomerates.<br />
Fortunately, in the case of studying oxidizability, the TDMA measurements were<br />
not the only measurements conducted. There was also the microstructure analysis<br />
together with the EELS analysis which agreed with the oxidation results regarding<br />
the similarity of the studied soot samples. Nevertheless, also with the TEM analyses,<br />
it can be difficult to find clear enough qualitative differences to distinguish between<br />
soot samples from different sources. Fortunately, there are some quantitative analyzing<br />
methods such as the lattice fringe analysis (Vander Wal et al. 2004), quantitative micro-<br />
Raman spectroscopy (Knauer et al. 2008) or calculations of the distances between<br />
graphene layers (Paper 4) which can facilitate the comparison of different samples.<br />
Nevertheless, these numerical analyses have to be conducted for a large enough number<br />
of individual particles in order to have adequate statistics.<br />
Overall, the surface property results seem to indicate that changing the fuel from<br />
conventional diesel to HVO to HVO-DNPE blend should induce no major differences<br />
for the behaviour of <strong>exhaust</strong> particles in aftertreatment devices, the respiratory track<br />
or in the atmosphere. Thus, as a result of this thesis, the surface properties of particles<br />
produced with HVO should be no great concern when assessing the suitability of the<br />
fuel for wider use.<br />
47
48 5. Effect of fuel on particle surface
<strong>Chapter</strong> 6<br />
Summary and final remarks<br />
Stricter emission regulations, the ongoing global warming and concerns about the<br />
sufficiency of oil resources are all factors that promote the research and utilization of<br />
fuels from renewable feedstocks. This thesis has focused on one promising renewable<br />
fuel, diesel produced by hydrotreating vegetable oils (HVO), and studied it from the<br />
perspective of <strong>engine</strong> <strong>exhaust</strong> <strong>emissions</strong>. The thesis discussed the effect of HVO fuel<br />
on <strong>exhaust</strong> <strong>emissions</strong> (Paper 1 and Paper 4) and the techniques to further reduce<br />
<strong>emissions</strong> (Paper 1, Paper 2 and Paper 3).<br />
It was observed that using HVO fuel instead of conventional diesel lowers both<br />
particulate and NOx <strong>emissions</strong> with the <strong>engine</strong> applied in this thesis (Paper 1). This<br />
observation of emission reductions is in line with the previous HVO studies (Rantanen<br />
et al. 2005; Kuronen et al. 2007; Aatola et al. 2008; Murtonen et al. 2010). The<br />
properties of HVO emitted soot particles were studied in Paper 4. According to the<br />
results, the particles emitted using HVO were very similar to those emitted using<br />
conventional diesel both regarding their structure and their oxidation properties. The<br />
similarity of soot particles emitted with HVO to those emitted with conventional<br />
diesel is new information and it confirms that the existing aftertreatment technology is<br />
suitable for HVO-fueled <strong>engine</strong>s.<br />
The ability of HVO to decrease both particulate and NOx <strong>emissions</strong> compared<br />
to conventional diesel arise most probably from the fact that HVO is practically free<br />
of aromatics. HVO also has much higher cetane number (≈90) than conventional<br />
diesel (≈50) which causes the <strong>engine</strong> adjustments designed for conventional diesel to<br />
be suboptimal for HVO fuel. The HVO fuel also provides an opportunity for more<br />
extensive use of NOx reduction techniques due to the lower particulate <strong>emissions</strong><br />
associated with the fuel. The chosen <strong>emissions</strong> reduction techniques studied in this<br />
thesis have not been previously applied to renewable fuels. In Paper 1, a variable<br />
valve timing strategy based on early inlet valve closing with constant inlet air mass flow<br />
(i.e. Miller timing) was tested with HVO fuel. The results indicated that, with HVO<br />
as fuel, the strategy showed potential to reduce NOx <strong>emissions</strong> without considerable<br />
increases in particulate <strong>emissions</strong>. In Paper 2, the approach to use Miller timing<br />
with HVO fuel continued but, in this case, with the combined adjustments with EGR,<br />
injection pressure and injection timing. It was shown that particulate mass and NOx<br />
49
50 6. Summary and final remarks<br />
can both be reduced over 25 % by <strong>engine</strong> parameter adjustments. Further, the emission<br />
reductions were even higher when the <strong>engine</strong> parameter adjustments were targeted to<br />
reduce exclusively either particulates or NOx. Nevertheless, it should be noted that the<br />
obtainable emission reductions depend strongly on the given <strong>engine</strong> and aftertreatment<br />
technology.<br />
The other approach studied in this thesis to reduce <strong>exhaust</strong> <strong>emissions</strong> is the<br />
appliance of oxygenated HVO fuel. Oxygen in fuel reduces efficiently particulate<br />
<strong>emissions</strong> and, as HVO contains no oxygen, the addition of oxygenate could enable even<br />
higher particulate emission reductions. In Paper 3, a fuel blend containing 20 wt-%<br />
di-n-pentyl ether (DNPE) and wt-80 % HVO, thus having 2 wt-% oxygen content, was<br />
chosen as the oxygenated fuel. It was observed, that particulate <strong>emissions</strong> decreased<br />
over 25 % with the blend while NOx <strong>emissions</strong> changed under 5 %. Thus, the use of<br />
oxygenate-HVO blend could provide even more clearance for the more pronounced<br />
reductions NOx, for example, by using EGR. It was also observed, that the use of<br />
oxygenated HVO did not seem to significantly affect the properties of emitted particles<br />
regarding their hygroscopicity.<br />
Time will tell what the role of HVO fuel is in the future. Currently, governments<br />
encourage the use of renewable fuels and, consequently, commercial production of<br />
HVO has increased considerably. Nevertheless, debates are still aroused whether the<br />
production of HVO fuel is environmentally sustainable or not. The greatest issue lies<br />
on the cultivation practices of the feedstock and, especially, on the land use changes<br />
associated with the cultivation. However, regardless of the outcome of these debates,<br />
this thesis has shown that HVO is technically a very attractive fuel. HVO reduces<br />
<strong>engine</strong> <strong>exhaust</strong> <strong>emissions</strong> while still being similar enough to conventional diesel so<br />
that the <strong>exhaust</strong> particle properties are not observably altered. There is also much<br />
potential to further reduce <strong>engine</strong> <strong>exhaust</strong> <strong>emissions</strong> with the fuel, for example, via<br />
<strong>engine</strong> optimization. Consequently, the fuel has potential to become one of the solutions<br />
that help to meet the increasingly strictening <strong>exhaust</strong> emission limits. Besides, it will<br />
not hurt to have another technology available to ease the next oil crisis.
References<br />
Aatola, H., Larmi, M., Sarjovaara, T., Mikkonen, S., 2008. Hydrotreated vegetable oil<br />
(HVO) as a renewable diesel fuel: trade-off between NOx, particulate emission, and<br />
fuel consumption of a heavy duty <strong>engine</strong>. SAE Technical Paper Series 2008-01-2500.<br />
Abu-Jrai, A., Tsolakis, A., Theinnoi, K., Cracknell, R., Megaritis, A., Wyszynski, M. L.,<br />
Golunski, S. E., 2006. Effect of gas-to-liquid diesel fuels on combustion characteristics,<br />
<strong>engine</strong> <strong>emissions</strong>, and <strong>exhaust</strong> gas fuel reforming. Comparative study. Energy &<br />
Fuels 20 (6), 2377–2384.<br />
Armas, O., Yehliu, K., Boehman, A. L., 2010. Effect of alternative fuels on <strong>exhaust</strong><br />
<strong>emissions</strong> during diesel <strong>engine</strong> operation with matched combustion phasing. Fuel<br />
89 (2), 438–456.<br />
Benajes, J., Molina, S., Martín, J., Novella, R., 2009a. Effect of advancing the closing<br />
angle of the intake valves on diffusion-controlled combustion in a HD diesel <strong>engine</strong>.<br />
Applied Thermal Engineering 29 (10), 1947–1954.<br />
Benajes, J., Molina, S., Novella, R., Riesco, M., 2008. Improving pollutant <strong>emissions</strong><br />
in diesel <strong>engine</strong>s for heavy-duty transportation using retarded intake valve closing<br />
strategies. International Journal of Automotive Technology 9 (3), 257–265.<br />
Benajes, J., Serrano, J. R., Molina, S., Novella, R., 2009b. Potential of Atkinson cycle<br />
combined with EGR for pollutant control in a HD diesel <strong>engine</strong>. Energy Conversion<br />
and Management 50 (1), 174–183.<br />
Birch, M. E., Cary, R. A., 1996. Elemental carbon-based method for monitoring<br />
occupational exposures to particulate diesel <strong>exhaust</strong>. Aerosol Science and Technology<br />
25 (3), 221–241.<br />
Bunce, M., Snyder, D., Adi, G., Hall, C., Koehler, J., Davila, B., Kumar, S., Garimella,<br />
P., Stanton, D., Shaver, G., 2011. Optimization of soy-biodiesel combustion in a<br />
modern diesel <strong>engine</strong>. Fuel 90 (8), 2560–2570.<br />
Chang, D. Y. Z., Van Gerpen, J. H., Lee, I., Johnson, L. A., Hammond, E. G., Marley,<br />
S. J., 1996. Fuel properties and <strong>emissions</strong> of soybean oil esters as diesel fuel. Journal<br />
of the American Oil Chemists’ Society 73 (11), 1549–1555.<br />
Cheng, Y. S., 2011. Condensation particle counters. In: Kulkarni, P., Baron, P. A.,<br />
Willeke, K. (Eds.), Aerosol Measurement: Principles, Techniques and Applications,<br />
3rd Edition. John Wiley & Sons, Inc., Ch. 17.<br />
51
52 References<br />
Demirbas, A., 2007a. Importance of biodiesel as transportation fuel. Energy Policy<br />
35 (9), 4661–4670.<br />
Demirbas, A., 2007b. Progress and recent trends in biofuels. Progress in Energy and<br />
Combustion Science 33 (1), 1–18.<br />
<strong>Diesel</strong>net, 2012. Automotive <strong>Diesel</strong> Fuel.<br />
www.dieselnet.com/standards/eu/fuel_automotive.php#y1993, [Online, Accessed<br />
March 20, 2012].<br />
Dockery, D. W., Pope, C. A., Xu, X., Spengler, J. D., Ware, J. H., Fay, M. E., Ferris Jr,<br />
B. G., Speizer, F. E., 1993. An association between air pollution and mortality in<br />
six US cities. New England Journal of Medicine 329 (24), 1753–1759.<br />
Dry, M. E., 2002. High quality diesel via the Fischer-Tropsch process – a review. Journal<br />
of Chemical Technology and Biotechnology 77 (1), 43–50.<br />
Eastwood, P., 2008. Particulate <strong>emissions</strong> from vehicles. John Wiley & Sons.<br />
EU, 2011. Commission Regulation (EU) No 582/2011 of 25 May 2011 implementing<br />
and amending Regulation (EC) No 595/2009 of the European Parliament and of the<br />
Council with respect to <strong>emissions</strong> from heavy duty vehicles (Euro VI) and amending<br />
Annexes I and III to Directive 2007/46/EC of the European Parliament and of the<br />
Council Text with EEA relevance. Official Journal of the European Union L 167,<br />
1–168.<br />
Fernando, S., Hall, C., Jha, S., 2006. NOx reduction from biodiesel fuels. Energy &<br />
Fuels 20 (1), 376–382.<br />
Filippo, A. D., Maricq, M. M., 2008. <strong>Diesel</strong> nucleation mode particles: semivolatile or<br />
solid? Environmental Science & Technology 42 (21), 7957–7962.<br />
Giechaskiel, B., Ntziachristos, L., Samaras, Z., 2009. Effect of ejector dilutors on<br />
measurements of automotive <strong>exhaust</strong> gas aerosol size distributions. Measurement<br />
Science and Technology 20, 045703.<br />
Gill, S. S., Tsolakis, A., Dearn, K. D., Rodríguez-Fernández, J., 2011a. Combustion<br />
characteristics and <strong>emissions</strong> of Fischer-Tropsch diesel fuels in IC <strong>engine</strong>s. Progress<br />
in Energy and Combustion Science 37 (4), 503–523.<br />
Gill, S. S., Tsolakis, A., Herreros, J. M., York, A. P. E., 2011b. <strong>Diesel</strong> <strong>emissions</strong><br />
improvements through the use of biodiesel or oxygenated blending components. Fuel<br />
95, 578–586.
References 53<br />
Glaude, P., Fournet, R., Bounaceur, R., Molière, M., 2010. Adiabatic flame temperature<br />
from biofuels and fossil fuels and derived effect on NOx <strong>emissions</strong>. Fuel Processing<br />
Technology 91 (2), 229–235.<br />
Helwani, Z., Othman, M. R., Aziz, N., Fernando, W. J. N., Kim, J., 2009. Technologies<br />
for production of biodiesel focusing on green catalytic techniques: a review. Fuel<br />
Processing Technology 90 (12), 1502–1514.<br />
Hennig, T., Massling, A., Brechtel, F. J., Wiedensohler, A., 2005. A tandem DMA for<br />
highly temperature-stabilized hygroscopic particle growth measurements between 90<br />
% and 98 % relative humidity. Journal of Aerosol Science 36 (10), 1210–1223.<br />
Henning, S., Ziese, M., Kiselev, A., Saathoff, H., Möhler, O., Mentel, T. F., Buchholz, A.,<br />
Spindler, C., Michaud, V., Monier, M., Sellegri, K., Stratmann, F., 2012. Hygroscopic<br />
growth and droplet activation of soot particles: uncoated, succinic or sulfuric acid<br />
coated. Atmospheric Chemistry & Physics 12, 4525–4537.<br />
Heywood, J. B., 1988. Internal combustion <strong>engine</strong> fundamentals. McGraw-Hill.<br />
Higgins, K. J., Jung, H., Kittelson, D. B., Roberts, J. T., Zachariah, M. R., 2002.<br />
Size-selected nanoparticle chemistry: kinetics of soot oxidation. The Journal of<br />
Physical Chemistry A 106 (1), 96–103.<br />
Higgins, K. J., Jung, H., Kittelson, D. B., Roberts, J. T., Zachariah, M. R., 2003.<br />
Kinetics of diesel nanoparticle oxidation. Environmental Science & Technology 37 (9),<br />
1949–1954.<br />
Hong, H., Parvate-Patil, G. B., Gordon, B., 2004. Review and analysis of variable<br />
valve timing strategies – eight ways to approach. Proceedings of the Institution<br />
of Mechanical Engineers. Part D: Journal of Automobile Engineering 218 (10),<br />
1179–1200.<br />
Huang, Y., Wang, S., Zhou, L., 2008. Effects of Fischer-Tropsch diesel fuel on combustion<br />
and <strong>emissions</strong> of direct injection diesel <strong>engine</strong>. Frontiers of Energy and Power<br />
Engineering in China 2 (3), 261–267.<br />
Huber, G. W., Corma, A., 2007. Synergies between bio- and oil refineries for the<br />
production of fuels from biomass. Angewandte Chemie International Edition 46 (38),<br />
7184–7201.<br />
Ickes, A. M., Bohac, S. V., Assanis, D. N., 2009. Effect of fuel cetane number on a<br />
premixed diesel combustion mode. International Journal of Engine Research 10 (4),<br />
251–263.
54 References<br />
IEA, 2010. Key world energy statistics. International Energy Agency, Paris,<br />
http://www.iea.org/textbase/nppdf/free/2010/key_stats_2010.pdf [Online,<br />
Accessed July 21, 2012].<br />
Imperato, M., Sarjovaara, T., Larmi, M., Kallio, I., Wik, C., 2010. Some experimental<br />
experience gained with a medium-speed diesel research <strong>engine</strong>. In: CIMAC Paper<br />
238. Bergen, Norway, pp. 1–13.<br />
Jain, S., Sharma, M. P., 2010. Prospects of biodiesel from jatropha in India: a review.<br />
Renewable and Sustainable Energy Reviews 14 (2), 763–771.<br />
Johnson, G. R., Fletcher, C., Meyer, N., Modini, R., Ristovski, Z. D., 2008. A robust,<br />
portable H-TDMA for field use. Journal of Aerosol Science 39 (10), 850–861.<br />
Joutsensaari, J., Vaattovaara, P., Vesterinen, M., Hämeri, K., Laaksonen, A., 2001. A<br />
novel tandem differential mobility analyzer with organic vapor treatment of aerosol<br />
particles. Atmospheric Chemistry and Physics 1 (1), 51–60.<br />
Jung, H., Kittelson, D. B., Zachariah, M. R., 2006. Characteristics of SME biodieselfueled<br />
diesel particle <strong>emissions</strong> and the kinetics of oxidation. Environmental Science<br />
& Technology 40 (16), 4949–4955.<br />
Kalam, M. A., Masjuki, H. H., 2002. Biodiesel from palmoil – an analysis of its<br />
properties and potential. Biomass and Bioenergy 23 (6), 471–479.<br />
Keskinen, J., Pietarinen, K., Lehtimäki, M., 1992. Electrical low pressure impactor.<br />
Journal of Aerosol Science 23 (4), 353–360.<br />
Kidoguchi, Y., Yang, C., Kato, R., Miwa, K., 2000. Effects of fuel cetane number and<br />
aromatics on combustion process and <strong>emissions</strong> of a direct-injection diesel <strong>engine</strong>.<br />
JSAE Review 21 (4), 469–475.<br />
Kim, S. H., Woo, K. S., Liu, B. Y. H., Zachariah, M. R., 2005. Method of measuring<br />
charge distribution of nanosized aerosols. Journal of Colloid and Interface Science<br />
282 (1), 46–57.<br />
Kitamura, T., Ito, T., Senda, J., Fujimoto, H., 2001. Extraction of the suppression<br />
effects of oxygenated fuels on soot formation using a detailed chemical kinetic model.<br />
JSAE Review 22 (2), 139–145.<br />
Kittelson, D. B., 1998. Engines and nanoparticles: a review. Journal of Aerosol Science<br />
29 (5–6), 575–588.
References 55<br />
Knauer, M., Carrara, M., Rothe, D., Niessner, R., Ivleva, N. P., 2008. Changes in<br />
structure and reactivity of soot during oxidation and gasification by oxygen, studied<br />
by micro-Raman spectroscopy and temperature programmed oxidation. Aerosol<br />
Science and Technology 43 (1), 1–8.<br />
Knothe, G., Van Gerpen, J. H., Krahl, J., 2005. The biodiesel handbook. American<br />
Oil Chemists’ Society.<br />
Konstandopoulos, A. G., Kostoglou, M., 2000. Reciprocating flow regeneration of soot<br />
filters. Combustion and Flame 121 (3), 488–500.<br />
Körbitz, W., 1999. Biodiesel production in Europe and North America, an encouraging<br />
prospect. Renewable Energy 16 (1–4), 1078–1083.<br />
Kuronen, M., Mikkonen, S., Aakko, P., Murtonen, T., 2007. Hydrotreated vegetable<br />
oil as fuel for heavy duty diesel <strong>engine</strong>s. SAE Technical Paper Series 2007-01-4031.<br />
Labeckas, G., Slavinskas, S., 2006. The effect of rapeseed oil methyl ester on direct<br />
injection diesel <strong>engine</strong> performance and <strong>exhaust</strong> <strong>emissions</strong>. Energy Conversion and<br />
Management 47 (13), 1954–1967.<br />
Laden, F., Schwartz, J., Speizer, F. E., Dockery, D. W., 2006. Reduction in fine<br />
particulate air pollution and mortality. American Journal of Respiratory and Critical<br />
Care Medicine 173 (6), 667–672.<br />
Lähde, T., Rönkko, T., Happonen, M., Söderström, C., Virtanen, A., Solla, A., Kytö,<br />
M., Rothe, D., Keskinen, J., 2011. Effect of fuel injection pressure on a heavy-duty<br />
diesel <strong>engine</strong> nonvolatile particle emission. Environmental Science and Technology<br />
45 (6), 2504–2509.<br />
Lähde, T., Rönkkö, T., Virtanen, A., Schuck, T. J., Pirjola, L., Hämeri, K., Kulmala,<br />
M., Arnold, F., Rothe, D., Keskinen, J., 2008. Heavy duty diesel <strong>engine</strong> <strong>exhaust</strong><br />
aerosol particle and ion measurements. Environmental Science & Technology 43 (1),<br />
163–168.<br />
Lancefield, T., Methley, I., Räse, U., Kuhn, T., 2000. The application of variable event<br />
valve timing to a modern diesel <strong>engine</strong>. SAE Technical Paper Series 2000-01-1229.<br />
Lapuerta, M., Armas, O., Rodríguez-Fernández, J., 2008. Effect of biodiesel fuels on<br />
diesel <strong>engine</strong> <strong>emissions</strong>. Progress in Energy and Combustion Science 34 (2), 198–223.<br />
Lapuerta, M., Oliva, F., Agudelo, J. R., Boehman, A. L., 2012. Effect of fuel on the soot<br />
nanostructure and consequences on loading and regeneration of diesel particulate<br />
filters. Combustion and Flame 159 (2), 844–853.
56 References<br />
Lapuerta, M., Villajos, M., Agudelo, J. R., Boehman, A. L., 2011. Key properties and<br />
blending strategies of hydrotreated vegetable oil as biofuel for diesel <strong>engine</strong>s. Fuel<br />
Processing Technology 92 (12), 2406–2411.<br />
Le Treut, H., Somerville, R., Cubasch, U., Ding, Y., Mauritzen, C., Mokssit, A.,<br />
Peterson, T., Prather, M., 2007. Historical overview of climate change. In: Solomon,<br />
S., Qin, D., Manning, M., Chen, Z., Marquis, M., Averyt, K. B., Tignor, M., Miller,<br />
H. L. (Eds.), Climate change 2007: the physical science basis. Contribution of<br />
Working Group I to the fourth assessment report of the intergovernmental panel on<br />
climate change.<br />
Leung, D. Y. C., Luo, Y., Chan, T. L., 2006. Optimization of <strong>exhaust</strong> <strong>emissions</strong> of a<br />
diesel <strong>engine</strong> fuelled with biodiesel. Energy & Fuels 20 (3), 1015–1023.<br />
Liu, B. Y. H., Pui, D. Y. H., Whitby, K. T., Kittelson, D. B., Kousaka, Y., McKenzie,<br />
R. L., 1978. The aerosol mobility chromatograph: a new detector for sulfuric acid<br />
aerosols. Atmospheric Environment 12 (1), 99–104.<br />
Lyyränen, J., Jokiniemi, J., Kauppinen, E., Backman, U., Vesala, H., 2004. Comparison<br />
of different dilution methods for measuring diesel particle <strong>emissions</strong>. Aerosol Science<br />
and Technology 38 (1), 12–23.<br />
Marchionna, M., Patrini, R., Giavazzi, F., Garibaldi, P., 2000. High cetane ethers<br />
for the reformulation of diesel fuels. In: 16th World Petroleum Congress. Calgary,<br />
Canada, pp. 38–45.<br />
Maricq, M. M., Podsiadlik, D. H., Brehob, D. D., Haghgooie, M., 1999. Particulate<br />
<strong>emissions</strong> from a direct-injection spark-ignition (DISI) <strong>engine</strong>. SAE Technical Paper<br />
Series 1999-01-1530.<br />
Martin, B., Aakko, P., Beckman, D., Del Giacomo, N., Giavazzi, F., 1997. Influence of<br />
future fuel formulations on diesel <strong>engine</strong> <strong>emissions</strong> – a joint European study. SAE<br />
Technical Paper Series 972966.<br />
McCormick, R. L., Ross, J. D., Graboski, M. S., 1997. Effect of several oxygenates<br />
on regulated <strong>emissions</strong> from heavy-duty diesel <strong>engine</strong>s. Environmental Science and<br />
Technology 31 (4), 1144–1150.<br />
Mikkanen, P., Moisio, M., Keskinen, J., Ristimäki, J., Marjamäki, M., 2001. Sampling<br />
method for particle measurements of vehicle <strong>exhaust</strong>. SAE Technical Paper Series<br />
2001-01-0219.
References 57<br />
Miller, K. A., Siscovick, D. S., Sheppard, L., Shepherd, K., Sullivan, J. H., Anderson,<br />
G. L., Kaufman, J. D., 2007. Long-term exposure to air pollution and incidence of<br />
cardiovascular events in women. New England Journal of Medicine 356 (5), 447–458.<br />
Miller, R. H., 1947. Supercharging and internal cooling cycle for high output. ASME<br />
Transactions 69, 453–457.<br />
Mills, N., Donaldson, K., Hadoke, P., Boon, N., MacNee, W., Cassee, F., Sandström,<br />
T., Blomberg, A., Newby, D., 2008. Adverse cardiovascular effects of air pollution.<br />
Nature Clinical Practice Cardiovascular Medicine 6 (1), 36–44.<br />
Müller, J. O., Su, D. S., Jentoft, R. E., Kröhnert, J., Jentoft, F. C., Schlögl, R.,<br />
2005. Morphology-controlled reactivity of carbonaceous materials towards oxidation.<br />
Catalysis Today 102, 259–265.<br />
Murphy, M. J., 1999. Safety and industrial hygiene issues related to the use of oxygenates<br />
in diesel fuel. SAE Technical Paper Series 1999-01-1473.<br />
Murphy, M. J., 2002. Oxygenate compatibility with diesel fuels. SAE Technical Paper<br />
Series 2002-01-2848.<br />
Murray, J., King, D., 2012. Oil’s tipping point has passed. Nature 481 (7382), 433–435.<br />
Murtonen, T., Aakko-Saksa, P., Kuronen, M., Mikkonen, S., Lehtoranta, K., 2010.<br />
Emissions with heavy-duty diesel <strong>engine</strong>s and vehicles using FAME, HVO and GTL<br />
fuels with and without DOC+POC aftertreatment. SAE International Journal of<br />
Fuels and Lubricants 2 (2), 147–166.<br />
Nabi, M., Hustad, J., 2010. Influence of biodiesel addition to Fischer-Tropsch fuel on<br />
diesel <strong>engine</strong> performance and <strong>exhaust</strong> <strong>emissions</strong>. Energy & Fuels 24 (5), 2868–2874.<br />
Neeft, J., Makkee, M., Moulijn, J. A., 1996. <strong>Diesel</strong> particulate emission control. Fuel<br />
Processing Technology 47 (1), 1–69.<br />
Ntziachristos, L., Giechaskiel, B., Pistikopoulos, P., Samaras, Z., Mathis, U., Mohr,<br />
M., Ristimäki, J., Keskinen, J., Mikkanen, P., Casati, R., et al., 2004. Performance<br />
evaluation of a novel sampling and measurement system for <strong>exhaust</strong> particle<br />
characterization. SAE Technical Paper Series 2004-01-1439.<br />
Oberdörster, G., Sharp, Z., Atudorei, V., Elder, A., Gelein, R., Kreyling, W., Cox, C.,<br />
2004. Translocation of inhaled ultrafine particles to the brain. Inhalation toxicology<br />
16 (6-7), 437–445.
58 References<br />
Pachauri, R. K., Reisinger, A. (Eds.), 2007. Climate Change 2007: Synthesis Report.<br />
Contribution of Working Groups I, II and III to the Fourth Assessment Report of<br />
the Intergovernmental Panel on Climate Change. IPCC.<br />
Pecci, G. C., Clerici, M. G., Giavazzi, F., Ancillotti, F., Marchionna, M., Patrini,<br />
R., 1991. Oxygenated diesel fuels. Part I – structure and properties correlation. In:<br />
Proceedings of the 9th International Symposium on Alcohol Fuels (ISAF). Firenze,<br />
Italy, pp. 321–326.<br />
Pope III, C. A., Ezzati, M., Dockery, D. W., 2009. Fine-particulate air pollution and<br />
life expectancy in the United States. New England Journal of Medicine 360 (4),<br />
376–386.<br />
Rader, D. J., McMurry, P. H., 1986. Application of the tandem differential mobility<br />
analyzer to studies of droplet growth or evaporation. Journal of Aerosol Science<br />
17 (5), 771–787.<br />
Rantanen, L., Linnaila, R., Aakko, P., Harju, T., 2005. NExBTL – biodiesel fuel of the<br />
second generation. SAE Technical Paper Series 2005-01-3771.<br />
Ren, Y., Huang, Z., Miao, H., Di, Y., Jiang, D., Zeng, K., Liu, B., Wang, X., 2008.<br />
Combustion and <strong>emissions</strong> of a DI diesel <strong>engine</strong> fuelled with diesel-oxygenate blends.<br />
Fuel 87 (12), 2691–2697.<br />
Rönkkö, T., Virtanen, A., Kannosto, J., Keskinen, J., Lappi, M., Pirjola, L., 2007.<br />
Nucleation mode particles with a nonvolatile core in the <strong>exhaust</strong> of a heavy duty<br />
diesel vehicle. Environmental Science & Technology 41 (18), 6384–6389.<br />
Rönkkö, T., Virtanen, A., Vaaraslahti, K., Keskinen, J., Pirjola, L., Lappi, M., 2006.<br />
Effect of dilution conditions and driving parameters on nucleation mode particles in<br />
diesel <strong>exhaust</strong>: laboratory and on-road study. Atmospheric Environment 40 (16),<br />
2893–2901.<br />
Satoh, K., Zhang, L., Hatanaka, H., Takatsuki, T., Yokota, K., 1997. Relationship<br />
between NOx and SM <strong>emissions</strong> from DI diesel <strong>engine</strong> with EGR. JSAE Review<br />
18 (4), 369–375.<br />
Semelsberger, T. A., Borup, R. L., Greene, H. L., 2006. Dimethyl ether (DME) as an<br />
alternative fuel. Journal of Power Sources 156 (2), 497–511.<br />
Shrivastava, M., Nguyen, A., Zheng, Z., Wu, H. W., Jung, H. S., 2010. Kinetics of soot<br />
oxidation by NO2. Environmental Science & Technology 44 (12), 4796–4801.
References 59<br />
Sorenson, S. C., 2001. Dimethyl ether in diesel <strong>engine</strong>s: progress and perspectives.<br />
Journal of Engineering for Gas Turbines and Power 123 (3), 652–658.<br />
Su, D., Jentoft, R., Müller, J., Rothe, D., Jacob, E., Simpson, C., Tomović, Ž., Müllen,<br />
K., Messerer, A., Pöschl, U., et al., 2004a. Microstructure and oxidation behaviour<br />
of Euro IV diesel <strong>engine</strong> soot: a comparative study with synthetic model soot<br />
substances. Catalysis Today 90 (1), 127–132.<br />
Su, D. S., Müller, J. O., Jentoft, R. E., Rothe, D., Jacob, E., Schlögl, R., 2004b.<br />
Fullerene-like soot from Euro IV diesel <strong>engine</strong>: consequences for catalytic automotive<br />
pollution control. Topics in Catalysis 30 (1), 241–245.<br />
Su, D. S., Serafino, A., Müller, J. O., Jentoft, R. E., Schlögl, R., Fiorito, S., 2008.<br />
Cytotoxicity and inflammatory potential of soot particles of low-emission diesel<br />
<strong>engine</strong>s. Environmental Science & Technology 42 (5), 1761–1765.<br />
Sunde, K., Brekke, A., Solberg, B., 2011. Environmental impacts and costs of hydrotreated<br />
vegetable oils, transesterified lipids and woody BTL – a review. Energies<br />
4 (6), 845–877.<br />
Tijmensen, M. J. A., Faaij, A. P. C., Hamelinck, C. N., van Hardeveld, M. R. M., 2002.<br />
Exploration of the possibilities for production of Fischer-Tropsch liquids and power<br />
via biomass gasification. Biomass and Bioenergy 23 (2), 129–152.<br />
Tilli, A., Imperato, M., Aakko-Saksa, P., Larmi, M., Sarjovaara, T., Honkanen, M.,<br />
2010. High cetane number paraffinic diesel fuels and emission reduction in <strong>engine</strong><br />
combustion. In: CIMAC Paper 26. Bergen, Norway, pp. 1–14.<br />
Vaaraslahti, K., Virtanen, A., Ristimäki, J., Keskinen, J., 2004. Nucleation mode formation<br />
in heavy-duty diesel <strong>exhaust</strong> with and without a particulate filter. Environmental<br />
Science & Technology 38 (18), 4884–4890.<br />
Vander Wal, R. L., Tomasek, A. J., 2003. Soot oxidation: dependence upon initial<br />
nanostructure. Combustion and Flame 134 (1-2), 1–9.<br />
Vander Wal, R. L., Tomasek, A. J., Street, K., Hull, D. R., Thompson, W. K.,<br />
2004. Carbon nanostructure examined by lattice fringe analysis of high-resolution<br />
transmission electron microscopy images. Applied Spectroscopy 58 (2), 230–237.<br />
Wang, S. C., Flagan, R. C., 1990. Scanning electrical mobility spectrometer. Aerosol<br />
Science and Technology 13 (2), 230–240.<br />
Wang, X., Cheung, C. S., Di, Y., Huang, Z., 2012. <strong>Diesel</strong> <strong>engine</strong> gaseous and particle<br />
<strong>emissions</strong> fueled with diesel–oxygenate blends. Fuel 94, 317–323.
60 References<br />
Wang, Y., Zeng, S., Huang, J., He, Y., Huang, X., Lin, L., Li, S., 2005. Experimental<br />
investigation of applying Miller cycle to reduce NOx emission from diesel <strong>engine</strong>.<br />
Proceedings of the Institution of Mechanical Engineers, Part A: Journal of Power<br />
and Energy 219 (8), 631–638.<br />
Weingartner, E., Burtscher, H., Baltensperger, U., 1997. Hygroscopic properties of<br />
carbon and diesel soot particles. Atmospheric Environment 31 (15), 2311–2327.<br />
Weingartner, E., Gysel, M., Baltensperger, U., 2002. Hygroscopicity of aerosol particles<br />
at low temperatures. 1. New low-temperature H-TDMA instrument: setup and first<br />
applications. Environmental Science & Technology 36 (1), 55–62.<br />
WHO, 2012. IARC: diesel <strong>engine</strong> <strong>exhaust</strong> carsinogenic.<br />
http://press.iarc.fr/pr213_E.pdf, press release 12 June 2012, [Online,<br />
Accessed July 9, 2012].<br />
Williams, D. B., Carter, C. B., 2009. Transmission Electron Microscopy. A Textbook<br />
for Materials Science. Springer.<br />
Wu, T., Huang, Z., Zhang, W., Fang, J., Yin, Q., 2007. Physical and chemical<br />
properties of GTL-diesel fuel blends and their effects on performance and <strong>emissions</strong><br />
of a multicylinder DI compression ignition <strong>engine</strong>. Energy & Fuels 21 (4), 1908–1914.<br />
Xi, J., Zhong, B. J., 2006. Soot in diesel combustion systems. Chemical Engineering &<br />
Technology 29 (6), 665–673.<br />
Zheng, M., Reader, G. T., Hawley, J. G., 2004. <strong>Diesel</strong> <strong>engine</strong> <strong>exhaust</strong> gas recirculation<br />
– a review on advanced and novel concepts. Energy Conversion and Management<br />
45 (6), 883–900.


![[Tiedoston alaotsikko] - Tampereen teknillinen yliopisto](https://img.yumpu.com/18588737/1/184x260/tiedoston-alaotsikko-tampereen-teknillinen-yliopisto.jpg?quality=85)