Estimation and Comparison of Volume Delay Functions for Arterials ...
Estimation and Comparison of Volume Delay Functions for Arterials ...
Estimation and Comparison of Volume Delay Functions for Arterials ...
Create successful ePaper yourself
Turn your PDF publications into a flip-book with our unique Google optimized e-Paper software.
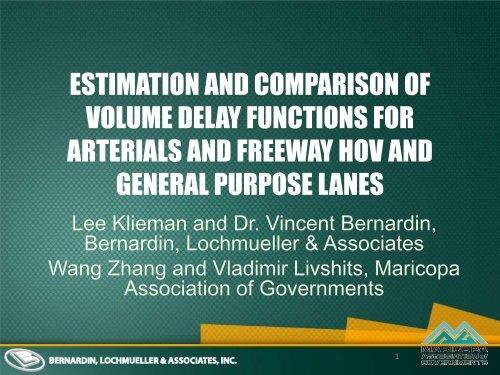
ESTIMATION AND COMPARISON OF<br />
VOLUME DELAY FUNCTIONS FOR<br />
ARTERIALS AND FREEWAY HOV AND<br />
GENERAL PURPOSE LANES<br />
Lee Klieman <strong>and</strong> Dr. Vincent Bernardin,<br />
Bernardin, Lochmueller & Associates<br />
Wang Zhang <strong>and</strong> Vladimir Livshits, Maricopa<br />
Association <strong>of</strong> Governments<br />
1
PRESENTATION TOPICS<br />
• Benefits <strong>of</strong> ef<strong>for</strong>t<br />
• Model background<br />
• VDF estimation methodology <strong>and</strong> results<br />
• Data<br />
• VDF calibration<br />
• Future work<br />
2
IMPROVING THE MAG TDM THROUGH VDF<br />
CALIBRATION<br />
• VDF estimation based on empirical data<br />
• Realistic travel times <strong>and</strong> congested speeds<br />
• Traffic assignment<br />
• Air quality<br />
• Intermodal comparisons<br />
• Refined differentiation between functional<br />
classes<br />
• Evaluation <strong>of</strong> improvements<br />
• Reduce the instance <strong>of</strong> “special case” roads<br />
3
CONTRIBUTION TO MODELING PRACTICE<br />
• Empirically fitted VDF curves<br />
• Compares 4 different VDF <strong>for</strong>ms<br />
• Independently validates predicted speeds<br />
with separate data source<br />
• Estimates VDF parameters <strong>for</strong> Freeway<br />
HOV lanes separately<br />
4
MAG TRAVEL DEMAND MODEL<br />
• Traditional 4-step model<br />
• 5 area types<br />
• 10 functional classifications<br />
• Existing BPR curve <strong>for</strong> VDF<br />
• Freeways<br />
• Surface streets<br />
5
DATA AVAILABLE FOR VDF ESTIMATION<br />
Roadway<br />
Types<br />
Fwy HOV<br />
Lanes<br />
Fwy General<br />
Purpose Lanes<br />
Major<br />
<strong>Arterials</strong><br />
CBD Outlying<br />
CBD<br />
� �<br />
Mixed<br />
Urban<br />
� � �<br />
Suburban<br />
Rural<br />
� � � � �<br />
6
ESTIMATION OF VDFS<br />
• Inputs<br />
• <strong>Volume</strong> <strong>and</strong> Speed (simultaneous)<br />
• <strong>Volume</strong>/Capacity Ratio<br />
• Free Flow Speed<br />
• Results<br />
• VDF Form<br />
• Parameters<br />
7
ESTIMATION OF VDFS<br />
• <strong>Volume</strong> <strong>and</strong> Speed<br />
• Flows converted to hourly flows<br />
• <strong>Volume</strong>/Capacity Ratio<br />
• Based on density<br />
• <strong>Volume</strong> <strong>and</strong> speed used to calculate<br />
density<br />
• Capacity as density at maximum flow<br />
(HCM)<br />
• Free flow speed<br />
• Average speed with v/c < 0.50<br />
8
VDF FORMS AND PARAMETERS<br />
• BPR curve<br />
• Spiess conical function<br />
• IITPR (link delay portion only)<br />
• Akcelik<br />
• Existing MAG BPR – α = 0.10, β = 8.00<br />
• Traditional BPR – α = 0.15, β = 4.00<br />
• Revised trad’l BPR – α = 0.20, β = 10.00<br />
9
EVALUATION OF VDF CURVE FITS<br />
• R-Squared<br />
• RMSE<br />
• Visual examination <strong>and</strong> pr<strong>of</strong>essional<br />
judgment<br />
10
INITIAL ESTIMATION OF VDFS<br />
• Freeway – CBD<br />
VDF Form R-squared RMSE<br />
BPR 0.92 4.8%<br />
Spiess 0.91 5.7%<br />
IIT 0.92 5.2%<br />
Akcelik 0.89 6.7%<br />
MAG BPR 0.66 21.7%<br />
Trad BPR 0.88 13.7%<br />
Rev’d BPR 0.71 11.4%<br />
Observations = 7,457<br />
v/c ratio (based on density)<br />
α β<br />
BPR 0.87 4.83<br />
MAG BPR 0.10 8.00<br />
Trad BPR 0.15 4.00<br />
Rev’d BPR 0.20 10.00<br />
11
INITIAL ESTIMATION OF VDFS<br />
• HOV Lane – CBD<br />
VDF Form R-squared RMSE<br />
BPR 0.88 6.6%<br />
Spiess 0.89 7.7%<br />
IIT 0.87 7.0%<br />
Akcelik 0.87 9.1%<br />
MAG BPR 0.69 15.1%<br />
Trad BPR 0.82 13.6%<br />
Rev’d BPR 0.77 9.8%<br />
Observations = 6,113<br />
v/c ratio (based on density)<br />
α β<br />
BPR 0.74 4.21<br />
MAG BPR 0.10 8.00<br />
Trad BPR 0.15 4.00<br />
Rev’d BPR 0.20 10.00<br />
12
INITIAL ESTIMATION OF VDFS<br />
• Major Arterial – Outlying CBD<br />
VDF Form R-squared RMSE<br />
BPR 0.43 21.7%<br />
Spiess 0.40 22.0%<br />
IIT 0.38 22.4%<br />
Akcelik 0.39 22.3%<br />
MAG BPR 0.19 27.2%<br />
Trad BPR 0.23 25.1%<br />
Rev’d BPR 0.22 25.2%<br />
Observations = 2,914<br />
v/c ratio (based on density)<br />
α β<br />
BPR 1.13 2.64<br />
MAG BPR 0.10 6.00<br />
Trad BPR 0.15 4.00<br />
Rev’d BPR 0.20 10.00<br />
13
QUALITY DATA IS THE BASIS FOR SOUND<br />
VDF ESTIMATION<br />
• Comprehensive data collected in MAG<br />
region are used exclusively<br />
• <strong>Volume</strong> <strong>and</strong> Speed<br />
• Vehicle classification<br />
• GPS data<br />
• Roadway geometry<br />
14
DATA STRUCTURE<br />
15
MODEL IMPLEMENTATION AND VDF<br />
ESTIMATION<br />
• Free flow speeds from observed data<br />
sources<br />
• Newly estimated VDF <strong>for</strong>ms <strong>and</strong><br />
parameters<br />
• Roadway capacity based on HCM<br />
methodology<br />
16
VDF VALIDATION<br />
• Model (with new VDF) validation per<strong>for</strong>med<br />
iteratively during calibration <strong>and</strong> review<br />
• Current <strong>and</strong> future horizon year model results<br />
• <strong>Volume</strong>:<br />
• Individual link (R-squared, RMSE, etc)<br />
• Screenline/cutline<br />
• Corridor<br />
• Speed: by area type, facility type, time period<br />
from GPS travel time surveys<br />
• Sensitivity analysis on v/c, VMT, VHT, trip<br />
length<br />
17
VALIDATION (VOLUME)<br />
• Model<br />
volume<br />
validation<br />
slightly<br />
improved<br />
Serial ScreenLine<br />
Diff in % in 2-way ADT<br />
Existing<br />
Model<br />
Revised<br />
Model<br />
Absolute Diff in % in 2-way<br />
ADT<br />
Existing<br />
Model<br />
Revised<br />
Model<br />
1 South <strong>of</strong> I-10 5% -6% 5% 6%<br />
2 North <strong>of</strong> I-10 2% -13% 2% 13%<br />
3 E <strong>of</strong> I-17 13% 8% 13% 8%<br />
4 W <strong>of</strong> I-17 14% -4% 14% 4%<br />
5 River W 3% 5% 3% 5%<br />
6 River P 2% -9% 2% 9%<br />
7 N <strong>of</strong> Glendale 3% -8% 3% 8%<br />
8 W <strong>of</strong> Scottsdale 3% -9% 3% 9%<br />
9 S <strong>of</strong> US 60 1% -13% 1% 13%<br />
10 N <strong>of</strong> US 60 2% -11% 2% 11%<br />
11 Out CBD 2% 0% 2% 0%<br />
12 West <strong>of</strong> L101 0% -15% 0% 15%<br />
13 East <strong>of</strong> L101 5% -12% 5% 12%<br />
14 S <strong>of</strong> L202 57% 34% 57% 34%<br />
15 N <strong>of</strong> L202 22% 4% 22% 4%<br />
Subtotal 8.9% -3.1% 9% 9.9%<br />
18
VALIDATION – SPEED<br />
• Model<br />
speed<br />
validation<br />
greatly<br />
improved<br />
Avg Speed (mph)<br />
65<br />
55<br />
45<br />
35<br />
25<br />
Freeway Arterial Freeway Arterial Freeway Arterial<br />
AM MD PM<br />
19<br />
Existing Model<br />
Revised Model<br />
Field Observed
FUTURE WORK<br />
• New Data<br />
• Recalibrate VDF with continuous arterial<br />
data with ideal quality <strong>and</strong> coverage<br />
• New speed data (private sector) as new<br />
source<br />
• Possible model improvement<br />
• Impact on trip length due to change <strong>of</strong> travel<br />
time (speed <strong>and</strong> distance)<br />
• Explicitly modeling intersection control delay<br />
• Link-specific capacity estimation<br />
20
CONCLUSIONS<br />
• Improvement <strong>of</strong> model speeds<br />
• Parameter values <strong>for</strong> VDFs vary<br />
significantly by facility type<br />
• Comprehensive data set key to the ef<strong>for</strong>t<br />
21
THANK YOU!<br />
QUESTIONS OR COMMENTS?<br />
22


![ALPR CAMERA [Read-Only] [Compatibility Mode]](https://img.yumpu.com/3361879/1/190x135/alpr-camera-read-only-compatibility-mode.jpg?quality=85)